
{
	"@context": "https://project-open-data.cio.gov/v1.1/schema/catalog.jsonld",
	"@type": "dcat:Catalog",
	"conformsTo": "https://project-open-data.cio.gov/v1.1/schema",
	"describedBy": "https://project-open-data.cio.gov/v1.1/schema/catalog.json",
	"dataset": [
		{
			"@type": "dcat:Dataset",
			"identifier": "https://www.arcgis.com/home/item.html?id=f6bedeb7332f4a19a08eb58941040af9&sublayer=0",
			"landingPage": "https://www.pacificgeoportal.com/datasets/eaglegis::nz-ward-boundaries-2019-mature-support",
			"title": "NZ Ward boundaries 2019 (Mature Support)",
			"description": "<font size='3'><b><span style='color:firebrick;'>Important Note:</span></b><b> This item is in<span style='color:#C00000;'> mature support</span> as of January 2024 and will retire in January 2025.</b><b><span> When you need the most recent boundary layer please use <a href='https://www.arcgis.com/home/item.html?id=030d32f649c94ab8959215951c03fbca' rel='nofollow ugc'>this item</a>. When you need the boundaries for a specific year, please use <a href='https://www.arcgis.com/home/item.html?id=31b3469be5c4445c93f11e7ec02d78a6' rel='nofollow ugc'>this item</a> and set a filter on the required year.</span></b><br /><br /></font><div><font size='3' style='font-family: \"Avenir Next W01\", \"Avenir Next W00\", \"Avenir Next\", Avenir, \"Helvetica Neue\", Helvetica, Arial, sans-serif !important;'>Topicality: 01-01-2019</font><div style=''><font face='Avenir Next W01, Avenir Next W00, Avenir Next, Avenir, Helvetica Neue, Helvetica, Arial, sans-serif' style='font-family: \"Avenir Next W01\", \"Avenir Next W00\", \"Avenir Next\", Avenir, \"Helvetica Neue\", Helvetica, Arial, sans-serif !important; font-size: 17px;'><span style='font-size: 17px;'>Projection: New Zealand Transverse Mercator (NZTM)</span><br /></font><div style='font-family: \"Avenir Next W01\", \"Avenir Next W00\", \"Avenir Next\", Avenir, \"Helvetica Neue\", Helvetica, Arial, sans-serif !important; font-size: 17px;'><font size='3'><br /></font></div><div style='font-family: \"Avenir Next W01\", \"Avenir Next W00\", \"Avenir Next\", Avenir, \"Helvetica Neue\", Helvetica, Arial, sans-serif !important; font-size: 17px;'><font size='3'><font face='Avenir Next W01, Avenir Next W00, Avenir Next, Avenir, Helvetica Neue, Helvetica, Arial, sans-serif'>This layer is based on the </font>definitive set of </font><span style='font-family: \"Avenir Next W01\", \"Avenir Next W00\", \"Avenir Next\", Avenir, \"Helvetica Neue\", sans-serif;'>Ward boundaries</span><font size='3'> for 2019 as defined by the regional councils and Local Government Commission but maintained by Stats NZ (the custodian).</font></div><div style='font-family: \"Avenir Next W01\", \"Avenir Next W00\", \"Avenir Next\", Avenir, \"Helvetica Neue\", Helvetica, Arial, sans-serif !important; font-size: 17px;'><font size='3'><br /></font></div><div style=''><font size='3' style=''><font face='Avenir Next W01, Avenir Next W00, Avenir Next, Avenir, Helvetica Neue, Helvetica, Arial, sans-serif'>Wards were originally set up within any territorial authority with a population of at least 20,000. Wards are defined under the Local Electoral Act 2001 and result from dividing a territorial authority for electoral purposes. The ward system was designed to allow for the recognition of communities within a territorial authority and to increase community involvement in the local government system.</font><br /></font></div><div style=''><font size='3' style=''><font face='Avenir Next W01, Avenir Next W00, Avenir Next, Avenir, Helvetica Neue, Helvetica, Arial, sans-serif'><br /></font></font></div><div style=''><font size='3' style=''><font face='Avenir Next W01, Avenir Next W00, Avenir Next, Avenir, Helvetica Neue, Helvetica, Arial, sans-serif'>Territorial authorities can now choose whether they would like to maintain electoral wards. As a result, the number of wards has steadily decreased since they were first created in 1989. Ward boundaries are reviewed in the year before the three-yearly local government elections.</font><br /></font></div><div style=''><font size='3' style=''><font face='Avenir Next W01, Avenir Next W00, Avenir Next, Avenir, Helvetica Neue, Helvetica, Arial, sans-serif'><br /></font></font></div><div style=''><font size='3' style='font-family: \"Avenir Next W01\", \"Avenir Next W00\", \"Avenir Next\", Avenir, \"Helvetica Neue\", Helvetica, Arial, sans-serif;'>The official dataset can be found on<font face='Avenir Next W01, Avenir Next W00, Avenir Next, Avenir, Helvetica Neue, Helvetica, Arial, sans-serif'> </font></font><a href='https://datafinder.stats.govt.nz/layer/98740-ward-2019-clipped-generalised/' target='_blank' rel='nofollow ugc noopener noreferrer'>https://datafinder.stats.govt.nz.</a><br /></div><div style=''><div style='font-family: \"Avenir Next W01\", \"Avenir Next W00\", \"Avenir Next\", Avenir, \"Helvetica Neue\", Helvetica, Arial, sans-serif; font-size: 17px;'><br /></div></div><div style=''><div style='font-family: \"Avenir Next W01\", \"Avenir Next W00\", \"Avenir Next\", Avenir, \"Helvetica Neue\", Helvetica, Arial, sans-serif; font-size: 17px;'><div><font size='3'>This layer contains the following attributes (see data tab):</font></div><div><ul><li><font size='3'>Ward code</font></li><li><font size='3'>Ward name</font></li><li><font size='3'>Total area in square kilometers</font></li><li><font size='3'>Total land area in square kilometers.</font></li></ul><div><font size='3'>The layer is further generalised by Eagle Technology for improved performance on the web, <span style='font-family: \"Avenir Next W01\", \"Avenir Next W00\", \"Avenir Next\", Avenir, \"Helvetica Neue\", sans-serif;'>therefore it doesn't fully represent the official boundaries.</span><br /></font></div></div></div><div style='font-family: \"Avenir Next W01\", \"Avenir Next W00\", \"Avenir Next\", Avenir, \"Helvetica Neue\", Helvetica, Arial, sans-serif; font-size: 17px;'><font size='3'><br /></font></div><div style='font-family: \"Avenir Next W01\", \"Avenir Next W00\", \"Avenir Next\", Avenir, \"Helvetica Neue\", Helvetica, Arial, sans-serif; font-size: 17px;'><div><font color='#2f4f4f' size='3'>This layer is offered by Eagle Technology (Official Esri Distributor). Eagle Technology offers services that can be used in the ArcGIS platform. The Content team at Eagle Technology updates the layers on a regular basis and regularly adds new content to the Living Atlas. By using this content and combining it with other data you can create new information products quickly and easily.</font></div><div><font color='#2f4f4f' size='3'><br /></font></div><div><font size='3'><font color='#2f4f4f'>If you have any questions or comments about the content, please let us now  at </font><a href='mailto:livingatlas@eagle.co.nz.' style='color: rgb(0, 121, 193); text-decoration-line: none;' target='_blank' rel='nofollow ugc noopener noreferrer'>livingatlas@eagle.co.nz</a></font></div></div></div></div></div>",
			"keyword": [
				"eaglegis",
				"mature support",
				"retiring",
				"deprecated"
			],
			"issued": "2018-12-21T13:03:24.000Z",
			"modified": "2020-01-13T02:18:32.627Z",
			"publisher": {
				"name": "Eagle Technology Group Ltd"
			},
			"contactPoint": {
				"@type": "vcard:Contact",
				"fn": "eaglegis",
				"hasEmail": "mailto:ts@eaglegis.co.nz"
			},
			"accessLevel": "public",
			"spatial": "166.2620,-47.2230,-177.6196,-33.7735",
			"license": "https://creativecommons.org/licenses/by/4.0",
			"distribution": [
				{
					"@type": "dcat:Distribution",
					"title": "ArcGIS Hub Dataset",
					"format": "Web Page",
					"mediaType": "text/html",
					"accessURL": "https://www.pacificgeoportal.com/datasets/eaglegis::nz-ward-boundaries-2019-mature-support"
				},
				{
					"@type": "dcat:Distribution",
					"title": "ArcGIS GeoService",
					"format": "ArcGIS GeoServices REST API",
					"mediaType": "application/json",
					"accessURL": "https://services.arcgis.com/XTtANUDT8Va4DLwI/arcgis/rest/services/Ward_2019_generalised/FeatureServer/0"
				},
				{
					"@type": "dcat:Distribution",
					"title": "CSV",
					"format": "CSV",
					"mediaType": "text/csv",
					"accessURL": "https://www.pacificgeoportal.com/api/download/v1/items/f6bedeb7332f4a19a08eb58941040af9/csv?layers=0"
				},
				{
					"@type": "dcat:Distribution",
					"title": "Shapefile",
					"format": "ZIP",
					"mediaType": "application/zip",
					"accessURL": "https://www.pacificgeoportal.com/api/download/v1/items/f6bedeb7332f4a19a08eb58941040af9/shapefile?layers=0"
				},
				{
					"@type": "dcat:Distribution",
					"title": "GeoJSON",
					"format": "GeoJSON",
					"mediaType": "application/vnd.geo+json",
					"accessURL": "https://www.pacificgeoportal.com/api/download/v1/items/f6bedeb7332f4a19a08eb58941040af9/geojson?layers=0"
				},
				{
					"@type": "dcat:Distribution",
					"title": "KML",
					"format": "KML",
					"mediaType": "application/vnd.google-earth.kml+xml",
					"accessURL": "https://www.pacificgeoportal.com/api/download/v1/items/f6bedeb7332f4a19a08eb58941040af9/kml?layers=0"
				}
			],
			"theme": [
				"geospatial"
			]
		},
		{
			"@type": "dcat:Dataset",
			"identifier": "https://www.arcgis.com/home/item.html?id=c1b9a93eaa054144a10b39d954b6c6d1&sublayer=0",
			"landingPage": "https://www.pacificgeoportal.com/datasets/eaglegis::nz-ward-boundaries-2018-mature-support",
			"title": "NZ Ward boundaries 2018 (Mature Support)",
			"description": "<font size='3'><b><span style='color:firebrick;'>Important Note:</span></b><b> This item is in<span style='color:#C00000;'> mature support</span> as of January 2024 and will retire in January 2025.</b><b><span> When you need the most recent boundary layer please use <a href='https://www.arcgis.com/home/item.html?id=030d32f649c94ab8959215951c03fbca' rel='nofollow ugc'>this item</a>. When you need the boundaries for a specific year, please use <a href='https://www.arcgis.com/home/item.html?id=31b3469be5c4445c93f11e7ec02d78a6' rel='nofollow ugc'>this item</a> and set a filter on the required year.</span></b><br /><br /></font><div><font size='3' style='font-family: \"Avenir Next W01\", \"Avenir Next W00\", \"Avenir Next\", Avenir, \"Helvetica Neue\", Helvetica, Arial, sans-serif !important;'>Topicality: 01-01-2018</font><div style=''><font face='Avenir Next W01, Avenir Next W00, Avenir Next, Avenir, Helvetica Neue, Helvetica, Arial, sans-serif' style='font-family: \"Avenir Next W01\", \"Avenir Next W00\", \"Avenir Next\", Avenir, \"Helvetica Neue\", Helvetica, Arial, sans-serif !important; font-size: 17px;'><span style='font-size: 17px;'>Projection: New Zealand Transverse Mercator (NZTM)</span><br /></font><div style='font-family: \"Avenir Next W01\", \"Avenir Next W00\", \"Avenir Next\", Avenir, \"Helvetica Neue\", Helvetica, Arial, sans-serif !important; font-size: 17px;'><font size='3'><br /></font></div><div style='font-family: \"Avenir Next W01\", \"Avenir Next W00\", \"Avenir Next\", Avenir, \"Helvetica Neue\", Helvetica, Arial, sans-serif !important; font-size: 17px;'><font size='3'><font face='Avenir Next W01, Avenir Next W00, Avenir Next, Avenir, Helvetica Neue, Helvetica, Arial, sans-serif'>This layer is based on the </font>definitive set of </font><span style='font-family: \"Avenir Next W01\", \"Avenir Next W00\", \"Avenir Next\", Avenir, \"Helvetica Neue\", sans-serif;'>Ward boundaries</span><font size='3'> for 2018 as defined by the regional councils and Local Government Commission but maintained by Stats NZ (the custodian).</font></div><div style='font-family: \"Avenir Next W01\", \"Avenir Next W00\", \"Avenir Next\", Avenir, \"Helvetica Neue\", Helvetica, Arial, sans-serif !important; font-size: 17px;'><font size='3'><br /></font></div><div style=''><font size='3' style=''><font face='Avenir Next W01, Avenir Next W00, Avenir Next, Avenir, Helvetica Neue, Helvetica, Arial, sans-serif'>Wards were originally set up within any territorial authority with a population of at least 20,000. Wards are defined under the Local Electoral Act 2001 and result from dividing a territorial authority for electoral purposes. The ward system was designed to allow for the recognition of communities within a territorial authority and to increase community involvement in the local government system.</font><br /></font></div><div style=''><font size='3' style=''><font face='Avenir Next W01, Avenir Next W00, Avenir Next, Avenir, Helvetica Neue, Helvetica, Arial, sans-serif'><br /></font></font></div><div style=''><font size='3' style=''><font face='Avenir Next W01, Avenir Next W00, Avenir Next, Avenir, Helvetica Neue, Helvetica, Arial, sans-serif'>Territorial authorities can now choose whether they would like to maintain electoral wards. As a result, the number of wards has steadily decreased since they were first created in 1989. Ward boundaries are reviewed in the year before the three-yearly local government elections.</font><br /></font></div><div style=''><font size='3' style=''><font face='Avenir Next W01, Avenir Next W00, Avenir Next, Avenir, Helvetica Neue, Helvetica, Arial, sans-serif'><br /></font></font></div><div style=''><font size='3' style='font-family: \"Avenir Next W01\", \"Avenir Next W00\", \"Avenir Next\", Avenir, \"Helvetica Neue\", Helvetica, Arial, sans-serif;'>The official dataset can be found on<font face='Avenir Next W01, Avenir Next W00, Avenir Next, Avenir, Helvetica Neue, Helvetica, Arial, sans-serif'> </font></font><a href='https://datafinder.stats.govt.nz/layer/92220-ward-2019-clipped-generalised/' target='_blank' rel='nofollow ugc noopener noreferrer'>https://datafinder.stats.govt.nz.</a><br /></div><div style=''><div style='font-family: \"Avenir Next W01\", \"Avenir Next W00\", \"Avenir Next\", Avenir, \"Helvetica Neue\", Helvetica, Arial, sans-serif; font-size: 17px;'><br /></div></div><div style=''><div style='font-family: \"Avenir Next W01\", \"Avenir Next W00\", \"Avenir Next\", Avenir, \"Helvetica Neue\", Helvetica, Arial, sans-serif; font-size: 17px;'><div><font size='3'>This layer contains the following attributes (see data tab):</font></div><div><ul><li><font size='3'>Ward code</font></li><li><font size='3'>Ward name</font></li><li><font size='3'>Total area in square kilometers</font></li><li><font size='3'>Total land area in square kilometers.</font></li></ul><div><font size='3'>The layer is further generalised by Eagle Technology for improved performance on the web, <span style='font-family: \"Avenir Next W01\", \"Avenir Next W00\", \"Avenir Next\", Avenir, \"Helvetica Neue\", sans-serif;'>therefore it doesn't fully represent the official boundaries.</span><br /></font></div></div></div><div style='font-family: \"Avenir Next W01\", \"Avenir Next W00\", \"Avenir Next\", Avenir, \"Helvetica Neue\", Helvetica, Arial, sans-serif; font-size: 17px;'><font size='3'><br /></font></div><div style='font-family: \"Avenir Next W01\", \"Avenir Next W00\", \"Avenir Next\", Avenir, \"Helvetica Neue\", Helvetica, Arial, sans-serif; font-size: 17px;'><div><font color='#2f4f4f' size='3'>This layer is offered by Eagle Technology (Official Esri Distributor). Eagle Technology offers services that can be used in the ArcGIS platform. The Content team at Eagle Technology updates the layers on a regular basis and regularly adds new content to the Living Atlas. By using this content and combining it with other data you can create new information products quickly and easily.</font></div><div><font color='#2f4f4f' size='3'><br /></font></div><div><font size='3'><font color='#2f4f4f'>If you have any questions or comments about the content, please let us now  at </font><a href='mailto:livingatlas@eagle.co.nz.' style='color: rgb(0, 121, 193); text-decoration-line: none;' target='_blank' rel='nofollow ugc noopener noreferrer'>livingatlas@eagle.co.nz</a></font></div></div></div></div></div>",
			"keyword": [
				"eaglegis",
				"mature support",
				"retiring",
				"deprecated"
			],
			"issued": "2018-09-13T23:54:46.000Z",
			"modified": "2018-09-13T23:55:21.939Z",
			"publisher": {
				"name": "Eagle Technology Group Ltd"
			},
			"contactPoint": {
				"@type": "vcard:Contact",
				"fn": "eaglegis",
				"hasEmail": "mailto:ts@eaglegis.co.nz"
			},
			"accessLevel": "public",
			"spatial": "166.2620,-47.2230,-177.6196,-33.7735",
			"license": "https://creativecommons.org/licenses/by/4.0",
			"distribution": [
				{
					"@type": "dcat:Distribution",
					"title": "ArcGIS Hub Dataset",
					"format": "Web Page",
					"mediaType": "text/html",
					"accessURL": "https://www.pacificgeoportal.com/datasets/eaglegis::nz-ward-boundaries-2018-mature-support"
				},
				{
					"@type": "dcat:Distribution",
					"title": "ArcGIS GeoService",
					"format": "ArcGIS GeoServices REST API",
					"mediaType": "application/json",
					"accessURL": "https://services.arcgis.com/XTtANUDT8Va4DLwI/arcgis/rest/services/NZ_Ward_boundaries_2018_generalised/FeatureServer/0"
				},
				{
					"@type": "dcat:Distribution",
					"title": "CSV",
					"format": "CSV",
					"mediaType": "text/csv",
					"accessURL": "https://www.pacificgeoportal.com/api/download/v1/items/c1b9a93eaa054144a10b39d954b6c6d1/csv?layers=0"
				},
				{
					"@type": "dcat:Distribution",
					"title": "Shapefile",
					"format": "ZIP",
					"mediaType": "application/zip",
					"accessURL": "https://www.pacificgeoportal.com/api/download/v1/items/c1b9a93eaa054144a10b39d954b6c6d1/shapefile?layers=0"
				},
				{
					"@type": "dcat:Distribution",
					"title": "GeoJSON",
					"format": "GeoJSON",
					"mediaType": "application/vnd.geo+json",
					"accessURL": "https://www.pacificgeoportal.com/api/download/v1/items/c1b9a93eaa054144a10b39d954b6c6d1/geojson?layers=0"
				},
				{
					"@type": "dcat:Distribution",
					"title": "KML",
					"format": "KML",
					"mediaType": "application/vnd.google-earth.kml+xml",
					"accessURL": "https://www.pacificgeoportal.com/api/download/v1/items/c1b9a93eaa054144a10b39d954b6c6d1/kml?layers=0"
				},
				{
					"@type": "dcat:Distribution",
					"title": "File Geodatabase",
					"format": "ZIP",
					"mediaType": "application/zip",
					"accessURL": "https://www.pacificgeoportal.com/api/download/v1/items/c1b9a93eaa054144a10b39d954b6c6d1/filegdb?layers=0"
				},
				{
					"@type": "dcat:Distribution",
					"title": "Feature Collection",
					"format": "TXT",
					"mediaType": "text/plain",
					"accessURL": "https://www.pacificgeoportal.com/api/download/v1/items/c1b9a93eaa054144a10b39d954b6c6d1/featureCollection?layers=0"
				},
				{
					"@type": "dcat:Distribution",
					"title": "Excel",
					"format": "XLSX",
					"mediaType": "application/vnd.ms-excel",
					"accessURL": "https://www.pacificgeoportal.com/api/download/v1/items/c1b9a93eaa054144a10b39d954b6c6d1/excel?layers=0"
				},
				{
					"@type": "dcat:Distribution",
					"title": "GeoPackage",
					"format": "GPKG",
					"mediaType": "application/geopackage+sqlite3",
					"accessURL": "https://www.pacificgeoportal.com/api/download/v1/items/c1b9a93eaa054144a10b39d954b6c6d1/geoPackage?layers=0"
				},
				{
					"@type": "dcat:Distribution",
					"title": "SQLite Geodatabase",
					"format": "GDB",
					"mediaType": "application/geopackage+sqlite3",
					"accessURL": "https://www.pacificgeoportal.com/api/download/v1/items/c1b9a93eaa054144a10b39d954b6c6d1/sqlite?layers=0"
				}
			],
			"theme": [
				"geospatial"
			]
		},
		{
			"@type": "dcat:Dataset",
			"identifier": "https://www.arcgis.com/home/item.html?id=95c66a06d3f8484f8f012b858736a20f",
			"landingPage": "https://www.pacificgeoportal.com/apps/pacificcore::sea-level-rise-in-pacific-islands-",
			"title": "Sea Level Rise in Pacific Islands ",
			"description": "<p></p><p>\"Sea levels in the South-West Pacific are rising faster than the global average, threatening low-lying islands while heat damages marine ecosystems\" - U.N. meteorological agency.</p><p>In its State of the Climate in the South-West Pacific 2022 report, the World Meteorological Organization (WMO) said water levels were rising about 4 mm per year in some areas, slightly above the global mean rate.</p>",
			"keyword": [
				"pgp"
			],
			"issued": "2023-10-03T21:25:15.000Z",
			"modified": "2023-11-15T00:55:51.000Z",
			"publisher": {
				"name": "Pacific GeoPortal - Core Organization"
			},
			"contactPoint": {
				"@type": "vcard:Contact",
				"fn": "dkaragulle_pacificcore",
				"hasEmail": "mailto:pacific_geoportal@esri.com"
			},
			"accessLevel": "public",
			"spatial": "",
			"license": "",
			"distribution": [
				{
					"@type": "dcat:Distribution",
					"title": "ArcGIS Hub Dataset",
					"format": "Web Page",
					"mediaType": "text/html",
					"accessURL": "https://www.pacificgeoportal.com/apps/pacificcore::sea-level-rise-in-pacific-islands-"
				},
				{
					"@type": "dcat:Distribution",
					"title": "ArcGIS GeoService",
					"format": "ArcGIS GeoServices REST API",
					"mediaType": "application/json",
					"accessURL": "https://storymaps.arcgis.com/stories/95c66a06d3f8484f8f012b858736a20f"
				}
			],
			"theme": ""
		},
		{
			"@type": "dcat:Dataset",
			"identifier": "https://www.arcgis.com/home/item.html?id=ee962cdda2044567b7a8ae6a0e695a07",
			"landingPage": "https://www.pacificgeoportal.com/apps/pacificcore::dep-coast-lines-for-pacific-region",
			"title": "DEP Coast Lines for Pacific Region",
			"description": "<p>The map below features coast lines in Tuvalu, Funafuti 2014 (left) vs 2023 (right). You can click on coast lines to get a pop-up and see the date for each of them.</p>",
			"keyword": [
				"pgp"
			],
			"issued": "2023-10-18T18:46:58.000Z",
			"modified": "2023-11-15T00:55:43.000Z",
			"publisher": {
				"name": "Pacific GeoPortal - Core Organization"
			},
			"contactPoint": {
				"@type": "vcard:Contact",
				"fn": "dkaragulle_pacificcore",
				"hasEmail": "mailto:pacific_geoportal@esri.com"
			},
			"accessLevel": "public",
			"spatial": "",
			"license": "",
			"distribution": [
				{
					"@type": "dcat:Distribution",
					"title": "ArcGIS Hub Dataset",
					"format": "Web Page",
					"mediaType": "text/html",
					"accessURL": "https://www.pacificgeoportal.com/apps/pacificcore::dep-coast-lines-for-pacific-region"
				},
				{
					"@type": "dcat:Distribution",
					"title": "ArcGIS GeoService",
					"format": "ArcGIS GeoServices REST API",
					"mediaType": "application/json",
					"accessURL": "https://storymaps.arcgis.com/stories/ee962cdda2044567b7a8ae6a0e695a07"
				}
			],
			"theme": ""
		},
		{
			"@type": "dcat:Dataset",
			"identifier": "https://www.arcgis.com/home/item.html?id=1b96c604c64545379ad8f39c68ce3a11",
			"landingPage": "https://www.pacificgeoportal.com/apps/pacificcore::pacific-region-demographics",
			"title": "Pacific Region Demographics",
			"description": "<p>The provinces of Papua New Guinea have been enriched with demographic data from Esri's <a href='https://www.esri.com/en-us/arcgis/products/arcgis-platform/services/geoenrichment' target='_blank' rel='nofollow ugc noopener noreferrer'>GeoEnrichment Service</a></p>",
			"keyword": [
				"pgp"
			],
			"issued": "2023-10-03T02:58:55.000Z",
			"modified": "2023-11-15T00:55:05.000Z",
			"publisher": {
				"name": "Pacific GeoPortal - Core Organization"
			},
			"contactPoint": {
				"@type": "vcard:Contact",
				"fn": "klevy_pacificcore",
				"hasEmail": "mailto:pacific_geoportal@esri.com"
			},
			"accessLevel": "public",
			"spatial": "",
			"license": "",
			"distribution": [
				{
					"@type": "dcat:Distribution",
					"title": "ArcGIS Hub Dataset",
					"format": "Web Page",
					"mediaType": "text/html",
					"accessURL": "https://www.pacificgeoportal.com/apps/pacificcore::pacific-region-demographics"
				},
				{
					"@type": "dcat:Distribution",
					"title": "ArcGIS GeoService",
					"format": "ArcGIS GeoServices REST API",
					"mediaType": "application/json",
					"accessURL": "https://storymaps.arcgis.com/stories/1b96c604c64545379ad8f39c68ce3a11"
				}
			],
			"theme": ""
		},
		{
			"@type": "dcat:Dataset",
			"identifier": "https://www.arcgis.com/home/item.html?id=d2a9a0f7ad794ef9a2ddf2f508f70cdc",
			"landingPage": "https://www.pacificgeoportal.com/apps/pacificcore::destruction-of-fiji-island-reef-due-to-coastal-development-",
			"title": "Destruction of Fiji Island Reef due to Coastal Development ",
			"description": "<p>Illegal dredging of channels and clearing of reef benthic ecosystems by property developers in Malolo in Fiji was the source of a huge court case in Fiji in 2022 (ABC, 2022).  </p><p>In order to provide robust scientific evidence that could stand up in court, earth observation imagery was provided through Digital Earth Pacific. This data helped measure the impacts of the dredging and clearing on the surrounding ecosystems. This kind of data was taken into consideration into the final judgement of the High Court of Fiji. As a result, the company that dug a channel through mangroves and a coral reef to provide access to a multi-million-dollar resort and casino development on a Fijian island has been fined $FJ1 million ($650,000) by the High Court in Suva.  </p>",
			"keyword": [
				"pgp"
			],
			"issued": "2023-10-17T04:25:04.000Z",
			"modified": "2023-11-15T00:54:32.000Z",
			"publisher": {
				"name": "Pacific GeoPortal - Core Organization"
			},
			"contactPoint": {
				"@type": "vcard:Contact",
				"fn": "klevy_pacificcore",
				"hasEmail": "mailto:pacific_geoportal@esri.com"
			},
			"accessLevel": "public",
			"spatial": "",
			"license": "",
			"distribution": [
				{
					"@type": "dcat:Distribution",
					"title": "ArcGIS Hub Dataset",
					"format": "Web Page",
					"mediaType": "text/html",
					"accessURL": "https://www.pacificgeoportal.com/apps/pacificcore::destruction-of-fiji-island-reef-due-to-coastal-development-"
				},
				{
					"@type": "dcat:Distribution",
					"title": "ArcGIS GeoService",
					"format": "ArcGIS GeoServices REST API",
					"mediaType": "application/json",
					"accessURL": "https://storymaps.arcgis.com/stories/d2a9a0f7ad794ef9a2ddf2f508f70cdc"
				}
			],
			"theme": ""
		},
		{
			"@type": "dcat:Dataset",
			"identifier": "https://www.arcgis.com/home/item.html?id=f3c908c1f0064adabadc1e5094535280",
			"landingPage": "https://www.pacificgeoportal.com/maps/pacificcore::cyclone-winston-mangrove-damage-landsat-8-comparison-1",
			"title": "Cyclone Winston Mangrove Damage - Landsat-8 Comparison",
			"description": "",
			"keyword": [
				"mangrove",
				"fiji",
				"pacific",
				"geoportal",
				"landsat",
				"cyclone",
				"pgp"
			],
			"issued": "2023-10-19T09:29:14.000Z",
			"modified": "2023-11-15T00:54:26.000Z",
			"publisher": {
				"name": "Pacific GeoPortal - Core Organization"
			},
			"contactPoint": {
				"@type": "vcard:Contact",
				"fn": "klevy_pacificcore",
				"hasEmail": "mailto:pacific_geoportal@esri.com"
			},
			"accessLevel": "public",
			"spatial": "178.1953,-17.5199,178.3041,-17.4446",
			"license": "",
			"distribution": [
				{
					"@type": "dcat:Distribution",
					"title": "ArcGIS Hub Dataset",
					"format": "Web Page",
					"mediaType": "text/html",
					"accessURL": "https://www.pacificgeoportal.com/maps/pacificcore::cyclone-winston-mangrove-damage-landsat-8-comparison-1"
				}
			],
			"theme": [
				"geospatial"
			]
		},
		{
			"@type": "dcat:Dataset",
			"identifier": "https://www.arcgis.com/home/item.html?id=20f24a2c3fb04d95a4038bc9f4fb96da",
			"landingPage": "https://www.pacificgeoportal.com/apps/pacificcore::cyclone-winston-mangrove-damage-wayback-comparison",
			"title": "Cyclone Winston Mangrove Damage Wayback Comparison",
			"description": "",
			"keyword": [
				"wayback; Fiji; Cyclone; Winston",
				"wayback; Fiji; Cyclone; Winston",
				"pgp"
			],
			"issued": "2023-10-19T08:56:03.000Z",
			"modified": "2023-11-15T00:54:16.000Z",
			"publisher": {
				"name": "Pacific GeoPortal - Core Organization"
			},
			"contactPoint": {
				"@type": "vcard:Contact",
				"fn": "klevy_pacificcore",
				"hasEmail": "mailto:pacific_geoportal@esri.com"
			},
			"accessLevel": "public",
			"spatial": "",
			"license": "",
			"distribution": [
				{
					"@type": "dcat:Distribution",
					"title": "ArcGIS Hub Dataset",
					"format": "Web Page",
					"mediaType": "text/html",
					"accessURL": "https://www.pacificgeoportal.com/apps/pacificcore::cyclone-winston-mangrove-damage-wayback-comparison"
				},
				{
					"@type": "dcat:Distribution",
					"title": "ArcGIS GeoService",
					"format": "ArcGIS GeoServices REST API",
					"mediaType": "application/json",
					"accessURL": "https://pacificcore.maps.arcgis.com/apps/instant/media/index.html?appid=20f24a2c3fb04d95a4038bc9f4fb96da"
				}
			],
			"theme": ""
		},
		{
			"@type": "dcat:Dataset",
			"identifier": "https://www.arcgis.com/home/item.html?id=65642511c0dd44fe82aa237f837627e0",
			"landingPage": "https://www.pacificgeoportal.com/apps/pacificcore::cyclone-winston-mangrove-damage-landsat-8-comparison",
			"title": "Cyclone Winston Mangrove Damage - Landsat-8 Comparison",
			"description": "",
			"keyword": [
				"mangrove",
				"fiji",
				"pacific",
				"geoportal",
				"landsat",
				"cyclone",
				"mangrove",
				"fiji",
				"pacific",
				"geoportal",
				"landsat",
				"cyclone",
				"pgp"
			],
			"issued": "2023-10-19T10:11:37.000Z",
			"modified": "2023-11-15T00:53:57.000Z",
			"publisher": {
				"name": "Pacific GeoPortal - Core Organization"
			},
			"contactPoint": {
				"@type": "vcard:Contact",
				"fn": "klevy_pacificcore",
				"hasEmail": "mailto:pacific_geoportal@esri.com"
			},
			"accessLevel": "public",
			"spatial": "",
			"license": "",
			"distribution": [
				{
					"@type": "dcat:Distribution",
					"title": "ArcGIS Hub Dataset",
					"format": "Web Page",
					"mediaType": "text/html",
					"accessURL": "https://www.pacificgeoportal.com/apps/pacificcore::cyclone-winston-mangrove-damage-landsat-8-comparison"
				},
				{
					"@type": "dcat:Distribution",
					"title": "ArcGIS GeoService",
					"format": "ArcGIS GeoServices REST API",
					"mediaType": "application/json",
					"accessURL": "https://pacificcore.maps.arcgis.com/apps/instant/media/index.html?appid=65642511c0dd44fe82aa237f837627e0"
				}
			],
			"theme": ""
		},
		{
			"@type": "dcat:Dataset",
			"identifier": "https://www.arcgis.com/home/item.html?id=36ae3a3a85ed418fb456bfa45ec20deb&sublayer=0",
			"landingPage": "https://www.pacificgeoportal.com/datasets/kiwirail::kiwirail-electrified-network",
			"title": "KiwiRail Electrified Network",
			"description": "<p>KiwiRail Electrified Network identifies the extents of the electrified railway network in New Zealand.</p><p>Polylines may not match the exact track centreline (<a href='https://arcg.is/1unSWu' target='_blank' rel='nofollow ugc noopener noreferrer'>KiwiRail Track Centreline</a>).</p><p>Supplied as ESRI Feature Service (polyline) in NZTM.</p>",
			"keyword": [
				"KiwiRail",
				"electrification",
				"electrified rail network",
				"NZ",
				"New Zealand",
				"Electrified",
				"Rail",
				"Network",
				"Track"
			],
			"issued": "2018-08-14T03:03:41.000Z",
			"modified": "2023-06-27T04:08:32.874Z",
			"publisher": {
				"name": "KiwiRail"
			},
			"contactPoint": {
				"@type": "vcard:Contact",
				"fn": "gis.support@kiwirail.co.nz",
				"hasEmail": "mailto:gis.support@kiwirail.co.nz"
			},
			"accessLevel": "public",
			"spatial": "174.5750,-41.2806,175.9095,-36.8259",
			"license": "https://creativecommons.org/licenses/by/4.0",
			"distribution": [
				{
					"@type": "dcat:Distribution",
					"title": "ArcGIS Hub Dataset",
					"format": "Web Page",
					"mediaType": "text/html",
					"accessURL": "https://www.pacificgeoportal.com/datasets/kiwirail::kiwirail-electrified-network"
				},
				{
					"@type": "dcat:Distribution",
					"title": "ArcGIS GeoService",
					"format": "ArcGIS GeoServices REST API",
					"mediaType": "application/json",
					"accessURL": "https://services6.arcgis.com/eqX2HMCD3H8MUs6Q/arcgis/rest/services/KiwiRailElectrification/FeatureServer/0"
				},
				{
					"@type": "dcat:Distribution",
					"title": "CSV",
					"format": "CSV",
					"mediaType": "text/csv",
					"accessURL": "https://www.pacificgeoportal.com/api/download/v1/items/36ae3a3a85ed418fb456bfa45ec20deb/csv?layers=0"
				},
				{
					"@type": "dcat:Distribution",
					"title": "Shapefile",
					"format": "ZIP",
					"mediaType": "application/zip",
					"accessURL": "https://www.pacificgeoportal.com/api/download/v1/items/36ae3a3a85ed418fb456bfa45ec20deb/shapefile?layers=0"
				},
				{
					"@type": "dcat:Distribution",
					"title": "GeoJSON",
					"format": "GeoJSON",
					"mediaType": "application/vnd.geo+json",
					"accessURL": "https://www.pacificgeoportal.com/api/download/v1/items/36ae3a3a85ed418fb456bfa45ec20deb/geojson?layers=0"
				},
				{
					"@type": "dcat:Distribution",
					"title": "KML",
					"format": "KML",
					"mediaType": "application/vnd.google-earth.kml+xml",
					"accessURL": "https://www.pacificgeoportal.com/api/download/v1/items/36ae3a3a85ed418fb456bfa45ec20deb/kml?layers=0"
				},
				{
					"@type": "dcat:Distribution",
					"title": "File Geodatabase",
					"format": "ZIP",
					"mediaType": "application/zip",
					"accessURL": "https://www.pacificgeoportal.com/api/download/v1/items/36ae3a3a85ed418fb456bfa45ec20deb/filegdb?layers=0"
				},
				{
					"@type": "dcat:Distribution",
					"title": "Feature Collection",
					"format": "TXT",
					"mediaType": "text/plain",
					"accessURL": "https://www.pacificgeoportal.com/api/download/v1/items/36ae3a3a85ed418fb456bfa45ec20deb/featureCollection?layers=0"
				},
				{
					"@type": "dcat:Distribution",
					"title": "Excel",
					"format": "XLSX",
					"mediaType": "application/vnd.ms-excel",
					"accessURL": "https://www.pacificgeoportal.com/api/download/v1/items/36ae3a3a85ed418fb456bfa45ec20deb/excel?layers=0"
				},
				{
					"@type": "dcat:Distribution",
					"title": "GeoPackage",
					"format": "GPKG",
					"mediaType": "application/geopackage+sqlite3",
					"accessURL": "https://www.pacificgeoportal.com/api/download/v1/items/36ae3a3a85ed418fb456bfa45ec20deb/geoPackage?layers=0"
				},
				{
					"@type": "dcat:Distribution",
					"title": "SQLite Geodatabase",
					"format": "GDB",
					"mediaType": "application/geopackage+sqlite3",
					"accessURL": "https://www.pacificgeoportal.com/api/download/v1/items/36ae3a3a85ed418fb456bfa45ec20deb/sqlite?layers=0"
				}
			],
			"theme": [
				"geospatial"
			]
		},
		{
			"@type": "dcat:Dataset",
			"identifier": "https://www.arcgis.com/home/item.html?id=a165f7da4f6d46e082f219a98ca3863b",
			"landingPage": "https://www.pacificgeoportal.com/pages/pacificcore::openstreetmap-collection",
			"title": "OpenStreetMap Collection",
			"description": "{{description}}",
			"keyword": [
				""
			],
			"issued": "2023-10-20T19:48:21.000Z",
			"modified": "2023-11-08T07:09:03.000Z",
			"publisher": {
				"name": "Pacific GeoPortal - Core Organization"
			},
			"contactPoint": {
				"@type": "vcard:Contact",
				"fn": "Pacific_Core_Admin",
				"hasEmail": "mailto:pacific_geoportal@esri.com"
			},
			"accessLevel": "public",
			"spatial": "-134.7473,23.5610,-55.6955,50.3092",
			"license": "",
			"distribution": [
				{
					"@type": "dcat:Distribution",
					"title": "ArcGIS Hub Dataset",
					"format": "Web Page",
					"mediaType": "text/html",
					"accessURL": "https://www.pacificgeoportal.com/pages/pacificcore::openstreetmap-collection"
				}
			],
			"theme": [
				"geospatial"
			]
		},
		{
			"@type": "dcat:Dataset",
			"identifier": "https://www.arcgis.com/home/item.html?id=58ce4603b62b4731b7f458e0ea88c46b",
			"landingPage": "https://www.pacificgeoportal.com/maps/pacificcore::cyclone-winston-mangrove-damage-wayback-comparison-1",
			"title": "Cyclone Winston Mangrove Damage Wayback Comparison",
			"description": "This custom web map was generated from Wayback layers selected in the World Imagery Wayback app. Wayback imagery is a digital archive of the World Imagery basemap, enabling users to access different versions of World Imagery captured over the years. Each Wayback layer in this web map represents World Imagery as it existed on the date specified.",
			"keyword": [
				"wayback; Fiji; Cyclone; Winston"
			],
			"issued": "2023-10-19T08:50:20.000Z",
			"modified": "2023-11-07T02:30:45.000Z",
			"publisher": {
				"name": "Pacific GeoPortal - Core Organization"
			},
			"contactPoint": {
				"@type": "vcard:Contact",
				"fn": "klevy_pacificcore",
				"hasEmail": "mailto:pacific_geoportal@esri.com"
			},
			"accessLevel": "public",
			"spatial": "178.2123,-17.5045,178.2796,-17.4430",
			"license": "",
			"distribution": [
				{
					"@type": "dcat:Distribution",
					"title": "ArcGIS Hub Dataset",
					"format": "Web Page",
					"mediaType": "text/html",
					"accessURL": "https://www.pacificgeoportal.com/maps/pacificcore::cyclone-winston-mangrove-damage-wayback-comparison-1"
				}
			],
			"theme": [
				"geospatial"
			]
		},
		{
			"@type": "dcat:Dataset",
			"identifier": "https://www.arcgis.com/home/item.html?id=d7491e9ff02142dcb9a69d40a849cd8b",
			"landingPage": "https://www.pacificgeoportal.com/apps/pacificcore::malolo-bay-fiji-wayback-imagery-web-map-1",
			"title": "Malolo Bay Fiji Wayback Imagery Web Map",
			"description": "",
			"keyword": [
				"wayback; Fiji; Malolo Bay",
				"wayback; Fiji; Malolo Bay"
			],
			"issued": "2023-10-13T07:24:40.000Z",
			"modified": "2023-11-07T02:29:01.000Z",
			"publisher": {
				"name": "Pacific GeoPortal - Core Organization"
			},
			"contactPoint": {
				"@type": "vcard:Contact",
				"fn": "klevy_pacificcore",
				"hasEmail": "mailto:pacific_geoportal@esri.com"
			},
			"accessLevel": "public",
			"spatial": "",
			"license": "",
			"distribution": [
				{
					"@type": "dcat:Distribution",
					"title": "ArcGIS Hub Dataset",
					"format": "Web Page",
					"mediaType": "text/html",
					"accessURL": "https://www.pacificgeoportal.com/apps/pacificcore::malolo-bay-fiji-wayback-imagery-web-map-1"
				},
				{
					"@type": "dcat:Distribution",
					"title": "ArcGIS GeoService",
					"format": "ArcGIS GeoServices REST API",
					"mediaType": "application/json",
					"accessURL": "https://pacificcore.maps.arcgis.com/apps/instant/media/index.html?appid=d7491e9ff02142dcb9a69d40a849cd8b"
				}
			],
			"theme": ""
		},
		{
			"@type": "dcat:Dataset",
			"identifier": "https://www.arcgis.com/home/item.html?id=8ab731d09580436483707ab93be5c7cc",
			"landingPage": "https://www.pacificgeoportal.com/pages/pacificcore::learn-gis-video-10",
			"title": "Learn GIS: Video 10",
			"description": "{{description}}",
			"keyword": [
				""
			],
			"issued": "2023-10-31T13:44:15.000Z",
			"modified": "2023-10-31T16:22:31.000Z",
			"publisher": {
				"name": "Pacific GeoPortal - Core Organization"
			},
			"contactPoint": {
				"@type": "vcard:Contact",
				"fn": "Pacific_Core_Admin",
				"hasEmail": "mailto:pacific_geoportal@esri.com"
			},
			"accessLevel": "public",
			"spatial": "112.9197,-55.1168,159.2562,-9.1406",
			"license": "",
			"distribution": [
				{
					"@type": "dcat:Distribution",
					"title": "ArcGIS Hub Dataset",
					"format": "Web Page",
					"mediaType": "text/html",
					"accessURL": "https://www.pacificgeoportal.com/pages/pacificcore::learn-gis-video-10"
				}
			],
			"theme": [
				"geospatial"
			]
		},
		{
			"@type": "dcat:Dataset",
			"identifier": "https://www.arcgis.com/home/item.html?id=5e68e411c16e4107ae11ff0d7e66458b",
			"landingPage": "https://www.pacificgeoportal.com/pages/pacificcore::learn-gis-video-9",
			"title": "Learn GIS: Video 9",
			"description": "{{description}}",
			"keyword": [
				""
			],
			"issued": "2023-10-31T13:42:35.000Z",
			"modified": "2023-10-31T16:11:54.000Z",
			"publisher": {
				"name": "Pacific GeoPortal - Core Organization"
			},
			"contactPoint": {
				"@type": "vcard:Contact",
				"fn": "Pacific_Core_Admin",
				"hasEmail": "mailto:pacific_geoportal@esri.com"
			},
			"accessLevel": "public",
			"spatial": "112.9197,-55.1168,159.2562,-9.1406",
			"license": "",
			"distribution": [
				{
					"@type": "dcat:Distribution",
					"title": "ArcGIS Hub Dataset",
					"format": "Web Page",
					"mediaType": "text/html",
					"accessURL": "https://www.pacificgeoportal.com/pages/pacificcore::learn-gis-video-9"
				}
			],
			"theme": [
				"geospatial"
			]
		},
		{
			"@type": "dcat:Dataset",
			"identifier": "https://www.arcgis.com/home/item.html?id=205dab95cd3b4773889bfa386e4a321c",
			"landingPage": "https://www.pacificgeoportal.com/pages/pacificcore::learn-gis-video-8",
			"title": "Learn GIS: Video 8",
			"description": "{{description}}",
			"keyword": [
				""
			],
			"issued": "2023-10-31T13:40:01.000Z",
			"modified": "2023-10-31T16:03:04.000Z",
			"publisher": {
				"name": "Pacific GeoPortal - Core Organization"
			},
			"contactPoint": {
				"@type": "vcard:Contact",
				"fn": "Pacific_Core_Admin",
				"hasEmail": "mailto:pacific_geoportal@esri.com"
			},
			"accessLevel": "public",
			"spatial": "112.9197,-55.1168,159.2562,-9.1406",
			"license": "",
			"distribution": [
				{
					"@type": "dcat:Distribution",
					"title": "ArcGIS Hub Dataset",
					"format": "Web Page",
					"mediaType": "text/html",
					"accessURL": "https://www.pacificgeoportal.com/pages/pacificcore::learn-gis-video-8"
				}
			],
			"theme": [
				"geospatial"
			]
		},
		{
			"@type": "dcat:Dataset",
			"identifier": "https://www.arcgis.com/home/item.html?id=8e665f1a4e0d41c3bb21e2293c77cad4",
			"landingPage": "https://www.pacificgeoportal.com/pages/pacificcore::learn-gis-video-7",
			"title": "Learn GIS: Video 7",
			"description": "{{description}}",
			"keyword": [
				""
			],
			"issued": "2023-10-31T13:38:37.000Z",
			"modified": "2023-10-31T16:00:02.000Z",
			"publisher": {
				"name": "Pacific GeoPortal - Core Organization"
			},
			"contactPoint": {
				"@type": "vcard:Contact",
				"fn": "Pacific_Core_Admin",
				"hasEmail": "mailto:pacific_geoportal@esri.com"
			},
			"accessLevel": "public",
			"spatial": "112.9197,-55.1168,159.2562,-9.1406",
			"license": "",
			"distribution": [
				{
					"@type": "dcat:Distribution",
					"title": "ArcGIS Hub Dataset",
					"format": "Web Page",
					"mediaType": "text/html",
					"accessURL": "https://www.pacificgeoportal.com/pages/pacificcore::learn-gis-video-7"
				}
			],
			"theme": [
				"geospatial"
			]
		},
		{
			"@type": "dcat:Dataset",
			"identifier": "https://www.arcgis.com/home/item.html?id=c3a826f25ce74779a803c263db2da0d0",
			"landingPage": "https://www.pacificgeoportal.com/pages/pacificcore::learn-gis-video-6",
			"title": "Learn GIS: Video 6",
			"description": "{{description}}",
			"keyword": [
				""
			],
			"issued": "2023-10-31T13:35:51.000Z",
			"modified": "2023-10-31T15:53:36.000Z",
			"publisher": {
				"name": "Pacific GeoPortal - Core Organization"
			},
			"contactPoint": {
				"@type": "vcard:Contact",
				"fn": "Pacific_Core_Admin",
				"hasEmail": "mailto:pacific_geoportal@esri.com"
			},
			"accessLevel": "public",
			"spatial": "112.9197,-55.1168,159.2562,-9.1406",
			"license": "",
			"distribution": [
				{
					"@type": "dcat:Distribution",
					"title": "ArcGIS Hub Dataset",
					"format": "Web Page",
					"mediaType": "text/html",
					"accessURL": "https://www.pacificgeoportal.com/pages/pacificcore::learn-gis-video-6"
				}
			],
			"theme": [
				"geospatial"
			]
		},
		{
			"@type": "dcat:Dataset",
			"identifier": "https://www.arcgis.com/home/item.html?id=47ab0e94e1a2415ebd50a4cca1dd7cec",
			"landingPage": "https://www.pacificgeoportal.com/pages/pacificcore::learn-gis-video-5",
			"title": "Learn GIS: Video 5",
			"description": "{{description}}",
			"keyword": [
				""
			],
			"issued": "2023-10-31T13:31:25.000Z",
			"modified": "2023-10-31T15:51:52.000Z",
			"publisher": {
				"name": "Pacific GeoPortal - Core Organization"
			},
			"contactPoint": {
				"@type": "vcard:Contact",
				"fn": "Pacific_Core_Admin",
				"hasEmail": "mailto:pacific_geoportal@esri.com"
			},
			"accessLevel": "public",
			"spatial": "112.9197,-55.1168,159.2562,-9.1406",
			"license": "",
			"distribution": [
				{
					"@type": "dcat:Distribution",
					"title": "ArcGIS Hub Dataset",
					"format": "Web Page",
					"mediaType": "text/html",
					"accessURL": "https://www.pacificgeoportal.com/pages/pacificcore::learn-gis-video-5"
				}
			],
			"theme": [
				"geospatial"
			]
		},
		{
			"@type": "dcat:Dataset",
			"identifier": "https://www.arcgis.com/home/item.html?id=b64d2fa2ac394a909be241d262c5e3fe",
			"landingPage": "https://www.pacificgeoportal.com/pages/pacificcore::learn-gis-video-4",
			"title": "Learn GIS: Video 4",
			"description": "{{description}}",
			"keyword": [
				""
			],
			"issued": "2023-10-31T13:26:58.000Z",
			"modified": "2023-10-31T15:49:20.000Z",
			"publisher": {
				"name": "Pacific GeoPortal - Core Organization"
			},
			"contactPoint": {
				"@type": "vcard:Contact",
				"fn": "Pacific_Core_Admin",
				"hasEmail": "mailto:pacific_geoportal@esri.com"
			},
			"accessLevel": "public",
			"spatial": "112.9197,-55.1168,159.2562,-9.1406",
			"license": "",
			"distribution": [
				{
					"@type": "dcat:Distribution",
					"title": "ArcGIS Hub Dataset",
					"format": "Web Page",
					"mediaType": "text/html",
					"accessURL": "https://www.pacificgeoportal.com/pages/pacificcore::learn-gis-video-4"
				}
			],
			"theme": [
				"geospatial"
			]
		},
		{
			"@type": "dcat:Dataset",
			"identifier": "https://www.arcgis.com/home/item.html?id=df952c6c619f4b28b4cb63be2a47f794",
			"landingPage": "https://www.pacificgeoportal.com/pages/pacificcore::learn-gis-video-3",
			"title": "Learn GIS: Video 3",
			"description": "{{description}}",
			"keyword": [
				""
			],
			"issued": "2023-10-21T18:50:46.000Z",
			"modified": "2023-10-31T15:35:24.000Z",
			"publisher": {
				"name": "Pacific GeoPortal - Core Organization"
			},
			"contactPoint": {
				"@type": "vcard:Contact",
				"fn": "Pacific_Core_Admin",
				"hasEmail": "mailto:pacific_geoportal@esri.com"
			},
			"accessLevel": "public",
			"spatial": "-134.7473,23.5610,-55.6955,50.3092",
			"license": "",
			"distribution": [
				{
					"@type": "dcat:Distribution",
					"title": "ArcGIS Hub Dataset",
					"format": "Web Page",
					"mediaType": "text/html",
					"accessURL": "https://www.pacificgeoportal.com/pages/pacificcore::learn-gis-video-3"
				}
			],
			"theme": [
				"geospatial"
			]
		},
		{
			"@type": "dcat:Dataset",
			"identifier": "https://www.arcgis.com/home/item.html?id=593995e1dd4b4655b1d495f901cb41e5",
			"landingPage": "https://www.pacificgeoportal.com/pages/pacificcore::learn-gis-video-2",
			"title": "Learn GIS: Video 2",
			"description": "{{description}}",
			"keyword": [
				""
			],
			"issued": "2023-10-21T18:44:53.000Z",
			"modified": "2023-10-31T15:31:56.000Z",
			"publisher": {
				"name": "Pacific GeoPortal - Core Organization"
			},
			"contactPoint": {
				"@type": "vcard:Contact",
				"fn": "Pacific_Core_Admin",
				"hasEmail": "mailto:pacific_geoportal@esri.com"
			},
			"accessLevel": "public",
			"spatial": "-134.7473,23.5610,-55.6955,50.3092",
			"license": "",
			"distribution": [
				{
					"@type": "dcat:Distribution",
					"title": "ArcGIS Hub Dataset",
					"format": "Web Page",
					"mediaType": "text/html",
					"accessURL": "https://www.pacificgeoportal.com/pages/pacificcore::learn-gis-video-2"
				}
			],
			"theme": [
				"geospatial"
			]
		},
		{
			"@type": "dcat:Dataset",
			"identifier": "https://www.arcgis.com/home/item.html?id=d4470583c6f1490ba618afa29e4218eb",
			"landingPage": "https://www.pacificgeoportal.com/pages/pacificcore::learn-gis-video-1",
			"title": "Learn GIS: Video 1",
			"description": "{{description}}",
			"keyword": [
				""
			],
			"issued": "2023-10-20T19:48:19.000Z",
			"modified": "2023-10-31T15:18:44.000Z",
			"publisher": {
				"name": "Pacific GeoPortal - Core Organization"
			},
			"contactPoint": {
				"@type": "vcard:Contact",
				"fn": "Pacific_Core_Admin",
				"hasEmail": "mailto:pacific_geoportal@esri.com"
			},
			"accessLevel": "public",
			"spatial": "-134.7473,23.5610,-55.6955,50.3092",
			"license": "",
			"distribution": [
				{
					"@type": "dcat:Distribution",
					"title": "ArcGIS Hub Dataset",
					"format": "Web Page",
					"mediaType": "text/html",
					"accessURL": "https://www.pacificgeoportal.com/pages/pacificcore::learn-gis-video-1"
				}
			],
			"theme": [
				"geospatial"
			]
		},
		{
			"@type": "dcat:Dataset",
			"identifier": "https://www.arcgis.com/home/item.html?id=d9a2983eb61c465cad602390d0bc4bf3",
			"landingPage": "https://www.pacificgeoportal.com/maps/pacificcore::malolo-bay-fiji-wayback-imagery-web-map",
			"title": "Malolo Bay Fiji Wayback Imagery Web Map",
			"description": "This custom web map was generated from Wayback layers selected in the World Imagery Wayback app. Wayback imagery is a digital archive of the World Imagery basemap, enabling users to access different versions of World Imagery captured over the years. Each Wayback layer in this web map represents World Imagery as it existed on the date specified.",
			"keyword": [
				"wayback; Fiji; Malolo Bay"
			],
			"issued": "2023-10-13T06:57:50.000Z",
			"modified": "2023-10-23T06:47:07.000Z",
			"publisher": {
				"name": "Pacific GeoPortal - Core Organization"
			},
			"contactPoint": {
				"@type": "vcard:Contact",
				"fn": "klevy_pacificcore",
				"hasEmail": "mailto:pacific_geoportal@esri.com"
			},
			"accessLevel": "public",
			"spatial": "177.1713,-17.7633,177.1737,-17.7610",
			"license": "",
			"distribution": [
				{
					"@type": "dcat:Distribution",
					"title": "ArcGIS Hub Dataset",
					"format": "Web Page",
					"mediaType": "text/html",
					"accessURL": "https://www.pacificgeoportal.com/maps/pacificcore::malolo-bay-fiji-wayback-imagery-web-map"
				}
			],
			"theme": [
				"geospatial"
			]
		},
		{
			"@type": "dcat:Dataset",
			"identifier": "https://www.arcgis.com/home/item.html?id=9faf2ef864e34da78a56ff6dbe82520a",
			"landingPage": "https://www.pacificgeoportal.com/pages/pacificcore::get-involved",
			"title": "Get Involved",
			"description": "{{description}}",
			"keyword": [
				""
			],
			"issued": "2023-10-22T07:57:38.000Z",
			"modified": "2023-10-22T07:58:11.000Z",
			"publisher": {
				"name": "Pacific GeoPortal - Core Organization"
			},
			"contactPoint": {
				"@type": "vcard:Contact",
				"fn": "Pacific_Core_Admin",
				"hasEmail": "mailto:pacific_geoportal@esri.com"
			},
			"accessLevel": "public",
			"spatial": "112.9197,-55.1168,159.2562,-9.1406",
			"license": "",
			"distribution": [
				{
					"@type": "dcat:Distribution",
					"title": "ArcGIS Hub Dataset",
					"format": "Web Page",
					"mediaType": "text/html",
					"accessURL": "https://www.pacificgeoportal.com/pages/pacificcore::get-involved"
				}
			],
			"theme": [
				"geospatial"
			]
		},
		{
			"@type": "dcat:Dataset",
			"identifier": "https://www.arcgis.com/home/item.html?id=cd794deb836847328a3ee1ed5753b90c",
			"landingPage": "https://www.pacificgeoportal.com/pages/pacificcore::regional-partners",
			"title": "Regional Partners",
			"description": "{{description}}",
			"keyword": [
				""
			],
			"issued": "2023-10-20T19:48:19.000Z",
			"modified": "2023-10-22T07:56:51.000Z",
			"publisher": {
				"name": "Pacific GeoPortal - Core Organization"
			},
			"contactPoint": {
				"@type": "vcard:Contact",
				"fn": "Pacific_Core_Admin",
				"hasEmail": "mailto:pacific_geoportal@esri.com"
			},
			"accessLevel": "public",
			"spatial": "-134.7473,23.5610,-55.6955,50.3092",
			"license": "",
			"distribution": [
				{
					"@type": "dcat:Distribution",
					"title": "ArcGIS Hub Dataset",
					"format": "Web Page",
					"mediaType": "text/html",
					"accessURL": "https://www.pacificgeoportal.com/pages/pacificcore::regional-partners"
				}
			],
			"theme": [
				"geospatial"
			]
		},
		{
			"@type": "dcat:Dataset",
			"identifier": "https://www.arcgis.com/home/item.html?id=63fb8e263d2a4ba6b5e7879b740d5a64",
			"landingPage": "https://www.pacificgeoportal.com/content/pacificcore::pacific-geoportal-1",
			"title": "Pacific GeoPortal",
			"description": "Create your own initiative by combining existing applications with a custom site.",
			"keyword": [],
			"issued": "2023-10-20T19:48:26.000Z",
			"modified": "2023-10-20T21:05:09.000Z",
			"publisher": {
				"name": "Pacific GeoPortal - Core Organization"
			},
			"contactPoint": {
				"@type": "vcard:Contact",
				"fn": "Pacific_Core_Admin",
				"hasEmail": "mailto:pacific_geoportal@esri.com"
			},
			"accessLevel": "public",
			"spatial": "-134.7473,23.5610,-55.6955,50.3092",
			"license": "",
			"distribution": [
				{
					"@type": "dcat:Distribution",
					"title": "ArcGIS Hub Dataset",
					"format": "Web Page",
					"mediaType": "text/html",
					"accessURL": "https://www.pacificgeoportal.com/content/pacificcore::pacific-geoportal-1"
				},
				{
					"@type": "dcat:Distribution",
					"title": "ArcGIS GeoService",
					"format": "ArcGIS GeoServices REST API",
					"mediaType": "application/json",
					"accessURL": "https://www.pacificgeoportal.com"
				}
			],
			"theme": [
				"geospatial"
			]
		},
		{
			"@type": "dcat:Dataset",
			"identifier": "https://www.arcgis.com/home/item.html?id=281e374d88e044549bbef99462c6b375",
			"landingPage": "https://www.pacificgeoportal.com/pages/pacificcore::success-stories",
			"title": "Success Stories",
			"description": "{{description}}",
			"keyword": [
				""
			],
			"issued": "2023-10-20T19:48:19.000Z",
			"modified": "2023-10-20T19:48:36.000Z",
			"publisher": {
				"name": "Pacific GeoPortal - Core Organization"
			},
			"contactPoint": {
				"@type": "vcard:Contact",
				"fn": "Pacific_Core_Admin",
				"hasEmail": "mailto:pacific_geoportal@esri.com"
			},
			"accessLevel": "public",
			"spatial": "-134.7473,23.5610,-55.6955,50.3092",
			"license": "",
			"distribution": [
				{
					"@type": "dcat:Distribution",
					"title": "ArcGIS Hub Dataset",
					"format": "Web Page",
					"mediaType": "text/html",
					"accessURL": "https://www.pacificgeoportal.com/pages/pacificcore::success-stories"
				}
			],
			"theme": [
				"geospatial"
			]
		},
		{
			"@type": "dcat:Dataset",
			"identifier": "https://www.arcgis.com/home/item.html?id=ce2a1fed29114cd98695e3f4ca844112",
			"landingPage": "https://www.pacificgeoportal.com/maps/pacificcore::openstreetsmap-waterways-for-pacific-region",
			"title": "OpenStreetsMap Waterways for Pacific Region",
			"description": "<span style='font-family:&quot;Avenir Next W01&quot;, &quot;Avenir Next W00&quot;, &quot;Avenir Next&quot;, Avenir, &quot;Helvetica Neue&quot;, sans-serif; font-size:17px;'>This WebMap provides access to OpenStreetMap (OSM) </span><span style='font-family:&quot;Avenir Next W01&quot;, &quot;Avenir Next W00&quot;, &quot;Avenir Next&quot;, Avenir, &quot;Helvetica Neue&quot;, sans-serif; font-size:17px;'>waterways </span><font style='font-family:&quot;Avenir Next W01&quot;, &quot;Avenir Next W00&quot;, &quot;Avenir Next&quot;, Avenir, &quot;Helvetica Neue&quot;, sans-serif; font-size:16px;'><span style='font-family:inherit; font-size:17px;'>data for Pacific Region whihc is a subset of </span><a href='https://www.arcgis.com/home/item.html?id=76659f9ea5bf4761b263ffe55f976d1a' target='_blank' rel='nofollow ugc noopener noreferrer'>OpenStreetMap (OSM) waterways data for Australia and Oceania Feature Service</a><span style='font-family:inherit; font-size:17px;'>, which is </span></font><b>updated every 15 minutes</b><font style='font-family:&quot;Avenir Next W01&quot;, &quot;Avenir Next W00&quot;, &quot;Avenir Next&quot;, Avenir, &quot;Helvetica Neue&quot;, sans-serif; font-size:16px;'><span style='font-family:inherit; font-size:17px;'> with the latest edits. This </span></font><a href='https://doc.arcgis.com/en/arcgis-online/share-maps/about-sharing-feature-layer-data-as-copies.htm' style='color:rgb(0, 121, 193); text-decoration-line:none; font-family:&quot;Avenir Next W01&quot;, &quot;Avenir Next W00&quot;, &quot;Avenir Next&quot;, Avenir, &quot;Helvetica Neue&quot;, sans-serif; font-size:16px;' target='_blank' rel='nofollow ugc noopener noreferrer'>hosted feature layer view</a><span style='font-family:&quot;Avenir Next W01&quot;, &quot;Avenir Next W00&quot;, &quot;Avenir Next&quot;, Avenir, &quot;Helvetica Neue&quot;, sans-serif; font-size:17px;'> is referencing a hosted feature layer of OSM line (way) data in ArcGIS Online that is updated with minutely diffs from the OSM planet file.  This feature </span><span style='font-family:&quot;Avenir Next W01&quot;, &quot;Avenir Next W00&quot;, &quot;Avenir Next&quot;, Avenir, &quot;Helvetica Neue&quot;, sans-serif; font-size:17px;'>layer view</span><span style='font-family:&quot;Avenir Next W01&quot;, &quot;Avenir Next W00&quot;, &quot;Avenir Next&quot;, Avenir, &quot;Helvetica Neue&quot;, sans-serif; font-size:17px;'> includes waterway </span><span style='font-family:&quot;Avenir Next W01&quot;, &quot;Avenir Next W00&quot;, &quot;Avenir Next&quot;, Avenir, &quot;Helvetica Neue&quot;, sans-serif; font-size:17px;'>features defined as a query against the hosted feature layer (i.e. waterway is not blank).</span><div style='font-family:&quot;Avenir Next W01&quot;, &quot;Avenir Next W00&quot;, &quot;Avenir Next&quot;, Avenir, &quot;Helvetica Neue&quot;, sans-serif; font-size:16px;'><font style='font-family:inherit;'><span style='font-family:inherit; font-size:17px;'><br /></span></font></div><div style='font-family:&quot;Avenir Next W01&quot;, &quot;Avenir Next W00&quot;, &quot;Avenir Next&quot;, Avenir, &quot;Helvetica Neue&quot;, sans-serif; font-size:16px;'><font style='font-family:inherit;'><span style='font-family:inherit; font-size:17px;'>In OSM, a waterway </span></font><font style='font-family:inherit;'><font style='font-family:inherit;'><font style='font-family:inherit;'><span style='font-family:inherit; font-size:17px;'>describes rivers, streams and ditches with a flow of water from one place to another</span></font><font style='font-family:inherit;'><span style='font-family:inherit; font-size:17px;'>.  These features are identified with a </span></font></font></font><font style='font-family:inherit;'><a href='https://wiki.openstreetmap.org/wiki/Key:waterway' style='color:rgb(0, 121, 193); text-decoration-line:none; font-family:inherit;' target='_blank' rel='nofollow ugc noopener noreferrer'>waterway tag</a><span style='font-family:inherit; font-size:17px;'>.  There are hundreds of different tag values for waterway used in the OSM database.  In this feature layer, unique symbols are used for several of the most popular waterway types, while lesser used types are grouped in an &quot;other&quot; category.<br /></span></font><div style='font-family:inherit;'><span style='font-family:&quot;Avenir Next W01&quot;, &quot;Avenir Next W00&quot;, &quot;Avenir Next&quot;, Avenir, &quot;Helvetica Neue&quot;, Helvetica, Arial, sans-serif; font-size:17px;'><br /></span></div><div style='font-family:inherit;'><span style='font-family:&quot;Avenir Next W01&quot;, &quot;Avenir Next W00&quot;, &quot;Avenir Next&quot;, Avenir, &quot;Helvetica Neue&quot;, Helvetica, Arial, sans-serif; font-size:17px;'>Zoom in to large scales (e.g. </span><span style='font-family:&quot;Avenir Next W01&quot;, &quot;Avenir Next W00&quot;, &quot;Avenir Next&quot;, Avenir, &quot;Helvetica Neue&quot;, Helvetica, Arial, sans-serif; font-size:17px;'>City level or 1:80k scale</span><span style='font-family:&quot;Avenir Next W01&quot;, &quot;Avenir Next W00&quot;, &quot;Avenir Next&quot;, Avenir, &quot;Helvetica Neue&quot;, Helvetica, Arial, sans-serif; font-size:17px;'>) to see the waterway features display.  </span><span style='font-family:&quot;Avenir Next W01&quot;, &quot;Avenir Next W00&quot;, &quot;Avenir Next&quot;, Avenir, &quot;Helvetica Neue&quot;, Helvetica, Arial, sans-serif; font-size:17px;'>You can click on </span><span style='font-family:&quot;Avenir Next W01&quot;, &quot;Avenir Next W00&quot;, &quot;Avenir Next&quot;, Avenir, &quot;Helvetica Neue&quot;, Helvetica, Arial, sans-serif; font-size:17px;'>a </span><span style='font-family:&quot;Avenir Next W01&quot;, &quot;Avenir Next W00&quot;, &quot;Avenir Next&quot;, Avenir, &quot;Helvetica Neue&quot;, Helvetica, Arial, sans-serif; font-size:17px;'>feature to get the name of the waterway (if available).  The name of the waterway will display by default at large scales (e.g. Street level of 1:5k scale).  Labels can be turned off in your map if you prefer.</span></div></div><div style='font-family:&quot;Avenir Next W01&quot;, &quot;Avenir Next W00&quot;, &quot;Avenir Next&quot;, Avenir, &quot;Helvetica Neue&quot;, sans-serif; font-size:16px;'><span style='font-family:&quot;Avenir Next W01&quot;, &quot;Avenir Next W00&quot;, &quot;Avenir Next&quot;, Avenir, &quot;Helvetica Neue&quot;, Helvetica, Arial, sans-serif; font-size:17px;'><br /></span></div><div style='font-family:&quot;Avenir Next W01&quot;, &quot;Avenir Next W00&quot;, &quot;Avenir Next&quot;, Avenir, &quot;Helvetica Neue&quot;, sans-serif; font-size:16px;'><span style='font-family:&quot;Avenir Next W01&quot;, &quot;Avenir Next W00&quot;, &quot;Avenir Next&quot;, Avenir, &quot;Helvetica Neue&quot;, Helvetica, Arial, sans-serif; font-size:17px;'><b>Create New Layer</b></span></div><div style='font-family:&quot;Avenir Next W01&quot;, &quot;Avenir Next W00&quot;, &quot;Avenir Next&quot;, Avenir, &quot;Helvetica Neue&quot;, sans-serif; font-size:16px;'><span style='font-family:&quot;Avenir Next W01&quot;, &quot;Avenir Next W00&quot;, &quot;Avenir Next&quot;, Avenir, &quot;Helvetica Neue&quot;, Helvetica, Arial, sans-serif; font-size:17px;'>If you would like to create a more focused version of this waterway layer displaying just one or two </span><span style='font-family:&quot;Avenir Next W01&quot;, &quot;Avenir Next W00&quot;, &quot;Avenir Next&quot;, Avenir, &quot;Helvetica Neue&quot;, Helvetica, Arial, sans-serif; font-size:17px;'>waterway </span><span style='font-family:&quot;Avenir Next W01&quot;, &quot;Avenir Next W00&quot;, &quot;Avenir Next&quot;, Avenir, &quot;Helvetica Neue&quot;, Helvetica, Arial, sans-serif; font-size:17px;'>types, you can do that easily!  Just add the layer to a map, copy the layer in the content window, add a filter to the new layer (e.g. </span><span style='font-family:&quot;Avenir Next W01&quot;, &quot;Avenir Next W00&quot;, &quot;Avenir Next&quot;, Avenir, &quot;Helvetica Neue&quot;, Helvetica, Arial, sans-serif; font-size:17px;'>waterway </span><span style='font-family:&quot;Avenir Next W01&quot;, &quot;Avenir Next W00&quot;, &quot;Avenir Next&quot;, Avenir, &quot;Helvetica Neue&quot;, Helvetica, Arial, sans-serif; font-size:17px;'>is dam), rename the layer as appropriate, and save layer.  You can also change the layer symbols or popup if you like.  Esri may publish a few such layers (e.g. streams and rivers) that are ready to use, but not for every type of waterway.</span></div><div style='font-family:&quot;Avenir Next W01&quot;, &quot;Avenir Next W00&quot;, &quot;Avenir Next&quot;, Avenir, &quot;Helvetica Neue&quot;, sans-serif; font-size:16px;'><span style='font-family:&quot;Avenir Next W01&quot;, &quot;Avenir Next W00&quot;, &quot;Avenir Next&quot;, Avenir, &quot;Helvetica Neue&quot;, Helvetica, Arial, sans-serif; font-size:17px;'><br /></span></div><div style='font-family:&quot;Avenir Next W01&quot;, &quot;Avenir Next W00&quot;, &quot;Avenir Next&quot;, Avenir, &quot;Helvetica Neue&quot;, sans-serif; font-size:16px;'><span style='font-family:&quot;Avenir Next W01&quot;, &quot;Avenir Next W00&quot;, &quot;Avenir Next&quot;, Avenir, &quot;Helvetica Neue&quot;, Helvetica, Arial, sans-serif; font-size:17px;'><b><i>Important Note</i></b>: if you do create a new layer, it should be provided under the same Terms of Use and include the same Credits as this layer.  You can copy and paste the Terms of Use and Credits info below in the new Item page as needed.</span></div>",
			"keyword": [
				"osm",
				"OpenStreetMap",
				"waterway",
				"Australia",
				"Oceania",
				"New Zealand",
				"water",
				"river",
				"stream"
			],
			"issued": "2023-10-18T01:04:11.000Z",
			"modified": "2023-10-18T01:07:06.000Z",
			"publisher": {
				"name": "Pacific GeoPortal - Core Organization"
			},
			"contactPoint": {
				"@type": "vcard:Contact",
				"fn": "dkaragulle_pacificcore",
				"hasEmail": "mailto:pacific_geoportal@esri.com"
			},
			"accessLevel": "public",
			"spatial": "149.2245,-11.0395,151.4520,-9.3270",
			"license": "https://opendatacommons.org/licenses/odbl/summary",
			"distribution": [
				{
					"@type": "dcat:Distribution",
					"title": "ArcGIS Hub Dataset",
					"format": "Web Page",
					"mediaType": "text/html",
					"accessURL": "https://www.pacificgeoportal.com/maps/pacificcore::openstreetsmap-waterways-for-pacific-region"
				}
			],
			"theme": [
				"geospatial"
			]
		},
		{
			"@type": "dcat:Dataset",
			"identifier": "https://www.arcgis.com/home/item.html?id=7a66d78d872a41bbafa18153525781f3",
			"landingPage": "https://www.pacificgeoportal.com/maps/pacificcore::openstreetmap",
			"title": "OpenStreetMap",
			"description": "<p style='margin-top:0px; margin-bottom:1.5rem; font-family:&quot;Avenir Next W01&quot;, &quot;Avenir Next W00&quot;, &quot;Avenir Next&quot;, Avenir, &quot;Helvetica Neue&quot;, sans-serif; font-size:16px;'><span style='font-family:inherit;'>This web map </span><span style='font-family:inherit;'>references the live tiled map service from the OpenStreetMap (OSM) project for Pacific Region. OpenStreetMap (OSM) is an open collaborative project to  create a free editable map of the world. Volunteers gather location data  using GPS, local knowledge, and other free sources of information and upload it. The resulting free map can be  viewed and downloaded from the OpenStreetMap server: <a href='https://www.openstreetmap.org/' style='color:rgb(0, 97, 155); text-decoration-line:none; font-family:inherit;' rel='nofollow ugc'>https://www.OpenStreetMap.org</a>.  See that website for additional information about OpenStreetMap. It is made available as a basemap for GIS work in ESRI products under a <a href='https://creativecommons.org/licenses/by-sa/2.0' style='color:rgb(0, 97, 155); text-decoration-line:none; font-family:inherit;' rel='nofollow ugc'>Creative Commons Attribution-ShareAlike license</a>.</span><br /><span style='font-family:inherit;'><br /><span style='font-family:inherit;'><span style='font-family:inherit;'><span style='font-family:inherit;'><span style='font-family:inherit;'><span style='font-family:inherit;'><span style='font-family:inherit;'><span style='font-family:inherit;'><span style='font-family:inherit;'><span style='font-family:inherit;'><span style='font-family:inherit;'><span style='font-family:inherit;'><span style='font-family:inherit;'><span style='font-family:inherit;'><span style='font-family:inherit;'><span style='font-family:inherit;'><span style='font-family:inherit;'><span style='font-family:inherit;'><span style='font-family:inherit;'><span style='font-family:inherit;'><span style='font-family:inherit;'><span style='font-family:inherit;'><span style='font-family:inherit;'><span style='font-family:inherit;'><span style='font-family:inherit;'><span style='font-family:inherit;'><span style='font-family:inherit;'><span style='font-family:inherit;'><span style='font-family:inherit;'><span style='font-family:inherit;'><span style='font-family:inherit;'><span style='font-family:inherit;'><span style='font-family:inherit;'><span style='font-family:inherit;'><span style='font-family:inherit;'><span style='font-family:inherit;'><span style='font-family:inherit;'><span style='font-family:inherit;'><span style='font-family:inherit;'><span style='font-family:inherit;'><span style='font-family:inherit;'><span style='font-family:inherit;'><span style='font-family:inherit;'><span style='font-family:inherit;'><span style='font-family:inherit;'><span style='font-family:inherit;'><span style='font-family:inherit;'><span style='font-family:inherit;'><span style='font-family:inherit;'><span style='font-family:inherit;'><span style='font-family:inherit;'><span style='font-family:inherit;'><span style='font-family:inherit;'><span style='font-family:inherit;'><span style='font-family:inherit;'><span style='font-family:inherit;'><span style='font-family:inherit;'><span style='font-family:inherit;'><span style='font-family:inherit;'><span style='font-family:inherit;'><span style='font-family:inherit;'><span style='font-family:inherit;'><span style='font-family:inherit;'><span style='font-family:inherit;'><span style='font-family:inherit;'><span style='font-family:inherit;'><span style='font-family:inherit;'><span style='font-family:inherit;'><span style='font-family:inherit;'><span style='font-family:inherit;'><span style='font-family:inherit;'><span style='font-family:inherit;'><span style='font-family:inherit;'><span style='font-family:inherit;'><span style='font-family:inherit;'><b>Tip:</b> This service is one of the basemaps used in the <a style='color:rgb(0, 97, 155); font-family:inherit;' target='_self'>ArcGIS.com map viewer</a>.  Simply click one of those links to launch the interactive application  of your choice, and then choose Open Street Map from the  Basemap control to start using this service. You'll also find this  service in the Basemap gallery in ArcGIS Explorer Desktop and ArcGIS  Desktop 10.</span></span></span></span></span></span></span></span></span></span></span></span></span></span></span></span></span></span></span></span></span></span></span></span></span></span></span></span></span></span></span></span></span></span></span></span></span></span></span></span></span></span></span></span></span></span></span></span></span></span></span></span></span></span></span></span></span></span></span></span></span></span></span></span></span></span></span></span></span></span></span></span></span></span><br /></span></p><p style='margin-top:0px; margin-bottom:1.5rem; font-family:&quot;Avenir Next W01&quot;, &quot;Avenir Next W00&quot;, &quot;Avenir Next&quot;, Avenir, &quot;Helvetica Neue&quot;, sans-serif; font-size:16px;'><br /></p>",
			"keyword": [
				"world",
				"Open Street Map",
				"OSM",
				"OpenStreetMap",
				"international",
				"road",
				"roads",
				"street",
				"streets",
				"wiki",
				"basemap",
				"current",
				"transportation",
				"partner_basemap"
			],
			"issued": "2023-10-17T23:07:55.000Z",
			"modified": "2023-10-17T23:09:41.000Z",
			"publisher": {
				"name": "Pacific GeoPortal - Core Organization"
			},
			"contactPoint": {
				"@type": "vcard:Contact",
				"fn": "dkaragulle_pacificcore",
				"hasEmail": "mailto:pacific_geoportal@esri.com"
			},
			"accessLevel": "public",
			"spatial": "149.7518,-10.0475,149.8910,-9.9404",
			"license": "https://creativecommons.org/licenses/by-sa/2.0",
			"distribution": [
				{
					"@type": "dcat:Distribution",
					"title": "ArcGIS Hub Dataset",
					"format": "Web Page",
					"mediaType": "text/html",
					"accessURL": "https://www.pacificgeoportal.com/maps/pacificcore::openstreetmap"
				}
			],
			"theme": [
				"geospatial"
			]
		},
		{
			"@type": "dcat:Dataset",
			"identifier": "https://www.arcgis.com/home/item.html?id=b6c2c059e15240f69a30b46fe65a860e",
			"landingPage": "https://www.pacificgeoportal.com/maps/pacificcore::malolol-bay-3d-scene",
			"title": "Malolol Bay 3D Scene",
			"description": "",
			"keyword": [
				"malolo bay",
				"fiji",
				"osm",
				"pacific",
				"geoportal"
			],
			"issued": "2023-10-17T05:47:17.000Z",
			"modified": "2023-10-17T05:54:53.000Z",
			"publisher": {
				"name": "Pacific GeoPortal - Core Organization"
			},
			"contactPoint": {
				"@type": "vcard:Contact",
				"fn": "klevy_pacificcore",
				"hasEmail": "mailto:pacific_geoportal@esri.com"
			},
			"accessLevel": "public",
			"spatial": "",
			"license": "",
			"distribution": [
				{
					"@type": "dcat:Distribution",
					"title": "ArcGIS Hub Dataset",
					"format": "Web Page",
					"mediaType": "text/html",
					"accessURL": "https://www.pacificgeoportal.com/maps/pacificcore::malolol-bay-3d-scene"
				}
			],
			"theme": ""
		},
		{
			"@type": "dcat:Dataset",
			"identifier": "https://www.arcgis.com/home/item.html?id=c4d8d18083254ddc8a2e7d3cf6d056c9",
			"landingPage": "https://www.pacificgeoportal.com/maps/pacificcore::openstreetmap-amenities-for-pacific-region",
			"title": "OpenStreetMap Amenities for Pacific Region",
			"description": "<span style='font-family:&quot;Avenir Next W01&quot;, &quot;Avenir Next W00&quot;, &quot;Avenir Next&quot;, Avenir, &quot;Helvetica Neue&quot;, sans-serif; font-size:17px;'>This WebMap is a subset of </span><a href='https://www.arcgis.com/home/item.html?id=b4e6461dacd946ea854115570ee4ea68' target='_blank' rel='nofollow ugc noopener noreferrer'>OpenStreetMap Amenities for Australia and Oceania Feature Service for Pacific Regions. </a><div><br /><div><div><span style='font-family:&quot;Avenir Next W01&quot;, &quot;Avenir Next W00&quot;, &quot;Avenir Next&quot;, Avenir, &quot;Helvetica Neue&quot;, sans-serif; font-size:17px;'>This feature layer provides access to OpenStreetMap (OSM) </span><span style='font-family:&quot;Avenir Next W01&quot;, &quot;Avenir Next W00&quot;, &quot;Avenir Next&quot;, Avenir, &quot;Helvetica Neue&quot;, sans-serif; font-size:17px;'>amenity </span><font style='font-family:&quot;Avenir Next W01&quot;, &quot;Avenir Next W00&quot;, &quot;Avenir Next&quot;, Avenir, &quot;Helvetica Neue&quot;, sans-serif; font-size:16px;'><span style='font-family:inherit; font-size:17px;'>data for Australia and Oceania, which is </span></font><b>updated every 5 minutes</b><font style='font-family:&quot;Avenir Next W01&quot;, &quot;Avenir Next W00&quot;, &quot;Avenir Next&quot;, Avenir, &quot;Helvetica Neue&quot;, sans-serif; font-size:16px;'><span style='font-family:inherit; font-size:17px;'> with the latest edits.</span></font><b> </b><font style='font-family:&quot;Avenir Next W01&quot;, &quot;Avenir Next W00&quot;, &quot;Avenir Next&quot;, Avenir, &quot;Helvetica Neue&quot;, sans-serif; font-size:16px;'><span style='font-family:inherit; font-size:17px;'>This </span></font><a href='https://doc.arcgis.com/en/arcgis-online/share-maps/about-sharing-feature-layer-data-as-copies.htm' style='color:rgb(0, 121, 193); text-decoration-line:none; font-family:&quot;Avenir Next W01&quot;, &quot;Avenir Next W00&quot;, &quot;Avenir Next&quot;, Avenir, &quot;Helvetica Neue&quot;, sans-serif; font-size:16px;' target='_blank' rel='nofollow ugc noopener noreferrer'>hosted feature layer view</a><span style='font-family:&quot;Avenir Next W01&quot;, &quot;Avenir Next W00&quot;, &quot;Avenir Next&quot;, Avenir, &quot;Helvetica Neue&quot;, sans-serif; font-size:17px;'> is referencing a hosted feature layer of OSM point (node) data in ArcGIS Online that is updated with minutely diffs from the OSM planet file.  This feature </span><span style='font-family:&quot;Avenir Next W01&quot;, &quot;Avenir Next W00&quot;, &quot;Avenir Next&quot;, Avenir, &quot;Helvetica Neue&quot;, sans-serif; font-size:17px;'>layer view</span><span style='font-family:&quot;Avenir Next W01&quot;, &quot;Avenir Next W00&quot;, &quot;Avenir Next&quot;, Avenir, &quot;Helvetica Neue&quot;, sans-serif; font-size:17px;'> includes amenity </span><span style='font-family:&quot;Avenir Next W01&quot;, &quot;Avenir Next W00&quot;, &quot;Avenir Next&quot;, Avenir, &quot;Helvetica Neue&quot;, sans-serif; font-size:17px;'>features defined as a query against the hosted feature layer (i.e. amenity is not blank).</span><br /></div><div><div style='font-family:&quot;Avenir Next W01&quot;, &quot;Avenir Next W00&quot;, &quot;Avenir Next&quot;, Avenir, &quot;Helvetica Neue&quot;, sans-serif; font-size:16px;'><font style='font-family:inherit;'><span style='font-family:inherit; font-size:17px;'><br /></span></font></div><div style='font-family:&quot;Avenir Next W01&quot;, &quot;Avenir Next W00&quot;, &quot;Avenir Next&quot;, Avenir, &quot;Helvetica Neue&quot;, sans-serif; font-size:16px;'><font style='font-family:inherit;'><span style='font-family:inherit; font-size:17px;'>In OSM, amenities are </span></font><font style='font-family:inherit;'><span style='font-family:inherit; font-size:17px;'><b>useful and important facilities</b> for visitors and residents, such as places of worship, restaurants, banks, and schools.  These features are identified with an </span></font><a href='https://wiki.openstreetmap.org/wiki/Key:amenity' style='color:rgb(0, 121, 193); text-decoration-line:none; font-family:inherit;' target='_blank' rel='nofollow ugc noopener noreferrer'>amenity tag</a><font style='font-family:inherit;'><span style='font-family:inherit; font-size:17px;'>.  There are thousands of different tag values used in the OSM database.  In this feature layer, unique symbols are used for several of the most popular amenity types, while lesser used types are grouped in an &quot;other&quot; category.<br /></span></font><div style='font-family:inherit;'><span style='font-family:&quot;Avenir Next W01&quot;, &quot;Avenir Next W00&quot;, &quot;Avenir Next&quot;, Avenir, &quot;Helvetica Neue&quot;, Helvetica, Arial, sans-serif; font-size:17px;'><br /></span></div><div style='font-family:inherit;'><span style='font-family:&quot;Avenir Next W01&quot;, &quot;Avenir Next W00&quot;, &quot;Avenir Next&quot;, Avenir, &quot;Helvetica Neue&quot;, Helvetica, Arial, sans-serif; font-size:17px;'>Zoom in to large scales (e.g. </span><span style='font-family:&quot;Avenir Next W01&quot;, &quot;Avenir Next W00&quot;, &quot;Avenir Next&quot;, Avenir, &quot;Helvetica Neue&quot;, Helvetica, Arial, sans-serif; font-size:17px;'>City level or 1:80k scale</span><span style='font-family:&quot;Avenir Next W01&quot;, &quot;Avenir Next W00&quot;, &quot;Avenir Next&quot;, Avenir, &quot;Helvetica Neue&quot;, Helvetica, Arial, sans-serif; font-size:17px;'>) to see the amenity features display.  </span><span style='font-family:&quot;Avenir Next W01&quot;, &quot;Avenir Next W00&quot;, &quot;Avenir Next&quot;, Avenir, &quot;Helvetica Neue&quot;, Helvetica, Arial, sans-serif; font-size:17px;'>You can click on a feature to get the name of the amenity.  The name of the amenity will display by default at very large scales (e.g. Building level of 1:2k scale).  Labels can be turned off in your map if you prefer.</span></div></div><div style='font-family:&quot;Avenir Next W01&quot;, &quot;Avenir Next W00&quot;, &quot;Avenir Next&quot;, Avenir, &quot;Helvetica Neue&quot;, sans-serif; font-size:16px;'><span style='font-family:&quot;Avenir Next W01&quot;, &quot;Avenir Next W00&quot;, &quot;Avenir Next&quot;, Avenir, &quot;Helvetica Neue&quot;, Helvetica, Arial, sans-serif; font-size:17px;'><br /></span></div><div style='font-family:&quot;Avenir Next W01&quot;, &quot;Avenir Next W00&quot;, &quot;Avenir Next&quot;, Avenir, &quot;Helvetica Neue&quot;, sans-serif; font-size:16px;'><span style='font-family:&quot;Avenir Next W01&quot;, &quot;Avenir Next W00&quot;, &quot;Avenir Next&quot;, Avenir, &quot;Helvetica Neue&quot;, Helvetica, Arial, sans-serif; font-size:17px;'><b>Create New Layer</b></span></div><div style='font-family:&quot;Avenir Next W01&quot;, &quot;Avenir Next W00&quot;, &quot;Avenir Next&quot;, Avenir, &quot;Helvetica Neue&quot;, sans-serif; font-size:16px;'><span style='font-family:&quot;Avenir Next W01&quot;, &quot;Avenir Next W00&quot;, &quot;Avenir Next&quot;, Avenir, &quot;Helvetica Neue&quot;, Helvetica, Arial, sans-serif; font-size:17px;'>If you would like to create a more focused version of this amenity layer displaying just one or two amenity types, you can do that easily!  Just add the layer to a map, copy the layer in the content window, add a filter to the new layer (e.g. amenity is fire station), rename the layer as appropriate, and save layer.  You can also change the layer symbols or popup if you like.  Esri will publish a few such layers (e.g. </span><span style='font-family:&quot;Avenir Next W01&quot;, &quot;Avenir Next W00&quot;, &quot;Avenir Next&quot;, Avenir, &quot;Helvetica Neue&quot;, Helvetica, Arial, sans-serif; font-size:17px;'>Schools, </span><span style='font-family:&quot;Avenir Next W01&quot;, &quot;Avenir Next W00&quot;, &quot;Avenir Next&quot;, Avenir, &quot;Helvetica Neue&quot;, Helvetica, Arial, sans-serif; font-size:17px;'>Medical Facilities</span><span style='font-family:&quot;Avenir Next W01&quot;, &quot;Avenir Next W00&quot;, &quot;Avenir Next&quot;, Avenir, &quot;Helvetica Neue&quot;, Helvetica, Arial, sans-serif; font-size:17px;'>, </span><span style='font-family:&quot;Avenir Next W01&quot;, &quot;Avenir Next W00&quot;, &quot;Avenir Next&quot;, Avenir, &quot;Helvetica Neue&quot;, Helvetica, Arial, sans-serif; font-size:17px;'>and Places of Worship) that are ready to use, but not for every type of amenity.</span></div><div style='font-family:&quot;Avenir Next W01&quot;, &quot;Avenir Next W00&quot;, &quot;Avenir Next&quot;, Avenir, &quot;Helvetica Neue&quot;, sans-serif; font-size:16px;'><span style='font-family:&quot;Avenir Next W01&quot;, &quot;Avenir Next W00&quot;, &quot;Avenir Next&quot;, Avenir, &quot;Helvetica Neue&quot;, Helvetica, Arial, sans-serif; font-size:17px;'><br /></span></div><div style='font-family:&quot;Avenir Next W01&quot;, &quot;Avenir Next W00&quot;, &quot;Avenir Next&quot;, Avenir, &quot;Helvetica Neue&quot;, sans-serif; font-size:16px;'><span style='font-family:&quot;Avenir Next W01&quot;, &quot;Avenir Next W00&quot;, &quot;Avenir Next&quot;, Avenir, &quot;Helvetica Neue&quot;, Helvetica, Arial, sans-serif; font-size:17px;'><b><i>Important Note</i></b>: if you do create a new layer, it should be provided under the same Terms of Use and include the same Credits as this layer.  You can copy and paste the Terms of Use and Credits info below in the new Item page as needed.</span></div></div></div></div>",
			"keyword": [
				"osm",
				"amenity",
				"Australia",
				"Oceania",
				"New Zealand",
				"OpenStreetMap",
				"Pacific Region Countries",
				"Pacific Islands",
				"Pacific",
				"islands"
			],
			"issued": "2023-10-06T19:11:11.000Z",
			"modified": "2023-10-16T03:01:14.000Z",
			"publisher": {
				"name": "Pacific GeoPortal - Core Organization"
			},
			"contactPoint": {
				"@type": "vcard:Contact",
				"fn": "dkaragulle_pacificcore",
				"hasEmail": "mailto:pacific_geoportal@esri.com"
			},
			"accessLevel": "public",
			"spatial": "144.0504,-10.2988,149.8402,-5.3646",
			"license": "",
			"distribution": [
				{
					"@type": "dcat:Distribution",
					"title": "ArcGIS Hub Dataset",
					"format": "Web Page",
					"mediaType": "text/html",
					"accessURL": "https://www.pacificgeoportal.com/maps/pacificcore::openstreetmap-amenities-for-pacific-region"
				}
			],
			"theme": [
				"geospatial"
			]
		},
		{
			"@type": "dcat:Dataset",
			"identifier": "https://www.arcgis.com/home/item.html?id=4d964964139f4b01a624e9108907a268",
			"landingPage": "https://www.pacificgeoportal.com/maps/pacificcore::openstreetmap-educational-establishments-for-pacific-region",
			"title": "OpenStreetMap Educational Establishments for Pacific Region",
			"description": "<span style='font-family:&quot;Avenir Next W01&quot;, &quot;Avenir Next W00&quot;, &quot;Avenir Next&quot;, Avenir, &quot;Helvetica Neue&quot;, sans-serif; font-size:17px;'>This webmap is a subset of OpenStreetMap (OSM) <b>educational establishment point </b></span><font style='font-family:&quot;Avenir Next W01&quot;, &quot;Avenir Next W00&quot;, &quot;Avenir Next&quot;, Avenir, &quot;Helvetica Neue&quot;, sans-serif; font-size:16px;'><span style='font-family:inherit; font-size:17px;'><b>data </b>for Australia and Oceania for the Pacific Region, which is </span></font><b>updated every 15 minutes</b><font style='font-family:&quot;Avenir Next W01&quot;, &quot;Avenir Next W00&quot;, &quot;Avenir Next&quot;, Avenir, &quot;Helvetica Neue&quot;, sans-serif; font-size:16px;'><span style='font-family:inherit; font-size:17px;'> with the latest edits.</span></font><b> </b><font style='font-family:&quot;Avenir Next W01&quot;, &quot;Avenir Next W00&quot;, &quot;Avenir Next&quot;, Avenir, &quot;Helvetica Neue&quot;, sans-serif; font-size:16px;'><a href='https://www.arcgis.com/home/item.html?id=af244e4810454ab8baf2768a69deee62' target='_blank' rel='nofollow ugc noopener noreferrer'>You can acceess the source feature service from here. </a><span style='font-family:inherit; font-size:17px;'>This </span></font><a href='https://doc.arcgis.com/en/arcgis-online/share-maps/about-sharing-feature-layer-data-as-copies.htm' style='color:rgb(0, 121, 193); text-decoration-line:none; font-family:&quot;Avenir Next W01&quot;, &quot;Avenir Next W00&quot;, &quot;Avenir Next&quot;, Avenir, &quot;Helvetica Neue&quot;, sans-serif; font-size:16px;' target='_blank' rel='nofollow ugc noopener noreferrer'>hosted feature layer view</a><span style='font-family:&quot;Avenir Next W01&quot;, &quot;Avenir Next W00&quot;, &quot;Avenir Next&quot;, Avenir, &quot;Helvetica Neue&quot;, sans-serif; font-size:17px;'> is referencing a hosted feature layer of OSM point (node) data in ArcGIS Online that is updated with minutely diffs from the OSM planet file.  This feature </span><span style='font-family:&quot;Avenir Next W01&quot;, &quot;Avenir Next W00&quot;, &quot;Avenir Next&quot;, Avenir, &quot;Helvetica Neue&quot;, sans-serif; font-size:17px;'>layer view</span><span style='font-family:&quot;Avenir Next W01&quot;, &quot;Avenir Next W00&quot;, &quot;Avenir Next&quot;, Avenir, &quot;Helvetica Neue&quot;, sans-serif; font-size:17px;'> includes amenity </span><span style='font-family:&quot;Avenir Next W01&quot;, &quot;Avenir Next W00&quot;, &quot;Avenir Next&quot;, Avenir, &quot;Helvetica Neue&quot;, sans-serif; font-size:17px;'>features defined as a query against the hosted feature layer where the <b>a</b></span><span style='font-family:&quot;Avenir Next W01&quot;, &quot;Avenir Next W00&quot;, &quot;Avenir Next&quot;, Avenir, &quot;Helvetica Neue&quot;, sans-serif; font-size:17px;'><b>menity </b>value </span><span style='font-family:&quot;Avenir Next W01&quot;, &quot;Avenir Next W00&quot;, &quot;Avenir Next&quot;, Avenir, &quot;Helvetica Neue&quot;, sans-serif; font-size:17px;'>is any of </span><span style='font-family:&quot;Avenir Next W01&quot;, &quot;Avenir Next W00&quot;, &quot;Avenir Next&quot;, Avenir, &quot;Helvetica Neue&quot;, sans-serif; font-size:17px;'>'</span><span style='font-family:&quot;Avenir Next W01&quot;, &quot;Avenir Next W00&quot;, &quot;Avenir Next&quot;, Avenir, &quot;Helvetica Neue&quot;, sans-serif; font-size:17px;'><b>school</b>', '<b>university</b>', '<b>college</b>', or '</span><span style='font-family:&quot;Avenir Next W01&quot;, &quot;Avenir Next W00&quot;, &quot;Avenir Next&quot;, Avenir, &quot;Helvetica Neue&quot;, sans-serif; font-size:17px;'><b>kindergarten</b>'.</span><div style='font-family:&quot;Avenir Next W01&quot;, &quot;Avenir Next W00&quot;, &quot;Avenir Next&quot;, Avenir, &quot;Helvetica Neue&quot;, sans-serif; font-size:16px;'><span style='font-family:inherit; font-size:17px;'><br /></span><div style='font-family:inherit;'><font style='font-family:inherit;'><span style='font-family:inherit; font-size:17px;'>In OSM, amenities are </span></font><font style='font-family:inherit;'><span style='font-family:inherit; font-size:17px;'><b>useful and important facilities</b> for visitors and residents, such as schools and universities.  These features are identified with an </span></font><a href='https://wiki.openstreetmap.org/wiki/Key:amenity' style='color:rgb(0, 121, 193); text-decoration-line:none; font-family:inherit;' target='_blank' rel='nofollow ugc noopener noreferrer'>amenity tag</a><span style='font-family:inherit; font-size:17px;'>.  </span><span style='font-family:inherit; font-size:17px;'>In OSM, </span><a href='https://wiki.openstreetmap.org/wiki/Tag:amenity%3Dschool' style='color:rgb(0, 121, 193); text-decoration-line:none; font-family:inherit;' target='_blank' rel='nofollow ugc noopener noreferrer'>amenity=school</a><span style='font-family:inherit; font-size:17px;'> is used to identify a place where pupils, normally between the ages of about 6 and 18 are taught under the supervision of teachers. This includes primary and secondary schools. See </span><a href='https://wiki.openstreetmap.org/wiki/Tag:amenity%3Dcollege' style='color:rgb(0, 121, 193); text-decoration-line:none; font-family:inherit;' target='_blank' rel='nofollow ugc noopener noreferrer'>amenity=college</a><span style='font-family:inherit; font-size:17px;'>, </span><a href='https://wiki.openstreetmap.org/wiki/Tag:amenity%3Duniversity' style='color:rgb(0, 121, 193); text-decoration-line:none; font-family:inherit;' target='_blank' rel='nofollow ugc noopener noreferrer'>amenity=university</a>, and <a href='https://wiki.openstreetmap.org/wiki/Tag:amenity%3Dkindergarten' style='color:rgb(0, 121, 193); text-decoration-line:none; font-family:inherit;' target='_blank' rel='nofollow ugc noopener noreferrer'>amenity=kindergarten</a><span style='font-family:inherit; font-size:17px;'> for </span><span style='font-family:inherit; font-size:17px;'>other educational establishments.</span></div><div style='font-family:inherit;'><div style='font-family:inherit;'><span style='font-family:&quot;Avenir Next W01&quot;, &quot;Avenir Next W00&quot;, &quot;Avenir Next&quot;, Avenir, &quot;Helvetica Neue&quot;, Helvetica, Arial, sans-serif; font-size:17px;'><br /></span></div><div style='font-family:inherit;'><span style='font-family:&quot;Avenir Next W01&quot;, &quot;Avenir Next W00&quot;, &quot;Avenir Next&quot;, Avenir, &quot;Helvetica Neue&quot;, Helvetica, Arial, sans-serif; font-size:17px;'>Zoom in to large scales (e.g. </span><span style='font-family:&quot;Avenir Next W01&quot;, &quot;Avenir Next W00&quot;, &quot;Avenir Next&quot;, Avenir, &quot;Helvetica Neue&quot;, Helvetica, Arial, sans-serif; font-size:17px;'>Cities level or 1:160k scale</span><span style='font-family:&quot;Avenir Next W01&quot;, &quot;Avenir Next W00&quot;, &quot;Avenir Next&quot;, Avenir, &quot;Helvetica Neue&quot;, Helvetica, Arial, sans-serif; font-size:17px;'>) to see the educational features display.  </span><span style='font-family:&quot;Avenir Next W01&quot;, &quot;Avenir Next W00&quot;, &quot;Avenir Next&quot;, Avenir, &quot;Helvetica Neue&quot;, Helvetica, Arial, sans-serif; font-size:17px;'>You can click on </span><span style='font-family:&quot;Avenir Next W01&quot;, &quot;Avenir Next W00&quot;, &quot;Avenir Next&quot;, Avenir, &quot;Helvetica Neue&quot;, Helvetica, Arial, sans-serif; font-size:17px;'>a </span><span style='font-family:&quot;Avenir Next W01&quot;, &quot;Avenir Next W00&quot;, &quot;Avenir Next&quot;, Avenir, &quot;Helvetica Neue&quot;, Helvetica, Arial, sans-serif; font-size:17px;'>feature to get the name and any other available attributes of the feature.  The name of the feature will display by default at very large scales (e.g. Building level of 1:2k scale).  Labels can be turned off in your map if you prefer.</span></div></div></div>",
			"keyword": [
				"osm",
				"OpenStreetMap",
				"education",
				"school",
				"university",
				"college",
				"Australia",
				"Oceania"
			],
			"issued": "2023-10-16T01:51:51.000Z",
			"modified": "2023-10-16T01:54:11.000Z",
			"publisher": {
				"name": "Pacific GeoPortal - Core Organization"
			},
			"contactPoint": {
				"@type": "vcard:Contact",
				"fn": "dkaragulle_pacificcore",
				"hasEmail": "mailto:pacific_geoportal@esri.com"
			},
			"accessLevel": "public",
			"spatial": "164.7650,-21.8779,166.2124,-20.7174",
			"license": "https://opendatacommons.org/licenses/odbl/summary",
			"distribution": [
				{
					"@type": "dcat:Distribution",
					"title": "ArcGIS Hub Dataset",
					"format": "Web Page",
					"mediaType": "text/html",
					"accessURL": "https://www.pacificgeoportal.com/maps/pacificcore::openstreetmap-educational-establishments-for-pacific-region"
				}
			],
			"theme": [
				"geospatial"
			]
		},
		{
			"@type": "dcat:Dataset",
			"identifier": "https://www.arcgis.com/home/item.html?id=8943b7592afa4aff9de27d9754deb21e",
			"landingPage": "https://www.pacificgeoportal.com/maps/pacificcore::openstreetmap-tourist-attractions-for-pacific-region",
			"title": "OpenStreetMap Tourist Attractions for Pacific Region",
			"description": "<span style='font-family:&quot;Avenir Next W01&quot;, &quot;Avenir Next W00&quot;, &quot;Avenir Next&quot;, Avenir, &quot;Helvetica Neue&quot;, sans-serif; font-size:17px;'>This webmap is a subset of  OpenStreetMap (OSM) </span><span style='font-family:&quot;Avenir Next W01&quot;, &quot;Avenir Next W00&quot;, &quot;Avenir Next&quot;, Avenir, &quot;Helvetica Neue&quot;, sans-serif; font-size:17px;'><b>tourist attraction point </b></span><font style='font-family:&quot;Avenir Next W01&quot;, &quot;Avenir Next W00&quot;, &quot;Avenir Next&quot;, Avenir, &quot;Helvetica Neue&quot;, sans-serif; font-size:16px;'><span style='font-family:inherit; font-size:17px;'><b>data</b> for Australia and Oceania, which is </span></font><b>updated every 5 minutes</b><font style='font-family:&quot;Avenir Next W01&quot;, &quot;Avenir Next W00&quot;, &quot;Avenir Next&quot;, Avenir, &quot;Helvetica Neue&quot;, sans-serif; font-size:16px;'><span style='font-family:inherit; font-size:17px;'> with the latest edits.</span></font><b> You can access the feature service from </b><a href='https://www.arcgis.com/home/item.html?id=76e2281c81814e8c8c7e6cb1081f4d22' target='_blank' rel='nofollow ugc noopener noreferrer'>here.</a><b> </b><font style='font-family:&quot;Avenir Next W01&quot;, &quot;Avenir Next W00&quot;, &quot;Avenir Next&quot;, Avenir, &quot;Helvetica Neue&quot;, sans-serif; font-size:16px;'><span style='font-family:inherit; font-size:17px;'>This </span></font><a href='https://doc.arcgis.com/en/arcgis-online/share-maps/about-sharing-feature-layer-data-as-copies.htm' style='color:rgb(0, 121, 193); text-decoration-line:none; font-family:&quot;Avenir Next W01&quot;, &quot;Avenir Next W00&quot;, &quot;Avenir Next&quot;, Avenir, &quot;Helvetica Neue&quot;, sans-serif; font-size:16px;' target='_blank' rel='nofollow ugc noopener noreferrer'>hosted feature layer view</a><span style='font-family:&quot;Avenir Next W01&quot;, &quot;Avenir Next W00&quot;, &quot;Avenir Next&quot;, Avenir, &quot;Helvetica Neue&quot;, sans-serif; font-size:17px;'> is referencing a hosted feature layer of OSM point (node) data in ArcGIS Online that is updated with minutely diffs from the OSM planet file.  This feature </span><span style='font-family:&quot;Avenir Next W01&quot;, &quot;Avenir Next W00&quot;, &quot;Avenir Next&quot;, Avenir, &quot;Helvetica Neue&quot;, sans-serif; font-size:17px;'>layer view</span><span style='font-family:&quot;Avenir Next W01&quot;, &quot;Avenir Next W00&quot;, &quot;Avenir Next&quot;, Avenir, &quot;Helvetica Neue&quot;, sans-serif; font-size:17px;'> includes tourism </span><span style='font-family:&quot;Avenir Next W01&quot;, &quot;Avenir Next W00&quot;, &quot;Avenir Next&quot;, Avenir, &quot;Helvetica Neue&quot;, sans-serif; font-size:17px;'>features defined as a query against the hosted feature layer (i.e. tourism is not blank).</span><div style='font-family:&quot;Avenir Next W01&quot;, &quot;Avenir Next W00&quot;, &quot;Avenir Next&quot;, Avenir, &quot;Helvetica Neue&quot;, sans-serif; font-size:16px;'><br /></div><div style='font-family:&quot;Avenir Next W01&quot;, &quot;Avenir Next W00&quot;, &quot;Avenir Next&quot;, Avenir, &quot;Helvetica Neue&quot;, sans-serif; font-size:16px;'><font style='font-family:inherit;'><span style='font-family:inherit;'>In OSM, tourism features are <b>places and things of specific interest to tourists</b> including places to see, places to stay, things and places providing information and support to tourists.  These features are identified with a </span><a href='https://wiki.openstreetmap.org/wiki/Key:tourism' style='color:rgb(0, 121, 193); text-decoration-line:none; font-family:inherit;' target='_blank' rel='nofollow ugc noopener noreferrer'>tourism tag</a><span style='font-family:inherit;'>.  There are hundreds of different tag values used in the OSM database.  In this feature layer, unique symbols are used for several of the most popular tourism types, while lesser used types are grouped in an &quot;other&quot; category.</span></font><br /></div><div style='font-family:&quot;Avenir Next W01&quot;, &quot;Avenir Next W00&quot;, &quot;Avenir Next&quot;, Avenir, &quot;Helvetica Neue&quot;, sans-serif; font-size:16px;'><div style='font-family:inherit;'><span style='font-family:&quot;Avenir Next W01&quot;, &quot;Avenir Next W00&quot;, &quot;Avenir Next&quot;, Avenir, &quot;Helvetica Neue&quot;, Helvetica, Arial, sans-serif; font-size:17px;'><br /></span></div><div style='font-family:inherit;'><span style='font-family:&quot;Avenir Next W01&quot;, &quot;Avenir Next W00&quot;, &quot;Avenir Next&quot;, Avenir, &quot;Helvetica Neue&quot;, Helvetica, Arial, sans-serif; font-size:17px;'>Zoom in to large scales (e.g. Cities level or 1:160k scale) to see the tourism features display.  </span><span style='font-family:&quot;Avenir Next W01&quot;, &quot;Avenir Next W00&quot;, &quot;Avenir Next&quot;, Avenir, &quot;Helvetica Neue&quot;, Helvetica, Arial, sans-serif; font-size:17px;'>You can click on </span><span style='font-family:&quot;Avenir Next W01&quot;, &quot;Avenir Next W00&quot;, &quot;Avenir Next&quot;, Avenir, &quot;Helvetica Neue&quot;, Helvetica, Arial, sans-serif; font-size:17px;'>a </span><span style='font-family:&quot;Avenir Next W01&quot;, &quot;Avenir Next W00&quot;, &quot;Avenir Next&quot;, Avenir, &quot;Helvetica Neue&quot;, Helvetica, Arial, sans-serif; font-size:17px;'>feature to get the name of the tourism feature.  The name of the feature will display by default at very large scales (e.g. Building level of 1:2k scale).  Labels can be turned off in your map if you prefer.</span></div></div><div style='font-family:&quot;Avenir Next W01&quot;, &quot;Avenir Next W00&quot;, &quot;Avenir Next&quot;, Avenir, &quot;Helvetica Neue&quot;, sans-serif; font-size:16px;'><span style='font-family:&quot;Avenir Next W01&quot;, &quot;Avenir Next W00&quot;, &quot;Avenir Next&quot;, Avenir, &quot;Helvetica Neue&quot;, Helvetica, Arial, sans-serif; font-size:17px;'><br /></span></div><div style='font-family:&quot;Avenir Next W01&quot;, &quot;Avenir Next W00&quot;, &quot;Avenir Next&quot;, Avenir, &quot;Helvetica Neue&quot;, sans-serif; font-size:16px;'><span style='font-family:&quot;Avenir Next W01&quot;, &quot;Avenir Next W00&quot;, &quot;Avenir Next&quot;, Avenir, &quot;Helvetica Neue&quot;, Helvetica, Arial, sans-serif; font-size:17px;'><b>Create New Layer</b></span></div><div style='font-family:&quot;Avenir Next W01&quot;, &quot;Avenir Next W00&quot;, &quot;Avenir Next&quot;, Avenir, &quot;Helvetica Neue&quot;, sans-serif; font-size:16px;'><span style='font-family:&quot;Avenir Next W01&quot;, &quot;Avenir Next W00&quot;, &quot;Avenir Next&quot;, Avenir, &quot;Helvetica Neue&quot;, Helvetica, Arial, sans-serif; font-size:17px;'>If you would like to create a more focused version of this tourism layer displaying just one or two tourism types, you can do that easily!  Just add the layer to a map, copy the layer in the content window, add a filter to the new layer (e.g. tourism is ruin), rename the layer as appropriate, and save layer.  You can also change the layer symbols or popup if you like.</span></div><div style='font-family:&quot;Avenir Next W01&quot;, &quot;Avenir Next W00&quot;, &quot;Avenir Next&quot;, Avenir, &quot;Helvetica Neue&quot;, sans-serif; font-size:16px;'><span style='font-family:&quot;Avenir Next W01&quot;, &quot;Avenir Next W00&quot;, &quot;Avenir Next&quot;, Avenir, &quot;Helvetica Neue&quot;, Helvetica, Arial, sans-serif; font-size:17px;'><br /></span></div><div style='font-family:&quot;Avenir Next W01&quot;, &quot;Avenir Next W00&quot;, &quot;Avenir Next&quot;, Avenir, &quot;Helvetica Neue&quot;, sans-serif; font-size:16px;'><span style='font-family:&quot;Avenir Next W01&quot;, &quot;Avenir Next W00&quot;, &quot;Avenir Next&quot;, Avenir, &quot;Helvetica Neue&quot;, Helvetica, Arial, sans-serif; font-size:17px;'><b><i>Important Note</i></b>: if you do create a new layer, it should be provided under the same Terms of Use and include the same Credits as this layer.  You can copy and paste the Terms of Use and Credits info below in the new Item page as needed.</span></div>",
			"keyword": [
				"osm",
				"OpenStreetMap",
				"tourism",
				"Australia",
				"Oceania",
				"tourist attraction"
			],
			"issued": "2023-10-16T01:41:57.000Z",
			"modified": "2023-10-16T01:45:54.000Z",
			"publisher": {
				"name": "Pacific GeoPortal - Core Organization"
			},
			"contactPoint": {
				"@type": "vcard:Contact",
				"fn": "dkaragulle_pacificcore",
				"hasEmail": "mailto:pacific_geoportal@esri.com"
			},
			"accessLevel": "public",
			"spatial": "146.9921,-6.7400,147.0147,-6.7207",
			"license": "https://opendatacommons.org/licenses/odbl/summary",
			"distribution": [
				{
					"@type": "dcat:Distribution",
					"title": "ArcGIS Hub Dataset",
					"format": "Web Page",
					"mediaType": "text/html",
					"accessURL": "https://www.pacificgeoportal.com/maps/pacificcore::openstreetmap-tourist-attractions-for-pacific-region"
				}
			],
			"theme": [
				"geospatial"
			]
		},
		{
			"@type": "dcat:Dataset",
			"identifier": "https://www.arcgis.com/home/item.html?id=7c3dbd2121a84667bfb3477e53628084",
			"landingPage": "https://www.pacificgeoportal.com/maps/pacificcore::open-street-map-medical-facilities-for-pacific-region",
			"title": "Open Street Map Medical Facilities for Pacific Region",
			"description": "<div><span style='font-family:&quot;Avenir Next W01&quot;, &quot;Avenir Next W00&quot;, &quot;Avenir Next&quot;, Avenir, &quot;Helvetica Neue&quot;, sans-serif; font-size:17px;'>This web map is a subset of</span><span style='font-family:&quot;Avenir Next W01&quot;, &quot;Avenir Next W00&quot;, &quot;Avenir Next&quot;, Avenir, &quot;Helvetica Neue&quot;, sans-serif; font-size:17px;'> OpenStreetMap (OSM) </span><b>point </b><font style='font-family:&quot;Avenir Next W01&quot;, &quot;Avenir Next W00&quot;, &quot;Avenir Next&quot;, Avenir, &quot;Helvetica Neue&quot;, sans-serif; font-size:16px;'><span style='font-family:inherit; font-size:17px;'><b>data of medical facilities</b> for Australia and Oceania for the Pacific Region, which is </span></font><b>updated every 15 minutes</b><font style='font-family:&quot;Avenir Next W01&quot;, &quot;Avenir Next W00&quot;, &quot;Avenir Next&quot;, Avenir, &quot;Helvetica Neue&quot;, sans-serif; font-size:16px;'><span style='font-family:inherit; font-size:17px;'> with the latest edits.</span></font><b> </b><a href='https://www.arcgis.com/home/item.html?id=8cf16523599849fa8aa9a93c4c3122f1' target='_blank' rel='nofollow ugc noopener noreferrer'>You can access the Source Feature Service from here.</a><b> </b><font style='font-family:&quot;Avenir Next W01&quot;, &quot;Avenir Next W00&quot;, &quot;Avenir Next&quot;, Avenir, &quot;Helvetica Neue&quot;, sans-serif; font-size:16px;'><span style='font-family:inherit; font-size:17px;'>This </span></font><a href='https://doc.arcgis.com/en/arcgis-online/share-maps/about-sharing-feature-layer-data-as-copies.htm' style='font-family:&quot;Avenir Next W01&quot;, &quot;Avenir Next W00&quot;, &quot;Avenir Next&quot;, Avenir, &quot;Helvetica Neue&quot;, sans-serif; color:rgb(0, 121, 193); text-decoration-line:none; font-size:16px;' target='_blank' rel='nofollow ugc noopener noreferrer'>hosted feature layer view</a><span style='font-family:&quot;Avenir Next W01&quot;, &quot;Avenir Next W00&quot;, &quot;Avenir Next&quot;, Avenir, &quot;Helvetica Neue&quot;, sans-serif; font-size:17px;'> is referencing a hosted feature layer of OSM point (node) data in ArcGIS Online that is updated with minutely diffs from the OSM planet file.  This feature </span><span style='font-family:&quot;Avenir Next W01&quot;, &quot;Avenir Next W00&quot;, &quot;Avenir Next&quot;, Avenir, &quot;Helvetica Neue&quot;, sans-serif; font-size:17px;'>layer view</span><span style='font-family:&quot;Avenir Next W01&quot;, &quot;Avenir Next W00&quot;, &quot;Avenir Next&quot;, Avenir, &quot;Helvetica Neue&quot;, sans-serif; font-size:17px;'> includes amenity </span><span style='font-family:&quot;Avenir Next W01&quot;, &quot;Avenir Next W00&quot;, &quot;Avenir Next&quot;, Avenir, &quot;Helvetica Neue&quot;, sans-serif; font-size:17px;'>features defined as a query against the hosted feature layer where the </span><b>a</b><b>menity </b><span style='font-family:&quot;Avenir Next W01&quot;, &quot;Avenir Next W00&quot;, &quot;Avenir Next&quot;, Avenir, &quot;Helvetica Neue&quot;, sans-serif; font-size:17px;'>value is any of '</span><b>hospital</b><span style='font-family:&quot;Avenir Next W01&quot;, &quot;Avenir Next W00&quot;, &quot;Avenir Next&quot;, Avenir, &quot;Helvetica Neue&quot;, sans-serif; font-size:17px;'>', '</span><b>clinic</b><span style='font-family:&quot;Avenir Next W01&quot;, &quot;Avenir Next W00&quot;, &quot;Avenir Next&quot;, Avenir, &quot;Helvetica Neue&quot;, sans-serif; font-size:17px;'>', '</span><b>doctors</b><span style='font-family:&quot;Avenir Next W01&quot;, &quot;Avenir Next W00&quot;, &quot;Avenir Next&quot;, Avenir, &quot;Helvetica Neue&quot;, sans-serif; font-size:17px;'>', or '</span><b>pharmacy</b><span style='font-family:&quot;Avenir Next W01&quot;, &quot;Avenir Next W00&quot;, &quot;Avenir Next&quot;, Avenir, &quot;Helvetica Neue&quot;, sans-serif; font-size:17px;'>'.</span></div><div style='font-family:&quot;Avenir Next W01&quot;, &quot;Avenir Next W00&quot;, &quot;Avenir Next&quot;, Avenir, &quot;Helvetica Neue&quot;, sans-serif; font-size:16px;'><span style='font-family:inherit; font-size:17px;'><br /></span><div style='font-family:inherit;'><font style='font-family:inherit;'><span style='font-family:inherit; font-size:17px;'>In OSM, amenities are </span></font><font style='font-family:inherit;'><span style='font-family:inherit; font-size:17px;'><b>useful and important facilities</b> for visitors and residents, such as hospitals and clinics.  These features are identified with an </span></font><a href='https://wiki.openstreetmap.org/wiki/Key:amenity' style='color:rgb(0, 121, 193); text-decoration-line:none; font-family:inherit;' target='_blank' rel='nofollow ugc noopener noreferrer'>amenity tag</a><font style='font-family:inherit;'><span style='font-family:inherit; font-size:17px;'>.  There are thousands of different tag values used in the OSM database.  In this feature layer, unique symbols are used for the most common amenity tags used for medical facilities.<br /></span></font><div style='font-family:inherit;'><span style='font-family:&quot;Avenir Next W01&quot;, &quot;Avenir Next W00&quot;, &quot;Avenir Next&quot;, Avenir, &quot;Helvetica Neue&quot;, Helvetica, Arial, sans-serif; font-size:17px;'><br /></span></div><div style='font-family:inherit;'><span style='font-family:&quot;Avenir Next W01&quot;, &quot;Avenir Next W00&quot;, &quot;Avenir Next&quot;, Avenir, &quot;Helvetica Neue&quot;, Helvetica, Arial, sans-serif; font-size:17px;'>Zoom in to large scales (e.g. </span><span style='font-family:&quot;Avenir Next W01&quot;, &quot;Avenir Next W00&quot;, &quot;Avenir Next&quot;, Avenir, &quot;Helvetica Neue&quot;, Helvetica, Arial, sans-serif; font-size:17px;'>Neighborhood level or 1:20k scale</span><span style='font-family:&quot;Avenir Next W01&quot;, &quot;Avenir Next W00&quot;, &quot;Avenir Next&quot;, Avenir, &quot;Helvetica Neue&quot;, Helvetica, Arial, sans-serif; font-size:17px;'>) to see the amenity features display.  </span><span style='font-family:&quot;Avenir Next W01&quot;, &quot;Avenir Next W00&quot;, &quot;Avenir Next&quot;, Avenir, &quot;Helvetica Neue&quot;, Helvetica, Arial, sans-serif; font-size:17px;'>You can click on a feature to get the name of the amenity.  The name of the amenity will display by default at very large scales (e.g. Building level of 1:2k scale).  Labels can be turned off in your map if you prefer.</span></div></div><div style='font-family:inherit;'><span style='font-family:&quot;Avenir Next W01&quot;, &quot;Avenir Next W00&quot;, &quot;Avenir Next&quot;, Avenir, &quot;Helvetica Neue&quot;, Helvetica, Arial, sans-serif; font-size:17px;'><br /></span></div><div style='font-family:inherit;'><span style='font-family:&quot;Avenir Next W01&quot;, &quot;Avenir Next W00&quot;, &quot;Avenir Next&quot;, Avenir, &quot;Helvetica Neue&quot;, Helvetica, Arial, sans-serif; font-size:17px;'><b>Create New Layer</b></span></div><div style='font-family:inherit;'><span style='font-family:&quot;Avenir Next W01&quot;, &quot;Avenir Next W00&quot;, &quot;Avenir Next&quot;, Avenir, &quot;Helvetica Neue&quot;, Helvetica, Arial, sans-serif; font-size:17px;'>If you would like to create a more focused version of this medical facilities layer displaying just one or two amenity types, you can do that easily!  Just add the layer to a map, copy the layer in the content window, add a filter to the new layer (e.g. amenity is hospital), rename the layer as appropriate, and save layer.  You can also change the layer symbols or popup if you like.  Esri will publish a few such layers (e.g. Places of Worship, Schools, and Parking) that are ready to use, but not for every type of amenity.</span></div><div style='font-family:inherit;'><span style='font-family:&quot;Avenir Next W01&quot;, &quot;Avenir Next W00&quot;, &quot;Avenir Next&quot;, Avenir, &quot;Helvetica Neue&quot;, Helvetica, Arial, sans-serif; font-size:17px;'><br /></span></div><div style='font-family:inherit;'><span style='font-family:&quot;Avenir Next W01&quot;, &quot;Avenir Next W00&quot;, &quot;Avenir Next&quot;, Avenir, &quot;Helvetica Neue&quot;, Helvetica, Arial, sans-serif; font-size:17px;'><b><i>Important Note</i></b>: if you do create a new layer, it should be provided under the same Terms of Use and include the same Credits as this layer.  You can copy and paste the Terms of Use and Credits info below in the new Item page as needed.</span></div></div>",
			"keyword": [
				"osm",
				"OpenStreetMap",
				"medical",
				"Australia",
				"Oceania",
				"hospital",
				"clinic",
				"doctor"
			],
			"issued": "2023-10-16T01:35:34.000Z",
			"modified": "2023-10-16T01:38:58.000Z",
			"publisher": {
				"name": "Pacific GeoPortal - Core Organization"
			},
			"contactPoint": {
				"@type": "vcard:Contact",
				"fn": "dkaragulle_pacificcore",
				"hasEmail": "mailto:pacific_geoportal@esri.com"
			},
			"accessLevel": "public",
			"spatial": "141.9324,-12.7608,153.5120,-2.9018",
			"license": "https://opendatacommons.org/licenses/odbl/summary",
			"distribution": [
				{
					"@type": "dcat:Distribution",
					"title": "ArcGIS Hub Dataset",
					"format": "Web Page",
					"mediaType": "text/html",
					"accessURL": "https://www.pacificgeoportal.com/maps/pacificcore::open-street-map-medical-facilities-for-pacific-region"
				}
			],
			"theme": [
				"geospatial"
			]
		},
		{
			"@type": "dcat:Dataset",
			"identifier": "https://www.arcgis.com/home/item.html?id=abbe0e25af124f0d9e68ca394f9dd590",
			"landingPage": "https://www.pacificgeoportal.com/maps/pacificcore::fiji-demographic-map",
			"title": "Fiji Demographic Map",
			"description": "",
			"keyword": [
				"geoportal",
				"fiji",
				"demographics"
			],
			"issued": "2023-09-27T07:48:34.000Z",
			"modified": "2023-10-11T08:45:54.000Z",
			"publisher": {
				"name": "Pacific GeoPortal - Core Organization"
			},
			"contactPoint": {
				"@type": "vcard:Contact",
				"fn": "klevy_pacificcore",
				"hasEmail": "mailto:pacific_geoportal@esri.com"
			},
			"accessLevel": "public",
			"spatial": "174.0929,-21.3549,180.0000,-11.8932",
			"license": "",
			"distribution": [
				{
					"@type": "dcat:Distribution",
					"title": "ArcGIS Hub Dataset",
					"format": "Web Page",
					"mediaType": "text/html",
					"accessURL": "https://www.pacificgeoportal.com/maps/pacificcore::fiji-demographic-map"
				}
			],
			"theme": [
				"geospatial"
			]
		},
		{
			"@type": "dcat:Dataset",
			"identifier": "https://www.arcgis.com/home/item.html?id=a0e2c75347e24503ade769f2ae2043ae",
			"landingPage": "https://www.pacificgeoportal.com/maps/pacificcore::openstreetmap-shops-for-pacific-regions",
			"title": "OpenStreetMap Shops for Pacific Regions",
			"description": "{{description}}",
			"keyword": [],
			"issued": "2023-10-09T18:08:41.000Z",
			"modified": "2023-10-09T18:08:41.000Z",
			"publisher": {
				"name": "Pacific GeoPortal - Core Organization"
			},
			"contactPoint": {
				"@type": "vcard:Contact",
				"fn": "dkaragulle_pacificcore",
				"hasEmail": "mailto:pacific_geoportal@esri.com"
			},
			"accessLevel": "public",
			"spatial": "143.9551,-10.8334,152.8650,-3.9356",
			"license": "",
			"distribution": [
				{
					"@type": "dcat:Distribution",
					"title": "ArcGIS Hub Dataset",
					"format": "Web Page",
					"mediaType": "text/html",
					"accessURL": "https://www.pacificgeoportal.com/maps/pacificcore::openstreetmap-shops-for-pacific-regions"
				}
			],
			"theme": [
				"geospatial"
			]
		},
		{
			"@type": "dcat:Dataset",
			"identifier": "https://www.arcgis.com/home/item.html?id=555a39caf70d49da82d8f3fb04353d20",
			"landingPage": "https://www.pacificgeoportal.com/maps/pacificcore::openstreetmap-pois-for-pacific-region",
			"title": "OpenStreetMap POIs for Pacific Region",
			"description": "<span style='font-family:&quot;Avenir Next W01&quot;, &quot;Avenir Next W00&quot;, &quot;Avenir Next&quot;, Avenir, &quot;Helvetica Neue&quot;, sans-serif; font-size:17px;'>This webmap is a subset of </span><a href='https://www.arcgis.com/home/item.html?id=743db182392a47c5a7231fbab9a43b91' target='_blank' rel='nofollow ugc noopener noreferrer'>OpenStreetMap (OSM) point of interest (POI) data for Australia and Oceania feature service </a><span style='font-family:&quot;Avenir Next W01&quot;, &quot;Avenir Next W00&quot;, &quot;Avenir Next&quot;, Avenir, &quot;Helvetica Neue&quot;, sans-serif; font-size:17px;'>for the Pacific Region. </span><span style='font-family:&quot;Avenir Next W01&quot;, &quot;Avenir Next W00&quot;, &quot;Avenir Next&quot;, Avenir, &quot;Helvetica Neue&quot;, sans-serif; font-size:17px;'>The feature layer provides access to OpenStreetMap (OSM) point of interest (</span><span style='font-family:&quot;Avenir Next W01&quot;, &quot;Avenir Next W00&quot;, &quot;Avenir Next&quot;, Avenir, &quot;Helvetica Neue&quot;, sans-serif; font-size:17px;'>POI) </span><span style='font-family:&quot;Avenir Next W01&quot;, &quot;Avenir Next W00&quot;, &quot;Avenir Next&quot;, Avenir, &quot;Helvetica Neue&quot;, sans-serif; font-size:17px;'>data for Australia and Oceania, which is <b>updated every 1-2 minutes</b> with the latest edits<b>.</b> This </span><a href='https://doc.arcgis.com/en/arcgis-online/share-maps/about-sharing-feature-layer-data-as-copies.htm' style='color:rgb(0, 121, 193); text-decoration-line:none; font-family:&quot;Avenir Next W01&quot;, &quot;Avenir Next W00&quot;, &quot;Avenir Next&quot;, Avenir, &quot;Helvetica Neue&quot;, sans-serif; font-size:16px;' target='_blank' rel='nofollow ugc noopener noreferrer'>hosted feature layer view</a><span style='font-family:&quot;Avenir Next W01&quot;, &quot;Avenir Next W00&quot;, &quot;Avenir Next&quot;, Avenir, &quot;Helvetica Neue&quot;, sans-serif; font-size:17px;'> is referencing a hosted feature layer of OSM point (node) data in ArcGIS Online that is updated with minutely diffs from the OSM planet file. The layer includes POIs with a large number of tags, including </span><a href='https://wiki.openstreetmap.org/wiki/Key:amenity' style='color:rgb(0, 121, 193); text-decoration-line:none; font-family:inherit; font-size:16px;' target='_blank' rel='nofollow ugc noopener noreferrer'>amenity</a><span style='font-family:&quot;Avenir Next W01&quot;, &quot;Avenir Next W00&quot;, &quot;Avenir Next&quot;, Avenir, &quot;Helvetica Neue&quot;, sans-serif; font-size:16px;'>, </span><font style='font-family:inherit; font-size:16px;'><font style='font-family:inherit;'><a href='https://wiki.openstreetmap.org/wiki/Key:shop' style='color:rgb(0, 121, 193); text-decoration-line:none; font-family:inherit;' target='_blank' rel='nofollow ugc noopener noreferrer'>shop</a>,<span style='font-family:inherit;'> </span></font></font><a href='https://wiki.openstreetmap.org/wiki/Key:tourism' style='color:rgb(0, 121, 193); text-decoration-line:none; font-family:inherit; font-size:16px;' target='_blank' rel='nofollow ugc noopener noreferrer'>tourism</a><span style='font-family:&quot;Avenir Next W01&quot;, &quot;Avenir Next W00&quot;, &quot;Avenir Next&quot;, Avenir, &quot;Helvetica Neue&quot;, sans-serif; font-size:17px;'>, and several more.</span><div style='font-family:&quot;Avenir Next W01&quot;, &quot;Avenir Next W00&quot;, &quot;Avenir Next&quot;, Avenir, &quot;Helvetica Neue&quot;, sans-serif; font-size:16px;'><div style='font-family:inherit;'><span style='font-family:&quot;Avenir Next W01&quot;, &quot;Avenir Next W00&quot;, &quot;Avenir Next&quot;, Avenir, &quot;Helvetica Neue&quot;, Helvetica, Arial, sans-serif; font-size:17px;'><br /></span></div><div style='font-family:inherit;'><span style='font-family:&quot;Avenir Next W01&quot;, &quot;Avenir Next W00&quot;, &quot;Avenir Next&quot;, Avenir, &quot;Helvetica Neue&quot;, Helvetica, Arial, sans-serif; font-size:17px;'>Zoom in to large scales (e.g. City level or 1:80k scale) to see the POI features display.  </span><span style='font-family:&quot;Avenir Next W01&quot;, &quot;Avenir Next W00&quot;, &quot;Avenir Next&quot;, Avenir, &quot;Helvetica Neue&quot;, Helvetica, Arial, sans-serif; font-size:17px;'>You can click on the feature to get the name of the POI.  The name of the POI will display by default at very large scales (e.g. Building level of 1:2k scale).  Labels can be turned off in your map if you prefer.</span></div></div><div style='font-family:&quot;Avenir Next W01&quot;, &quot;Avenir Next W00&quot;, &quot;Avenir Next&quot;, Avenir, &quot;Helvetica Neue&quot;, sans-serif; font-size:16px;'><span style='font-family:&quot;Avenir Next W01&quot;, &quot;Avenir Next W00&quot;, &quot;Avenir Next&quot;, Avenir, &quot;Helvetica Neue&quot;, Helvetica, Arial, sans-serif; font-size:17px;'><br /></span></div><div style='font-family:&quot;Avenir Next W01&quot;, &quot;Avenir Next W00&quot;, &quot;Avenir Next&quot;, Avenir, &quot;Helvetica Neue&quot;, sans-serif; font-size:16px;'><span style='font-family:&quot;Avenir Next W01&quot;, &quot;Avenir Next W00&quot;, &quot;Avenir Next&quot;, Avenir, &quot;Helvetica Neue&quot;, Helvetica, Arial, sans-serif; font-size:17px;'><b>Create New Layer</b></span></div><div style='font-family:&quot;Avenir Next W01&quot;, &quot;Avenir Next W00&quot;, &quot;Avenir Next&quot;, Avenir, &quot;Helvetica Neue&quot;, sans-serif; font-size:16px;'><span style='font-family:&quot;Avenir Next W01&quot;, &quot;Avenir Next W00&quot;, &quot;Avenir Next&quot;, Avenir, &quot;Helvetica Neue&quot;, Helvetica, Arial, sans-serif; font-size:17px;'>If you would like to create a more focused version of this POI layer displaying just one or two types, you can do that easily!  Just add the layer to a map, copy the layer in the content window, add a filter to the new layer (e.g. amenity is bar or shop is alcohol), rename the layer as appropriate, and save layer.  You can also change the layer symbols or popup if you like.  Esri may publish a few such layers that are ready to use, but not for every type of amenity.</span></div><div style='font-family:&quot;Avenir Next W01&quot;, &quot;Avenir Next W00&quot;, &quot;Avenir Next&quot;, Avenir, &quot;Helvetica Neue&quot;, sans-serif; font-size:16px;'><span style='font-family:&quot;Avenir Next W01&quot;, &quot;Avenir Next W00&quot;, &quot;Avenir Next&quot;, Avenir, &quot;Helvetica Neue&quot;, Helvetica, Arial, sans-serif; font-size:17px;'><br /></span></div><div style='font-family:&quot;Avenir Next W01&quot;, &quot;Avenir Next W00&quot;, &quot;Avenir Next&quot;, Avenir, &quot;Helvetica Neue&quot;, sans-serif; font-size:16px;'><span style='font-family:&quot;Avenir Next W01&quot;, &quot;Avenir Next W00&quot;, &quot;Avenir Next&quot;, Avenir, &quot;Helvetica Neue&quot;, Helvetica, Arial, sans-serif; font-size:17px;'><b><i>Important Note</i></b>: if you do create a new layer, it should be provided under the same Terms of Use and include the same Credits as this layer.  You can copy and paste the Terms of Use and Credits info below in the new Item page as needed.</span></div>",
			"keyword": [
				"osm",
				"OpenStreetMap",
				"POI",
				"Australia",
				"Oceania",
				"Points of Interest",
				"Pacific Region"
			],
			"issued": "2023-10-09T18:02:04.000Z",
			"modified": "2023-10-09T18:05:06.000Z",
			"publisher": {
				"name": "Pacific GeoPortal - Core Organization"
			},
			"contactPoint": {
				"@type": "vcard:Contact",
				"fn": "dkaragulle_pacificcore",
				"hasEmail": "mailto:pacific_geoportal@esri.com"
			},
			"accessLevel": "public",
			"spatial": "146.6266,-7.2589,147.7404,-6.3951",
			"license": "https://opendatacommons.org/licenses/odbl/summary",
			"distribution": [
				{
					"@type": "dcat:Distribution",
					"title": "ArcGIS Hub Dataset",
					"format": "Web Page",
					"mediaType": "text/html",
					"accessURL": "https://www.pacificgeoportal.com/maps/pacificcore::openstreetmap-pois-for-pacific-region"
				}
			],
			"theme": [
				"geospatial"
			]
		},
		{
			"@type": "dcat:Dataset",
			"identifier": "https://www.arcgis.com/home/item.html?id=b643dd74acd4466cb50c14b00f15cab1",
			"landingPage": "https://www.pacificgeoportal.com/maps/pacificcore::openstreetmap-leisure-areas-for-pacific-region",
			"title": "OpenStreetMap Leisure Areas for Pacific Region",
			"description": "<div><span style='font-family:&quot;Avenir Next W01&quot;, &quot;Avenir Next W00&quot;, &quot;Avenir Next&quot;, Avenir, &quot;Helvetica Neue&quot;, sans-serif; font-size:17px;'>This WebMap is a subset of </span><font style='font-family:&quot;Avenir Next W01&quot;, &quot;Avenir Next W00&quot;, &quot;Avenir Next&quot;, Avenir, &quot;Helvetica Neue&quot;, sans-serif; font-size:16px;'><a href='https://www.arcgis.com/home/item.html?id=b0ee523c77d446f293c5e6964b23e6f5' target='_blank' rel='nofollow ugc noopener noreferrer'>OpenStreetMap (OSM) leisure areas data for Australia and Oceania Feature Service </a><span style='font-family:inherit; font-size:17px;'>for Pacific Region. </span></font></div><span style='font-family:&quot;Avenir Next W01&quot;, &quot;Avenir Next W00&quot;, &quot;Avenir Next&quot;, Avenir, &quot;Helvetica Neue&quot;, sans-serif; font-size:17px;'><div><span style='font-family:&quot;Avenir Next W01&quot;, &quot;Avenir Next W00&quot;, &quot;Avenir Next&quot;, Avenir, &quot;Helvetica Neue&quot;, sans-serif; font-size:17px;'><br /></span></div>This feature layer provides access to OpenStreetMap (OSM) </span><span style='font-family:&quot;Avenir Next W01&quot;, &quot;Avenir Next W00&quot;, &quot;Avenir Next&quot;, Avenir, &quot;Helvetica Neue&quot;, sans-serif; font-size:17px;'>leisure areas </span><font style='font-family:&quot;Avenir Next W01&quot;, &quot;Avenir Next W00&quot;, &quot;Avenir Next&quot;, Avenir, &quot;Helvetica Neue&quot;, sans-serif; font-size:16px;'><span style='font-family:inherit; font-size:17px;'>data for Australia and Oceania, which is </span></font><b>updated every 15 minutes</b><font style='font-family:&quot;Avenir Next W01&quot;, &quot;Avenir Next W00&quot;, &quot;Avenir Next&quot;, Avenir, &quot;Helvetica Neue&quot;, sans-serif; font-size:16px;'><span style='font-family:inherit; font-size:17px;'> with the latest edits so as this WebMap. This </span></font><a href='https://doc.arcgis.com/en/arcgis-online/share-maps/about-sharing-feature-layer-data-as-copies.htm' style='color:rgb(0, 121, 193); text-decoration-line:none; font-family:&quot;Avenir Next W01&quot;, &quot;Avenir Next W00&quot;, &quot;Avenir Next&quot;, Avenir, &quot;Helvetica Neue&quot;, sans-serif; font-size:16px;' target='_blank' rel='nofollow ugc noopener noreferrer'>hosted feature layer view</a><span style='font-family:&quot;Avenir Next W01&quot;, &quot;Avenir Next W00&quot;, &quot;Avenir Next&quot;, Avenir, &quot;Helvetica Neue&quot;, sans-serif; font-size:17px;'> is referencing a hosted feature layer of OSM polygon (closed way) data in ArcGIS Online that is updated with minutely diffs from the OSM planet file.  This feature </span><span style='font-family:&quot;Avenir Next W01&quot;, &quot;Avenir Next W00&quot;, &quot;Avenir Next&quot;, Avenir, &quot;Helvetica Neue&quot;, sans-serif; font-size:17px;'>layer view</span><span style='font-family:&quot;Avenir Next W01&quot;, &quot;Avenir Next W00&quot;, &quot;Avenir Next&quot;, Avenir, &quot;Helvetica Neue&quot;, sans-serif; font-size:17px;'> includes leisure </span><span style='font-family:&quot;Avenir Next W01&quot;, &quot;Avenir Next W00&quot;, &quot;Avenir Next&quot;, Avenir, &quot;Helvetica Neue&quot;, sans-serif; font-size:17px;'>features defined as a query against the hosted feature layer (i.e. </span><span style='font-family:&quot;Avenir Next W01&quot;, &quot;Avenir Next W00&quot;, &quot;Avenir Next&quot;, Avenir, &quot;Helvetica Neue&quot;, sans-serif; font-size:17px;'>leisure </span><span style='font-family:&quot;Avenir Next W01&quot;, &quot;Avenir Next W00&quot;, &quot;Avenir Next&quot;, Avenir, &quot;Helvetica Neue&quot;, sans-serif; font-size:17px;'>is not blank).</span><div style='font-family:&quot;Avenir Next W01&quot;, &quot;Avenir Next W00&quot;, &quot;Avenir Next&quot;, Avenir, &quot;Helvetica Neue&quot;, sans-serif; font-size:16px;'><font style='font-family:inherit;'><span style='font-family:inherit; font-size:17px;'><br /></span></font></div><div style='font-family:&quot;Avenir Next W01&quot;, &quot;Avenir Next W00&quot;, &quot;Avenir Next&quot;, Avenir, &quot;Helvetica Neue&quot;, sans-serif; font-size:16px;'><font style='font-family:inherit;'><span style='font-family:inherit; font-size:17px;'>In OSM, a </span></font><font style='font-family:inherit;'><font style='font-family:inherit;'><font style='font-family:inherit;'><span style='font-family:inherit; font-size:17px;'>leisure area </span><span style='font-family:inherit; font-size:17px;'>is a </span></font><font style='font-family:inherit;'><font style='font-family:inherit;'><span style='font-family:inherit; font-size:17px;'>place where people go in their spare time</span></font><font style='font-family:inherit;'><span style='font-family:inherit; font-size:17px;'>.  These features are identified with a </span></font></font></font></font><font style='font-family:inherit;'><a href='https://wiki.openstreetmap.org/wiki/Key:leisure' style='color:rgb(0, 121, 193); text-decoration-line:none; font-family:inherit;' target='_blank' rel='nofollow ugc noopener noreferrer'>leisure tag</a><font style='font-family:inherit;'><span style='font-family:inherit; font-size:17px;'>.  There are thousands of different tag values for </span></font><span style='font-family:inherit; font-size:17px;'>leisure </span><font style='font-family:inherit;'><span style='font-family:inherit; font-size:17px;'>used in the OSM database.  In this feature layer, unique symbols are used for several of the most popular </span></font><span style='font-family:inherit; font-size:17px;'>leisure </span><font style='font-family:inherit;'><span style='font-family:inherit; font-size:17px;'>types, while lesser used types are grouped in an &quot;other&quot; category.</span></font><br /></font><div style='font-family:inherit;'><span style='font-family:&quot;Avenir Next W01&quot;, &quot;Avenir Next W00&quot;, &quot;Avenir Next&quot;, Avenir, &quot;Helvetica Neue&quot;, Helvetica, Arial, sans-serif; font-size:17px;'><br /></span></div><div style='font-family:inherit;'><span style='font-family:&quot;Avenir Next W01&quot;, &quot;Avenir Next W00&quot;, &quot;Avenir Next&quot;, Avenir, &quot;Helvetica Neue&quot;, Helvetica, Arial, sans-serif; font-size:17px;'>Zoom in to large scales (e.g. </span><span style='font-family:&quot;Avenir Next W01&quot;, &quot;Avenir Next W00&quot;, &quot;Avenir Next&quot;, Avenir, &quot;Helvetica Neue&quot;, Helvetica, Arial, sans-serif; font-size:17px;'>City level or 1:80k scale</span><span style='font-family:&quot;Avenir Next W01&quot;, &quot;Avenir Next W00&quot;, &quot;Avenir Next&quot;, Avenir, &quot;Helvetica Neue&quot;, Helvetica, Arial, sans-serif; font-size:17px;'>) to see the </span><span style='font-family:&quot;Avenir Next&quot;, Avenir, &quot;Helvetica Neue&quot;, Helvetica, Arial, sans-serif; font-size:17px;'>leisure area </span><span style='font-family:&quot;Avenir Next W01&quot;, &quot;Avenir Next W00&quot;, &quot;Avenir Next&quot;, Avenir, &quot;Helvetica Neue&quot;, Helvetica, Arial, sans-serif; font-size:17px;'>features display.  </span><span style='font-family:&quot;Avenir Next W01&quot;, &quot;Avenir Next W00&quot;, &quot;Avenir Next&quot;, Avenir, &quot;Helvetica Neue&quot;, Helvetica, Arial, sans-serif; font-size:17px;'>You can click on a feature to get the name of the </span><span style='font-family:&quot;Avenir Next&quot;, Avenir, &quot;Helvetica Neue&quot;, Helvetica, Arial, sans-serif; font-size:17px;'>leisure area </span><span style='font-family:&quot;Avenir Next W01&quot;, &quot;Avenir Next W00&quot;, &quot;Avenir Next&quot;, Avenir, &quot;Helvetica Neue&quot;, Helvetica, Arial, sans-serif; font-size:17px;'>(if available).  The name of the </span><span style='font-family:&quot;Avenir Next&quot;, Avenir, &quot;Helvetica Neue&quot;, Helvetica, Arial, sans-serif; font-size:17px;'>leisure area </span><span style='font-family:&quot;Avenir Next W01&quot;, &quot;Avenir Next W00&quot;, &quot;Avenir Next&quot;, Avenir, &quot;Helvetica Neue&quot;, Helvetica, Arial, sans-serif; font-size:17px;'>will display by default at large scales (e.g. Street level of 1:5k scale).  Labels can be turned off in your map if you prefer.</span></div></div><div style='font-family:&quot;Avenir Next W01&quot;, &quot;Avenir Next W00&quot;, &quot;Avenir Next&quot;, Avenir, &quot;Helvetica Neue&quot;, sans-serif; font-size:16px;'><span style='font-family:&quot;Avenir Next W01&quot;, &quot;Avenir Next W00&quot;, &quot;Avenir Next&quot;, Avenir, &quot;Helvetica Neue&quot;, Helvetica, Arial, sans-serif; font-size:17px;'><br /></span></div><div style='font-family:&quot;Avenir Next W01&quot;, &quot;Avenir Next W00&quot;, &quot;Avenir Next&quot;, Avenir, &quot;Helvetica Neue&quot;, sans-serif; font-size:16px;'><span style='font-family:&quot;Avenir Next W01&quot;, &quot;Avenir Next W00&quot;, &quot;Avenir Next&quot;, Avenir, &quot;Helvetica Neue&quot;, Helvetica, Arial, sans-serif; font-size:17px;'><b>Create New Layer</b></span></div><div style='font-family:&quot;Avenir Next W01&quot;, &quot;Avenir Next W00&quot;, &quot;Avenir Next&quot;, Avenir, &quot;Helvetica Neue&quot;, sans-serif; font-size:16px;'><span style='font-family:&quot;Avenir Next W01&quot;, &quot;Avenir Next W00&quot;, &quot;Avenir Next&quot;, Avenir, &quot;Helvetica Neue&quot;, Helvetica, Arial, sans-serif; font-size:17px;'>If you would like to create a more focused version of this </span><span style='font-family:&quot;Avenir Next&quot;, Avenir, &quot;Helvetica Neue&quot;, Helvetica, Arial, sans-serif; font-size:17px;'>leisure areas </span><span style='font-family:&quot;Avenir Next W01&quot;, &quot;Avenir Next W00&quot;, &quot;Avenir Next&quot;, Avenir, &quot;Helvetica Neue&quot;, Helvetica, Arial, sans-serif; font-size:17px;'>layer displaying just one or two </span><span style='font-family:&quot;Avenir Next&quot;, Avenir, &quot;Helvetica Neue&quot;, Helvetica, Arial, sans-serif; font-size:17px;'>leisure </span><span style='font-family:&quot;Avenir Next W01&quot;, &quot;Avenir Next W00&quot;, &quot;Avenir Next&quot;, Avenir, &quot;Helvetica Neue&quot;, Helvetica, Arial, sans-serif; font-size:17px;'>types, you can do that easily!  Just add the layer to a map, copy the layer in the content window, add a filter to the new layer (e.g. </span><span style='font-family:&quot;Avenir Next&quot;, Avenir, &quot;Helvetica Neue&quot;, Helvetica, Arial, sans-serif; font-size:17px;'>leisure </span><span style='font-family:&quot;Avenir Next W01&quot;, &quot;Avenir Next W00&quot;, &quot;Avenir Next&quot;, Avenir, &quot;Helvetica Neue&quot;, Helvetica, Arial, sans-serif; font-size:17px;'>is stadium), rename the layer as appropriate, and save layer.  You can also change the layer symbols or popup if you like.  Esri may publish a few such layers (e.g. parks) that are ready to use, but not for every type of </span><span style='font-family:&quot;Avenir Next&quot;, Avenir, &quot;Helvetica Neue&quot;, Helvetica, Arial, sans-serif; font-size:17px;'>leisure area</span><span style='font-family:&quot;Avenir Next W01&quot;, &quot;Avenir Next W00&quot;, &quot;Avenir Next&quot;, Avenir, &quot;Helvetica Neue&quot;, Helvetica, Arial, sans-serif; font-size:17px;'>.</span></div><div style='font-family:&quot;Avenir Next W01&quot;, &quot;Avenir Next W00&quot;, &quot;Avenir Next&quot;, Avenir, &quot;Helvetica Neue&quot;, sans-serif; font-size:16px;'><span style='font-family:&quot;Avenir Next W01&quot;, &quot;Avenir Next W00&quot;, &quot;Avenir Next&quot;, Avenir, &quot;Helvetica Neue&quot;, Helvetica, Arial, sans-serif; font-size:17px;'><br /></span></div><div style='font-family:&quot;Avenir Next W01&quot;, &quot;Avenir Next W00&quot;, &quot;Avenir Next&quot;, Avenir, &quot;Helvetica Neue&quot;, sans-serif; font-size:16px;'><span style='font-family:&quot;Avenir Next W01&quot;, &quot;Avenir Next W00&quot;, &quot;Avenir Next&quot;, Avenir, &quot;Helvetica Neue&quot;, Helvetica, Arial, sans-serif; font-size:17px;'><b><i>Important Note</i></b>: if you do create a new layer, it should be provided under the same Terms of Use and include the same Credits as this layer.  You can copy and paste the Terms of Use and Credits info below in the new Item page as needed.</span></div>",
			"keyword": [
				"osm",
				"OpenStreetMap",
				"leisure",
				"Australia",
				"Oceania",
				"park",
				"pitch",
				"garden",
				"pool",
				"stadium",
				"New Zealand",
				"PacificISlands",
				"Islands",
				"Pacific"
			],
			"issued": "2023-10-06T20:14:23.000Z",
			"modified": "2023-10-06T20:25:52.000Z",
			"publisher": {
				"name": "Pacific GeoPortal - Core Organization"
			},
			"contactPoint": {
				"@type": "vcard:Contact",
				"fn": "dkaragulle_pacificcore",
				"hasEmail": "mailto:pacific_geoportal@esri.com"
			},
			"accessLevel": "public",
			"spatial": "146.9549,-6.7436,147.0454,-6.6663",
			"license": "",
			"distribution": [
				{
					"@type": "dcat:Distribution",
					"title": "ArcGIS Hub Dataset",
					"format": "Web Page",
					"mediaType": "text/html",
					"accessURL": "https://www.pacificgeoportal.com/maps/pacificcore::openstreetmap-leisure-areas-for-pacific-region"
				}
			],
			"theme": [
				"geospatial"
			]
		},
		{
			"@type": "dcat:Dataset",
			"identifier": "https://www.arcgis.com/home/item.html?id=e2455c97b1a745e3af505e6f722810db",
			"landingPage": "https://www.pacificgeoportal.com/maps/pacificcore::openstreetmap-landuse-areas-for-pacific-region",
			"title": "OpenStreetMap Landuse Areas for Pacific Region",
			"description": "<div><span style='font-family:&quot;Avenir Next W01&quot;, &quot;Avenir Next W00&quot;, &quot;Avenir Next&quot;, Avenir, &quot;Helvetica Neue&quot;, sans-serif; font-size:17px;'>This webmap is a subset of</span><font style='font-family:&quot;Avenir Next W01&quot;, &quot;Avenir Next W00&quot;, &quot;Avenir Next&quot;, Avenir, &quot;Helvetica Neue&quot;, sans-serif; font-size:16px;'><a href='https://www.arcgis.com/home/item.html?id=673845b787364a059cdeaa733882505d' target='_blank' rel='nofollow ugc noopener noreferrer'> OpenStreetMap (OSM) landuse areas data for Australia and Oceania Feature Service</a><span style='font-family:inherit; font-size:17px;'> for Pacific Region. </span></font></div><div><font style='font-family:&quot;Avenir Next W01&quot;, &quot;Avenir Next W00&quot;, &quot;Avenir Next&quot;, Avenir, &quot;Helvetica Neue&quot;, sans-serif; font-size:16px;'><span style='font-family:inherit; font-size:17px;'><br /></span></font></div><span style='font-family:&quot;Avenir Next W01&quot;, &quot;Avenir Next W00&quot;, &quot;Avenir Next&quot;, Avenir, &quot;Helvetica Neue&quot;, sans-serif; font-size:17px;'>The feature layer provides access to OpenStreetMap (OSM) </span><span style='font-family:&quot;Avenir Next W01&quot;, &quot;Avenir Next W00&quot;, &quot;Avenir Next&quot;, Avenir, &quot;Helvetica Neue&quot;, sans-serif; font-size:16px;'>landuse </span><span style='font-family:&quot;Avenir Next W01&quot;, &quot;Avenir Next W00&quot;, &quot;Avenir Next&quot;, Avenir, &quot;Helvetica Neue&quot;, sans-serif; font-size:17px;'>areas </span><font style='font-family:&quot;Avenir Next W01&quot;, &quot;Avenir Next W00&quot;, &quot;Avenir Next&quot;, Avenir, &quot;Helvetica Neue&quot;, sans-serif; font-size:16px;'><span style='font-family:inherit; font-size:17px;'>data for Australia and Oceania, which is </span></font><b>updated every 15 minutes</b><font style='font-family:&quot;Avenir Next W01&quot;, &quot;Avenir Next W00&quot;, &quot;Avenir Next&quot;, Avenir, &quot;Helvetica Neue&quot;, sans-serif; font-size:16px;'><span style='font-family:inherit; font-size:17px;'> with the latest edits so as this WebMap. This </span></font><a href='https://doc.arcgis.com/en/arcgis-online/share-maps/about-sharing-feature-layer-data-as-copies.htm' style='color:rgb(0, 121, 193); text-decoration-line:none; font-family:&quot;Avenir Next W01&quot;, &quot;Avenir Next W00&quot;, &quot;Avenir Next&quot;, Avenir, &quot;Helvetica Neue&quot;, sans-serif; font-size:16px;' target='_blank' rel='nofollow ugc noopener noreferrer'>hosted feature layer view</a><span style='font-family:&quot;Avenir Next W01&quot;, &quot;Avenir Next W00&quot;, &quot;Avenir Next&quot;, Avenir, &quot;Helvetica Neue&quot;, sans-serif; font-size:17px;'> is referencing a hosted feature layer of OSM polygon (closed way) data in ArcGIS Online that is updated with minutely diffs from the OSM planet file.  This feature </span><span style='font-family:&quot;Avenir Next W01&quot;, &quot;Avenir Next W00&quot;, &quot;Avenir Next&quot;, Avenir, &quot;Helvetica Neue&quot;, sans-serif; font-size:17px;'>layer view</span><span style='font-family:&quot;Avenir Next W01&quot;, &quot;Avenir Next W00&quot;, &quot;Avenir Next&quot;, Avenir, &quot;Helvetica Neue&quot;, sans-serif; font-size:17px;'> includes </span><span style='font-family:&quot;Avenir Next W01&quot;, &quot;Avenir Next W00&quot;, &quot;Avenir Next&quot;, Avenir, &quot;Helvetica Neue&quot;, sans-serif; font-size:16px;'>landuse </span><span style='font-family:&quot;Avenir Next W01&quot;, &quot;Avenir Next W00&quot;, &quot;Avenir Next&quot;, Avenir, &quot;Helvetica Neue&quot;, sans-serif; font-size:17px;'>features defined as a query against the hosted feature layer (i.e. </span><span style='font-family:&quot;Avenir Next W01&quot;, &quot;Avenir Next W00&quot;, &quot;Avenir Next&quot;, Avenir, &quot;Helvetica Neue&quot;, sans-serif; font-size:16px;'>landuse </span><span style='font-family:&quot;Avenir Next W01&quot;, &quot;Avenir Next W00&quot;, &quot;Avenir Next&quot;, Avenir, &quot;Helvetica Neue&quot;, sans-serif; font-size:17px;'>is not blank).</span><div style='font-family:&quot;Avenir Next W01&quot;, &quot;Avenir Next W00&quot;, &quot;Avenir Next&quot;, Avenir, &quot;Helvetica Neue&quot;, sans-serif; font-size:16px;'><font style='font-family:inherit;'><span style='font-family:inherit; font-size:17px;'><br /></span></font></div><div style='font-family:&quot;Avenir Next W01&quot;, &quot;Avenir Next W00&quot;, &quot;Avenir Next&quot;, Avenir, &quot;Helvetica Neue&quot;, sans-serif; font-size:16px;'><font style='font-family:inherit;'><span style='font-family:inherit; font-size:17px;'>In OSM, </span></font><font style='font-family:inherit;'><font style='font-family:inherit;'><font style='font-family:inherit;'>landuse </font><font style='font-family:inherit;'><font style='font-family:inherit;'><font style='font-family:inherit;'><span style='font-family:inherit; font-size:17px;'>describes the primary use of land by humans</span></font><font style='font-family:inherit;'><span style='font-family:inherit; font-size:17px;'>.  These features are identified with a </span></font></font></font></font></font><font style='font-family:inherit;'><font style='font-family:inherit;'><a href='https://wiki.openstreetmap.org/wiki/Key:landuse' style='color:rgb(0, 121, 193); text-decoration-line:none; font-family:inherit;' target='_blank' rel='nofollow ugc noopener noreferrer'>landuse tag</a><span style='font-family:inherit; font-size:17px;'>.  There are thousands of different tag values for </span></font><font style='font-family:inherit;'>landuse <span style='font-family:inherit; font-size:17px;'>used in the OSM database.  In this feature layer, unique symbols are used for several of the most popular </span></font><font style='font-family:inherit;'>landuse <span style='font-family:inherit; font-size:17px;'>types, while lesser used types are grouped in an &quot;other&quot; category.</span></font><br /></font><div style='font-family:inherit;'><span style='font-family:&quot;Avenir Next W01&quot;, &quot;Avenir Next W00&quot;, &quot;Avenir Next&quot;, Avenir, &quot;Helvetica Neue&quot;, Helvetica, Arial, sans-serif; font-size:17px;'><br /></span></div><div style='font-family:inherit;'><span style='font-family:&quot;Avenir Next W01&quot;, &quot;Avenir Next W00&quot;, &quot;Avenir Next&quot;, Avenir, &quot;Helvetica Neue&quot;, Helvetica, Arial, sans-serif; font-size:17px;'>Zoom in to large scales (e.g. City level or 1:80k scale) to see the </span><span style='font-family:&quot;Avenir Next&quot;, Avenir, &quot;Helvetica Neue&quot;, Helvetica, Arial, sans-serif;'>landuse</span><span style='font-family:&quot;Avenir Next&quot;, Avenir, &quot;Helvetica Neue&quot;, Helvetica, Arial, sans-serif;'> </span><span style='font-family:&quot;Avenir Next&quot;, Avenir, &quot;Helvetica Neue&quot;, Helvetica, Arial, sans-serif; font-size:17px;'>area </span><span style='font-family:&quot;Avenir Next W01&quot;, &quot;Avenir Next W00&quot;, &quot;Avenir Next&quot;, Avenir, &quot;Helvetica Neue&quot;, Helvetica, Arial, sans-serif; font-size:17px;'>features display.  </span><span style='font-family:&quot;Avenir Next W01&quot;, &quot;Avenir Next W00&quot;, &quot;Avenir Next&quot;, Avenir, &quot;Helvetica Neue&quot;, Helvetica, Arial, sans-serif; font-size:17px;'>You can click on </span><span style='font-family:&quot;Avenir Next W01&quot;, &quot;Avenir Next W00&quot;, &quot;Avenir Next&quot;, Avenir, &quot;Helvetica Neue&quot;, Helvetica, Arial, sans-serif; font-size:17px;'>a </span><span style='font-family:&quot;Avenir Next W01&quot;, &quot;Avenir Next W00&quot;, &quot;Avenir Next&quot;, Avenir, &quot;Helvetica Neue&quot;, Helvetica, Arial, sans-serif; font-size:17px;'>feature to get the name of the </span><span style='font-family:&quot;Avenir Next&quot;, Avenir, &quot;Helvetica Neue&quot;, Helvetica, Arial, sans-serif;'>landuse</span><span style='font-family:&quot;Avenir Next&quot;, Avenir, &quot;Helvetica Neue&quot;, Helvetica, Arial, sans-serif;'> </span><span style='font-family:&quot;Avenir Next&quot;, Avenir, &quot;Helvetica Neue&quot;, Helvetica, Arial, sans-serif; font-size:17px;'>area </span><span style='font-family:&quot;Avenir Next W01&quot;, &quot;Avenir Next W00&quot;, &quot;Avenir Next&quot;, Avenir, &quot;Helvetica Neue&quot;, Helvetica, Arial, sans-serif; font-size:17px;'>(if available).  The name of the </span><span style='font-family:&quot;Avenir Next&quot;, Avenir, &quot;Helvetica Neue&quot;, Helvetica, Arial, sans-serif;'>landuse</span><span style='font-family:&quot;Avenir Next&quot;, Avenir, &quot;Helvetica Neue&quot;, Helvetica, Arial, sans-serif;'> </span><span style='font-family:&quot;Avenir Next&quot;, Avenir, &quot;Helvetica Neue&quot;, Helvetica, Arial, sans-serif; font-size:17px;'>area </span><span style='font-family:&quot;Avenir Next W01&quot;, &quot;Avenir Next W00&quot;, &quot;Avenir Next&quot;, Avenir, &quot;Helvetica Neue&quot;, Helvetica, Arial, sans-serif; font-size:17px;'>will display by default at large scales (e.g. Street level of 1:5k scale).  Labels can be turned off in your map if you prefer.</span></div></div><div style='font-family:&quot;Avenir Next W01&quot;, &quot;Avenir Next W00&quot;, &quot;Avenir Next&quot;, Avenir, &quot;Helvetica Neue&quot;, sans-serif; font-size:16px;'><span style='font-family:&quot;Avenir Next W01&quot;, &quot;Avenir Next W00&quot;, &quot;Avenir Next&quot;, Avenir, &quot;Helvetica Neue&quot;, Helvetica, Arial, sans-serif; font-size:17px;'><br /></span></div><div style='font-family:&quot;Avenir Next W01&quot;, &quot;Avenir Next W00&quot;, &quot;Avenir Next&quot;, Avenir, &quot;Helvetica Neue&quot;, sans-serif; font-size:16px;'><span style='font-family:&quot;Avenir Next W01&quot;, &quot;Avenir Next W00&quot;, &quot;Avenir Next&quot;, Avenir, &quot;Helvetica Neue&quot;, Helvetica, Arial, sans-serif; font-size:17px;'><b>Create New Layer</b></span></div><div style='font-family:&quot;Avenir Next W01&quot;, &quot;Avenir Next W00&quot;, &quot;Avenir Next&quot;, Avenir, &quot;Helvetica Neue&quot;, sans-serif; font-size:16px;'><span style='font-family:&quot;Avenir Next W01&quot;, &quot;Avenir Next W00&quot;, &quot;Avenir Next&quot;, Avenir, &quot;Helvetica Neue&quot;, Helvetica, Arial, sans-serif; font-size:17px;'>If you would like to create a more focused version of this </span><span style='font-family:&quot;Avenir Next&quot;, Avenir, &quot;Helvetica Neue&quot;, Helvetica, Arial, sans-serif;'>landuse</span><span style='font-family:&quot;Avenir Next&quot;, Avenir, &quot;Helvetica Neue&quot;, Helvetica, Arial, sans-serif;'> </span><span style='font-family:&quot;Avenir Next&quot;, Avenir, &quot;Helvetica Neue&quot;, Helvetica, Arial, sans-serif; font-size:17px;'>areas </span><span style='font-family:&quot;Avenir Next W01&quot;, &quot;Avenir Next W00&quot;, &quot;Avenir Next&quot;, Avenir, &quot;Helvetica Neue&quot;, Helvetica, Arial, sans-serif; font-size:17px;'>layer displaying just one or two </span><span style='font-family:&quot;Avenir Next&quot;, Avenir, &quot;Helvetica Neue&quot;, Helvetica, Arial, sans-serif;'>landuse</span><span style='font-family:&quot;Avenir Next&quot;, Avenir, &quot;Helvetica Neue&quot;, Helvetica, Arial, sans-serif;'> </span><span style='font-family:&quot;Avenir Next W01&quot;, &quot;Avenir Next W00&quot;, &quot;Avenir Next&quot;, Avenir, &quot;Helvetica Neue&quot;, Helvetica, Arial, sans-serif; font-size:17px;'>types, you can do that easily!  Just add the layer to a map, copy the layer in the content window, add a filter to the new layer (e.g. </span><span style='font-family:&quot;Avenir Next&quot;, Avenir, &quot;Helvetica Neue&quot;, Helvetica, Arial, sans-serif;'>landuse</span><span style='font-family:&quot;Avenir Next&quot;, Avenir, &quot;Helvetica Neue&quot;, Helvetica, Arial, sans-serif;'> </span><span style='font-family:&quot;Avenir Next W01&quot;, &quot;Avenir Next W00&quot;, &quot;Avenir Next&quot;, Avenir, &quot;Helvetica Neue&quot;, Helvetica, Arial, sans-serif; font-size:17px;'>is commercial), rename the layer as appropriate, and save layer.  You can also change the layer symbols or popup if you like.  Esri may publish a few such layers (e.g. residential, forest) that are ready to use, but not for every type of </span><span style='font-family:&quot;Avenir Next&quot;, Avenir, &quot;Helvetica Neue&quot;, Helvetica, Arial, sans-serif;'>landuse</span><span style='font-family:&quot;Avenir Next&quot;, Avenir, &quot;Helvetica Neue&quot;, Helvetica, Arial, sans-serif;'> </span><span style='font-family:&quot;Avenir Next&quot;, Avenir, &quot;Helvetica Neue&quot;, Helvetica, Arial, sans-serif; font-size:17px;'>area</span><span style='font-family:&quot;Avenir Next W01&quot;, &quot;Avenir Next W00&quot;, &quot;Avenir Next&quot;, Avenir, &quot;Helvetica Neue&quot;, Helvetica, Arial, sans-serif; font-size:17px;'>.</span></div><div style='font-family:&quot;Avenir Next W01&quot;, &quot;Avenir Next W00&quot;, &quot;Avenir Next&quot;, Avenir, &quot;Helvetica Neue&quot;, sans-serif; font-size:16px;'><span style='font-family:&quot;Avenir Next W01&quot;, &quot;Avenir Next W00&quot;, &quot;Avenir Next&quot;, Avenir, &quot;Helvetica Neue&quot;, Helvetica, Arial, sans-serif; font-size:17px;'><br /></span></div><div style='font-family:&quot;Avenir Next W01&quot;, &quot;Avenir Next W00&quot;, &quot;Avenir Next&quot;, Avenir, &quot;Helvetica Neue&quot;, sans-serif; font-size:16px;'><span style='font-family:&quot;Avenir Next W01&quot;, &quot;Avenir Next W00&quot;, &quot;Avenir Next&quot;, Avenir, &quot;Helvetica Neue&quot;, Helvetica, Arial, sans-serif; font-size:17px;'><b><i>Important Note</i></b>: if you do create a new layer, it should be provided under the same Terms of Use and include the same Credits as this layer.  You can copy and paste the Terms of Use and Credits info below in the new Item page as needed.</span></div>",
			"keyword": [
				"osm",
				"landuse",
				"Australia",
				"Oceania",
				"OpenStreetMap",
				"New Zealand",
				"PacificRegion",
				"PacificIslands"
			],
			"issued": "2023-10-06T20:08:00.000Z",
			"modified": "2023-10-06T20:10:38.000Z",
			"publisher": {
				"name": "Pacific GeoPortal - Core Organization"
			},
			"contactPoint": {
				"@type": "vcard:Contact",
				"fn": "dkaragulle_pacificcore",
				"hasEmail": "mailto:pacific_geoportal@esri.com"
			},
			"accessLevel": "public",
			"spatial": "146.9515,-6.7583,147.0419,-6.6810",
			"license": "",
			"distribution": [
				{
					"@type": "dcat:Distribution",
					"title": "ArcGIS Hub Dataset",
					"format": "Web Page",
					"mediaType": "text/html",
					"accessURL": "https://www.pacificgeoportal.com/maps/pacificcore::openstreetmap-landuse-areas-for-pacific-region"
				}
			],
			"theme": [
				"geospatial"
			]
		},
		{
			"@type": "dcat:Dataset",
			"identifier": "https://www.arcgis.com/home/item.html?id=29fb1d88b7e64fdcacf23c582cc937e2",
			"landingPage": "https://www.pacificgeoportal.com/maps/pacificcore::openstreetmap-buildings-for-pacific-region",
			"title": "OpenStreetMap Buildings for Pacific Region",
			"description": "<span style='font-family:&quot;Avenir Next W01&quot;, &quot;Avenir Next W00&quot;, &quot;Avenir Next&quot;, Avenir, &quot;Helvetica Neue&quot;, sans-serif; font-size:17px;'>This web map is a subset of </span><font style='font-family:&quot;Avenir Next W01&quot;, &quot;Avenir Next W00&quot;, &quot;Avenir Next&quot;, Avenir, &quot;Helvetica Neue&quot;, sans-serif; font-size:16px;'><a href='https://www.arcgis.com/home/item.html?id=651512cac36c48ba95c88c380ff8fac5' target='_blank' rel='nofollow ugc noopener noreferrer'>OpenStreetMap (OSM) buildings data for Australia and Oceania Feature Service</a><span style='font-family:inherit; font-size:17px;'> for the Pacific Region. </span></font><div><span style='font-family:&quot;Avenir Next W01&quot;, &quot;Avenir Next W00&quot;, &quot;Avenir Next&quot;, Avenir, &quot;Helvetica Neue&quot;, sans-serif; font-size:17px;'><br /></span></div><div><span style='font-family:&quot;Avenir Next W01&quot;, &quot;Avenir Next W00&quot;, &quot;Avenir Next&quot;, Avenir, &quot;Helvetica Neue&quot;, sans-serif; font-size:17px;'>The feature layer provides access to OpenStreetMap (OSM) </span><span style='font-family:&quot;Avenir Next W01&quot;, &quot;Avenir Next W00&quot;, &quot;Avenir Next&quot;, Avenir, &quot;Helvetica Neue&quot;, sans-serif; font-size:16px;'>building</span><span style='font-family:&quot;Avenir Next W01&quot;, &quot;Avenir Next W00&quot;, &quot;Avenir Next&quot;, Avenir, &quot;Helvetica Neue&quot;, sans-serif; font-size:17px;'>s </span><font style='font-family:&quot;Avenir Next W01&quot;, &quot;Avenir Next W00&quot;, &quot;Avenir Next&quot;, Avenir, &quot;Helvetica Neue&quot;, sans-serif; font-size:16px;'><span style='font-family:inherit; font-size:17px;'>data for Australia and Oceania, which is </span></font><b>updated every 1 minute</b><font style='font-family:&quot;Avenir Next W01&quot;, &quot;Avenir Next W00&quot;, &quot;Avenir Next&quot;, Avenir, &quot;Helvetica Neue&quot;, sans-serif; font-size:16px;'><span style='font-family:inherit; font-size:17px;'> with the latest edits. This </span></font><a href='https://doc.arcgis.com/en/arcgis-online/share-maps/about-sharing-feature-layer-data-as-copies.htm' style='color:rgb(0, 121, 193); text-decoration-line:none; font-family:&quot;Avenir Next W01&quot;, &quot;Avenir Next W00&quot;, &quot;Avenir Next&quot;, Avenir, &quot;Helvetica Neue&quot;, sans-serif; font-size:16px;' target='_blank' rel='nofollow ugc noopener noreferrer'>hosted feature layer view</a><span style='font-family:&quot;Avenir Next W01&quot;, &quot;Avenir Next W00&quot;, &quot;Avenir Next&quot;, Avenir, &quot;Helvetica Neue&quot;, sans-serif; font-size:17px;'> is referencing a hosted feature layer of OSM polygon (closed way) data in ArcGIS Online that is updated with minutely diffs from the OSM planet file.  This feature </span><span style='font-family:&quot;Avenir Next W01&quot;, &quot;Avenir Next W00&quot;, &quot;Avenir Next&quot;, Avenir, &quot;Helvetica Neue&quot;, sans-serif; font-size:17px;'>layer view</span><span style='font-family:&quot;Avenir Next W01&quot;, &quot;Avenir Next W00&quot;, &quot;Avenir Next&quot;, Avenir, &quot;Helvetica Neue&quot;, sans-serif; font-size:17px;'> includes </span><span style='font-family:&quot;Avenir Next W01&quot;, &quot;Avenir Next W00&quot;, &quot;Avenir Next&quot;, Avenir, &quot;Helvetica Neue&quot;, sans-serif; font-size:16px;'>building </span><span style='font-family:&quot;Avenir Next W01&quot;, &quot;Avenir Next W00&quot;, &quot;Avenir Next&quot;, Avenir, &quot;Helvetica Neue&quot;, sans-serif; font-size:17px;'>features defined as a query against the hosted feature layer (i.e. </span><span style='font-family:&quot;Avenir Next W01&quot;, &quot;Avenir Next W00&quot;, &quot;Avenir Next&quot;, Avenir, &quot;Helvetica Neue&quot;, sans-serif; font-size:16px;'>building </span><span style='font-family:&quot;Avenir Next W01&quot;, &quot;Avenir Next W00&quot;, &quot;Avenir Next&quot;, Avenir, &quot;Helvetica Neue&quot;, sans-serif; font-size:17px;'>is not blank).</span><div style='font-family:&quot;Avenir Next W01&quot;, &quot;Avenir Next W00&quot;, &quot;Avenir Next&quot;, Avenir, &quot;Helvetica Neue&quot;, sans-serif; font-size:16px;'><font style='font-family:inherit;'><span style='font-family:inherit; font-size:17px;'><br /></span></font></div><div style='font-family:&quot;Avenir Next W01&quot;, &quot;Avenir Next W00&quot;, &quot;Avenir Next&quot;, Avenir, &quot;Helvetica Neue&quot;, sans-serif; font-size:16px;'><font style='font-family:inherit;'><span style='font-family:inherit; font-size:17px;'>In OSM, </span></font><font style='font-family:inherit;'><font style='font-family:inherit;'><font style='font-family:inherit;'><font style='font-family:inherit;'><font style='font-family:inherit;'><span style='font-family:inherit; font-size:17px;'>a building is a man-made structure with a roof, standing more or less permanently in one place</span></font><font style='font-family:inherit;'><span style='font-family:inherit; font-size:17px;'>.  These features are identified with a </span></font></font></font></font></font><font style='font-family:inherit;'><font style='font-family:inherit;'><a href='https://wiki.openstreetmap.org/wiki/Key:building' style='color:rgb(0, 121, 193); text-decoration-line:none; font-family:inherit;' target='_blank' rel='nofollow ugc noopener noreferrer'>building tag</a><span style='font-family:inherit; font-size:17px;'>.  There are thousands of different tag values for </span></font><font style='font-family:inherit;'><span style='font-family:inherit; font-size:17px;'>building </span><span style='font-family:inherit; font-size:17px;'>used in the OSM database.  In this feature layer, unique symbols are used for several of the most popular </span></font><font style='font-family:inherit;'><span style='font-family:inherit; font-size:17px;'>building </span><span style='font-family:inherit; font-size:17px;'>types, while lesser used types are grouped in an &quot;other&quot; category.</span></font><br /></font><div style='font-family:inherit;'><span style='font-family:&quot;Avenir Next W01&quot;, &quot;Avenir Next W00&quot;, &quot;Avenir Next&quot;, Avenir, &quot;Helvetica Neue&quot;, Helvetica, Arial, sans-serif; font-size:17px;'><br /></span></div><div style='font-family:inherit;'><span style='font-family:&quot;Avenir Next W01&quot;, &quot;Avenir Next W00&quot;, &quot;Avenir Next&quot;, Avenir, &quot;Helvetica Neue&quot;, Helvetica, Arial, sans-serif; font-size:17px;'>Zoom in to large scales (e.g. </span><span style='font-family:&quot;Avenir Next W01&quot;, &quot;Avenir Next W00&quot;, &quot;Avenir Next&quot;, Avenir, &quot;Helvetica Neue&quot;, Helvetica, Arial, sans-serif; font-size:17px;'>Streets level or 1:10k scale</span><span style='font-family:&quot;Avenir Next W01&quot;, &quot;Avenir Next W00&quot;, &quot;Avenir Next&quot;, Avenir, &quot;Helvetica Neue&quot;, Helvetica, Arial, sans-serif; font-size:17px;'>) to see the </span><span style='font-family:&quot;Avenir Next&quot;, Avenir, &quot;Helvetica Neue&quot;, Helvetica, Arial, sans-serif; font-size:17px;'>building </span><span style='font-family:&quot;Avenir Next W01&quot;, &quot;Avenir Next W00&quot;, &quot;Avenir Next&quot;, Avenir, &quot;Helvetica Neue&quot;, Helvetica, Arial, sans-serif; font-size:17px;'>features display.  </span><span style='font-family:&quot;Avenir Next W01&quot;, &quot;Avenir Next W00&quot;, &quot;Avenir Next&quot;, Avenir, &quot;Helvetica Neue&quot;, Helvetica, Arial, sans-serif; font-size:17px;'>You can click on </span><span style='font-family:&quot;Avenir Next W01&quot;, &quot;Avenir Next W00&quot;, &quot;Avenir Next&quot;, Avenir, &quot;Helvetica Neue&quot;, Helvetica, Arial, sans-serif; font-size:17px;'>a </span><span style='font-family:&quot;Avenir Next W01&quot;, &quot;Avenir Next W00&quot;, &quot;Avenir Next&quot;, Avenir, &quot;Helvetica Neue&quot;, Helvetica, Arial, sans-serif; font-size:17px;'>feature to get the name of the </span><span style='font-family:&quot;Avenir Next&quot;, Avenir, &quot;Helvetica Neue&quot;, Helvetica, Arial, sans-serif; font-size:17px;'>building</span><span style='font-family:&quot;Avenir Next&quot;, Avenir, &quot;Helvetica Neue&quot;, Helvetica, Arial, sans-serif; font-size:17px;'> </span><span style='font-family:&quot;Avenir Next W01&quot;, &quot;Avenir Next W00&quot;, &quot;Avenir Next&quot;, Avenir, &quot;Helvetica Neue&quot;, Helvetica, Arial, sans-serif; font-size:17px;'>(if available).  The name of the </span><span style='font-family:&quot;Avenir Next&quot;, Avenir, &quot;Helvetica Neue&quot;, Helvetica, Arial, sans-serif; font-size:17px;'>building</span><span style='font-family:&quot;Avenir Next&quot;, Avenir, &quot;Helvetica Neue&quot;, Helvetica, Arial, sans-serif; font-size:17px;'> </span><span style='font-family:&quot;Avenir Next W01&quot;, &quot;Avenir Next W00&quot;, &quot;Avenir Next&quot;, Avenir, &quot;Helvetica Neue&quot;, Helvetica, Arial, sans-serif; font-size:17px;'>will display by default at large scales (e.g. Street level of 1:5k scale).  Labels can be turned off in your map if you prefer.</span></div></div><div style='font-family:&quot;Avenir Next W01&quot;, &quot;Avenir Next W00&quot;, &quot;Avenir Next&quot;, Avenir, &quot;Helvetica Neue&quot;, sans-serif; font-size:16px;'><span style='font-family:&quot;Avenir Next W01&quot;, &quot;Avenir Next W00&quot;, &quot;Avenir Next&quot;, Avenir, &quot;Helvetica Neue&quot;, Helvetica, Arial, sans-serif; font-size:17px;'><br /></span></div><div style='font-family:&quot;Avenir Next W01&quot;, &quot;Avenir Next W00&quot;, &quot;Avenir Next&quot;, Avenir, &quot;Helvetica Neue&quot;, sans-serif; font-size:16px;'><span style='font-family:&quot;Avenir Next W01&quot;, &quot;Avenir Next W00&quot;, &quot;Avenir Next&quot;, Avenir, &quot;Helvetica Neue&quot;, Helvetica, Arial, sans-serif; font-size:17px;'><b>Create New Layer</b></span></div><div style='font-family:&quot;Avenir Next W01&quot;, &quot;Avenir Next W00&quot;, &quot;Avenir Next&quot;, Avenir, &quot;Helvetica Neue&quot;, sans-serif; font-size:16px;'><span style='font-family:&quot;Avenir Next W01&quot;, &quot;Avenir Next W00&quot;, &quot;Avenir Next&quot;, Avenir, &quot;Helvetica Neue&quot;, Helvetica, Arial, sans-serif; font-size:17px;'>If you would like to create a more focused version of this </span><span style='font-family:&quot;Avenir Next&quot;, Avenir, &quot;Helvetica Neue&quot;, Helvetica, Arial, sans-serif; font-size:17px;'>buildings</span><span style='font-family:&quot;Avenir Next&quot;, Avenir, &quot;Helvetica Neue&quot;, Helvetica, Arial, sans-serif; font-size:17px;'> </span><span style='font-family:&quot;Avenir Next W01&quot;, &quot;Avenir Next W00&quot;, &quot;Avenir Next&quot;, Avenir, &quot;Helvetica Neue&quot;, Helvetica, Arial, sans-serif; font-size:17px;'>layer displaying just one or two </span><span style='font-family:&quot;Avenir Next&quot;, Avenir, &quot;Helvetica Neue&quot;, Helvetica, Arial, sans-serif; font-size:17px;'>building </span><span style='font-family:&quot;Avenir Next W01&quot;, &quot;Avenir Next W00&quot;, &quot;Avenir Next&quot;, Avenir, &quot;Helvetica Neue&quot;, Helvetica, Arial, sans-serif; font-size:17px;'>types, you can do that easily!  Just add the layer to a map, copy the layer in the content window, add a filter to the new layer (e.g. </span><span style='font-family:inherit; font-size:17px;'>building is apartments</span><span style='font-family:&quot;Avenir Next W01&quot;, &quot;Avenir Next W00&quot;, &quot;Avenir Next&quot;, Avenir, &quot;Helvetica Neue&quot;, Helvetica, Arial, sans-serif; font-size:17px;'>), rename the layer as appropriate, and save layer.  You can also change the layer symbols or popup if you like.  Esri may publish a few such layers (e.g. parks) that are ready to use, but not for every type of </span><span style='font-family:&quot;Avenir Next&quot;, Avenir, &quot;Helvetica Neue&quot;, Helvetica, Arial, sans-serif; font-size:17px;'>building</span><span style='font-family:&quot;Avenir Next W01&quot;, &quot;Avenir Next W00&quot;, &quot;Avenir Next&quot;, Avenir, &quot;Helvetica Neue&quot;, Helvetica, Arial, sans-serif; font-size:17px;'>.</span></div><div style='font-family:&quot;Avenir Next W01&quot;, &quot;Avenir Next W00&quot;, &quot;Avenir Next&quot;, Avenir, &quot;Helvetica Neue&quot;, sans-serif; font-size:16px;'><span style='font-family:&quot;Avenir Next W01&quot;, &quot;Avenir Next W00&quot;, &quot;Avenir Next&quot;, Avenir, &quot;Helvetica Neue&quot;, Helvetica, Arial, sans-serif; font-size:17px;'><br /></span></div><div style='font-family:&quot;Avenir Next W01&quot;, &quot;Avenir Next W00&quot;, &quot;Avenir Next&quot;, Avenir, &quot;Helvetica Neue&quot;, sans-serif; font-size:16px;'><span style='font-family:&quot;Avenir Next W01&quot;, &quot;Avenir Next W00&quot;, &quot;Avenir Next&quot;, Avenir, &quot;Helvetica Neue&quot;, Helvetica, Arial, sans-serif; font-size:17px;'><b><i>Important Note</i></b>: if you do create a new layer, it should be provided under the same Terms of Use and include the same Credits as this layer.  You can copy and paste the Terms of Use and Credits info below in the new Item page as needed.</span></div></div>",
			"keyword": [
				"osm",
				"building",
				"Australia",
				"Oceania",
				"New Zealand",
				"pacific",
				"pacificislands",
				"islands",
				"pacificregion"
			],
			"issued": "2023-10-06T19:03:01.000Z",
			"modified": "2023-10-06T19:05:17.000Z",
			"publisher": {
				"name": "Pacific GeoPortal - Core Organization"
			},
			"contactPoint": {
				"@type": "vcard:Contact",
				"fn": "dkaragulle_pacificcore",
				"hasEmail": "mailto:pacific_geoportal@esri.com"
			},
			"accessLevel": "public",
			"spatial": "146.9410,-6.7670,147.0314,-6.6897",
			"license": "",
			"distribution": [
				{
					"@type": "dcat:Distribution",
					"title": "ArcGIS Hub Dataset",
					"format": "Web Page",
					"mediaType": "text/html",
					"accessURL": "https://www.pacificgeoportal.com/maps/pacificcore::openstreetmap-buildings-for-pacific-region"
				}
			],
			"theme": [
				"geospatial"
			]
		},
		{
			"@type": "dcat:Dataset",
			"identifier": "https://www.arcgis.com/home/item.html?id=08ee749256234ebc94c4c4aa1efe0b28",
			"landingPage": "https://www.pacificgeoportal.com/apps/pacificcore::open-street-map-highways",
			"title": "Open Street Map Highways",
			"description": "<p>This map shows OpenStreetMap (OSM) highways data for Pacific Region, which is <strong>updated every 5 minutes</strong> with the latest edits. In OSM, a <strong>highway describes any kind of motorway, road, street or path. </strong></p><p>Zoom in to large scales (e.g. Streets level or 1:20k scale) to see the highway features display.  You can click on a feature to get the name of the highway (if available).  </p><p>You can access the feature service and have more information about this map from below. </p>",
			"keyword": [
				""
			],
			"issued": "2023-10-05T21:48:41.000Z",
			"modified": "2023-10-05T21:56:14.000Z",
			"publisher": {
				"name": "Pacific GeoPortal - Core Organization"
			},
			"contactPoint": {
				"@type": "vcard:Contact",
				"fn": "dkaragulle_pacificcore",
				"hasEmail": "mailto:pacific_geoportal@esri.com"
			},
			"accessLevel": "public",
			"spatial": "",
			"license": "",
			"distribution": [
				{
					"@type": "dcat:Distribution",
					"title": "ArcGIS Hub Dataset",
					"format": "Web Page",
					"mediaType": "text/html",
					"accessURL": "https://www.pacificgeoportal.com/apps/pacificcore::open-street-map-highways"
				},
				{
					"@type": "dcat:Distribution",
					"title": "ArcGIS GeoService",
					"format": "ArcGIS GeoServices REST API",
					"mediaType": "application/json",
					"accessURL": "https://storymaps.arcgis.com/stories/08ee749256234ebc94c4c4aa1efe0b28"
				}
			],
			"theme": ""
		},
		{
			"@type": "dcat:Dataset",
			"identifier": "https://www.arcgis.com/home/item.html?id=9d700851cbf443808de60d08cd0e76fb",
			"landingPage": "https://www.pacificgeoportal.com/maps/pacificcore::openstreetmap-highways-for-pacific-region",
			"title": "OpenStreetMap Highways for Pacific Region",
			"description": "<div><span style='font-family:&quot;Avenir Next W01&quot;, &quot;Avenir Next W00&quot;, &quot;Avenir Next&quot;, Avenir, &quot;Helvetica Neue&quot;, sans-serif; font-size:17px;'>This webmap is a subset of </span><a href='https://www.arcgis.com/home/item.html?id=919be41ae8194e65b49c70e2891d9d08' target='_blank' rel='nofollow ugc noopener noreferrer'>OpenStreetMap Highways for Australia and Oceania Feature Service</a> prepared specifcally for Pacific Region<span style='font-family:&quot;Avenir Next W01&quot;, &quot;Avenir Next W00&quot;, &quot;Avenir Next&quot;, Avenir, &quot;Helvetica Neue&quot;, sans-serif; font-size:17px;'>.</span><span style='font-family:&quot;Avenir Next W01&quot;, &quot;Avenir Next W00&quot;, &quot;Avenir Next&quot;, Avenir, &quot;Helvetica Neue&quot;, sans-serif; font-size:17px;'>The source feature layer provides access to OpenStreetMap (OSM) highways </span><span style='font-family:&quot;Avenir Next W01&quot;, &quot;Avenir Next W00&quot;, &quot;Avenir Next&quot;, Avenir, &quot;Helvetica Neue&quot;, sans-serif; font-size:17px;'>data for Australia and Oceania, which is </span><b>updated every 5 minutes</b><span style='font-family:&quot;Avenir Next W01&quot;, &quot;Avenir Next W00&quot;, &quot;Avenir Next&quot;, Avenir, &quot;Helvetica Neue&quot;, sans-serif; font-size:17px;'> with the latest edits. This </span><a href='https://doc.arcgis.com/en/arcgis-online/share-maps/about-sharing-feature-layer-data-as-copies.htm' style='font-family:&quot;Avenir Next W01&quot;, &quot;Avenir Next W00&quot;, &quot;Avenir Next&quot;, Avenir, &quot;Helvetica Neue&quot;, sans-serif; color:rgb(0, 121, 193); text-decoration-line:none; font-size:16px;' target='_blank' rel='nofollow ugc noopener noreferrer'>hosted feature layer view</a><span style='font-family:&quot;Avenir Next W01&quot;, &quot;Avenir Next W00&quot;, &quot;Avenir Next&quot;, Avenir, &quot;Helvetica Neue&quot;, sans-serif; font-size:17px;'> is referencing a hosted feature layer of OSM line (way) data in ArcGIS Online that is updated with minutely diffs from the OSM planet file.  This feature </span><span style='font-family:&quot;Avenir Next W01&quot;, &quot;Avenir Next W00&quot;, &quot;Avenir Next&quot;, Avenir, &quot;Helvetica Neue&quot;, sans-serif; font-size:17px;'>layer view</span><span style='font-family:&quot;Avenir Next W01&quot;, &quot;Avenir Next W00&quot;, &quot;Avenir Next&quot;, Avenir, &quot;Helvetica Neue&quot;, sans-serif; font-size:17px;'> includes </span><span style='font-family:&quot;Avenir Next W01&quot;, &quot;Avenir Next W00&quot;, &quot;Avenir Next&quot;, Avenir, &quot;Helvetica Neue&quot;, sans-serif; font-size:17px;'>highway </span><span style='font-family:&quot;Avenir Next W01&quot;, &quot;Avenir Next W00&quot;, &quot;Avenir Next&quot;, Avenir, &quot;Helvetica Neue&quot;, sans-serif; font-size:17px;'>features defined as a query against the hosted feature layer (i.e. </span><span style='font-family:&quot;Avenir Next W01&quot;, &quot;Avenir Next W00&quot;, &quot;Avenir Next&quot;, Avenir, &quot;Helvetica Neue&quot;, sans-serif; font-size:17px;'>highway </span><span style='font-family:&quot;Avenir Next W01&quot;, &quot;Avenir Next W00&quot;, &quot;Avenir Next&quot;, Avenir, &quot;Helvetica Neue&quot;, sans-serif; font-size:17px;'>is not blank).</span></div><div style='font-family:&quot;Avenir Next W01&quot;, &quot;Avenir Next W00&quot;, &quot;Avenir Next&quot;, Avenir, &quot;Helvetica Neue&quot;, sans-serif; font-size:16px;'><font style='font-family:inherit;'><span style='font-family:inherit; font-size:17px;'><br /></span></font></div><div style='font-family:&quot;Avenir Next W01&quot;, &quot;Avenir Next W00&quot;, &quot;Avenir Next&quot;, Avenir, &quot;Helvetica Neue&quot;, sans-serif; font-size:16px;'><font style='font-family:inherit;'><span style='font-family:inherit; font-size:17px;'>In OSM, a </span></font><font style='font-family:inherit;'><font style='font-family:inherit;'><font style='font-family:inherit;'><b><span style='font-family:inherit; font-size:17px;'>highway </span><span style='font-family:inherit; font-size:17px;'>describes </span></b></font><font style='font-family:inherit;'><font style='font-family:inherit;'><span style='font-family:inherit; font-size:17px;'><b>any kind of motorway, road, street or path</b></span></font><font style='font-family:inherit;'><span style='font-family:inherit; font-size:17px;'>.  These features are identified with a </span></font></font></font></font><font style='font-family:inherit;'><a href='https://wiki.openstreetmap.org/wiki/Key:highway' style='color:rgb(0, 121, 193); text-decoration-line:none; font-family:inherit;' target='_blank' rel='nofollow ugc noopener noreferrer'>highway tag</a><span style='font-family:inherit; font-size:17px;'>.  There are hundreds of different tag values for highway used in the OSM database.  In this feature layer, unique symbols are used for several of the most popular </span><span style='font-family:inherit; font-size:17px;'>highway </span><span style='font-family:inherit; font-size:17px;'>types, while lesser used types are grouped in an &quot;other&quot; category.<br /></span></font><div style='font-family:inherit;'><span style='font-family:&quot;Avenir Next W01&quot;, &quot;Avenir Next W00&quot;, &quot;Avenir Next&quot;, Avenir, &quot;Helvetica Neue&quot;, Helvetica, Arial, sans-serif; font-size:17px;'><br /></span></div><div style='font-family:inherit;'><span style='font-family:&quot;Avenir Next W01&quot;, &quot;Avenir Next W00&quot;, &quot;Avenir Next&quot;, Avenir, &quot;Helvetica Neue&quot;, Helvetica, Arial, sans-serif; font-size:17px;'>Zoom in to large scales (e.g. Streets level or 1:20k scale) to see the </span><span style='font-family:&quot;Avenir Next&quot;, Avenir, &quot;Helvetica Neue&quot;, Helvetica, Arial, sans-serif; font-size:17px;'>highway </span><span style='font-family:&quot;Avenir Next W01&quot;, &quot;Avenir Next W00&quot;, &quot;Avenir Next&quot;, Avenir, &quot;Helvetica Neue&quot;, Helvetica, Arial, sans-serif; font-size:17px;'>features display.  </span><span style='font-family:&quot;Avenir Next W01&quot;, &quot;Avenir Next W00&quot;, &quot;Avenir Next&quot;, Avenir, &quot;Helvetica Neue&quot;, Helvetica, Arial, sans-serif; font-size:17px;'>You can click on </span><span style='font-family:&quot;Avenir Next W01&quot;, &quot;Avenir Next W00&quot;, &quot;Avenir Next&quot;, Avenir, &quot;Helvetica Neue&quot;, Helvetica, Arial, sans-serif; font-size:17px;'>a </span><span style='font-family:&quot;Avenir Next W01&quot;, &quot;Avenir Next W00&quot;, &quot;Avenir Next&quot;, Avenir, &quot;Helvetica Neue&quot;, Helvetica, Arial, sans-serif; font-size:17px;'>feature to get the name of the </span><span style='font-family:&quot;Avenir Next&quot;, Avenir, &quot;Helvetica Neue&quot;, Helvetica, Arial, sans-serif; font-size:17px;'>highway </span><span style='font-family:&quot;Avenir Next W01&quot;, &quot;Avenir Next W00&quot;, &quot;Avenir Next&quot;, Avenir, &quot;Helvetica Neue&quot;, Helvetica, Arial, sans-serif; font-size:17px;'>(if available).  The name of the </span><span style='font-family:&quot;Avenir Next&quot;, Avenir, &quot;Helvetica Neue&quot;, Helvetica, Arial, sans-serif; font-size:17px;'>highway </span><span style='font-family:&quot;Avenir Next W01&quot;, &quot;Avenir Next W00&quot;, &quot;Avenir Next&quot;, Avenir, &quot;Helvetica Neue&quot;, Helvetica, Arial, sans-serif; font-size:17px;'>will display by default at large scales (e.g. Street level of 1:5k scale).  Labels can be turned off in your map if you prefer.</span></div></div><div style='font-family:&quot;Avenir Next W01&quot;, &quot;Avenir Next W00&quot;, &quot;Avenir Next&quot;, Avenir, &quot;Helvetica Neue&quot;, sans-serif; font-size:16px;'><span style='font-family:&quot;Avenir Next W01&quot;, &quot;Avenir Next W00&quot;, &quot;Avenir Next&quot;, Avenir, &quot;Helvetica Neue&quot;, Helvetica, Arial, sans-serif; font-size:17px;'><br /></span></div><div style='font-family:&quot;Avenir Next W01&quot;, &quot;Avenir Next W00&quot;, &quot;Avenir Next&quot;, Avenir, &quot;Helvetica Neue&quot;, sans-serif; font-size:16px;'><span style='font-family:&quot;Avenir Next W01&quot;, &quot;Avenir Next W00&quot;, &quot;Avenir Next&quot;, Avenir, &quot;Helvetica Neue&quot;, Helvetica, Arial, sans-serif; font-size:17px;'><b>Create New Layer</b></span></div><div style='font-family:&quot;Avenir Next W01&quot;, &quot;Avenir Next W00&quot;, &quot;Avenir Next&quot;, Avenir, &quot;Helvetica Neue&quot;, sans-serif; font-size:16px;'><span style='font-family:&quot;Avenir Next W01&quot;, &quot;Avenir Next W00&quot;, &quot;Avenir Next&quot;, Avenir, &quot;Helvetica Neue&quot;, Helvetica, Arial, sans-serif; font-size:17px;'>If you would like to create a more focused version of this </span><span style='font-family:&quot;Avenir Next&quot;, Avenir, &quot;Helvetica Neue&quot;, Helvetica, Arial, sans-serif; font-size:17px;'>highway </span><span style='font-family:&quot;Avenir Next W01&quot;, &quot;Avenir Next W00&quot;, &quot;Avenir Next&quot;, Avenir, &quot;Helvetica Neue&quot;, Helvetica, Arial, sans-serif; font-size:17px;'>layer displaying just one or two </span><span style='font-family:&quot;Avenir Next&quot;, Avenir, &quot;Helvetica Neue&quot;, Helvetica, Arial, sans-serif; font-size:17px;'>highway </span><span style='font-family:&quot;Avenir Next W01&quot;, &quot;Avenir Next W00&quot;, &quot;Avenir Next&quot;, Avenir, &quot;Helvetica Neue&quot;, Helvetica, Arial, sans-serif; font-size:17px;'>types, you can do that easily!  Just add the layer to a map, copy the layer in the content window, add a filter to the new layer (e.g. </span><span style='font-family:&quot;Avenir Next&quot;, Avenir, &quot;Helvetica Neue&quot;, Helvetica, Arial, sans-serif; font-size:17px;'>highway </span><span style='font-family:&quot;Avenir Next W01&quot;, &quot;Avenir Next W00&quot;, &quot;Avenir Next&quot;, Avenir, &quot;Helvetica Neue&quot;, Helvetica, Arial, sans-serif; font-size:17px;'>is path), rename the layer as appropriate, and save layer.  You can also change the layer symbols or popup if you like.  Esri may publish a few such layers (e.g. cycleway and pedestrian) that are ready to use, but not for every type of </span><span style='font-family:&quot;Avenir Next&quot;, Avenir, &quot;Helvetica Neue&quot;, Helvetica, Arial, sans-serif; font-size:17px;'>highway</span><span style='font-family:&quot;Avenir Next W01&quot;, &quot;Avenir Next W00&quot;, &quot;Avenir Next&quot;, Avenir, &quot;Helvetica Neue&quot;, Helvetica, Arial, sans-serif; font-size:17px;'>.</span></div><div style='font-family:&quot;Avenir Next W01&quot;, &quot;Avenir Next W00&quot;, &quot;Avenir Next&quot;, Avenir, &quot;Helvetica Neue&quot;, sans-serif; font-size:16px;'><span style='font-family:&quot;Avenir Next W01&quot;, &quot;Avenir Next W00&quot;, &quot;Avenir Next&quot;, Avenir, &quot;Helvetica Neue&quot;, Helvetica, Arial, sans-serif; font-size:17px;'><br /></span></div><div style='font-family:&quot;Avenir Next W01&quot;, &quot;Avenir Next W00&quot;, &quot;Avenir Next&quot;, Avenir, &quot;Helvetica Neue&quot;, sans-serif; font-size:16px;'><span style='font-family:&quot;Avenir Next W01&quot;, &quot;Avenir Next W00&quot;, &quot;Avenir Next&quot;, Avenir, &quot;Helvetica Neue&quot;, Helvetica, Arial, sans-serif; font-size:17px;'><b><i>Important Note</i></b>: if you do create a new layer, it should be provided under the same Terms of Use and include the same Credits as this layer.  You can copy and paste the Terms of Use and Credits info below in the new Item page as needed.</span></div>",
			"keyword": [
				"osm",
				"highway",
				"Australia",
				"Oceania",
				"New Zealand",
				"road",
				"path"
			],
			"issued": "2023-10-05T21:39:18.000Z",
			"modified": "2023-10-05T21:43:30.000Z",
			"publisher": {
				"name": "Pacific GeoPortal - Core Organization"
			},
			"contactPoint": {
				"@type": "vcard:Contact",
				"fn": "dkaragulle_pacificcore",
				"hasEmail": "mailto:pacific_geoportal@esri.com"
			},
			"accessLevel": "public",
			"spatial": "144.5032,-10.7226,150.2930,-5.7936",
			"license": "",
			"distribution": [
				{
					"@type": "dcat:Distribution",
					"title": "ArcGIS Hub Dataset",
					"format": "Web Page",
					"mediaType": "text/html",
					"accessURL": "https://www.pacificgeoportal.com/maps/pacificcore::openstreetmap-highways-for-pacific-region"
				}
			],
			"theme": [
				"geospatial"
			]
		},
		{
			"@type": "dcat:Dataset",
			"identifier": "https://www.arcgis.com/home/item.html?id=d46bdaa729b14b58a86d653587761bf0",
			"landingPage": "https://www.pacificgeoportal.com/apps/pacificcore::pacific-region-biomass-1",
			"title": "Pacific Region Biomass",
			"description": "<p></p><p>Plants play a central role in the <a href='https://en.wikipedia.org/wiki/Carbon_cycle' target='_blank' rel='nofollow ugc noopener noreferrer'>carbon cycle</a> by absorbing carbon dioxide from the atmosphere and incorporating it in the structure of the plant. </p><p>Globally living plants contain 500 billion metric tons of carbon, more than 60 times the amount of carbon released to the atmosphere by humans each year. </p>",
			"keyword": [
				""
			],
			"issued": "2023-09-26T21:51:10.000Z",
			"modified": "2023-10-03T17:27:46.000Z",
			"publisher": {
				"name": "Pacific GeoPortal - Core Organization"
			},
			"contactPoint": {
				"@type": "vcard:Contact",
				"fn": "dkaragulle_pacificcore",
				"hasEmail": "mailto:pacific_geoportal@esri.com"
			},
			"accessLevel": "public",
			"spatial": "",
			"license": "",
			"distribution": [
				{
					"@type": "dcat:Distribution",
					"title": "ArcGIS Hub Dataset",
					"format": "Web Page",
					"mediaType": "text/html",
					"accessURL": "https://www.pacificgeoportal.com/apps/pacificcore::pacific-region-biomass-1"
				},
				{
					"@type": "dcat:Distribution",
					"title": "ArcGIS GeoService",
					"format": "ArcGIS GeoServices REST API",
					"mediaType": "application/json",
					"accessURL": "https://storymaps.arcgis.com/stories/d46bdaa729b14b58a86d653587761bf0"
				}
			],
			"theme": ""
		},
		{
			"@type": "dcat:Dataset",
			"identifier": "https://www.arcgis.com/home/item.html?id=b090e53907584bc09afb3b0fc551b32b",
			"landingPage": "https://www.pacificgeoportal.com/apps/pacificcore::recent-hurricanes-cyclones-and-typhoons",
			"title": "Recent Hurricanes, Cyclones and Typhoons",
			"description": "<p>This layer automatically updates every 15 minutes from the <a href='https://www.nhc.noaa.gov/gis/' target='_blank' rel='nofollow ugc noopener noreferrer'>NHC GIS Data page</a>.<br />For more information you can check the source feature service below. </p><p></p>",
			"keyword": [
				""
			],
			"issued": "2023-09-26T21:27:31.000Z",
			"modified": "2023-10-03T17:26:15.000Z",
			"publisher": {
				"name": "Pacific GeoPortal - Core Organization"
			},
			"contactPoint": {
				"@type": "vcard:Contact",
				"fn": "dkaragulle_pacificcore",
				"hasEmail": "mailto:pacific_geoportal@esri.com"
			},
			"accessLevel": "public",
			"spatial": "",
			"license": "",
			"distribution": [
				{
					"@type": "dcat:Distribution",
					"title": "ArcGIS Hub Dataset",
					"format": "Web Page",
					"mediaType": "text/html",
					"accessURL": "https://www.pacificgeoportal.com/apps/pacificcore::recent-hurricanes-cyclones-and-typhoons"
				},
				{
					"@type": "dcat:Distribution",
					"title": "ArcGIS GeoService",
					"format": "ArcGIS GeoServices REST API",
					"mediaType": "application/json",
					"accessURL": "https://storymaps.arcgis.com/stories/b090e53907584bc09afb3b0fc551b32b"
				}
			],
			"theme": ""
		},
		{
			"@type": "dcat:Dataset",
			"identifier": "https://www.arcgis.com/home/item.html?id=a1c8ab85bc024ea483e0d416051b099e",
			"landingPage": "https://www.pacificgeoportal.com/apps/pacificcore::coral-reefs-at-risk-of-bleaching",
			"title": "Coral Reefs at Risk of Bleaching",
			"description": "<p>Coral reefs are one of the most diverse and ecologically important areas of the world. However, many reefs, are threatened by ocean temperatures that are increasingly becoming warmer than the coral animals' natural tolerance. </p><p>According to <a href='https://oceanservice.noaa.gov/facts/coral_bleach.html' target='_blank' rel='nofollow ugc noopener noreferrer'>NOAA</a>, when water is too warm, corals will expel the algae (zooxanthellae) living in their tissues causing the coral to turn completely white. This is called coral bleaching. When a coral bleaches, it is not dead. Corals can survive a bleaching event, but they are under more stress and are subject to mortality.</p><p>In this map you can see where corals are at risk of bleaching. You can zoom in and zoom out to see how many corals are at risk on the dashboard depending on your scale. </p>",
			"keyword": [
				""
			],
			"issued": "2023-09-22T16:54:29.000Z",
			"modified": "2023-10-03T17:25:38.000Z",
			"publisher": {
				"name": "Pacific GeoPortal - Core Organization"
			},
			"contactPoint": {
				"@type": "vcard:Contact",
				"fn": "dkaragulle_pacificcore",
				"hasEmail": "mailto:pacific_geoportal@esri.com"
			},
			"accessLevel": "public",
			"spatial": "",
			"license": "",
			"distribution": [
				{
					"@type": "dcat:Distribution",
					"title": "ArcGIS Hub Dataset",
					"format": "Web Page",
					"mediaType": "text/html",
					"accessURL": "https://www.pacificgeoportal.com/apps/pacificcore::coral-reefs-at-risk-of-bleaching"
				},
				{
					"@type": "dcat:Distribution",
					"title": "ArcGIS GeoService",
					"format": "ArcGIS GeoServices REST API",
					"mediaType": "application/json",
					"accessURL": "https://storymaps.arcgis.com/stories/a1c8ab85bc024ea483e0d416051b099e"
				}
			],
			"theme": ""
		},
		{
			"@type": "dcat:Dataset",
			"identifier": "https://www.arcgis.com/home/item.html?id=1b6d5f90c5f2409cb98e1f213f4e6782",
			"landingPage": "https://www.pacificgeoportal.com/apps/pacificcore::populated-footprint-2020",
			"title": "Populated Footprint 2020",
			"description": "<p>This map shows populated footprint in 2020 is derived from WorldPop 100m and 1km resolution sources and represents a density of 14 people per square km. and higher.</p><p>You can access more information baout this map from below map. </p>",
			"keyword": [
				""
			],
			"issued": "2023-09-26T21:38:10.000Z",
			"modified": "2023-10-03T17:24:25.000Z",
			"publisher": {
				"name": "Pacific GeoPortal - Core Organization"
			},
			"contactPoint": {
				"@type": "vcard:Contact",
				"fn": "dkaragulle_pacificcore",
				"hasEmail": "mailto:pacific_geoportal@esri.com"
			},
			"accessLevel": "public",
			"spatial": "",
			"license": "",
			"distribution": [
				{
					"@type": "dcat:Distribution",
					"title": "ArcGIS Hub Dataset",
					"format": "Web Page",
					"mediaType": "text/html",
					"accessURL": "https://www.pacificgeoportal.com/apps/pacificcore::populated-footprint-2020"
				},
				{
					"@type": "dcat:Distribution",
					"title": "ArcGIS GeoService",
					"format": "ArcGIS GeoServices REST API",
					"mediaType": "application/json",
					"accessURL": "https://storymaps.arcgis.com/stories/1b6d5f90c5f2409cb98e1f213f4e6782"
				}
			],
			"theme": ""
		},
		{
			"@type": "dcat:Dataset",
			"identifier": "https://www.arcgis.com/home/item.html?id=e97ff9ac8be6462aa18fd1bab449284f",
			"landingPage": "https://www.pacificgeoportal.com/apps/pacificcore::pacific-region-terrestrial-ecosystems-1",
			"title": "Pacific Region Terrestrial Ecosystems",
			"description": "<p>This map allows you to query of any of the 250-m pixels on the land surface of the Earth, and returns the values of all the input parameters and the name of the Ecosystem at that location.</p><p>For more information see the below. </p>",
			"keyword": [
				""
			],
			"issued": "2023-09-26T22:38:54.000Z",
			"modified": "2023-10-03T17:23:45.000Z",
			"publisher": {
				"name": "Pacific GeoPortal - Core Organization"
			},
			"contactPoint": {
				"@type": "vcard:Contact",
				"fn": "dkaragulle_pacificcore",
				"hasEmail": "mailto:pacific_geoportal@esri.com"
			},
			"accessLevel": "public",
			"spatial": "",
			"license": "",
			"distribution": [
				{
					"@type": "dcat:Distribution",
					"title": "ArcGIS Hub Dataset",
					"format": "Web Page",
					"mediaType": "text/html",
					"accessURL": "https://www.pacificgeoportal.com/apps/pacificcore::pacific-region-terrestrial-ecosystems-1"
				},
				{
					"@type": "dcat:Distribution",
					"title": "ArcGIS GeoService",
					"format": "ArcGIS GeoServices REST API",
					"mediaType": "application/json",
					"accessURL": "https://storymaps.arcgis.com/stories/e97ff9ac8be6462aa18fd1bab449284f"
				}
			],
			"theme": ""
		},
		{
			"@type": "dcat:Dataset",
			"identifier": "https://www.arcgis.com/home/item.html?id=2dab197d0dda438db060471c9f7f25b3",
			"landingPage": "https://www.pacificgeoportal.com/apps/pacificcore::pacific-region-bioclimates",
			"title": "Pacific Region Bioclimates",
			"description": "<p>Climate plays a major role in determining the distribution of plants and animals. <a href='https://en.wikipedia.org/wiki/Bioclimatology' target='_blank' rel='nofollow ugc noopener noreferrer'>Bioclimatology</a>, the study of climate as it affects and is affected by living organisms, is key to understanding the patterns of forests and deserts on the landscape, where productive agricultural lands may be found, and how changes in the climate will affect rare species. </p><p>This layer provides access to a 250m cell-sized raster with a bioclimatic stratification.</p><p>You can have more information from below. </p>",
			"keyword": [
				""
			],
			"issued": "2023-10-02T20:19:15.000Z",
			"modified": "2023-10-03T17:23:08.000Z",
			"publisher": {
				"name": "Pacific GeoPortal - Core Organization"
			},
			"contactPoint": {
				"@type": "vcard:Contact",
				"fn": "dkaragulle_pacificcore",
				"hasEmail": "mailto:pacific_geoportal@esri.com"
			},
			"accessLevel": "public",
			"spatial": "",
			"license": "",
			"distribution": [
				{
					"@type": "dcat:Distribution",
					"title": "ArcGIS Hub Dataset",
					"format": "Web Page",
					"mediaType": "text/html",
					"accessURL": "https://www.pacificgeoportal.com/apps/pacificcore::pacific-region-bioclimates"
				},
				{
					"@type": "dcat:Distribution",
					"title": "ArcGIS GeoService",
					"format": "ArcGIS GeoServices REST API",
					"mediaType": "application/json",
					"accessURL": "https://storymaps.arcgis.com/stories/2dab197d0dda438db060471c9f7f25b3"
				}
			],
			"theme": ""
		},
		{
			"@type": "dcat:Dataset",
			"identifier": "https://www.arcgis.com/home/item.html?id=b44387b6a4c646b1be31078992c0706a",
			"landingPage": "https://www.pacificgeoportal.com/apps/pacificcore::pacific-region-landcover-change",
			"title": "Pacific Region Landcover Change",
			"description": "<p><span>Left Map:</span> WorldCover is a baseline land cover map of the world from the WorldCover Consortium and European Space Agency for the year 2020. The map contains 11 different land cover classes at 10 m resolution. You can see more information below.</p><p><span>Right Map:</span> Predicted land cover for each pacific regions country for year 2050, generated by Clark University for the year 2050 at a pixel resolution of 300m. ESA CCI land cover from the years 2010 and 2018 were used to create these predictions. You can see more information below. </p>",
			"keyword": [
				""
			],
			"issued": "2023-09-22T20:15:22.000Z",
			"modified": "2023-10-03T17:21:13.000Z",
			"publisher": {
				"name": "Pacific GeoPortal - Core Organization"
			},
			"contactPoint": {
				"@type": "vcard:Contact",
				"fn": "dkaragulle_pacificcore",
				"hasEmail": "mailto:pacific_geoportal@esri.com"
			},
			"accessLevel": "public",
			"spatial": "",
			"license": "",
			"distribution": [
				{
					"@type": "dcat:Distribution",
					"title": "ArcGIS Hub Dataset",
					"format": "Web Page",
					"mediaType": "text/html",
					"accessURL": "https://www.pacificgeoportal.com/apps/pacificcore::pacific-region-landcover-change"
				},
				{
					"@type": "dcat:Distribution",
					"title": "ArcGIS GeoService",
					"format": "ArcGIS GeoServices REST API",
					"mediaType": "application/json",
					"accessURL": "https://storymaps.arcgis.com/stories/b44387b6a4c646b1be31078992c0706a"
				}
			],
			"theme": ""
		},
		{
			"@type": "dcat:Dataset",
			"identifier": "https://www.arcgis.com/home/item.html?id=ec396c54a1d84ec08ec5778b04d7a8d6",
			"landingPage": "https://www.pacificgeoportal.com/maps/pacificcore::pacific-region-bioclimate-",
			"title": "Pacific Region Bioclimate ",
			"description": "This webmap a subset of <a href='https://www.arcgis.com/home/item.html?id=5826b14592ab4ebc99574919165bd860' target='_blank' rel='nofollow ugc noopener noreferrer'>World Bioclimate</a> Feature Service.<div><div style='font-family:&quot;Avenir Next W01&quot;, &quot;Avenir Next W00&quot;, &quot;Avenir Next&quot;, Avenir, &quot;Helvetica Neue&quot;, sans-serif; font-size:16px;'>Climate plays a major role in determining the distribution of plants and animals. <a href='https://en.wikipedia.org/wiki/Bioclimatology' style='color:rgb(0, 97, 155); text-decoration-line:none; font-family:inherit;' target='_blank' rel='nofollow ugc noopener noreferrer'>Bioclimatology</a>, the study of climate as it affects and is affected by living organisms, is key to understanding the patterns of forests and deserts on the landscape, where productive agricultural lands may be found, and how changes in the climate will affect rare species. </div><div style='font-family:&quot;Avenir Next W01&quot;, &quot;Avenir Next W00&quot;, &quot;Avenir Next&quot;, Avenir, &quot;Helvetica Neue&quot;, sans-serif; font-size:16px;'><br /></div><div style='font-family:&quot;Avenir Next W01&quot;, &quot;Avenir Next W00&quot;, &quot;Avenir Next&quot;, Avenir, &quot;Helvetica Neue&quot;, sans-serif; font-size:16px;'>This layer is part of the Ecophysiographic Project and is one of the four input layers used to create the <a href='https://www.arcgis.com/home/item.html?id=e55c8b1919854715a0d0ca5762c4dec9' style='color:rgb(0, 97, 155); text-decoration-line:none; font-family:inherit;' target='_blank' rel='nofollow ugc noopener noreferrer'>World Ecological Land Units Map</a>.<br /></div><div style='font-family:&quot;Avenir Next W01&quot;, &quot;Avenir Next W00&quot;, &quot;Avenir Next&quot;, Avenir, &quot;Helvetica Neue&quot;, sans-serif; font-size:16px;'><br /></div><div style='font-family:&quot;Avenir Next W01&quot;, &quot;Avenir Next W00&quot;, &quot;Avenir Next&quot;, Avenir, &quot;Helvetica Neue&quot;, sans-serif; font-size:16px;'><font size='4' style='font-family:inherit;'>Dataset Summary </font></div><div style='font-family:&quot;Avenir Next W01&quot;, &quot;Avenir Next W00&quot;, &quot;Avenir Next&quot;, Avenir, &quot;Helvetica Neue&quot;, sans-serif; font-size:16px;'><br /></div><div style='font-family:&quot;Avenir Next W01&quot;, &quot;Avenir Next W00&quot;, &quot;Avenir Next&quot;, Avenir, &quot;Helvetica Neue&quot;, sans-serif; font-size:16px;'>This layer provides access to a 250m cell-sized raster with a bioclimatic stratification. The source dataset was a 30-arcsecond resolution raster (equivalent to 0.86 km2 at the equator or about a 920m pixel size). </div><div style='font-family:&quot;Avenir Next W01&quot;, &quot;Avenir Next W00&quot;, &quot;Avenir Next&quot;, Avenir, &quot;Helvetica Neue&quot;, sans-serif; font-size:16px;'><br /></div><div style='font-family:&quot;Avenir Next W01&quot;, &quot;Avenir Next W00&quot;, &quot;Avenir Next&quot;, Avenir, &quot;Helvetica Neue&quot;, sans-serif; font-size:16px;'>The layer has the following attributes: </div><div style='font-family:&quot;Avenir Next W01&quot;, &quot;Avenir Next W00&quot;, &quot;Avenir Next&quot;, Avenir, &quot;Helvetica Neue&quot;, sans-serif; font-size:16px;'><br /></div><div style='font-family:&quot;Avenir Next W01&quot;, &quot;Avenir Next W00&quot;, &quot;Avenir Next&quot;, Avenir, &quot;Helvetica Neue&quot;, sans-serif; font-size:16px;'><i><font color='#8b0000' style='font-family:inherit;'><b>Temperature Description </b></font></i>- Seven classes based on the number of growing degree days (the monthly mean temperature multiplied by number of days in the month summed for all months). The 1950 to 2000 monthly average temperature was used to calculate growing degree days. Values in this field and associated number of growing degree days are:</div><div style='font-family:&quot;Avenir Next W01&quot;, &quot;Avenir Next W00&quot;, &quot;Avenir Next&quot;, Avenir, &quot;Helvetica Neue&quot;, sans-serif; font-size:16px;'><span style='font-family:inherit; font-size:12.7273px;'><br /></span></div><div style='font-family:&quot;Avenir Next W01&quot;, &quot;Avenir Next W00&quot;, &quot;Avenir Next&quot;, Avenir, &quot;Helvetica Neue&quot;, sans-serif; font-size:16px;'><table border='1' cellpadding='0' cellspacing='0' style='margin-bottom:1.5rem; width:1004px; border-collapse:collapse; border-spacing:0px; border:none; font-size:0.875rem;'><tbody><tr style='border-bottom:1px solid rgb(204, 204, 204);'><td style='border-width:1pt 1pt 1.5pt; border-style:solid; border-color:rgb(153, 153, 153) rgb(153, 153, 153) rgb(102, 102, 102); padding:0in 5.4pt; width:148.25pt;' valign='top' width='198'><p style='margin-top:0px; margin-bottom:1.5rem; text-align:center;'><b><font size='2' style='font-family:inherit;'>Temperature Description</font></b></p></td><td style='border-width:1pt 1pt 1.5pt 1px; border-style:solid solid solid none; border-color:rgb(153, 153, 153) rgb(153, 153, 153) rgb(102, 102, 102) rgb(204, 204, 204); padding:0in 5.4pt; width:130.5pt;' valign='top' width='174'><p style='margin-top:0px; margin-bottom:1.5rem; text-align:center;'><b><font size='2' style='font-family:inherit;'>Growing Degree Days</font></b></p></td></tr><tr style='border-bottom:1px solid rgb(204, 204, 204);'><td style='border-left:1pt solid rgb(153, 153, 153); border-right:1pt solid rgb(153, 153, 153); padding:0in 5.4pt; width:148.25pt; border-top-style:none; border-bottom:1pt solid rgb(153, 153, 153);' valign='top' width='198'><p style='margin-top:0px; margin-bottom:1.5rem;'><b><font size='2' style='font-family:inherit;'>Very Hot</font></b></p></td><td style='border-left:1px none rgb(204, 204, 204); border-right:1pt solid rgb(153, 153, 153); padding:0in 5.4pt; width:130.5pt; border-top-style:none; border-bottom:1pt solid rgb(153, 153, 153);' valign='top' width='174'><p style='margin-top:0px; margin-bottom:1.5rem; text-align:center;'><span style='font-family:inherit; color:rgb(38, 38, 38);'><font size='2' style='font-family:inherit;'>9,000 – 13,500</font></span></p></td></tr><tr style='border-bottom:1px solid rgb(204, 204, 204);'><td style='border-left:1pt solid rgb(153, 153, 153); border-right:1pt solid rgb(153, 153, 153); padding:0in 5.4pt; width:148.25pt; border-top-style:none; border-bottom:1pt solid rgb(153, 153, 153);' valign='top' width='198'><p style='margin-top:0px; margin-bottom:1.5rem;'><b><font size='2' style='font-family:inherit;'>Hot</font></b></p></td><td style='border-left:1px none rgb(204, 204, 204); border-right:1pt solid rgb(153, 153, 153); padding:0in 5.4pt; width:130.5pt; border-top-style:none; border-bottom:1pt solid rgb(153, 153, 153);' valign='top' width='174'><p style='margin-top:0px; margin-bottom:1.5rem; text-align:center;'><span style='font-family:inherit; color:rgb(38, 38, 38);'><font size='2' style='font-family:inherit;'>7,000 – 9,000</font></span></p></td></tr><tr style='border-bottom:1px solid rgb(204, 204, 204);'><td style='border-left:1pt solid rgb(153, 153, 153); border-right:1pt solid rgb(153, 153, 153); padding:0in 5.4pt; width:148.25pt; border-top-style:none; border-bottom:1pt solid rgb(153, 153, 153);' valign='top' width='198'><p style='margin-top:0px; margin-bottom:1.5rem;'><b><font size='2' style='font-family:inherit;'>Warm</font></b></p></td><td style='border-left:1px none rgb(204, 204, 204); border-right:1pt solid rgb(153, 153, 153); padding:0in 5.4pt; width:130.5pt; border-top-style:none; border-bottom:1pt solid rgb(153, 153, 153);' valign='top' width='174'><p style='margin-top:0px; margin-bottom:1.5rem; text-align:center;'><span style='font-family:inherit; color:rgb(38, 38, 38);'><font size='2' style='font-family:inherit;'>4,500 – 7,000</font></span></p></td></tr><tr style='border-bottom:1px solid rgb(204, 204, 204);'><td style='border-left:1pt solid rgb(153, 153, 153); border-right:1pt solid rgb(153, 153, 153); padding:0in 5.4pt; width:148.25pt; border-top-style:none; border-bottom:1pt solid rgb(153, 153, 153);' valign='top' width='198'><p style='margin-top:0px; margin-bottom:1.5rem;'><b><font size='2' style='font-family:inherit;'>Cool</font></b></p></td><td style='border-left:1px none rgb(204, 204, 204); border-right:1pt solid rgb(153, 153, 153); padding:0in 5.4pt; width:130.5pt; border-top-style:none; border-bottom:1pt solid rgb(153, 153, 153);' valign='top' width='174'><p style='margin-top:0px; margin-bottom:1.5rem; text-align:center;'><span style='font-family:inherit; color:rgb(38, 38, 38);'><font size='2' style='font-family:inherit;'>2,500 – 4,500</font></span></p></td></tr><tr style='border-bottom:1px solid rgb(204, 204, 204);'><td style='border-left:1pt solid rgb(153, 153, 153); border-right:1pt solid rgb(153, 153, 153); padding:0in 5.4pt; width:148.25pt; border-top-style:none; border-bottom:1pt solid rgb(153, 153, 153);' valign='top' width='198'><p style='margin-top:0px; margin-bottom:1.5rem;'><b><font size='2' style='font-family:inherit;'>Cold</font></b></p></td><td style='border-left:1px none rgb(204, 204, 204); border-right:1pt solid rgb(153, 153, 153); padding:0in 5.4pt; width:130.5pt; border-top-style:none; border-bottom:1pt solid rgb(153, 153, 153);' valign='top' width='174'><p style='margin-top:0px; margin-bottom:1.5rem; text-align:center;'><span style='font-family:inherit; color:rgb(38, 38, 38);'><font size='2' style='font-family:inherit;'>1,000 – 2,500</font></span></p></td></tr><tr style='border-bottom:1px solid rgb(204, 204, 204);'><td style='border-left:1pt solid rgb(153, 153, 153); border-right:1pt solid rgb(153, 153, 153); padding:0in 5.4pt; width:148.25pt; border-top-style:none; border-bottom:1pt solid rgb(153, 153, 153);' valign='top' width='198'><p style='margin-top:0px; margin-bottom:1.5rem;'><b><font size='2' style='font-family:inherit;'>Very Cold</font></b></p></td><td style='border-left:1px none rgb(204, 204, 204); border-right:1pt solid rgb(153, 153, 153); padding:0in 5.4pt; width:130.5pt; border-top-style:none; border-bottom:1pt solid rgb(153, 153, 153);' valign='top' width='174'><p style='margin-top:0px; margin-bottom:1.5rem; text-align:center;'><span style='font-family:inherit; color:rgb(38, 38, 38);'><font size='2' style='font-family:inherit;'>300 – 1,000</font></span></p></td></tr><tr style='border-bottom:none;'><td style='border-left:1pt solid rgb(153, 153, 153); border-right:1pt solid rgb(153, 153, 153); padding:0in 5.4pt; width:148.25pt; border-top-style:none; border-bottom:1pt solid rgb(153, 153, 153);' valign='top' width='198'><p style='margin-top:0px; margin-bottom:1.5rem;'><b><span style='font-family:inherit; color:rgb(38, 38, 38);'><font size='2' style='font-family:inherit;'>Arctic</font></span></b></p></td><td style='border-left:1px none rgb(204, 204, 204); border-right:1pt solid rgb(153, 153, 153); padding:0in 5.4pt; width:130.5pt; border-top-style:none; border-bottom:1pt solid rgb(153, 153, 153);' valign='top' width='174'><p style='margin-top:0px; margin-bottom:1.5rem; text-align:center;'><span style='font-family:inherit; color:rgb(38, 38, 38);'><font size='2' style='font-family:inherit;'>0 - 300</font></span></p></td></tr></tbody></table></div><div style='font-family:&quot;Avenir Next W01&quot;, &quot;Avenir Next W00&quot;, &quot;Avenir Next&quot;, Avenir, &quot;Helvetica Neue&quot;, sans-serif; font-size:16px;'><span style='font-family:inherit; font-size:12.7273px;'><br /></span></div><div style='font-family:&quot;Avenir Next W01&quot;, &quot;Avenir Next W00&quot;, &quot;Avenir Next&quot;, Avenir, &quot;Helvetica Neue&quot;, sans-serif; font-size:16px;'><i><b><font color='#8b0000' style='font-family:inherit;'>Aridity Description</font></b></i><font color='#000000' style='font-family:inherit; font-size:12.7273px;'> </font>- Six classes based on an index of aridity calculated by dividing precipitation by evapotranspiration. Precipitation and evapotranspiration are average values from 1950 to 2000.<font color='#000000' style='font-family:inherit; font-size:12.7273px;'><br /></font></div><div style='font-family:&quot;Avenir Next W01&quot;, &quot;Avenir Next W00&quot;, &quot;Avenir Next&quot;, Avenir, &quot;Helvetica Neue&quot;, sans-serif; font-size:16px;'><br /></div><div style='font-family:&quot;Avenir Next W01&quot;, &quot;Avenir Next W00&quot;, &quot;Avenir Next&quot;, Avenir, &quot;Helvetica Neue&quot;, sans-serif; font-size:16px;'><table border='1' cellpadding='0' cellspacing='0' style='margin-bottom:1.5rem; width:1004px; border-collapse:collapse; border-spacing:0px; border:none; font-size:0.875rem;'><tbody><tr style='border-bottom:1px solid rgb(204, 204, 204);'><td style='border-width:1pt 1pt 1.5pt; border-style:solid; border-color:rgb(153, 153, 153) rgb(153, 153, 153) rgb(102, 102, 102); padding:0in 5.4pt; width:148.25pt;' valign='bottom' width='198'><p style='margin-top:0px; margin-bottom:1.5rem; text-align:center;'><b>Aridity Description</b></p></td><td style='border-width:1pt 1pt 1.5pt 1px; border-style:solid solid solid none; border-color:rgb(153, 153, 153) rgb(153, 153, 153) rgb(102, 102, 102) rgb(204, 204, 204); padding:0in 5.4pt; width:130.5pt;' valign='bottom' width='174'><p style='margin-top:0px; margin-bottom:1.5rem; text-align:center;'><b>Aridity Index</b></p></td></tr><tr style='border-bottom:1px solid rgb(204, 204, 204);'><td style='border-left:1pt solid rgb(153, 153, 153); border-right:1pt solid rgb(153, 153, 153); padding:0in 5.4pt; width:148.25pt; border-top-style:none; border-bottom:1pt solid rgb(153, 153, 153);' valign='bottom' width='198'><p style='margin-top:0px; margin-bottom:1.5rem; text-align:center;'><b>Very Wet</b></p></td><td style='border-left:1px none rgb(204, 204, 204); border-right:1pt solid rgb(153, 153, 153); padding:0in 5.4pt; width:130.5pt; border-top-style:none; border-bottom:1pt solid rgb(153, 153, 153);' valign='bottom' width='174'><p style='margin-top:0px; margin-bottom:1.5rem; text-align:center;'><span style='font-family:inherit; color:rgb(38, 38, 38);'>1.5 – 70</span></p></td></tr><tr style='border-bottom:1px solid rgb(204, 204, 204);'><td style='border-left:1pt solid rgb(153, 153, 153); border-right:1pt solid rgb(153, 153, 153); padding:0in 5.4pt; width:148.25pt; border-top-style:none; border-bottom:1pt solid rgb(153, 153, 153);' valign='bottom' width='198'><p style='margin-top:0px; margin-bottom:1.5rem; text-align:center;'><b>Wet</b></p></td><td style='border-left:1px none rgb(204, 204, 204); border-right:1pt solid rgb(153, 153, 153); padding:0in 5.4pt; width:130.5pt; border-top-style:none; border-bottom:1pt solid rgb(153, 153, 153);' valign='bottom' width='174'><p style='margin-top:0px; margin-bottom:1.5rem; text-align:center;'><span style='font-family:inherit; color:rgb(38, 38, 38);'>1.0 – 1.5</span></p></td></tr><tr style='border-bottom:1px solid rgb(204, 204, 204);'><td style='border-left:1pt solid rgb(153, 153, 153); border-right:1pt solid rgb(153, 153, 153); padding:0in 5.4pt; width:148.25pt; border-top-style:none; border-bottom:1pt solid rgb(153, 153, 153);' valign='bottom' width='198'><p style='margin-top:0px; margin-bottom:1.5rem; text-align:center;'><b>Moist</b></p></td><td style='border-left:1px none rgb(204, 204, 204); border-right:1pt solid rgb(153, 153, 153); padding:0in 5.4pt; width:130.5pt; border-top-style:none; border-bottom:1pt solid rgb(153, 153, 153);' valign='bottom' width='174'><p style='margin-top:0px; margin-bottom:1.5rem; text-align:center;'><span style='font-family:inherit; color:rgb(38, 38, 38);'>0.6 – 1.0</span></p></td></tr><tr style='border-bottom:1px solid rgb(204, 204, 204);'><td style='border-left:1pt solid rgb(153, 153, 153); border-right:1pt solid rgb(153, 153, 153); padding:0in 5.4pt; width:148.25pt; border-top-style:none; border-bottom:1pt solid rgb(153, 153, 153);' valign='bottom' width='198'><p style='margin-top:0px; margin-bottom:1.5rem; text-align:center;'><b>Semi-dry</b></p></td><td style='border-left:1px none rgb(204, 204, 204); border-right:1pt solid rgb(153, 153, 153); padding:0in 5.4pt; width:130.5pt; border-top-style:none; border-bottom:1pt solid rgb(153, 153, 153);' valign='bottom' width='174'><p style='margin-top:0px; margin-bottom:1.5rem; text-align:center;'><span style='font-family:inherit; color:rgb(38, 38, 38);'>0.3 – 0.6</span></p></td></tr><tr style='border-bottom:1px solid rgb(204, 204, 204);'><td style='border-left:1pt solid rgb(153, 153, 153); border-right:1pt solid rgb(153, 153, 153); padding:0in 5.4pt; width:148.25pt; border-top-style:none; border-bottom:1pt solid rgb(153, 153, 153);' valign='bottom' width='198'><p style='margin-top:0px; margin-bottom:1.5rem; text-align:center;'><b>Dry</b></p></td><td style='border-left:1px none rgb(204, 204, 204); border-right:1pt solid rgb(153, 153, 153); padding:0in 5.4pt; width:130.5pt; border-top-style:none; border-bottom:1pt solid rgb(153, 153, 153);' valign='bottom' width='174'><p style='margin-top:0px; margin-bottom:1.5rem; text-align:center;'><span style='font-family:inherit; color:rgb(38, 38, 38);'>0.1 – 0.3</span></p></td></tr><tr style='border-bottom:none;'><td style='border-left:1pt solid rgb(153, 153, 153); border-right:1pt solid rgb(153, 153, 153); padding:0in 5.4pt; width:148.25pt; border-top-style:none; border-bottom:1pt solid rgb(153, 153, 153);' valign='bottom' width='198'><p style='margin-top:0px; margin-bottom:1.5rem; text-align:center;'><b>Very Dry</b></p></td><td style='border-left:1px none rgb(204, 204, 204); border-right:1pt solid rgb(153, 153, 153); padding:0in 5.4pt; width:130.5pt; border-top-style:none; border-bottom:1pt solid rgb(153, 153, 153);' valign='bottom' width='174'><p style='margin-top:0px; margin-bottom:1.5rem; text-align:center;'><span style='font-family:inherit; color:rgb(38, 38, 38);'>0.01 – 0.1</span></p></td></tr></tbody></table></div><div style='font-family:&quot;Avenir Next W01&quot;, &quot;Avenir Next W00&quot;, &quot;Avenir Next&quot;, Avenir, &quot;Helvetica Neue&quot;, sans-serif; font-size:16px;'><span style='font-family:inherit; font-size:12.7273px;'><i><b><font color='#8b0000' style='font-family:inherit;'><br /></font></b></i></span></div><div style='font-family:&quot;Avenir Next W01&quot;, &quot;Avenir Next W00&quot;, &quot;Avenir Next&quot;, Avenir, &quot;Helvetica Neue&quot;, sans-serif; font-size:16px;'><b><i><font color='#8b0000' style='font-family:inherit;'>Bioclimate Class</font></i></b> - a 2-part description that combines the value of the Temperature Description field and the Aridity Description field. The alias for this field is ELU Bioclimate Reclass. </div><div style='font-family:&quot;Avenir Next W01&quot;, &quot;Avenir Next W00&quot;, &quot;Avenir Next&quot;, Avenir, &quot;Helvetica Neue&quot;, sans-serif; font-size:16px;'><br /></div><div style='font-family:&quot;Avenir Next W01&quot;, &quot;Avenir Next W00&quot;, &quot;Avenir Next&quot;, Avenir, &quot;Helvetica Neue&quot;, sans-serif; font-size:16px;'>This layer was created by modifying the dataset documented in the publication: <br /></div><div style='font-family:&quot;Avenir Next W01&quot;, &quot;Avenir Next W00&quot;, &quot;Avenir Next&quot;, Avenir, &quot;Helvetica Neue&quot;, sans-serif; font-size:16px;'><a href='https://www.earthobservations.org/documents/cop/bi_geobon/outreach/201211_Metzger_GEB_inpress_1.pdf' style='color:rgb(0, 97, 155); text-decoration-line:none; font-family:inherit;' target='_blank' rel='nofollow ugc noopener noreferrer'>Metzger and others</a>. 2012. A high-resolution bioclimate map of the world: a unifying framework for global biodiversity research and monitoring. </div><div style='font-family:&quot;Avenir Next W01&quot;, &quot;Avenir Next W00&quot;, &quot;Avenir Next&quot;, Avenir, &quot;Helvetica Neue&quot;, sans-serif; font-size:16px;'><br /></div><div style='font-family:&quot;Avenir Next W01&quot;, &quot;Avenir Next W00&quot;, &quot;Avenir Next&quot;, Avenir, &quot;Helvetica Neue&quot;, sans-serif; font-size:16px;'><font size='4' style='font-family:inherit;'>What can you do with this layer? </font></div><div style='font-family:&quot;Avenir Next W01&quot;, &quot;Avenir Next W00&quot;, &quot;Avenir Next&quot;, Avenir, &quot;Helvetica Neue&quot;, sans-serif; font-size:16px;'><br /></div><div style='font-family:&quot;Avenir Next W01&quot;, &quot;Avenir Next W00&quot;, &quot;Avenir Next&quot;, Avenir, &quot;Helvetica Neue&quot;, sans-serif; font-size:16px;'>This layer is suitable for both visualization and analysis. It can be used in ArcGIS Online in web maps and applications and can be used in ArcGIS Desktop.</div><div style='font-family:&quot;Avenir Next W01&quot;, &quot;Avenir Next W00&quot;, &quot;Avenir Next&quot;, Avenir, &quot;Helvetica Neue&quot;, sans-serif;'><br /><div style='font-size:16px; font-family:inherit; margin:0px; padding:0px;'>This layer has <a href='https://resources.arcgis.com/en/help/main/10.2/index.html#//00sp00000007000000' style='color:rgb(0, 97, 155); text-decoration-line:none; font-family:inherit;' target='_blank' rel='nofollow ugc noopener noreferrer'>query</a>, <a href='https://resources.arcgis.com/en/help/main/10.2/index.html#//00s500000010000000' style='color:rgb(0, 97, 155); text-decoration-line:none; font-family:inherit;' target='_blank' rel='nofollow ugc noopener noreferrer'>identify</a>, and <a href='https://resources.arcgis.com/en/help/main/10.2/index.html#/Downloading_data_from_an_image_service/00sp00000016000000/' style='color:rgb(0, 97, 155); text-decoration-line:none; font-family:inherit;' target='_blank' rel='nofollow ugc noopener noreferrer'>export</a> image services available. This layer is restricted to a maximum area of 16,000 x 16,000 pixels - an area 4,000 kilometers on a side or an area approximately the size of Europe. </div><div style='font-size:16px; font-family:inherit; margin:0px; padding:0px;'><br /></div><div style='font-size:16px; font-family:inherit; margin:0px; padding:0px;'>A service is available providing access to the data table associated with this layer. The data table services can be used by developers to quickly and efficiently query the data and to create custom applications. For more information see the <a href='https://www.arcgis.com/home/item.html?id=5c321f97872b4643a0f061e9781991cf' style='color:rgb(0, 97, 155); text-decoration-line:none; font-family:inherit;' target='_blank' rel='nofollow ugc noopener noreferrer'>World Ecophysiographic Tables</a>.<br /></div><div style='font-size:16px; font-family:inherit; margin:0px; padding:0px;'><br /></div><div style='font-size:16px; font-family:inherit; margin:0px; padding:0px;'>This layer is part of a larger collection of <a href='https://www.arcgis.com/home/group.html?owner=esri&amp;title=Landscape%20Layers&amp;start=131&amp;q=' style='color:rgb(0, 97, 155); text-decoration-line:none; font-family:inherit;' target='_blank' rel='nofollow ugc noopener noreferrer'>landscape layers</a> that you can use to perform a wide variety of mapping and analysis tasks.</div><div style='font-size:16px; font-family:inherit; margin:0px; padding:0px;'><br /></div><div style='font-size:16px; font-family:inherit; margin:0px; padding:0px;'>The <a href='https://doc.arcgis.com/en/living-atlas/#s=0&amp;n=0&amp;d=1&amp;col=&amp;fs=0&amp;fn=30&amp;npp=120&amp;subCat=0' style='color:rgb(0, 97, 155); text-decoration-line:none; font-family:inherit;' target='_blank' rel='nofollow ugc noopener noreferrer'>Living Atlas of the World</a> provides an easy way to explore the landscape layers and many other beautiful and authoritative maps on hundreds of topics.</div><div style='font-family:inherit; margin:0px; padding:0px;'><font size='3'><br /></font></div><div style='font-family:inherit; margin:0px; padding:0px;'><div style='font-family:inherit; margin:0px; padding:0px;'><font size='3'><a href='https://geonet.esri.com/' style='color:rgb(0, 97, 155); text-decoration-line:none; font-family:inherit;' target='_blank' rel='nofollow ugc noopener noreferrer'>Geonet</a> is a good resource for learning more about landscape layers and the Living Atlas of the World. To get started see the <a href='https://geonet.esri.com/groups/livingatlas?sr=search&amp;searchId=ec0b33d6-14bb-4319-8ad5-38961b68610e&amp;searchIndex=0' style='color:rgb(0, 97, 155); text-decoration-line:none; font-family:inherit;' target='_blank' rel='nofollow ugc noopener noreferrer'>Living Atlas Discussion Group</a>.</font></div><div style='font-family:inherit; margin:0px; padding:0px;'><font size='3'><br /></font></div><div style='font-family:inherit; margin:0px; padding:0px;'><font size='3'>The <a href='https://goto.arcgisonline.com/arcgis/Ecological_Land_Units/RolloutBlog' style='color:rgb(0, 97, 155); text-decoration-line:none; font-family:inherit;' target='_blank' rel='nofollow ugc noopener noreferrer'>Esri Insider Blog</a> provides an introduction to the Ecophysiographic Mapping project.</font></div></div></div></div>",
			"keyword": [
				"ecophysiography",
				"landscape6",
				"esri_landscape",
				"climate",
				"landscape"
			],
			"issued": "2023-10-02T20:10:23.000Z",
			"modified": "2023-10-02T20:13:04.000Z",
			"publisher": {
				"name": "Pacific GeoPortal - Core Organization"
			},
			"contactPoint": {
				"@type": "vcard:Contact",
				"fn": "dkaragulle_pacificcore",
				"hasEmail": "mailto:pacific_geoportal@esri.com"
			},
			"accessLevel": "public",
			"spatial": "138.0981,-25.6241,173.7378,1.3156",
			"license": "<img src='https://downloads.esri.com/blogs/arcgisonline/esrilogo_new.png' style='max-width:100%; height:auto; font-family:&quot;Avenir Next W01&quot;, &quot;Avenir Next W00&quot;, &quot;Avenir Next&quot;, Avenir, &quot;Helvetica Neue&quot;, sans-serif; font-size:16px;' /><span style='font-family:&quot;Avenir Next W01&quot;, &quot;Avenir Next W00&quot;, &quot;Avenir Next&quot;, Avenir, &quot;Helvetica Neue&quot;, sans-serif; font-size:16px;'>This work is licensed under the Esri Master License Agreement.</span><br /><div style='font-family:&quot;Avenir Next W01&quot;, &quot;Avenir Next W00&quot;, &quot;Avenir Next&quot;, Avenir, &quot;Helvetica Neue&quot;, sans-serif; font-size:16px;'><a href='https://goto.arcgis.com/termsofuse/viewsummary' style='color:rgb(0, 97, 155); text-decoration-line:none;' target='_blank' rel='nofollow ugc noopener noreferrer'><b>View Summary</b></a> | <a href='https://goto.arcgis.com/termsofuse/viewtermsofuse' style='color:rgb(0, 97, 155); text-decoration-line:none;' target='_blank' rel='nofollow ugc noopener noreferrer'><b>View Terms of Use</b></a></div><div style='font-family:&quot;Avenir Next W01&quot;, &quot;Avenir Next W00&quot;, &quot;Avenir Next&quot;, Avenir, &quot;Helvetica Neue&quot;, sans-serif; font-size:16px;'><br /></div><div style='font-family:&quot;Avenir Next W01&quot;, &quot;Avenir Next W00&quot;, &quot;Avenir Next&quot;, Avenir, &quot;Helvetica Neue&quot;, sans-serif; font-size:16px;'><font color='#b22222'>Important Note:</font> This item requires an ArcGIS Online organizational subscription or an ArcGIS Developer account and does not consume credits. To access this item, you'll need to do one of the following:</div><div style='font-family:&quot;Avenir Next W01&quot;, &quot;Avenir Next W00&quot;, &quot;Avenir Next&quot;, Avenir, &quot;Helvetica Neue&quot;, sans-serif; font-size:16px;'><ul><li>Sign in with an account that is a member of an organizational subscription</li><li>Sign in with a developer account</li><li><a href='https://goto.arcgis.com/termsofuse/registeranapplication' style='color:rgb(0, 97, 155); text-decoration-line:none;' target='_blank' rel='nofollow ugc noopener noreferrer'>Register an application</a> and use your application's credentials.</li></ul>If you don't have an account, you can sign up for a <a href='https://goto.arcgis.com/features/trial' style='color:rgb(0, 97, 155); text-decoration-line:none;' target='_blank' rel='nofollow ugc noopener noreferrer'>free trial of ArcGIS</a> or a <a href='https://goto.arcgis.com/developers/signup' style='color:rgb(0, 97, 155); text-decoration-line:none;' target='_blank' rel='nofollow ugc noopener noreferrer'>free ArcGIS Developer account</a>.</div>",
			"distribution": [
				{
					"@type": "dcat:Distribution",
					"title": "ArcGIS Hub Dataset",
					"format": "Web Page",
					"mediaType": "text/html",
					"accessURL": "https://www.pacificgeoportal.com/maps/pacificcore::pacific-region-bioclimate-"
				}
			],
			"theme": [
				"geospatial"
			]
		},
		{
			"@type": "dcat:Dataset",
			"identifier": "https://www.arcgis.com/home/item.html?id=2efb42020ec84e338013f1808f9c066e",
			"landingPage": "https://www.pacificgeoportal.com/maps/pacificcore::bioclimate-baseline-1970-2000-for-pacific-region",
			"title": "Bioclimate Baseline 1970-2000 for Pacific Region",
			"description": "This webmap is a subset of <a href='https://www.arcgis.com/home/item.html?id=e56c9cb70aa949adb791c4311003d9ae' target='_blank' rel='nofollow ugc noopener noreferrer'>Bioclimate Baseline 1970-2000</a> for the Global Coverage. <div><br /></div><div><a href='https://www.worldclim.org/data/worldclim21.html' style='color:rgb(0, 121, 193); text-decoration-line:none; font-family:&quot;Avenir Next W01&quot;, &quot;Avenir Next W00&quot;, &quot;Avenir Next&quot;, Avenir, &quot;Helvetica Neue&quot;, sans-serif; font-size:16px;' target='_blank' rel='nofollow ugc noopener noreferrer'>WorldClim 2.1</a><span style='font-family:&quot;Avenir Next W01&quot;, &quot;Avenir Next W00&quot;, &quot;Avenir Next&quot;, Avenir, &quot;Helvetica Neue&quot;, sans-serif; font-size:16px;'> provides downscaled estimates of climate and bioclimate variables as monthly means over the period of 1970-2000 based on interpolated station measurements. Each of the 19 bioclimate variables are provided in this layer and can be accessed from the Multidimensional Filter. </span><div style='font-family:&quot;Avenir Next W01&quot;, &quot;Avenir Next W00&quot;, &quot;Avenir Next&quot;, Avenir, &quot;Helvetica Neue&quot;, sans-serif; font-size:16px;'><br /></div><div style='font-family:&quot;Avenir Next W01&quot;, &quot;Avenir Next W00&quot;, &quot;Avenir Next&quot;, Avenir, &quot;Helvetica Neue&quot;, sans-serif; font-size:16px;'>Detailed descriptions of each bioclimate variable and how they're calculated are described in <font size='3' style='font-family:inherit;'><a href='https://pubs.usgs.gov/ds/691/ds691.pdf' style='color:rgb(0, 97, 155); text-decoration-line:none; font-family:inherit;' target='_blank' rel='nofollow ugc noopener noreferrer'>this publication from the USGS</a>. </font></div><div style='font-family:&quot;Avenir Next W01&quot;, &quot;Avenir Next W00&quot;, &quot;Avenir Next&quot;, Avenir, &quot;Helvetica Neue&quot;, sans-serif; font-size:16px;'><br /></div><div style='font-family:&quot;Avenir Next W01&quot;, &quot;Avenir Next W00&quot;, &quot;Avenir Next&quot;, Avenir, &quot;Helvetica Neue&quot;, sans-serif; font-size:16px;'>This layer can be used to compare <a href='https://arcgis.com/home/group.html?id=ccb9ca464694469d902ff00d052a54db' style='color:rgb(0, 97, 155); text-decoration-line:none; font-family:inherit;' target='_blank' rel='nofollow ugc noopener noreferrer'>future estimates of bioclimate variables</a> <font face='Avenir Next W01, Avenir Next W00, Avenir Next, Avenir, Helvetica Neue, sans-serif'>based on CMIP6 climate models, also provided by WorldClim. </font><div style='font-family:inherit;'><br /><div style='font-family:inherit;'><b>Time Extent:</b> Annual 1970-2000</div><div style='font-family:inherit;'><b>Units: </b>mm, deg C, %</div><div style='font-family:inherit;'><b>Cell Size:</b> 2.5 minutes (~5 km)</div><div style='font-family:inherit;'><b>Source Type:</b> Stretched</div><div style='font-family:inherit;'><b>Pixel Type:</b> 16 Bit Integer</div><div style='font-family:inherit;'><b>Data Projection:</b> GCS WGS84</div><div style='font-family:inherit;'><b>Mosaic Projection:</b> GCS WGS84<br /></div><div style='font-family:inherit;'><b>Extent:</b> Global</div><div style='font-family:inherit;'><b>Source:</b> WorldClim v2.1</div><div style='font-family:inherit;'><br /></div><div style='font-family:inherit;'><div style='font-family:inherit;'><b>What can you do with this layer?</b></div><div style='font-family:inherit;'><br /></div><div style='font-family:inherit;'>This layer may be added to maps to visualize and quickly interrogate each pixel value. </div><div style='font-family:inherit;'><br /></div><div style='font-family:inherit;'>This layer can be used in analysis. For example, the layer may be added to ArcGIS Pro and an area count of precipitation may be produced for a feature dataset using the zonal statistics tool. </div><div style='font-family:inherit;'><br /></div><div style='font-family:inherit;'>To calculate precipitation by land area, or any other analysis, be sure to use an equal area projection, such as Albers or <a href='https://desktop.arcgis.com/en/arcmap/latest/map/projections/equal-earth.htm' style='color:rgb(0, 121, 193); text-decoration-line:none; font-family:inherit;' target='_blank' rel='nofollow ugc noopener noreferrer'>Equal Earth</a>.</div></div><div style='font-family:inherit;'><br /></div><div style='font-family:inherit;'><div style='font-family:inherit;'><b>Citation:</b> </div><div style='font-family:inherit;'>Fick, S.E. and R.J. Hijmans, 2017. WorldClim 2: new 1km spatial resolution climate surfaces for global land areas. <a href='https://rmets.onlinelibrary.wiley.com/doi/abs/10.1002/joc.5086' style='color:rgb(0, 121, 193); text-decoration-line:none; font-family:inherit;' target='_blank' rel='nofollow ugc noopener noreferrer'>International Journal of Climatology 37 (12): 4302-4315</a>. </div></div></div></div></div>",
			"keyword": [
				"climate change",
				"bioclimate",
				"ecosystem",
				"WorldClim",
				"esri_environment",
				"temperature",
				"precipitation",
				"season",
				"climate",
				"beta"
			],
			"issued": "2023-10-02T17:57:54.000Z",
			"modified": "2023-10-02T18:00:01.000Z",
			"publisher": {
				"name": "Pacific GeoPortal - Core Organization"
			},
			"contactPoint": {
				"@type": "vcard:Contact",
				"fn": "dkaragulle_pacificcore",
				"hasEmail": "mailto:pacific_geoportal@esri.com"
			},
			"accessLevel": "public",
			"spatial": "146.9092,-26.6695,180.0000,0.1511",
			"license": "<img src='https://downloads.esri.com/blogs/arcgisonline/esrilogo_new.png' style='max-width:100%; height:auto; font-family:&quot;Avenir Next W01&quot;, &quot;Avenir Next W00&quot;, &quot;Avenir Next&quot;, Avenir, &quot;Helvetica Neue&quot;, sans-serif; font-size:16px;' /><span style='font-family:&quot;Avenir Next W01&quot;, &quot;Avenir Next W00&quot;, &quot;Avenir Next&quot;, Avenir, &quot;Helvetica Neue&quot;, sans-serif; font-size:16px;'> This work is licensed under the Esri Master License Agreement.</span><br /><div style='font-family:&quot;Avenir Next W01&quot;, &quot;Avenir Next W00&quot;, &quot;Avenir Next&quot;, Avenir, &quot;Helvetica Neue&quot;, sans-serif; font-size:16px;'><a href='https://goto.arcgis.com/termsofuse/viewsummary' style='color:rgb(0, 97, 155); text-decoration-line:none;' target='_blank' rel='nofollow ugc noopener noreferrer'><b>View Summary</b></a> | <a href='https://goto.arcgis.com/termsofuse/viewtermsofuse' style='color:rgb(0, 97, 155); text-decoration-line:none;' target='_blank' rel='nofollow ugc noopener noreferrer'><b>View Terms of Use</b></a></div><div style='font-family:&quot;Avenir Next W01&quot;, &quot;Avenir Next W00&quot;, &quot;Avenir Next&quot;, Avenir, &quot;Helvetica Neue&quot;, sans-serif; font-size:16px;'><br /></div><div style='font-family:&quot;Avenir Next W01&quot;, &quot;Avenir Next W00&quot;, &quot;Avenir Next&quot;, Avenir, &quot;Helvetica Neue&quot;, sans-serif; font-size:16px;'><font color='#b22222'>Important Note:</font> This item is in <a href='https://goto.arcgis.com/termsofuse/beta' style='color:rgb(0, 97, 155); text-decoration-line:none;' target='_blank' rel='nofollow ugc noopener noreferrer'>beta</a> and is not intended for use in production applications.</div>",
			"distribution": [
				{
					"@type": "dcat:Distribution",
					"title": "ArcGIS Hub Dataset",
					"format": "Web Page",
					"mediaType": "text/html",
					"accessURL": "https://www.pacificgeoportal.com/maps/pacificcore::bioclimate-baseline-1970-2000-for-pacific-region"
				}
			],
			"theme": [
				"geospatial"
			]
		},
		{
			"@type": "dcat:Dataset",
			"identifier": "https://www.arcgis.com/home/item.html?id=8682a43dd050416aa534acbf089e6bd2",
			"landingPage": "https://www.pacificgeoportal.com/maps/pacificcore::distance-to-coast-km-pacific-region",
			"title": "Distance to Coast (km) Pacific Region",
			"description": "This webmap is a subset of <a href='https://www.arcgis.com/home/item.html?id=edc6d54479014a49941122acf1104cbe' target='_blank' rel='nofollow ugc noopener noreferrer'>Distance to Coast (km) Global Coverage. </a><div><br /></div><div><span style='font-family:&quot;Avenir Next W01&quot;, &quot;Avenir Next W00&quot;, &quot;Avenir Next&quot;, Avenir, &quot;Helvetica Neue&quot;, sans-serif; font-size:16px;'><div style='font-family:inherit;'>Portions of the world's interior, such as central Asia are extremely secluded from the ocean and are more than 2,000 km from the nearest coast. Distance to coast can be used in asset management and modeling project costs. </div><div style='font-family:inherit;'><br /></div><div style='font-family:inherit;'><b>Phenomenon Mapped</b>: Distance to coast</div><div style='font-family:inherit;'><b>Units</b>: Kilometers</div><div style='font-family:inherit;'><b>Cell Size</b>: 655.9259912 meters</div><div style='font-family:inherit;'><b>Source Type</b>: Discrete</div><div style='font-family:inherit;'><b>Pixel Type</b>: Signed integer</div><div style='font-family:inherit;'><b>Spatial Reference</b>: World Equidistant Cylindrical</div><div style='font-family:inherit;'><b>Mosaic Projection</b>: Web Mercator Auxiliary Sphere</div><div style='font-family:inherit;'><b>Extent</b>: Global</div><div style='font-family:inherit;'><b>Source</b>: Esri</div><div style='font-family:inherit;'><b>Publication Date</b>: 2015</div><div style='font-family:inherit;'><b>ArcGIS Server URL</b>: <a href='https://oceans2.arcgis.com/arcgis/' style='color:rgb(0, 97, 155); text-decoration-line:none; font-family:inherit;' target='_blank' rel='nofollow ugc noopener noreferrer'>https://oceans2.arcgis.com/arcgis/</a></div></span><span style='font-family:&quot;Avenir Next W01&quot;, &quot;Avenir Next W00&quot;, &quot;Avenir Next&quot;, Avenir, &quot;Helvetica Neue&quot;, sans-serif; font-size:16px;'><div style='font-family:inherit;'><br /></div><div style='font-family:inherit;'>The Distance to Coast layer was calculated by Esri using the Euclidean Distance Tool in ArcMap and the <a href='https://www.arcgis.com/home/item.html?id=ac80670eb213440ea5899bbf92a04998' style='color:rgb(0, 97, 155); text-decoration-line:none; font-family:inherit;' target='_blank' rel='nofollow ugc noopener noreferrer'>Esri Country Boundaries layer</a>.</div><div style='font-family:inherit;'><br /></div><div style='font-family:inherit;'><font size='4' style='font-family:inherit;'>What can you do with this layer?</font></div><div style='font-family:inherit;'><br /></div><div style='font-family:inherit;'><b>Visualization</b>: This layer can be used for visualization online in web maps and in ArcGIS Desktop.</div><div style='font-family:inherit;'><br /></div><div style='font-family:inherit;'><b>Analysis</b>: This layer can be used as an input to geoprocessing tools and model builder.</div><div style='font-family:inherit;'><br /></div><div style='font-family:inherit;'><b>Raster Functions</b>: Unit Conversion – kilometers to miles, Unit Conversion - kilometers to nautical miles, Cartographic Renderer, and Classified Renderer see this <a href='https://blogs.esri.com/esri/arcgis/?p=59353' style='color:rgb(0, 97, 155); text-decoration-line:none; font-family:inherit;' target='_blank' rel='nofollow ugc noopener noreferrer'>blog</a> for more information.<br /></div><div style='font-family:inherit;'><br /></div><div style='font-family:inherit;'><span style='font-family:inherit; color:rgb(77, 77, 77);'>This layer is part of the </span><a href='https://doc.arcgis.com/en/living-atlas/about/' style='color:rgb(33, 117, 155); text-decoration-line:none; font-family:inherit;' target='_blank' rel='nofollow ugc noopener noreferrer'>Living Atlas of the World</a><span style='font-family:inherit; color:rgb(77, 77, 77);'> that provides access to thousands of beautiful and authoritative layers, web maps, and apps.</span></div></span></div>",
			"keyword": [],
			"issued": "2023-10-02T17:42:46.000Z",
			"modified": "2023-10-02T17:48:54.000Z",
			"publisher": {
				"name": "Pacific GeoPortal - Core Organization"
			},
			"contactPoint": {
				"@type": "vcard:Contact",
				"fn": "dkaragulle_pacificcore",
				"hasEmail": "mailto:pacific_geoportal@esri.com"
			},
			"accessLevel": "public",
			"spatial": "94.2188,-46.4018,180.0000,50.6025",
			"license": "<img src='https://downloads.esri.com/blogs/arcgisonline/esrilogo_new.png' style='max-width:100%; height:auto; font-family:&quot;Avenir Next W01&quot;, &quot;Avenir Next W00&quot;, &quot;Avenir Next&quot;, Avenir, &quot;Helvetica Neue&quot;, sans-serif; font-size:16px;' /><span style='font-family:&quot;Avenir Next W01&quot;, &quot;Avenir Next W00&quot;, &quot;Avenir Next&quot;, Avenir, &quot;Helvetica Neue&quot;, sans-serif; font-size:16px;'>This work is licensed under the Esri Master License Agreement.</span><br /><div style='font-family:&quot;Avenir Next W01&quot;, &quot;Avenir Next W00&quot;, &quot;Avenir Next&quot;, Avenir, &quot;Helvetica Neue&quot;, sans-serif; font-size:16px;'><a href='https://goto.arcgis.com/termsofuse/viewsummary' style='color:rgb(0, 97, 155); text-decoration-line:none;' target='_blank' rel='nofollow ugc noopener noreferrer'><b>View Summary</b></a> | <a href='https://goto.arcgis.com/termsofuse/viewtermsofuse' style='color:rgb(0, 97, 155); text-decoration-line:none;' target='_blank' rel='nofollow ugc noopener noreferrer'><b>View Terms of Use</b></a></div><div style='font-family:&quot;Avenir Next W01&quot;, &quot;Avenir Next W00&quot;, &quot;Avenir Next&quot;, Avenir, &quot;Helvetica Neue&quot;, sans-serif; font-size:16px;'><br /></div><div style='font-family:&quot;Avenir Next W01&quot;, &quot;Avenir Next W00&quot;, &quot;Avenir Next&quot;, Avenir, &quot;Helvetica Neue&quot;, sans-serif; font-size:16px;'><font color='#b22222'>Important Note:</font> This item requires an ArcGIS Online organizational subscription or an ArcGIS Developer account and does not consume credits. To access this item, you'll need to do one of the following:</div><div style='font-family:&quot;Avenir Next W01&quot;, &quot;Avenir Next W00&quot;, &quot;Avenir Next&quot;, Avenir, &quot;Helvetica Neue&quot;, sans-serif; font-size:16px;'><ul><li>Sign in with an account that is a member of an organizational subscription</li><li>Sign in with a developer account</li><li><a href='https://goto.arcgis.com/termsofuse/registeranapplication' style='color:rgb(0, 97, 155); text-decoration-line:none;' target='_blank' rel='nofollow ugc noopener noreferrer'>Register an application</a> and use your application's credentials.</li></ul>If you don't have an account, you can sign up for a <a href='https://goto.arcgis.com/features/trial' style='color:rgb(0, 97, 155); text-decoration-line:none;' target='_blank' rel='nofollow ugc noopener noreferrer'>free trial of ArcGIS</a> or a <a href='https://goto.arcgis.com/developers/signup' style='color:rgb(0, 97, 155); text-decoration-line:none;' target='_blank' rel='nofollow ugc noopener noreferrer'>free ArcGIS Developer account</a>.</div>",
			"distribution": [
				{
					"@type": "dcat:Distribution",
					"title": "ArcGIS Hub Dataset",
					"format": "Web Page",
					"mediaType": "text/html",
					"accessURL": "https://www.pacificgeoportal.com/maps/pacificcore::distance-to-coast-km-pacific-region"
				}
			],
			"theme": [
				"geospatial"
			]
		},
		{
			"@type": "dcat:Dataset",
			"identifier": "https://www.arcgis.com/home/item.html?id=4c40959e70fd42aa93e0317c6cf14b76",
			"landingPage": "https://www.pacificgeoportal.com/maps/pacificcore::european-space-agency-worldcover-2020-land-cover-for-pacific-region",
			"title": "European Space Agency WorldCover 2020 Land Cover for Pacific Region",
			"description": "<h4 style='font-weight:400; margin:0.375rem 0px 0.75rem; font-family:&quot;Avenir Next W01&quot;, &quot;Avenir Next W00&quot;, &quot;Avenir Next&quot;, Avenir, &quot;Helvetica Neue&quot;, sans-serif;'><span style='background-color:rgb(255, 255, 255);'><span style='font-size:16px; font-family:inherit;'>This layer is a subset of </span><font size='3'><a href='https://www.arcgis.com/home/item.html?id=e28b7e1da5414010ba4f47dd5a3c3ebb' target='_blank' rel='nofollow ugc noopener noreferrer'>European Space Agency World Cover 2020 Landcover Global Coverage</a><span style='font-family:inherit;'> </span></font><span style='font-size:16px; font-family:inherit;'>for the Pacific Region.  WorldCover provides a new baseline global land cover product at 10 m resolution for 2020 based on Sentinel-1 and 2 data. It was developed and validated in almost near-real time and at the same time maximizes the impact and uptake for the end users.</span><br /></span></h4><div style='padding-bottom:0.375rem; max-width:100%; display:inherit; font-family:&quot;Avenir Next W01&quot;, &quot;Avenir Next W00&quot;, &quot;Avenir Next&quot;, Avenir, &quot;Helvetica Neue&quot;, sans-serif; font-size:16px;'><div style='font-family:inherit;'><br /><span style='font-family:inherit; font-weight:bold;'>Variable mapped: </span>11 land cover classes<br /><span style='font-family:inherit; font-weight:bold;'>Data Projection:</span> WGS84 (WKID 4326)<br /><span style='font-family:inherit; font-weight:bold;'>Mosaic Projection:</span> Web Mercator (WKID3857)<br /><span style='font-family:inherit; font-weight:bold;'>Extent:</span> World<br /><span style='font-family:inherit; font-weight:bold;'>Cell Size:</span> 8.33333333333333E-05 degrees (10m)<br /><span style='font-family:inherit; font-weight:bold;'>Source Type:</span> 8 bit unsigned<br /><span style='font-family:inherit; font-weight:bold;'>Visible Scale:</span> All scales are visible<br /><span style='font-family:inherit; font-weight:bold;'>Source:</span> ESA (European Space Agency)<br /><span style='font-family:inherit; font-weight:bold;'>Publication Date:</span> October 20, 2021<br /><br />More Details from the WorldCover consortium: <a href='https://esa-worldcover.org/en' style='color:rgb(0, 97, 155); text-decoration-line:none; font-family:inherit;' target='_blank' rel='nofollow ugc noopener noreferrer'>https://esa-worldcover.org/en</a></div><div style='font-family:inherit;'><br /></div><div style='font-family:inherit;'><font size='5' style='font-family:inherit;'>Classes</font></div><div style='font-family:inherit;'><br /></div><div style='font-family:inherit;'><span style='font-family:inherit; font-weight:bold;'>10. Tree Cover</span><br />This class includes any geographic area dominated by trees with a cover of 10% or more. Other land cover classes (shrubs and/or herbs in the understorey, built-up, permanent water bodies, …) can be present below the canopy, even with a density higher than trees. Areas planted with trees for afforestation purposes and plantations (e.g. oil palm, olive trees) are included in this class. This class also includes tree covered areas seasonally or permanently flooded with fresh water except for mangroves.<br /><br /><span style='font-family:inherit; font-weight:bold;'>20. Shrubland</span><br />This class includes any geographic area dominated by natural shrubs having a cover of 10% or more. Shrubs are defined as woody perennial plants with persistent and woody stems and without any defined main stem being less than 5 m tall. Trees can be present in scattered form if their cover is less than 10%. Herbaceous plants can also be present at any density. The shrub foliage can be either evergreen or deciduous.<br /><br /><span style='font-family:inherit; font-weight:bold;'>30. Grassland</span><br />This class includes any geographic area dominated by natural herbaceous plants (Plants without persistent stem or shoots above ground and lacking definite firm structure): (grasslands, prairies, steppes, savannahs, pastures) with a cover of 10% or more, irrespective of different human and/or animal activities, such as: grazing, selective fire management etc. Woody plants (trees and/or shrubs) can be present assuming their cover is less than 10%. It may also contain uncultivated cropland areas (without harvest/ bare soil period) in the reference year.<br /><br /><span style='font-family:inherit; font-weight:bold;'>40. Cropland</span><br />Land covered with annual cropland that is sowed/planted and harvestable at least once within the 12 months after the<br />sowing/planting date. The annual cropland produces an herbaceous cover and is sometimes combined with some tree or woody<br />vegetation. Note that perennial woody crops will be classified as the appropriate tree cover or shrub land cover type. Greenhouses are considered as built-up.<br /><br /><span style='font-family:inherit; font-weight:bold;'>50. Built-up</span><br />Land covered by buildings, roads and other man-made structures such as railroads. Buildings include both residential and industrial building. Urban green (parks, sport facilities) is not included in this class. Waste dump deposits and extraction sites are considered as bare.<br /><br /><span style='font-family:inherit; font-weight:bold;'>60. Bare or sparse vegetation</span><br />Lands with exposed soil, sand, or rocks and never has more than 10 % vegetated cover during any time of the year.<br /><br /><span style='font-family:inherit; font-weight:bold;'>70. Snow and Ice</span><br />This class includes any geographic area covered by snow or glaciers persistently.<br /><br /><span style='font-family:inherit; font-weight:bold;'>80. Permanent water bodies</span><br />This class includes any geographic area covered for most of the year (more than 9 months) by water bodies: lakes, reservoirs, and rivers. Can be either fresh or salt-water bodies. In some cases the water can be frozen for part of the year (less than 9 months).<br /><br /><span style='font-family:inherit; font-weight:bold;'>90. Herbaceous wetland</span><br />Land dominated by natural herbaceous vegetation (cover of 10% or more) that is permanently or regularly flooded by fresh, brackish or salt water. It excludes unvegetated sediment (see 60), swamp forests (classified as tree cover) and mangroves see 95).<br /><br /><span style='font-family:inherit; font-weight:bold;'>95. Mangroves</span><br />Taxonomically diverse, salt-tolerant tree and other plant species which thrive in intertidal zones of sheltered tropical shores,<br />&quot;overwash&quot; islands, and estuaries.<br /><br /><span style='font-family:inherit; font-weight:bold;'>100. Moss and lichen</span><br />Land covered with lichens and/or mosses. Lichens are composite organisms formed from the symbiotic association of fungi and algae. Mosses contain photo-autotrophic land plants without true leaves, stems, roots but with leaf-and stemlike organs.</div></div>",
			"keyword": [
				"mangrove",
				"mangroves",
				"sentinel-2",
				"sentinel-1",
				"land cover",
				"landcover",
				"WorldCover",
				"ESA",
				"environment",
				"esri_environment",
				"hosted"
			],
			"issued": "2023-09-20T18:08:48.000Z",
			"modified": "2023-09-29T17:20:49.000Z",
			"publisher": {
				"name": "Pacific GeoPortal - Core Organization"
			},
			"contactPoint": {
				"@type": "vcard:Contact",
				"fn": "dkaragulle_pacificcore",
				"hasEmail": "mailto:pacific_geoportal@esri.com"
			},
			"accessLevel": "public",
			"spatial": "143.1190,-19.4704,166.2782,0.0728",
			"license": "<img src='https://downloads.esri.com/blogs/arcgisonline/esrilogo_new.png' style='max-width:100%; height:auto; font-family:&quot;Avenir Next W01&quot;, &quot;Avenir Next W00&quot;, &quot;Avenir Next&quot;, Avenir, &quot;Helvetica Neue&quot;, sans-serif; font-size:16px;' /><span style='font-family:&quot;Avenir Next W01&quot;, &quot;Avenir Next W00&quot;, &quot;Avenir Next&quot;, Avenir, &quot;Helvetica Neue&quot;, sans-serif; font-size:16px;'> This work is licensed under the Esri Master License Agreement.</span><br /><div style='font-family:&quot;Avenir Next W01&quot;, &quot;Avenir Next W00&quot;, &quot;Avenir Next&quot;, Avenir, &quot;Helvetica Neue&quot;, sans-serif; font-size:16px;'><a href='https://goto.arcgis.com/termsofuse/viewsummary' style='color:rgb(0, 97, 155); text-decoration-line:none;' target='_blank' rel='nofollow ugc noopener noreferrer'><b>View Summary</b></a> | <a href='https://goto.arcgis.com/termsofuse/viewtermsofuse' style='color:rgb(0, 97, 155); text-decoration-line:none;' target='_blank' rel='nofollow ugc noopener noreferrer'><b>View Terms of Use</b></a></div>",
			"distribution": [
				{
					"@type": "dcat:Distribution",
					"title": "ArcGIS Hub Dataset",
					"format": "Web Page",
					"mediaType": "text/html",
					"accessURL": "https://www.pacificgeoportal.com/maps/pacificcore::european-space-agency-worldcover-2020-land-cover-for-pacific-region"
				}
			],
			"theme": [
				"geospatial"
			]
		},
		{
			"@type": "dcat:Dataset",
			"identifier": "https://www.arcgis.com/home/item.html?id=00bad37bdb0d467287fb6f0d12b0841a",
			"landingPage": "https://www.pacificgeoportal.com/apps/pacificcore::pacific-region-landforms",
			"title": "Pacific Region: Landforms",
			"description": "<p></p><p>Landforms are large recognizable features such as mountains, hills and plains; they are an important determinant of ecological character, habitat definition and terrain analysis. </p><p>Landforms are important to the distribution of life in natural systems and are the basis for opportunities in built systems, and therefore landforms play a useful role in all natural science fields of study and planning disciplines.</p>",
			"keyword": [
				""
			],
			"issued": "2023-09-22T20:19:03.000Z",
			"modified": "2023-09-26T22:54:54.000Z",
			"publisher": {
				"name": "Pacific GeoPortal - Core Organization"
			},
			"contactPoint": {
				"@type": "vcard:Contact",
				"fn": "dkaragulle_pacificcore",
				"hasEmail": "mailto:pacific_geoportal@esri.com"
			},
			"accessLevel": "public",
			"spatial": "",
			"license": "",
			"distribution": [
				{
					"@type": "dcat:Distribution",
					"title": "ArcGIS Hub Dataset",
					"format": "Web Page",
					"mediaType": "text/html",
					"accessURL": "https://www.pacificgeoportal.com/apps/pacificcore::pacific-region-landforms"
				},
				{
					"@type": "dcat:Distribution",
					"title": "ArcGIS GeoService",
					"format": "ArcGIS GeoServices REST API",
					"mediaType": "application/json",
					"accessURL": "https://storymaps.arcgis.com/stories/00bad37bdb0d467287fb6f0d12b0841a"
				}
			],
			"theme": ""
		},
		{
			"@type": "dcat:Dataset",
			"identifier": "https://www.arcgis.com/home/item.html?id=88e0902600694f0fb37503c2259a63d3",
			"landingPage": "https://www.pacificgeoportal.com/maps/pacificcore::pacific-region-anti-shipping-activity-messages",
			"title": "Pacific Region Anti-Shipping Activity Messages",
			"description": "This is a subset of <a href='https://www.arcgis.com/home/item.html?id=fdcbea85edc5446da0bbc6c913fcd46e' target='_blank' rel='nofollow ugc noopener noreferrer'>Anti Shipping Activity Messages</a> for the Pacific Region. <div><div style='font-family:&quot;Avenir Next W01&quot;, &quot;Avenir Next W00&quot;, &quot;Avenir Next&quot;, Avenir, &quot;Helvetica Neue&quot;, sans-serif; font-size:16px; text-align:center;'><strong><span style='font-family:inherit; color:rgb(0, 0, 0);'><font size='6' style='font-family:inherit;'>pi·ra·cy</font></span></strong></div><div style='font-family:&quot;Avenir Next W01&quot;, &quot;Avenir Next W00&quot;, &quot;Avenir Next&quot;, Avenir, &quot;Helvetica Neue&quot;, sans-serif; font-size:16px; text-align:center;'><strong><span style='font-family:inherit; color:rgb(0, 0, 0);'><font size='6' style='font-family:inherit;'><br /></font></span></strong></div><p style='margin-top:0px; margin-bottom:1.5rem; font-family:&quot;Avenir Next W01&quot;, &quot;Avenir Next W00&quot;, &quot;Avenir Next&quot;, Avenir, &quot;Helvetica Neue&quot;, sans-serif; font-size:16px;'>The United Nations Convention on the Law of the Sea (UNCLOS) defines &quot;Piracy&quot; and: </p><div style='font-family:&quot;Avenir Next W01&quot;, &quot;Avenir Next W00&quot;, &quot;Avenir Next&quot;, Avenir, &quot;Helvetica Neue&quot;, sans-serif; font-size:16px; padding-left:30px;'>(a) any illegal acts of violence or detention, or any act of depredation, committed for private ends by the crew or the passengers of a private ship or a private aircraft, and directed: </div><div style='font-family:&quot;Avenir Next W01&quot;, &quot;Avenir Next W00&quot;, &quot;Avenir Next&quot;, Avenir, &quot;Helvetica Neue&quot;, sans-serif; font-size:16px; padding-left:60px;'>(i) on the high seas, against another ship or aircraft, or against persons or property on board such ship or aircraft; </div><div style='font-family:&quot;Avenir Next W01&quot;, &quot;Avenir Next W00&quot;, &quot;Avenir Next&quot;, Avenir, &quot;Helvetica Neue&quot;, sans-serif; font-size:16px; padding-left:60px;'>(ii) against a ship, aircraft, persons or property in a place outside the jurisdiction of any State; </div><p style='margin-top:0px; margin-bottom:1.5rem; font-family:&quot;Avenir Next W01&quot;, &quot;Avenir Next W00&quot;, &quot;Avenir Next&quot;, Avenir, &quot;Helvetica Neue&quot;, sans-serif; font-size:16px; padding-left:30px;'>(b) any act of voluntary participation in the operation of a ship or of an aircraft with knowledge of facts making it a pirate ship or aircraft; </p><p style='margin-top:0px; margin-bottom:1.5rem; font-family:&quot;Avenir Next W01&quot;, &quot;Avenir Next W00&quot;, &quot;Avenir Next&quot;, Avenir, &quot;Helvetica Neue&quot;, sans-serif; font-size:16px; padding-left:30px;'>(c) any act of inciting or of intentionally facilitating an act described in subparagraph (a) or (b).</p><div style='font-family:&quot;Avenir Next W01&quot;, &quot;Avenir Next W00&quot;, &quot;Avenir Next&quot;, Avenir, &quot;Helvetica Neue&quot;, sans-serif; font-size:16px;'><p style='margin-top:0px; margin-bottom:1.5rem;'>Pirate attacks affect many different parties, including the flag state of the vessel that is attacked, the states of nationality of the crew members aboard the attacked vessel, the state from which the pirates originate, the state in whose waters (if any) the attack occurs, the states of the ship and cargo owners, and the states for which cargo on attacked vessels is destined. In addition to their immediate impacts on the vessels, individuals, and cargo involved in an attack, sustained episodes of piracy can affect international shipping rates (by leading to the diversion of cargoes to other shipping lanes) and lead to increases in insurance rates. Further, they can isolate those states from which the piracy is originating if vessels refuse to make port calls in those nations.</p><p style='margin-top:0px; margin-bottom:1.5rem;'>Anti-shipping Activity Messages (ASAM) include the locations and descriptive accounts of specific hostile acts against ships and mariners. The reports may be useful for recognition, prevention and avoidance of potential hostile activity.</p><p style='margin-top:0px; margin-bottom:1.5rem;'>This layer can be searched using ASAM reference number(s), sub region, or occurrence date(s). Each record includes the date of occurrence, an ASAM reference number, the number identifying the geographical subregion, the latitude and longitude of the geographical location, the aggressor if known, the type of vessel victimized, the name of the vessel victimized and a detailed description of the occurrence.</p><p style='margin-top:0px; margin-bottom:1.5rem;'>Data are checked daily and updated accordingly :  <a href='https://msi.nga.mil/Piracy' style='color:rgb(0, 97, 155); text-decoration-line:none; font-family:inherit;' rel='nofollow ugc'>https://msi.nga.mil/Piracy</a></p><p style='margin-top:0px; margin-bottom:1.5rem;'>Related Documents: <a href='https://www.hsdl.org/?view&amp;did=755125' style='color:rgb(0, 97, 155); text-decoration-line:none; font-family:inherit;' rel='nofollow ugc'>United States Counter Piracy and Maritime Security Action Plan</a>, <a href='https://www.oni.navy.mil/News/Shipping-Threat-Reports/' style='color:rgb(0, 97, 155); text-decoration-line:none; font-family:inherit;' rel='nofollow ugc'>Worldwide Threat to Shipping</a>, <a href='https://www.hsdl.org/?view&amp;did=12005' style='color:rgb(0, 97, 155); text-decoration-line:none; font-family:inherit;' rel='nofollow ugc'>Piracy: A Legal Definition</a>, <a href='https://www.hsdl.org/?abstract&amp;did=36978' style='color:rgb(0, 97, 155); text-decoration-line:none; font-family:inherit;' rel='nofollow ugc'>International Piracy on the High Seas</a></p></div></div>",
			"keyword": [
				"Maritime Safety Information",
				"Live Feeds",
				"livefeeds",
				"Piracy",
				"Anti-Piracy",
				"Anti-shipping",
				"Maritime Safety",
				"environment",
				"esri_environment",
				"hosted",
				"ocean",
				"oceans"
			],
			"issued": "2023-09-26T22:24:40.000Z",
			"modified": "2023-09-26T22:27:39.000Z",
			"publisher": {
				"name": "Pacific GeoPortal - Core Organization"
			},
			"contactPoint": {
				"@type": "vcard:Contact",
				"fn": "dkaragulle_pacificcore",
				"hasEmail": "mailto:pacific_geoportal@esri.com"
			},
			"accessLevel": "public",
			"spatial": "-180.0000,-53.2470,-89.7363,43.3633",
			"license": "<img src='https://downloads.esri.com/blogs/arcgisonline/esrilogo_new.png' style='max-width:100%; height:auto; font-family:&quot;Avenir Next W01&quot;, &quot;Avenir Next W00&quot;, &quot;Avenir Next&quot;, Avenir, &quot;Helvetica Neue&quot;, sans-serif; font-size:16px;' /><span style='font-family:&quot;Avenir Next W01&quot;, &quot;Avenir Next W00&quot;, &quot;Avenir Next&quot;, Avenir, &quot;Helvetica Neue&quot;, sans-serif; font-size:16px;'> This work is licensed under the Esri Master License Agreement.</span><br /><div style='font-family:&quot;Avenir Next W01&quot;, &quot;Avenir Next W00&quot;, &quot;Avenir Next&quot;, Avenir, &quot;Helvetica Neue&quot;, sans-serif; font-size:16px;'><a href='https://goto.arcgis.com/termsofuse/viewsummary' style='color:rgb(0, 97, 155); text-decoration-line:none;' target='_blank' rel='nofollow ugc noopener noreferrer'><b>View Summary</b></a> | <a href='https://goto.arcgis.com/termsofuse/viewtermsofuse' style='color:rgb(0, 97, 155); text-decoration-line:none;' target='_blank' rel='nofollow ugc noopener noreferrer'><b>View Terms of Use</b></a></div>",
			"distribution": [
				{
					"@type": "dcat:Distribution",
					"title": "ArcGIS Hub Dataset",
					"format": "Web Page",
					"mediaType": "text/html",
					"accessURL": "https://www.pacificgeoportal.com/maps/pacificcore::pacific-region-anti-shipping-activity-messages"
				}
			],
			"theme": [
				"geospatial"
			]
		},
		{
			"@type": "dcat:Dataset",
			"identifier": "https://www.arcgis.com/home/item.html?id=f70526cf5328435a898d87466e834408",
			"landingPage": "https://www.pacificgeoportal.com/maps/pacificcore::pacific-region-recent-hurricanes-cyclones-and-typhoons",
			"title": "Pacific Region Recent Hurricanes, Cyclones and Typhoons",
			"description": "<div style='font-family:&quot;Avenir Next W01&quot;, &quot;Avenir Next W00&quot;, &quot;Avenir Next&quot;, Avenir, &quot;Helvetica Neue&quot;, sans-serif; font-size:16px;'>This layer is a subset of Global Recent Hurricanes, Cyclones and Typhoons. You can access the global coverage from <a href='https://www.arcgis.com/home/item.html?id=adfe292a67f8471a9d8230ef93294414' target='_blank' rel='nofollow ugc noopener noreferrer'>here.</a> </div><div style='font-family:&quot;Avenir Next W01&quot;, &quot;Avenir Next W00&quot;, &quot;Avenir Next&quot;, Avenir, &quot;Helvetica Neue&quot;, sans-serif; font-size:16px;'><br /></div><div style='font-family:&quot;Avenir Next W01&quot;, &quot;Avenir Next W00&quot;, &quot;Avenir Next&quot;, Avenir, &quot;Helvetica Neue&quot;, sans-serif; font-size:16px;'>This layer features tropical storm (hurricanes, typhoons, cyclones) tracks, positions, and observed wind swaths from the past hurricane season for the Atlantic, Pacific, and Indian Basins. These are products from the <a href='https://www.nhc.noaa.gov/' style='color:rgb(0, 97, 155); text-decoration-line:none; font-family:inherit;' target='_blank' rel='nofollow ugc noopener noreferrer'>National Hurricane Center</a> (NHC) and <a href='https://www.usno.navy.mil/JTWC/' style='color:rgb(0, 97, 155); text-decoration-line:none; font-family:inherit;' target='_blank' rel='nofollow ugc noopener noreferrer'>Joint Typhoon Warning Center</a> (JTWC). They are part of an archive of tropical storm data maintained in the <a href='https://www.ncdc.noaa.gov/ibtracs/' style='color:rgb(0, 97, 155); text-decoration-line:none; font-family:inherit;' target='_blank' rel='nofollow ugc noopener noreferrer'>International Best Track Archive for Climate Stewardship</a> (IBTrACS) database by the <a href='https://www.ncei.noaa.gov/' style='color:rgb(0, 97, 155); text-decoration-line:none; font-family:inherit;' target='_blank' rel='nofollow ugc noopener noreferrer'>NOAA National Centers for Environmental Information</a>.</div><div style='font-family:&quot;Avenir Next W01&quot;, &quot;Avenir Next W00&quot;, &quot;Avenir Next&quot;, Avenir, &quot;Helvetica Neue&quot;, sans-serif; font-size:16px;'><br /></div><div style='font-family:&quot;Avenir Next W01&quot;, &quot;Avenir Next W00&quot;, &quot;Avenir Next&quot;, Avenir, &quot;Helvetica Neue&quot;, sans-serif; font-size:16px;'><span style='font-family:inherit; font-weight:bold;'>Data Source</span></div><div style='font-family:&quot;Avenir Next W01&quot;, &quot;Avenir Next W00&quot;, &quot;Avenir Next&quot;, Avenir, &quot;Helvetica Neue&quot;, sans-serif; font-size:16px;'><ul><li>NOAA National Hurricane Center <a href='https://www.nhc.noaa.gov/gis/archive_besttrack.php' style='color:rgb(0, 97, 155); text-decoration-line:none; font-family:inherit;' target='_blank' rel='nofollow ugc noopener noreferrer'>tropical cyclone best track archive</a>.</li></ul></div><div style='font-family:&quot;Avenir Next W01&quot;, &quot;Avenir Next W00&quot;, &quot;Avenir Next&quot;, Avenir, &quot;Helvetica Neue&quot;, sans-serif; font-size:16px;'><span style='font-family:inherit; font-weight:bold;'>Update Frequency</span></div><div style='font-family:&quot;Avenir Next W01&quot;, &quot;Avenir Next W00&quot;, &quot;Avenir Next&quot;, Avenir, &quot;Helvetica Neue&quot;, sans-serif; font-size:16px;'><ul><li>We automatically check these products for updates every 15 minutes from the <a href='https://www.nhc.noaa.gov/gis/' style='color:rgb(0, 97, 155); text-decoration-line:none; font-family:inherit;' target='_blank' rel='nofollow ugc noopener noreferrer'>NHC GIS Data page</a>.</li><li>The NHC shapefiles are parsed using the <a href='https://www.esriurl.com/LiveFeed' style='color:rgb(0, 97, 155); text-decoration-line:none; font-family:inherit;' target='_blank' rel='nofollow ugc noopener noreferrer'>Aggregated Live Feeds methodology</a> to take the returned information and serve the data through ArcGIS Server as a map service.</li></ul></div><div style='font-family:&quot;Avenir Next W01&quot;, &quot;Avenir Next W00&quot;, &quot;Avenir Next&quot;, Avenir, &quot;Helvetica Neue&quot;, sans-serif; font-size:16px;'><span style='font-family:inherit; font-weight:bold;'>Area Covered</span></div><div style='font-family:&quot;Avenir Next W01&quot;, &quot;Avenir Next W00&quot;, &quot;Avenir Next&quot;, Avenir, &quot;Helvetica Neue&quot;, sans-serif; font-size:16px;'><ul><li>Pacific Region</li></ul></div><div style='font-family:&quot;Avenir Next W01&quot;, &quot;Avenir Next W00&quot;, &quot;Avenir Next&quot;, Avenir, &quot;Helvetica Neue&quot;, sans-serif; font-size:16px;'><font size='3' style='font-family:inherit;'>What can you do with this layer?</font></div><div style='font-family:&quot;Avenir Next W01&quot;, &quot;Avenir Next W00&quot;, &quot;Avenir Next&quot;, Avenir, &quot;Helvetica Neue&quot;, sans-serif; font-size:16px;'><ul><li>Customize the display of each attribute by using the ‘Change Style’ option for any layer.<br /></li><li>Run a filter to query the layer and display only specific types of storms or areas.</li><li>Add to your map with other weather data layers to provide insight on hazardous weather events.</li><li>Use ArcGIS Online analysis tools like ‘Enrich Data’ on the Observed Wind Swath layer to determine the impact of cyclone events on populations.</li><li>Visualize data in ArcGIS Insights or Operations Dashboards.</li></ul><span style='font-family:inherit; color:rgb(128, 128, 128);'>This map is provided for informational purposes and is not monitored 24/7 for accuracy and currency. Always refer to <a href='https://www.nhc.noaa.gov/contact.shtml' style='color:rgb(0, 97, 155); text-decoration-line:none; font-family:inherit;' target='_blank' rel='nofollow ugc noopener noreferrer'>NOAA</a> or JTWC sources for official guidance.</span><div style='font-family:inherit;'><br /></div>If you would like to be alerted to potential issues or simply see when this Service will update next, please visit our <a href='https://livingatlas.arcgis.com/livefeeds-status/' style='color:rgb(0, 97, 155); text-decoration-line:none; font-family:inherit;' target='_blank' rel='nofollow ugc noopener noreferrer'>Live Feed Status</a> Page!</div>",
			"keyword": [
				""
			],
			"issued": "2023-09-22T19:04:06.000Z",
			"modified": "2023-09-26T21:30:50.000Z",
			"publisher": {
				"name": "Pacific GeoPortal - Core Organization"
			},
			"contactPoint": {
				"@type": "vcard:Contact",
				"fn": "dkaragulle_pacificcore",
				"hasEmail": "mailto:pacific_geoportal@esri.com"
			},
			"accessLevel": "public",
			"spatial": "129.4629,-42.3198,180.0000,31.2482",
			"license": "<img src='https://downloads.esri.com/blogs/arcgisonline/esrilogo_new.png' style='max-width:100%; height:auto; font-family:&quot;Avenir Next W01&quot;, &quot;Avenir Next W00&quot;, &quot;Avenir Next&quot;, Avenir, &quot;Helvetica Neue&quot;, sans-serif; font-size:16px;' /><span style='font-family:&quot;Avenir Next W01&quot;, &quot;Avenir Next W00&quot;, &quot;Avenir Next&quot;, Avenir, &quot;Helvetica Neue&quot;, sans-serif; font-size:16px;'> This work is licensed under the Esri Master License Agreement.</span><br /><div style='font-family:&quot;Avenir Next W01&quot;, &quot;Avenir Next W00&quot;, &quot;Avenir Next&quot;, Avenir, &quot;Helvetica Neue&quot;, sans-serif; font-size:16px;'><a href='https://goto.arcgis.com/termsofuse/viewsummary' style='color:rgb(0, 97, 155); text-decoration-line:none;' target='_blank' rel='nofollow ugc noopener noreferrer'><b>View Summary</b></a> | <a href='https://goto.arcgis.com/termsofuse/viewtermsofuse' style='color:rgb(0, 97, 155); text-decoration-line:none;' target='_blank' rel='nofollow ugc noopener noreferrer'><b>View Terms of Use</b></a></div>",
			"distribution": [
				{
					"@type": "dcat:Distribution",
					"title": "ArcGIS Hub Dataset",
					"format": "Web Page",
					"mediaType": "text/html",
					"accessURL": "https://www.pacificgeoportal.com/maps/pacificcore::pacific-region-recent-hurricanes-cyclones-and-typhoons"
				}
			],
			"theme": [
				"geospatial"
			]
		},
		{
			"@type": "dcat:Dataset",
			"identifier": "https://www.arcgis.com/home/item.html?id=7d708d28d9d8452c96b4646e32492442",
			"landingPage": "https://www.pacificgeoportal.com/maps/pacificcore::pacific-region-terrestrial-ecosystems",
			"title": "Pacific Region Terrestrial Ecosystems",
			"description": "<div style='font-family:inherit;'>This map is the subset of the <a href='https://www.arcgis.com/home/item.html?id=926a206393ec40a590d8caf29ae9a93e' target='_blank' rel='nofollow ugc noopener noreferrer'>World Terrestrial Ecosystems map</a>, prepared specifcally for the Pacific Region. The World Terrestrial Ecosystems map<span style='font-family:inherit;'> classifies the world into areas of similar climate, landform, and land cover, which form the basic components of any terrestrial ecosystem structure. </span></div><div style='font-family:inherit;'><br /></div><div style='font-family:inherit;'>This map is important because it uses objectively derived and globally consistent data to characterize the ecosystems at a much finer spatial resolution (250-m) than existing ecoregionalizations, and a much finer thematic resolution (431 classes) than existing global land cover products.</div><div style='font-family:inherit;'><br /></div><div style='font-family:inherit;'><div style='font-family:inherit;'><b>Cell Size</b>: 250-meter </div><div style='font-family:inherit;'><b>Source Type</b>: Thematic</div><div style='font-family:inherit;'><b>Pixel Type</b>: 16 Bit Unsigned</div><div style='font-family:inherit;'><b>Data Projection</b>: GCS WGS84</div><div style='font-family:inherit;'><b>Extent</b>: Global</div><div style='font-family:inherit;'><b>Source</b>: USGS, The Nature Conservancy, Esri</div><div style='font-family:inherit;'><b>Update Cycle</b>: None</div></div><div style='font-family:inherit;'><br /></div><div style='font-family:inherit;'><div style='font-family:inherit;'><font size='4' style='font-family:inherit;'>What can you do with this layer?</font></div><div style='font-family:inherit;'>This map allows you to query the land surface pixels and returns the values of all the input parameters (landform type, landcover/vegetation type, climate region) and the name of the terrestrial ecosystem at that location.</div><div style='font-family:inherit;'><br /></div><div style='font-family:inherit;'>This layer can be used in analysis at global and local regions. However, for large scale spatial analysis, we have also provided an <a href='https://www.arcgis.com/home/item.html?id=3bfa1aa4cd9844d5a0922540210da25b' style='color:rgb(0, 97, 155); text-decoration-line:none; font-family:inherit;' target='_blank' rel='nofollow ugc noopener noreferrer'>ArcGIS Pro Package</a> that contains the original raster data with multiple table attributes. For simple mapping applications, there is also a <a href='https://www.arcgis.com/home/item.html?id=d9434e94c817434c8448445501aee60a' style='color:rgb(0, 97, 155); text-decoration-line:none; font-family:inherit;' target='_blank' rel='nofollow ugc noopener noreferrer'>raster tile layer</a>. </div><div style='font-family:inherit;'><br /></div><div style='font-family:inherit;'>This layer can be combined with the <a href='https://www.arcgis.com/home/item.html?id=ae78aeb913a343d69e950b53e29076f7' style='color:rgb(0, 97, 155); text-decoration-line:none; font-family:inherit;' target='_blank' rel='nofollow ugc noopener noreferrer'>World Protected Areas Database</a> to assess the types of ecosystems that are protected, and progress towards meeting conservation goals. The WDPA layer updates monthly from the United Nations Environment Programme.</div><div style='font-family:inherit;'><br /></div><div style='font-family:inherit;'><font size='4' style='font-family:inherit;'>Developing the World Terrestrial Ecosystems</font></div><div style='font-family:inherit;'>World Terrestrial Ecosystems map was produced by adopting and modifying the Intergovernmental Panel on Climate Change (IPCC) approach on the definition of Terrestrial Ecosystems and development of standardized global climate regions using the values of environmental moisture regime and temperature regime. We then combined the values of Global Climate Regions, Landforms and matrix-forming vegetation assemblage or land use, using the ArcGIS Combine tool (Spatial Analyst) to produce World Ecosystems Dataset. This combination resulted of 431 World Ecosystems classes.</div><div style='font-family:inherit;'><br /></div><div style='font-family:inherit;'>Each combination was assigned a color using an algorithm that blended traditional color schemes for each of the three components. Every pixel in this map is symbolized by a combination of values for each of these fields.</div><div style='font-family:inherit;'><br /></div><div style='font-family:inherit;'>The work from this collaboration is documented in the publication:</div><div style='font-family:inherit;'><a href='https://www.sciencedirect.com/science/article/pii/S2351989419307231' style='color:rgb(0, 97, 155); text-decoration-line:none; font-family:inherit;' target='_blank' rel='nofollow ugc noopener noreferrer'>Sayre et al. 2020.  An assessment of the representation of ecosystems in global protected areas using new maps of World Climate Regions and World Ecosystems - Global Ecology and Conservation</a>  </div><div style='font-family:inherit;'><br /></div><div style='font-family:inherit;'>More information about World Terrestrial Ecosystems can be found in <a href='https://storymaps.arcgis.com/stories/a4a6b1f779be4b64816d1876cfe669b9' style='color:rgb(0, 97, 155); text-decoration-line:none; font-family:inherit;' target='_blank' rel='nofollow ugc noopener noreferrer'>this Story Map</a>. </div></div><div style='font-family:inherit;'><br /></div><div style='font-family:inherit;'><br /></div>",
			"keyword": [
				"esri_environment",
				"environment",
				"landscape",
				"worldecosystems",
				"terrestrialecosystems",
				"sdg15",
				"sdg",
				"landscape12"
			],
			"issued": "2023-09-19T23:44:05.000Z",
			"modified": "2023-09-26T17:23:52.000Z",
			"publisher": {
				"name": "Pacific GeoPortal - Core Organization"
			},
			"contactPoint": {
				"@type": "vcard:Contact",
				"fn": "dkaragulle_pacificcore",
				"hasEmail": "mailto:pacific_geoportal@esri.com"
			},
			"accessLevel": "public",
			"spatial": "137.0215,-30.8668,180.0000,7.3598",
			"license": "<img src='https://downloads.esri.com/blogs/arcgisonline/esrilogo_new.png' style='max-width:100%; height:auto; font-family:&quot;Avenir Next W01&quot;, &quot;Avenir Next W00&quot;, &quot;Avenir Next&quot;, Avenir, &quot;Helvetica Neue&quot;, sans-serif; font-size:16px;' /><span style='font-family:&quot;Avenir Next W01&quot;, &quot;Avenir Next W00&quot;, &quot;Avenir Next&quot;, Avenir, &quot;Helvetica Neue&quot;, sans-serif; font-size:16px;'> This work is licensed under the Esri Master License Agreement.</span><br /><div style='font-family:&quot;Avenir Next W01&quot;, &quot;Avenir Next W00&quot;, &quot;Avenir Next&quot;, Avenir, &quot;Helvetica Neue&quot;, sans-serif; font-size:16px;'><a href='https://goto.arcgis.com/termsofuse/viewsummary' style='color:rgb(0, 97, 155); text-decoration-line:none;' target='_blank' rel='nofollow ugc noopener noreferrer'><b>View Summary</b></a> | <a href='https://goto.arcgis.com/termsofuse/viewtermsofuse' style='color:rgb(0, 97, 155); text-decoration-line:none;' target='_blank' rel='nofollow ugc noopener noreferrer'><b>View Terms of Use</b></a></div>",
			"distribution": [
				{
					"@type": "dcat:Distribution",
					"title": "ArcGIS Hub Dataset",
					"format": "Web Page",
					"mediaType": "text/html",
					"accessURL": "https://www.pacificgeoportal.com/maps/pacificcore::pacific-region-terrestrial-ecosystems"
				}
			],
			"theme": [
				"geospatial"
			]
		},
		{
			"@type": "dcat:Dataset",
			"identifier": "https://www.arcgis.com/home/item.html?id=69ae0bd3b541444a85543acea8f3955b",
			"landingPage": "https://www.pacificgeoportal.com/maps/pacificcore::pacific-region-noaa-coral-reef-watch-crw-virtual-stations",
			"title": "Pacific Region NOAA Coral Reef Watch (CRW) Virtual Stations",
			"description": "<div style='font-family:&quot;Avenir Next W01&quot;, &quot;Avenir Next W00&quot;, &quot;Avenir Next&quot;, Avenir, &quot;Helvetica Neue&quot;, sans-serif; font-size:16px;'><span style='font-family:inherit; text-align:justify;'>This layer is a subset of </span><a href='https://www.arcgis.com/home/item.html?id=26e71d14067c4b3f8dd31d1a4e008cfb' target='_blank' rel='nofollow ugc noopener noreferrer'>NOAA Coral Reef Watch (CRW) Virtual Stations Layer.</a><span style='font-family:inherit; text-align:justify;'> Coral reefs are one of the most diverse and ecologically important areas of the world. However, many reefs, are threatened by ocean temperatures that are increasingly becoming warmer than the coral animals' natural tolerance. According to </span><a href='https://oceanservice.noaa.gov/facts/coral_bleach.html' style='color:rgb(0, 97, 155); text-decoration-line:none; font-family:inherit;' target='_blank' rel='nofollow ugc noopener noreferrer'><span style='font-family:inherit; font-weight:bold;'>NOAA</span></a><span style='font-family:inherit; text-align:justify;'>, when </span>water is too warm, corals will expel the algae (zooxanthellae) living in their tissues causing the coral to turn completely white. This is called coral bleaching. When a coral bleaches, it is not dead. Corals can survive a bleaching event, but they are under more stress and are subject to mortality.</div><span style='font-family:&quot;Avenir Next W01&quot;, &quot;Avenir Next W00&quot;, &quot;Avenir Next&quot;, Avenir, &quot;Helvetica Neue&quot;, sans-serif; font-size:16px; text-align:justify;'><div style='font-family:inherit;'><br /></div>The </span><a href='https://coralreefwatch.noaa.gov/' style='color:rgb(0, 97, 155); text-decoration-line:none; font-family:&quot;Avenir Next W01&quot;, &quot;Avenir Next W00&quot;, &quot;Avenir Next&quot;, Avenir, &quot;Helvetica Neue&quot;, sans-serif; font-size:16px;' target='_blank' rel='nofollow ugc noopener noreferrer'><span style='font-family:inherit; font-weight:bold;'>NOAA Coral Reef Watch</span></a><span style='font-family:&quot;Avenir Next W01&quot;, &quot;Avenir Next W00&quot;, &quot;Avenir Next&quot;, Avenir, &quot;Helvetica Neue&quot;, sans-serif; font-size:16px; text-align:justify;'> program uses satellite data to provide current reef environmental conditions to quickly identify areas at risk for coral bleaching. The station data displayed in this map are derived from satellite based measurements of ocean temperature. These &quot;virtual stations&quot; are not actual buoys or <i>in situ</i> stations transmitting data, rather a spatial analyses for reef locations around the world are derived from 5 km resolution raster data. </span><div style='font-family:&quot;Avenir Next W01&quot;, &quot;Avenir Next W00&quot;, &quot;Avenir Next&quot;, Avenir, &quot;Helvetica Neue&quot;, sans-serif; font-size:16px; text-align:justify;'><br /></div><div style='font-family:&quot;Avenir Next W01&quot;, &quot;Avenir Next W00&quot;, &quot;Avenir Next&quot;, Avenir, &quot;Helvetica Neue&quot;, sans-serif; font-size:16px; text-align:justify;'>There are 213 points for the virtual stations around the world along with polygons describing the major tropical coral reef systems. </div><div style='font-family:&quot;Avenir Next W01&quot;, &quot;Avenir Next W00&quot;, &quot;Avenir Next&quot;, Avenir, &quot;Helvetica Neue&quot;, sans-serif; font-size:16px;'><span style='font-family:inherit; text-align:justify;'><br /></span></div><div style='font-family:&quot;Avenir Next W01&quot;, &quot;Avenir Next W00&quot;, &quot;Avenir Next&quot;, Avenir, &quot;Helvetica Neue&quot;, sans-serif; font-size:16px;'><span style='font-family:inherit; text-align:justify;'><b>Each station has several variables: </b></span></div><div style='font-family:&quot;Avenir Next W01&quot;, &quot;Avenir Next W00&quot;, &quot;Avenir Next&quot;, Avenir, &quot;Helvetica Neue&quot;, sans-serif; font-size:16px; text-align:justify;'><ul><li><span style='font-family:inherit;'><i>Alert Level</i>: an index of the likelihood of coral bleaching, scaled from 0 (no heat stress) to 4 (coral mortality likely) based on the attributes below</span><span style='font-family:inherit;'></span></li><li><span style='font-family:inherit;'><i>Sea surface temperature</i>: average temperature of the ocean surface derived from satellite measurements</span></li><li><i>Temperature anomaly</i>: a comparison of the current surface temperature to the 1981-2010 historical average</li><li><i>Hotspots</i>: number of degrees above the coral's threshold tolerance</li><li><i>Degree Heating Weeks</i>: accumulated thermal stress experienced by corals</li></ul><div style='font-family:inherit;'><font size='5' style='font-family:inherit;'>Maintenance</font></div><div style='font-family:inherit;'><ul><li>Service data is maintained by the Overwrite Feature Service script running as a Scheduled Notebook Task</li><li>See <a href='https://www.arcgis.com/home/item.html?id=cd5819375aca40a3a7f8b3a269404c2c' style='color:rgb(0, 97, 155); text-decoration-line:none; font-family:inherit;' target='_blank' rel='nofollow ugc noopener noreferrer'><span style='font-family:inherit; font-weight:bold;'>Sample OverwriteFS Notebook</span></a></li></ul><div style='font-family:inherit;'><font size='5' style='font-family:inherit;'>Revisions</font></div><div style='font-family:inherit;'><ul><li><span style='font-family:inherit; font-weight:bold;'>Jul 28, 2023</span>: Applied updated Symbology and Popups from <a href='https://www.arcgis.com/apps/mapviewer/index.html?webmap=cf77e070aa014f2ca25b43c0ec3d5b92' style='color:rgb(0, 97, 155); text-decoration-line:none; font-family:inherit;' target='_blank' rel='nofollow ugc noopener noreferrer'><span style='font-family:inherit; font-weight:bold;'>Coral Reef Bleaching Stations</span></a> Web Map</li></ul></div></div></div>",
			"keyword": [
				"Coral",
				"Reef",
				"Bleaching",
				"NOAA",
				"heat stress",
				"Ocean",
				"oceans",
				"esri_o",
				"esri_environment",
				"environment"
			],
			"issued": "2023-09-20T00:14:23.000Z",
			"modified": "2023-09-26T17:16:45.000Z",
			"publisher": {
				"name": "Pacific GeoPortal - Core Organization"
			},
			"contactPoint": {
				"@type": "vcard:Contact",
				"fn": "dkaragulle_pacificcore",
				"hasEmail": "mailto:pacific_geoportal@esri.com"
			},
			"accessLevel": "public",
			"spatial": "-180.0000,-69.8254,-82.1338,51.6436",
			"license": "<img src='https://downloads.esri.com/blogs/arcgisonline/esrilogo_new.png' style='max-width:100%; height:auto; font-family:&quot;Avenir Next W01&quot;, &quot;Avenir Next W00&quot;, &quot;Avenir Next&quot;, Avenir, &quot;Helvetica Neue&quot;, sans-serif; font-size:16px;' /><span style='font-family:&quot;Avenir Next W01&quot;, &quot;Avenir Next W00&quot;, &quot;Avenir Next&quot;, Avenir, &quot;Helvetica Neue&quot;, sans-serif; font-size:16px;'> This work is licensed under the Esri Master License Agreement.</span><br /><div style='font-family:&quot;Avenir Next W01&quot;, &quot;Avenir Next W00&quot;, &quot;Avenir Next&quot;, Avenir, &quot;Helvetica Neue&quot;, sans-serif; font-size:16px;'><a href='https://goto.arcgis.com/termsofuse/viewsummary' style='color:rgb(0, 97, 155); text-decoration-line:none;' target='_blank' rel='nofollow ugc noopener noreferrer'><b>View Summary</b></a> | <a href='https://goto.arcgis.com/termsofuse/viewtermsofuse' style='color:rgb(0, 97, 155); text-decoration-line:none;' target='_blank' rel='nofollow ugc noopener noreferrer'><b>View Terms of Use</b></a></div>",
			"distribution": [
				{
					"@type": "dcat:Distribution",
					"title": "ArcGIS Hub Dataset",
					"format": "Web Page",
					"mediaType": "text/html",
					"accessURL": "https://www.pacificgeoportal.com/maps/pacificcore::pacific-region-noaa-coral-reef-watch-crw-virtual-stations"
				}
			],
			"theme": [
				"geospatial"
			]
		},
		{
			"@type": "dcat:Dataset",
			"identifier": "https://www.arcgis.com/home/item.html?id=1389b8aabc4347acb22dfb57116005aa",
			"landingPage": "https://www.pacificgeoportal.com/maps/pacificcore::pacific-region-landform-classes",
			"title": "Pacific Region Landform Classes",
			"description": "<div style='font-family:&quot;Avenir Next W01&quot;, &quot;Avenir Next W00&quot;, &quot;Avenir Next&quot;, Avenir, &quot;Helvetica Neue&quot;, sans-serif;'><div style='margin-bottom:3rem;'><h4 style='font-weight:400; margin:0.375rem 0px 0.75rem;'><font size='4'>This layer is a subset of <a href='https://www.arcgis.com/home/item.html?id=cd817a746aa7437cbd72a6d39cdb4559' target='_blank' rel='nofollow ugc noopener noreferrer'>World Ecological Facets Landforms Layer. </a>Landforms are large recognizable features such as mountains, hills and plains; they are an important determinant of ecological character, habitat definition and terrain analysis. Landforms are important to the distribution of life in natural systems and are the basis for opportunities in built systems, and therefore landforms play a useful role in all natural science <span style='font-family:inherit;'>fields of study </span><span style='font-family:inherit;'>and planning disciplines.</span></font></h4><div style='padding-bottom:0.375rem; max-width:100%; display:inherit;'><div style='font-family:inherit;'><span style='font-family:inherit;'><br /></span></div><div style='font-size:16px; font-family:inherit;'><span style='font-family:inherit;'><div style='font-family:&quot;Avenir Next W01&quot;, &quot;Avenir Next W00&quot;, &quot;Avenir Next&quot;, Avenir, &quot;Helvetica Neue&quot;, Helvetica, Arial, sans-serif; font-size:17px; text-align:center;'><font size='4' style='font-family:inherit;'><b>Dataset Summary</b></font></div><div style='font-family:&quot;Avenir Next W01&quot;, &quot;Avenir Next W00&quot;, &quot;Avenir Next&quot;, Avenir, &quot;Helvetica Neue&quot;, Helvetica, Arial, sans-serif; font-size:17px;'><b>Phenomenon Mapped:</b> Landforms<br /></div><div style='font-family:&quot;Avenir Next W01&quot;, &quot;Avenir Next W00&quot;, &quot;Avenir Next&quot;, Avenir, &quot;Helvetica Neue&quot;, Helvetica, Arial, sans-serif; font-size:17px;'><div style='font-family:inherit;'><b>Units:</b> Meters</div><div style='font-family:inherit;'><b>Cell Size:</b> <span style='font-family:inherit; font-size:15.3333px;'>231.91560581932</span> meters</div><div style='font-family:inherit;'><b>Source Type:</b> Thematic</div><div style='font-family:inherit;'><b>Pixel Type:</b> 8-bit unsigned integer</div><div style='font-family:inherit;'><b>Data Coordinate System:</b> WGS 1984</div><div style='font-family:inherit;'><b>Mosaic Projection:</b> Web Mercator Auxiliary Sphere</div><div style='font-family:inherit;'><b>Extent:</b> Global</div><div style='font-family:inherit;'><b>Source:</b> Esri</div><div style='font-family:inherit;'><b>Publication Date:</b> May 2016</div><div style='font-family:inherit;'><b>ArcGIS Server URL:</b> https://landscape7.arcgis.com/arcgis/</div><div style='font-family:inherit;'><br /></div></div></span></div><div style='font-size:16px; font-family:inherit;'><div style='font-family:&quot;Avenir Next W01&quot;, &quot;Avenir Next W00&quot;, &quot;Avenir Next&quot;, Avenir, &quot;Helvetica Neue&quot;, Helvetica, Arial, sans-serif; font-size:17px; margin:0px; padding:0px;'><span style='font-family:inherit;'>In February 2017, Esri updated the <span style='font-family:Calibri, &quot;sans-serif&quot;; font-size:11pt;'><span style='font-family:Helvetica, sans-serif; font-size:13pt;'>World Landforms - Improved Hammond Method </span></span>service with two display functions: Ecological Land Units landform classes and Ecological Facets landform classes. This layer represents Ecological Facets landform classes. You can view the Ecological Land Units landform classes by choosing Image Display, and changing the Renderer. </span></div><div style='font-family:&quot;Avenir Next W01&quot;, &quot;Avenir Next W00&quot;, &quot;Avenir Next&quot;, Avenir, &quot;Helvetica Neue&quot;, Helvetica, Arial, sans-serif; font-size:17px; margin:0px; padding:0px;'><span style='font-family:inherit;'><br /></span></div><div style='font-family:inherit; margin:0px; padding:0px;'></div><div style='font-family:&quot;Avenir Next W01&quot;, &quot;Avenir Next W00&quot;, &quot;Avenir Next&quot;, Avenir, &quot;Helvetica Neue&quot;, Helvetica, Arial, sans-serif; font-size:17px; margin:0px; padding:0px;'>This layer was produced using the I<span style='font-family:inherit; color:rgb(77, 77, 77);'>mproved Hammond Landform Classification Algorithm produced by Esri in 2016. </span></div><div style='font-family:inherit; margin:0px; padding:0px;'><font color='#4d4d4d' style='font-family:inherit;'><span style='font-family:inherit; font-size:17px;'>This algorithm published and described by Karagulle et al. 2017: Modeling global Hammond landform regions from 250-m elevation data in </span></font><a href='https://onlinelibrary.wiley.com/doi/abs/10.1111/tgis.12265' style='color:rgb(0, 97, 155); text-decoration-line:none; font-family:inherit;' target='_blank' rel='nofollow ugc noopener noreferrer'>Transactions in GIS</a><font color='#4d4d4d' style='font-family:inherit;'><span style='font-family:inherit; font-size:17px;'>.</span></font><br /></div><div style='font-family:inherit; margin:0px; padding:0px;'><font color='#4d4d4d' style='font-family:inherit;'><span style='font-family:inherit; font-size:17px;'><br /></span></font></div><div style='font-family:&quot;Avenir Next W01&quot;, &quot;Avenir Next W00&quot;, &quot;Avenir Next&quot;, Avenir, &quot;Helvetica Neue&quot;, Helvetica, Arial, sans-serif; font-size:17px; margin:0px; padding:0px;'><span style='font-family:inherit; color:rgb(77, 77, 77);'>The algorithm, which is based on the most recent work in this area by </span><font color='#4d4d4d' style='font-family:inherit;'><span style='font-family:inherit;'>Morgan, J. &amp;  Lesh, A. 2005: <i>Developing Landform Maps Using Esri’s Model Builder</i>., </span>Esri converted Morgan’s model into a Python script and revised it to work on global 250-meter resolution </font><a href='https://topotools.cr.usgs.gov/gmted_viewer/' style='color:rgb(33, 117, 155); text-decoration-line:none; font-family:inherit;' target='_blank' rel='nofollow ugc noopener noreferrer'>GMTED2010</a><font color='#4d4d4d' style='font-family:inherit;'> elevation data. <span style='font-family:inherit;'>Hammond’s landform classification characterizes regions rather than identifying individual features, thus, this layer contains sixteen classes of landforms:</span></font></div></div><div style='font-size:16px; font-family:inherit;'><div style='font-family:inherit;'><ul><li><span style='font-family:inherit;'>Nearly flat plains</span><br /></li><li><span style='font-family:inherit;'>Smooth plains with some local relief</span><br /></li><li><span style='font-family:inherit;'>Irregular plains with moderate relief </span><br /></li><li><span style='font-family:inherit;'>Irregular plains with low hills</span><br /></li><li><span style='font-family:inherit;'>Scattered moderate hills</span><br /></li><li><span style='font-family:inherit;'>Scattered high hills</span><br /></li><li><span style='font-family:inherit;'>Scattered low mountains</span><br /></li><li><span style='font-family:inherit;'>Scattered high mountains</span><br /></li><li><span style='font-family:inherit;'>Moderate hills</span><br /></li><li><span style='font-family:inherit;'>High hills </span><br /></li><li><span style='font-family:inherit;'>Tablelands with moderate relief</span><br /></li><li><span style='font-family:inherit;'>Tablelands with considerable relief</span><br /></li><li><span style='font-family:inherit;'>Tablelands with high relief </span><br /></li><li><span style='font-family:inherit;'>Tablelands with very high relief </span><br /></li><li><span style='font-family:inherit;'>Low mountains</span><br /></li><li><span style='font-family:inherit;'>High mountains</span><br /></li></ul></div></div><div style='font-size:16px; font-family:inherit;'>To produce these classes, Esri staff first projected the 250-meter resolution GMTED elevation data to the World Equidistant Cylindrical coordinate system. Each cell in this dataset was assigned three characteristics:  slope based on 3-km neighborhood, relief based on 6 km neighborhood, and profile based on 6-km neighborhood. The last step was to overlay the combination of these three characteristics with areas that are exclusively plains. <br /></div><div style='font-size:16px; font-family:inherit;'><br /></div><div style='font-size:16px; font-family:inherit;'><b>Slope </b>is the percentage of the 3-km neighborhood occupied by gentle slope. Hammond specified 8% as the threshold for gentle slope. Slope is used to define how flat or steep the terrain is. Slope was classified into one of four classes: <br /></div><div style='font-size:16px; font-family:inherit;'><br /></div><div style='font-size:16px; font-family:inherit;'><table border='1' cellpadding='0' cellspacing='0' style='margin-bottom:1.5rem; width:1004px; border-collapse:collapse; border-spacing:0px; border:none; font-size:0.875rem;'><tbody><tr style='border-bottom:1px solid rgb(204, 204, 204);'><td style='border:1pt solid windowtext; padding:0in 5.4pt; width:125.75pt;' valign='top' width='210'><p style='margin-top:0px; margin-bottom:0.0001pt;'><span style='font-family:inherit; color:rgb(77, 77, 77);'><font size='2' style='font-family:inherit;'>Percent of neighborhood over 8% of slope</font></span></p></td><td style='border-left:none; border-right:1pt solid windowtext; padding:0in 5.4pt; width:0.75in; border-top:1pt solid windowtext; border-bottom:1pt solid windowtext; border-image:initial;' valign='top' width='90'><p style='margin-top:0px; margin-bottom:0.0001pt;'><span style='font-family:inherit; color:rgb(77, 77, 77);'><font size='2' style='font-family:inherit;'>Slope Classes</font></span></p></td></tr><tr style='border-bottom:1px solid rgb(204, 204, 204);'><td style='border-left:1pt solid windowtext; border-right:1pt solid windowtext; padding:0in 5.4pt; width:125.75pt; border-bottom:1pt solid windowtext; border-image:initial; border-top:none;' valign='top' width='210'><p style='margin-top:0px; margin-bottom:0.0001pt;'><span style='font-family:inherit; color:rgb(77, 77, 77);'><font size='2' style='font-family:inherit;'>0 - 20%</font></span></p></td><td style='border-left:none; border-right:1pt solid windowtext; padding:0in 5.4pt; width:0.75in; border-top:none; border-bottom:1pt solid windowtext;' valign='top' width='90'><p style='margin-top:0px; margin-bottom:0.0001pt; text-align:center;'><span style='font-family:inherit; color:rgb(77, 77, 77);'><font size='2' style='font-family:inherit;'>400</font></span></p></td></tr><tr style='border-bottom:1px solid rgb(204, 204, 204);'><td style='border-left:1pt solid windowtext; border-right:1pt solid windowtext; padding:0in 5.4pt; width:125.75pt; border-bottom:1pt solid windowtext; border-image:initial; border-top:none;' valign='top' width='210'><p style='margin-top:0px; margin-bottom:0.0001pt;'><span style='font-family:inherit; color:rgb(77, 77, 77);'><font size='2' style='font-family:inherit;'>21% -50%</font></span></p></td><td style='border-left:none; border-right:1pt solid windowtext; padding:0in 5.4pt; width:0.75in; border-top:none; border-bottom:1pt solid windowtext;' valign='top' width='90'><p style='margin-top:0px; margin-bottom:0.0001pt; text-align:center;'><span style='font-family:inherit; color:rgb(77, 77, 77);'><font size='2' style='font-family:inherit;'>300</font></span></p></td></tr><tr style='border-bottom:1px solid rgb(204, 204, 204);'><td style='border-left:1pt solid windowtext; border-right:1pt solid windowtext; padding:0in 5.4pt; width:125.75pt; border-bottom:1pt solid windowtext; border-image:initial; border-top:none;' valign='top' width='210'><p style='margin-top:0px; margin-bottom:0.0001pt;'><span style='font-family:inherit; color:rgb(77, 77, 77);'><font size='2' style='font-family:inherit;'>51% - 80%</font></span></p></td><td style='border-left:none; border-right:1pt solid windowtext; padding:0in 5.4pt; width:0.75in; border-top:none; border-bottom:1pt solid windowtext;' valign='top' width='90'><p style='margin-top:0px; margin-bottom:0.0001pt; text-align:center;'><span style='font-family:inherit; color:rgb(77, 77, 77);'><font size='2' style='font-family:inherit;'>200</font></span></p></td></tr><tr style='border-bottom:none;'><td style='border-left:1pt solid windowtext; border-right:1pt solid windowtext; padding:0in 5.4pt; width:125.75pt; border-bottom:1pt solid windowtext; border-image:initial; border-top:none;' valign='top' width='210'><p style='margin-top:0px; margin-bottom:0.0001pt;'><span style='font-family:inherit; color:rgb(77, 77, 77);'><font size='2' style='font-family:inherit;'>&gt;81% </font></span></p></td><td style='border-left:none; border-right:1pt solid windowtext; padding:0in 5.4pt; width:0.75in; border-top:none; border-bottom:1pt solid windowtext;' valign='top' width='90'><p style='margin-top:0px; margin-bottom:0.0001pt; text-align:center;'><span style='font-family:inherit; color:rgb(77, 77, 77);'><font size='2' style='font-family:inherit;'>100</font><font style='font-family:inherit; font-size:10.5pt;'></font></span></p></td></tr></tbody></table><br /></div><div style='font-size:16px; font-family:inherit;'><b>Local Relief</b> is the difference between the maximum and minimum elevation within in the 6-km neighborhood. Local relief is used to define terrain how rugged or the complexity of the terrain's texture. Relief was assigned one of six classes:</div><div style='font-size:16px; font-family:inherit;'><br /></div><div style='font-size:16px; font-family:inherit;'><table border='1' cellpadding='0' cellspacing='0' style='margin-bottom:1.5rem; width:1004px; border-collapse:collapse; border-spacing:0px; border:none; font-size:0.875rem;'><tbody><tr style='border-bottom:1px solid rgb(204, 204, 204); height:17.1pt;'><td style='border:1pt solid windowtext; padding:0in 5.4pt; width:149.95pt; height:17.1pt;' valign='top' width='250'><p style='margin-top:0px; margin-bottom:0.0001pt; text-align:justify;'><span style='font-family:inherit; color:rgb(77, 77, 77);'><font size='2' style='font-family:inherit;'>Change in elevation</font></span></p></td><td style='border-left:none; border-right:1pt solid windowtext; padding:0in 5.4pt; width:93.95pt; border-top:1pt solid windowtext; border-bottom:1pt solid windowtext; border-image:initial; height:17.1pt;' valign='top' width='157'><p style='margin-top:0px; margin-bottom:0.0001pt;'><span style='font-family:inherit; color:rgb(77, 77, 77);'><font size='2' style='font-family:inherit;'>Relief Class ID</font></span></p></td></tr><tr style='border-bottom:1px solid rgb(204, 204, 204); height:13.45pt;'><td style='border-left:1pt solid windowtext; border-right:1pt solid windowtext; padding:0in 5.4pt; width:149.95pt; border-bottom:1pt solid windowtext; border-image:initial; border-top:none; height:13.45pt;' valign='top' width='250'><p style='margin-top:0px; margin-bottom:0.0001pt; text-align:justify;'><span style='font-family:inherit; color:rgb(77, 77, 77);'><font size='2' style='font-family:inherit;'>0 – 30 meters</font></span></p></td><td style='border-left:none; border-right:1pt solid windowtext; padding:0in 5.4pt; width:93.95pt; border-top:none; border-bottom:1pt solid windowtext; height:13.45pt;' valign='top' width='157'><p style='margin-top:0px; margin-bottom:0.0001pt; text-align:center;'><span style='font-family:inherit; color:rgb(77, 77, 77);'><font size='2' style='font-family:inherit;'>10</font></span></p></td></tr><tr style='border-bottom:1px solid rgb(204, 204, 204); height:17.1pt;'><td style='border-left:1pt solid windowtext; border-right:1pt solid windowtext; padding:0in 5.4pt; width:149.95pt; border-bottom:1pt solid windowtext; border-image:initial; border-top:none; height:17.1pt;' valign='top' width='250'><p style='margin-top:0px; margin-bottom:0.0001pt; text-align:justify;'><span style='font-family:inherit; color:rgb(77, 77, 77);'><font size='2' style='font-family:inherit;'>31 meter – 90 meters</font></span></p></td><td style='border-left:none; border-right:1pt solid windowtext; padding:0in 5.4pt; width:93.95pt; border-top:none; border-bottom:1pt solid windowtext; height:17.1pt;' valign='top' width='157'><p style='margin-top:0px; margin-bottom:0.0001pt; text-align:center;'><span style='font-family:inherit; color:rgb(77, 77, 77);'><font size='2' style='font-family:inherit;'>20</font></span></p></td></tr><tr style='border-bottom:1px solid rgb(204, 204, 204); height:17.1pt;'><td style='border-left:1pt solid windowtext; border-right:1pt solid windowtext; padding:0in 5.4pt; width:149.95pt; border-bottom:1pt solid windowtext; border-image:initial; border-top:none; height:17.1pt;' valign='top' width='250'><p style='margin-top:0px; margin-bottom:0.0001pt; text-align:justify;'><span style='font-family:inherit; color:rgb(77, 77, 77);'><font size='2' style='font-family:inherit;'>91 meter – 150 meters</font></span></p></td><td style='border-left:none; border-right:1pt solid windowtext; padding:0in 5.4pt; width:93.95pt; border-top:none; border-bottom:1pt solid windowtext; height:17.1pt;' valign='top' width='157'><p style='margin-top:0px; margin-bottom:0.0001pt; text-align:center;'><span style='font-family:inherit; color:rgb(77, 77, 77);'><font size='2' style='font-family:inherit;'>30</font></span></p></td></tr><tr style='border-bottom:1px solid rgb(204, 204, 204); height:17.1pt;'><td style='border-left:1pt solid windowtext; border-right:1pt solid windowtext; padding:0in 5.4pt; width:149.95pt; border-bottom:1pt solid windowtext; border-image:initial; border-top:none; height:17.1pt;' valign='top' width='250'><p style='margin-top:0px; margin-bottom:0.0001pt; text-align:justify;'><span style='font-family:inherit; color:rgb(77, 77, 77);'><font size='2' style='font-family:inherit;'>151 meter – 300 meters</font></span></p></td><td style='border-left:none; border-right:1pt solid windowtext; padding:0in 5.4pt; width:93.95pt; border-top:none; border-bottom:1pt solid windowtext; height:17.1pt;' valign='top' width='157'><p style='margin-top:0px; margin-bottom:0.0001pt; text-align:center;'><span style='font-family:inherit; color:rgb(77, 77, 77);'><font size='2' style='font-family:inherit;'>40</font></span></p></td></tr><tr style='border-bottom:1px solid rgb(204, 204, 204); height:17.1pt;'><td style='border-left:1pt solid windowtext; border-right:1pt solid windowtext; padding:0in 5.4pt; width:149.95pt; border-bottom:1pt solid windowtext; border-image:initial; border-top:none; height:17.1pt;' valign='top' width='250'><p style='margin-top:0px; margin-bottom:0.0001pt; text-align:justify;'><span style='font-family:inherit; color:rgb(77, 77, 77);'><font size='2' style='font-family:inherit;'>301 meter – 900 meters</font></span></p></td><td style='border-left:none; border-right:1pt solid windowtext; padding:0in 5.4pt; width:93.95pt; border-top:none; border-bottom:1pt solid windowtext; height:17.1pt;' valign='top' width='157'><p style='margin-top:0px; margin-bottom:0.0001pt; text-align:center;'><span style='font-family:inherit; color:rgb(77, 77, 77);'><font size='2' style='font-family:inherit;'>50</font></span></p></td></tr><tr style='border-bottom:none; height:17.1pt;'><td style='border-left:1pt solid windowtext; border-right:1pt solid windowtext; padding:0in 5.4pt; width:149.95pt; border-bottom:1pt solid windowtext; border-image:initial; border-top:none; height:17.1pt;' valign='top' width='250'><p style='margin-top:0px; margin-bottom:0.0001pt; text-align:justify;'><span style='font-family:inherit; color:rgb(77, 77, 77);'><font size='2' style='font-family:inherit;'>&gt;900 meters</font></span></p></td><td style='border-left:none; border-right:1pt solid windowtext; padding:0in 5.4pt; width:93.95pt; border-top:none; border-bottom:1pt solid windowtext; height:17.1pt;' valign='top' width='157'><p style='margin-top:0px; margin-bottom:0.0001pt; text-align:center;'><span style='font-family:inherit; color:rgb(77, 77, 77);'><font size='2' style='font-family:inherit;'>60</font></span></p></td></tr></tbody></table></div><div style='font-size:16px; font-family:inherit;'><br /></div><div style='font-size:16px; font-family:inherit;'>The combination of slope and relief begin to define terrain as mountains, hills and plains. However, the difference between mountains or hills and tablelands cannot be distinguished using only these parameters. <br /></div><div style='font-size:16px; font-family:inherit;'><br /></div><div style='font-size:16px; font-family:inherit;'><b>Profile</b> is used to determine tableland areas. Profile identifies neighborhoods with upland and lowland areas, and calculates the percent area of gently sloping terrain within those upland and lowland areas. A 6-km circular neighborhood was used to calculate the profile parameter. Upland/lowland is determined by the difference between average local relief and elevation. In the 6-km neighborhood window, if the difference between maximum elevation and cell’s elevation is smaller than half of the local relief it’s an upland. If the difference between maximum elevation and cell’s elevation is larger than half of the local relief it’s a lowland.  Profile was assigned one of five classes:<br /></div><div style='font-size:16px; font-family:inherit;'><br /></div><div style='font-size:16px; font-family:inherit;'><table border='1' cellpadding='0' cellspacing='0' style='margin-bottom:1.5rem; width:1004px; border-collapse:collapse; border-spacing:0px; border:none; font-size:0.875rem;'><tbody><tr style='border-bottom:1px solid rgb(204, 204, 204);'><td style='border:1pt solid windowtext; padding:0in 5.4pt; width:233.75pt;' valign='top' width='390'><p style='margin-top:0px; margin-bottom:0.0001pt; text-align:center;'><span style='font-family:inherit; color:rgb(77, 77, 77);'><font size='2' style='font-family:inherit;'>Percent of neighborhood over 8% slope in upland or lowland areas</font></span></p></td><td style='border-left:none; border-right:1pt solid windowtext; padding:0in 5.4pt; width:77.65pt; border-top:1pt solid windowtext; border-bottom:1pt solid windowtext; border-image:initial;' valign='top' width='129'><p style='margin-top:0px; margin-bottom:0.0001pt;'><span style='font-family:inherit; color:rgb(77, 77, 77);'><font size='2' style='font-family:inherit;'>Profile Class</font></span></p></td></tr><tr style='border-bottom:1px solid rgb(204, 204, 204);'><td style='border-left:1pt solid windowtext; border-right:1pt solid windowtext; padding:0in 5.4pt; width:233.75pt; border-bottom:1pt solid windowtext; border-image:initial; border-top:none;' valign='top' width='390'><p style='margin-top:0px; margin-bottom:0.0001pt;'><span style='font-family:inherit; color:rgb(77, 77, 77);'><font size='2' style='font-family:inherit;'>Less than 50% gentle slope is in upland or lowland</font></span></p></td><td style='border-left:none; border-right:1pt solid windowtext; padding:0in 5.4pt; width:77.65pt; border-top:none; border-bottom:1pt solid windowtext;' valign='top' width='129'><p style='margin-top:0px; margin-bottom:0.0001pt; text-align:center;'><span style='font-family:inherit; color:rgb(77, 77, 77);'><font size='2' style='font-family:inherit;'>0</font></span></p></td></tr><tr style='border-bottom:1px solid rgb(204, 204, 204);'><td style='border-left:1pt solid windowtext; border-right:1pt solid windowtext; padding:0in 5.4pt; width:233.75pt; border-bottom:1pt solid windowtext; border-image:initial; border-top:none;' valign='top' width='390'><p style='margin-top:0px; margin-bottom:0.0001pt;'><span style='font-family:inherit; color:rgb(77, 77, 77);'><font size='2' style='font-family:inherit;'>More than 75% of gentle slope is in lowland</font></span></p></td><td style='border-left:none; border-right:1pt solid windowtext; padding:0in 5.4pt; width:77.65pt; border-top:none; border-bottom:1pt solid windowtext;' valign='top' width='129'><p style='margin-top:0px; margin-bottom:0.0001pt; text-align:center;'><span style='font-family:inherit; color:rgb(77, 77, 77);'><font size='2' style='font-family:inherit;'>1</font></span></p></td></tr><tr style='border-bottom:1px solid rgb(204, 204, 204);'><td style='border-left:1pt solid windowtext; border-right:1pt solid windowtext; padding:0in 5.4pt; width:233.75pt; border-bottom:1pt solid windowtext; border-image:initial; border-top:none;' valign='top' width='390'><p style='margin-top:0px; margin-bottom:0.0001pt;'><span style='font-family:inherit; color:rgb(77, 77, 77);'><font size='2' style='font-family:inherit;'>50%-75% of gentle slope is in lowland</font></span></p></td><td style='border-left:none; border-right:1pt solid windowtext; padding:0in 5.4pt; width:77.65pt; border-top:none; border-bottom:1pt solid windowtext;' valign='top' width='129'><p style='margin-top:0px; margin-bottom:0.0001pt; text-align:center;'><span style='font-family:inherit; color:rgb(77, 77, 77);'><font size='2' style='font-family:inherit;'>2</font></span></p></td></tr><tr style='border-bottom:1px solid rgb(204, 204, 204);'><td style='border-left:1pt solid windowtext; border-right:1pt solid windowtext; padding:0in 5.4pt; width:233.75pt; border-bottom:1pt solid windowtext; border-image:initial; border-top:none;' valign='top' width='390'><p style='margin-top:0px; margin-bottom:0.0001pt;'><span style='font-family:inherit; color:rgb(77, 77, 77);'><font size='2' style='font-family:inherit;'>50-75% of gentle slope is in upland</font></span></p></td><td style='border-left:none; border-right:1pt solid windowtext; padding:0in 5.4pt; width:77.65pt; border-top:none; border-bottom:1pt solid windowtext;' valign='top' width='129'><p style='margin-top:0px; margin-bottom:0.0001pt; text-align:center;'><span style='font-family:inherit; color:rgb(77, 77, 77);'><font size='2' style='font-family:inherit;'>3</font></span></p></td></tr><tr style='border-bottom:none;'><td style='border-left:1pt solid windowtext; border-right:1pt solid windowtext; padding:0in 5.4pt; width:233.75pt; border-bottom:1pt solid windowtext; border-image:initial; border-top:none;' valign='top' width='390'><p style='margin-top:0px; margin-bottom:0.0001pt;'><span style='font-family:inherit; color:rgb(77, 77, 77);'><font size='2' style='font-family:inherit;'>More than 75% of gentle slope is in upland</font></span></p></td><td style='border-left:none; border-right:1pt solid windowtext; padding:0in 5.4pt; width:77.65pt; border-top:none; border-bottom:1pt solid windowtext;' valign='top' width='129'><p style='margin-top:0px; margin-bottom:0.0001pt; text-align:center;'><span style='font-family:inherit; color:rgb(77, 77, 77);'><font size='2' style='font-family:inherit;'>4</font><span style='font-family:inherit;'></span></span></p></td></tr></tbody></table></div><div style='font-size:16px; font-family:inherit;'><br /></div><div style='font-size:16px; font-family:inherit;'><span style='font-family:inherit;'>Early reviewers of the resulting classes noted one confusing outcome</span><span style='font-family:inherit;'>, which was that </span><span style='font-family:inherit;'>areas were classified as &quot;plains with low mountains&quot;, or &quot;plains with hills&quot; were often mostly plains, and the hills or mountains were part of an adjacent set of exclusively identified hills or mountains. To address this areas that are exclusively plains were produced, and used to override these confusing areas. The hills and mountains within those areas were converted to their respective landform class.</span><br /></div><div style='font-size:16px; font-family:inherit;'><span style='font-family:inherit;'><br /></span></div><div style='font-size:16px; font-family:inherit;'>The combination of slope, relief and profile merged with the areas of plains, can be better understood using the following diagram, which uses the colors in this layer to show which classes are present and what parameter values produced them:<br /></div><div style='font-size:16px; font-family:inherit;'><br /></div><div style='font-size:16px; font-family:inherit;'><img alt='Hammond Classification by parameter' src='https://downloads2.esri.com/esri_content_doc/landscape/hammondclasses.gif' style='max-width:100%; height:auto;' /><br /></div><div style='font-size:16px; font-family:inherit;'><br /></div><div style='font-size:16px; font-family:inherit; text-align:center;'><b><br /></b></div><div style='font-size:16px; font-family:inherit; text-align:center;'><font size='4' style='font-family:inherit;'><b>What can you do with this layer?</b></font></div><div style='font-size:16px; font-family:inherit;'><br /></div><div style='font-size:16px; font-family:inherit;'><div style='font-family:inherit; margin:0px; padding:0px;'>This layer is suitable for both visualization and analysis. It can be used in ArcGIS Online in web maps and applications and can be used in ArcGIS Desktop. </div><div style='font-family:inherit; margin:0px; padding:0px;'><div style='font-family:inherit; margin:0px; padding:0px;'><div style='font-family:inherit; margin:0px; padding:0px;'><div style='font-family:inherit;'><br /></div><div style='font-family:inherit;'><div style='font-family:inherit; margin:0px; padding:0px;'>This layer is part of a larger collection of <a href='https://www.arcgis.com/home/group.html?owner=esri&amp;title=Landscape%20Layers&amp;start=131&amp;q=' style='color:rgb(0, 97, 155); text-decoration-line:none; font-family:inherit;' target='_blank' rel='nofollow ugc noopener noreferrer'>landscape layers</a> that you can use to perform a wide variety of mapping and analysis tasks.</div><div style='font-family:inherit; margin:0px; padding:0px;'><br /></div><div style='font-family:inherit; margin:0px; padding:0px;'>The <a href='https://doc.arcgis.com/en/living-atlas/#s=0&amp;n=0&amp;d=1&amp;col=&amp;fs=0&amp;fn=30&amp;npp=120&amp;subCat=0' style='color:rgb(0, 97, 155); text-decoration-line:none; font-family:inherit;' target='_blank' rel='nofollow ugc noopener noreferrer'>Living Atlas of the World</a> provides an easy way to explore the landscape layers and many other beautiful and authoritative maps on hundreds of topics.</div><div style='font-family:inherit; margin:0px; padding:0px;'><br /></div><div style='font-family:inherit; margin:0px; padding:0px;'><div style='font-family:inherit; margin:0px; padding:0px;'><a href='https://geonet.esri.com/' style='color:rgb(0, 97, 155); text-decoration-line:none; font-family:inherit;' target='_blank' rel='nofollow ugc noopener noreferrer'>Geonet</a> is a good resource for learning more about landscape layers and the Living Atlas of the World. To get started see the <a href='https://geonet.esri.com/groups/livingatlas?sr=search&amp;searchId=ec0b33d6-14bb-4319-8ad5-38961b68610e&amp;searchIndex=0' style='color:rgb(0, 97, 155); text-decoration-line:none; font-family:inherit;' target='_blank' rel='nofollow ugc noopener noreferrer'>Living Atlas Discussion Group</a>.</div><div style='font-family:inherit; margin:0px; padding:0px;'><br /></div><div style='font-family:inherit; margin:0px; padding:0px;'>The <a href='https://goto.arcgisonline.com/arcgis/Ecological_Land_Units/RolloutBlog' style='color:rgb(0, 97, 155); text-decoration-line:none; font-family:inherit;' target='_blank' rel='nofollow ugc noopener noreferrer'>Esri Insider Blog</a> provides an introduction to the Ecophysiographic Mapping project.</div></div></div></div></div></div></div></div></div></div>",
			"keyword": [
				"esri_landscape",
				"landscape7",
				"ecophysiography",
				"landscape",
				"elevation"
			],
			"issued": "2023-09-20T17:58:13.000Z",
			"modified": "2023-09-26T17:13:44.000Z",
			"publisher": {
				"name": "Pacific GeoPortal - Core Organization"
			},
			"contactPoint": {
				"@type": "vcard:Contact",
				"fn": "dkaragulle_pacificcore",
				"hasEmail": "mailto:pacific_geoportal@esri.com"
			},
			"accessLevel": "public",
			"spatial": "140.2185,-17.6231,163.3777,2.0211",
			"license": "<img src='https://downloads.esri.com/blogs/arcgisonline/esrilogo_new.png' style='max-width:100%; height:auto; font-family:&quot;Avenir Next W01&quot;, &quot;Avenir Next W00&quot;, &quot;Avenir Next&quot;, Avenir, &quot;Helvetica Neue&quot;, sans-serif; font-size:16px;' /><span style='font-family:&quot;Avenir Next W01&quot;, &quot;Avenir Next W00&quot;, &quot;Avenir Next&quot;, Avenir, &quot;Helvetica Neue&quot;, sans-serif; font-size:16px;'>This work is licensed under the Esri Master License Agreement.</span><br /><div style='font-family:&quot;Avenir Next W01&quot;, &quot;Avenir Next W00&quot;, &quot;Avenir Next&quot;, Avenir, &quot;Helvetica Neue&quot;, sans-serif; font-size:16px;'><a href='https://goto.arcgis.com/termsofuse/viewsummary' style='color:rgb(0, 97, 155); text-decoration-line:none;' target='_blank' rel='nofollow ugc noopener noreferrer'><b>View Summary</b></a> | <a href='https://goto.arcgis.com/termsofuse/viewtermsofuse' style='color:rgb(0, 97, 155); text-decoration-line:none;' target='_blank' rel='nofollow ugc noopener noreferrer'><b>View Terms of Use</b></a></div><div style='font-family:&quot;Avenir Next W01&quot;, &quot;Avenir Next W00&quot;, &quot;Avenir Next&quot;, Avenir, &quot;Helvetica Neue&quot;, sans-serif; font-size:16px;'><br /></div><div style='font-family:&quot;Avenir Next W01&quot;, &quot;Avenir Next W00&quot;, &quot;Avenir Next&quot;, Avenir, &quot;Helvetica Neue&quot;, sans-serif; font-size:16px;'><font color='#b22222'>Important Note:</font> This item requires an ArcGIS Online organizational subscription or an ArcGIS Developer account and does not consume credits. To access this item, you'll need to do one of the following:</div><div style='font-family:&quot;Avenir Next W01&quot;, &quot;Avenir Next W00&quot;, &quot;Avenir Next&quot;, Avenir, &quot;Helvetica Neue&quot;, sans-serif; font-size:16px;'><ul><li>Sign in with an account that is a member of an organizational subscription</li><li>Sign in with a developer account</li><li><a href='https://goto.arcgis.com/termsofuse/registeranapplication' style='color:rgb(0, 97, 155); text-decoration-line:none;' target='_blank' rel='nofollow ugc noopener noreferrer'>Register an application</a> and use your application's credentials.</li></ul>If you don't have an account, you can sign up for a <a href='https://goto.arcgis.com/features/trial' style='color:rgb(0, 97, 155); text-decoration-line:none;' target='_blank' rel='nofollow ugc noopener noreferrer'>free trial of ArcGIS</a> or a <a href='https://goto.arcgis.com/developers/signup' style='color:rgb(0, 97, 155); text-decoration-line:none;' target='_blank' rel='nofollow ugc noopener noreferrer'>free ArcGIS Developer account</a>.</div>",
			"distribution": [
				{
					"@type": "dcat:Distribution",
					"title": "ArcGIS Hub Dataset",
					"format": "Web Page",
					"mediaType": "text/html",
					"accessURL": "https://www.pacificgeoportal.com/maps/pacificcore::pacific-region-landform-classes"
				}
			],
			"theme": [
				"geospatial"
			]
		},
		{
			"@type": "dcat:Dataset",
			"identifier": "https://www.arcgis.com/home/item.html?id=4a96c985a6704943b7cbb07457cff30e",
			"landingPage": "https://www.pacificgeoportal.com/maps/pacificcore::pacific-region-biomass",
			"title": "Pacific Region Biomass",
			"description": "<div style='font-family:&quot;Avenir Next W01&quot;, &quot;Avenir Next W00&quot;, &quot;Avenir Next&quot;, Avenir, &quot;Helvetica Neue&quot;, sans-serif; font-size:16px;'>This layer is a subset of <a href='https://maps.arcgis.com/home/item.html?id=265ffc95d7f74280b6952752244b8f81' target='_blank' rel='nofollow ugc noopener noreferrer'>World Biamoss</a> Layer. Plants play a central role in the <a href='https://en.wikipedia.org/wiki/Carbon_cycle' style='color:rgb(0, 97, 155); text-decoration-line:none; font-family:inherit;' target='_blank' rel='nofollow ugc noopener noreferrer'>carbon cycle</a> by absorbing carbon dioxide from the atmosphere and incorporating it in the structure of the plant. Globally living plants contain 500 billion metric tons of carbon, more than 60 times the amount of carbon released to the atmosphere by humans each year. Understanding the distribution of the carbon stored in living plants, known as <a href='https://en.wikipedia.org/wiki/Biomass_(ecology)' style='color:rgb(0, 97, 155); text-decoration-line:none; font-family:inherit;' target='_blank' rel='nofollow ugc noopener noreferrer'>biomass</a>, is key to estimating the effects of land use change on the climate.<br /></div><div style='font-family:&quot;Avenir Next W01&quot;, &quot;Avenir Next W00&quot;, &quot;Avenir Next&quot;, Avenir, &quot;Helvetica Neue&quot;, sans-serif; font-size:16px;'><br /></div><div style='font-family:&quot;Avenir Next W01&quot;, &quot;Avenir Next W00&quot;, &quot;Avenir Next&quot;, Avenir, &quot;Helvetica Neue&quot;, sans-serif; font-size:16px;'><font size='4' style='font-family:inherit;'>Dataset Summary</font></div><div style='font-family:&quot;Avenir Next W01&quot;, &quot;Avenir Next W00&quot;, &quot;Avenir Next&quot;, Avenir, &quot;Helvetica Neue&quot;, sans-serif; font-size:16px;'><br /></div><div style='font-family:&quot;Avenir Next W01&quot;, &quot;Avenir Next W00&quot;, &quot;Avenir Next&quot;, Avenir, &quot;Helvetica Neue&quot;, sans-serif; font-size:16px;'>This layer provides access to a 1-km cell-sized raster with data on the density of carbon stored in living plants in metric tons per hectare for the year 2000. It was published by the Oak Ridge National Laboratory Carbon Dioxide Information Analysis Center in 2008.</div><div style='font-family:&quot;Avenir Next W01&quot;, &quot;Avenir Next W00&quot;, &quot;Avenir Next&quot;, Avenir, &quot;Helvetica Neue&quot;, sans-serif; font-size:16px;'><br /></div><div style='font-family:&quot;Avenir Next W01&quot;, &quot;Avenir Next W00&quot;, &quot;Avenir Next&quot;, Avenir, &quot;Helvetica Neue&quot;, sans-serif; font-size:16px;'>The authors of these data request that they be cited as:</div><div style='font-family:&quot;Avenir Next W01&quot;, &quot;Avenir Next W00&quot;, &quot;Avenir Next&quot;, Avenir, &quot;Helvetica Neue&quot;, sans-serif; font-size:16px;'>Ruesch, Aaron, and Holly K. Gibbs. 2008. New IPCC Tier-1 Global Biomass Carbon Map For the Year 2000. Available online from the Carbon Dioxide Information Analysis Center, Oak Ridge National Laboratory, Oak Ridge, Tennessee.</div><div style='font-family:&quot;Avenir Next W01&quot;, &quot;Avenir Next W00&quot;, &quot;Avenir Next&quot;, Avenir, &quot;Helvetica Neue&quot;, sans-serif; font-size:16px;'><p style='margin-top:0px; margin-bottom:1.5rem;'><font size='4' style='font-family:inherit;'>What can you do with this layer?</font></p><p style='margin-top:0px; margin-bottom:1.5rem;'><span style='font-family:inherit;'>This layer is suitable for both visualization and analysis. It can be used in ArcGIS Online in web maps and applications and can be used in ArcGIS Desktop.</span></p><div style='font-family:inherit; margin:0px; padding:0px;'>This layer has <a href='https://resources.arcgis.com/en/help/main/10.2/index.html#//00sp00000007000000' style='color:rgb(0, 97, 155); text-decoration-line:none; font-family:inherit;' target='_blank' rel='nofollow ugc noopener noreferrer'>query</a>, <a href='https://resources.arcgis.com/en/help/main/10.2/index.html#//00s500000010000000' style='color:rgb(0, 97, 155); text-decoration-line:none; font-family:inherit;' target='_blank' rel='nofollow ugc noopener noreferrer'>identify</a>, and <a href='https://resources.arcgis.com/en/help/main/10.2/index.html#/Downloading_data_from_an_image_service/00sp00000016000000/' style='color:rgb(0, 97, 155); text-decoration-line:none; font-family:inherit;' target='_blank' rel='nofollow ugc noopener noreferrer'>export</a> image services available. This layer is restricted to a maximum area of 16,000 x 16,000 pixels - an area 4,000 kilometers on a side or an area approximately the size of Europe. </div><div style='font-family:inherit; margin:0px; padding:0px;'><div style='font-family:inherit; margin:0px; padding:0px;'><br /></div><div style='font-family:inherit; margin:0px; padding:0px;'>The <a href='https://goto.arcgisonline.com/arcgis/Ecological_Land_Units/RolloutBlog' style='color:rgb(0, 97, 155); text-decoration-line:none; font-family:inherit;' target='_blank' rel='nofollow ugc noopener noreferrer'>Esri Insider Blog</a> provides an introduction to the Ecophysiographic Mapping project.</div></div></div>",
			"keyword": [
				"landscape6",
				"landscape",
				"esri_landscape",
				"landcover",
				"ecology"
			],
			"issued": "2023-09-20T18:37:46.000Z",
			"modified": "2023-09-26T17:00:02.000Z",
			"publisher": {
				"name": "Pacific GeoPortal - Core Organization"
			},
			"contactPoint": {
				"@type": "vcard:Contact",
				"fn": "dkaragulle_pacificcore",
				"hasEmail": "mailto:pacific_geoportal@esri.com"
			},
			"accessLevel": "public",
			"spatial": "133.8574,-31.7678,180.0000,6.3126",
			"license": "<img src='https://downloads.esri.com/blogs/arcgisonline/esrilogo_new.png' style='max-width:100%; height:auto; font-family:&quot;Avenir Next W01&quot;, &quot;Avenir Next W00&quot;, &quot;Avenir Next&quot;, Avenir, &quot;Helvetica Neue&quot;, sans-serif; font-size:16px;' /><span style='font-family:&quot;Avenir Next W01&quot;, &quot;Avenir Next W00&quot;, &quot;Avenir Next&quot;, Avenir, &quot;Helvetica Neue&quot;, sans-serif; font-size:16px;'>This work is licensed under the Esri Master License Agreement.</span><br /><div style='font-family:&quot;Avenir Next W01&quot;, &quot;Avenir Next W00&quot;, &quot;Avenir Next&quot;, Avenir, &quot;Helvetica Neue&quot;, sans-serif; font-size:16px;'><a href='https://goto.arcgis.com/termsofuse/viewsummary' style='color:rgb(0, 97, 155); text-decoration-line:none;' target='_blank' rel='nofollow ugc noopener noreferrer'><b>View Summary</b></a> | <a href='https://goto.arcgis.com/termsofuse/viewtermsofuse' style='color:rgb(0, 97, 155); text-decoration-line:none;' target='_blank' rel='nofollow ugc noopener noreferrer'><b>View Terms of Use</b></a></div><div style='font-family:&quot;Avenir Next W01&quot;, &quot;Avenir Next W00&quot;, &quot;Avenir Next&quot;, Avenir, &quot;Helvetica Neue&quot;, sans-serif; font-size:16px;'><br /></div><div style='font-family:&quot;Avenir Next W01&quot;, &quot;Avenir Next W00&quot;, &quot;Avenir Next&quot;, Avenir, &quot;Helvetica Neue&quot;, sans-serif; font-size:16px;'><font color='#b22222'>Important Note:</font> This item requires an ArcGIS Online organizational subscription or an ArcGIS Developer account and does not consume credits. To access this item, you'll need to do one of the following:</div><div style='font-family:&quot;Avenir Next W01&quot;, &quot;Avenir Next W00&quot;, &quot;Avenir Next&quot;, Avenir, &quot;Helvetica Neue&quot;, sans-serif; font-size:16px;'><ul><li>Sign in with an account that is a member of an organizational subscription</li><li>Sign in with a developer account</li><li><a href='https://goto.arcgis.com/termsofuse/registeranapplication' style='color:rgb(0, 97, 155); text-decoration-line:none;' target='_blank' rel='nofollow ugc noopener noreferrer'>Register an application</a> and use your application's credentials.</li></ul>If you don't have an account, you can sign up for a <a href='https://goto.arcgis.com/features/trial' style='color:rgb(0, 97, 155); text-decoration-line:none;' target='_blank' rel='nofollow ugc noopener noreferrer'>free trial of ArcGIS</a> or a <a href='https://goto.arcgis.com/developers/signup' style='color:rgb(0, 97, 155); text-decoration-line:none;' target='_blank' rel='nofollow ugc noopener noreferrer'>free ArcGIS Developer account</a>.</div>",
			"distribution": [
				{
					"@type": "dcat:Distribution",
					"title": "ArcGIS Hub Dataset",
					"format": "Web Page",
					"mediaType": "text/html",
					"accessURL": "https://www.pacificgeoportal.com/maps/pacificcore::pacific-region-biomass"
				}
			],
			"theme": [
				"geospatial"
			]
		},
		{
			"@type": "dcat:Dataset",
			"identifier": "https://www.arcgis.com/home/item.html?id=2f1f04bc55d44c219d6fb42e49b5e001",
			"landingPage": "https://www.pacificgeoportal.com/maps/pacificcore::pacific-region-populated-footprint-in-2020",
			"title": "Pacific Region Populated Footprint in 2020",
			"description": "<div style='font-family:&quot;Avenir Next W01&quot;, &quot;Avenir Next W00&quot;, &quot;Avenir Next&quot;, Avenir, &quot;Helvetica Neue&quot;, sans-serif; font-size:16px;'>This layer is a subset of <a href='https://www.arcgis.com/home/item.html?id=564afc8398874a659e6bd964ce783f1d' target='_blank' rel='nofollow ugc noopener noreferrer'>Populated Footprint in 2020 Global Coverage</a> for the Pacific Region. </div><div style='font-family:&quot;Avenir Next W01&quot;, &quot;Avenir Next W00&quot;, &quot;Avenir Next&quot;, Avenir, &quot;Helvetica Neue&quot;, sans-serif; font-size:16px;'><br /></div><div style='font-family:&quot;Avenir Next W01&quot;, &quot;Avenir Next W00&quot;, &quot;Avenir Next&quot;, Avenir, &quot;Helvetica Neue&quot;, sans-serif; font-size:16px;'>This layer represents an estimate of the footprint of human settlement in 2020. It is intended as a fast-drawing cartographic layer to augment base maps and to focus a map reader's attention on the location of human population. This layer is not intended for analysis.</div><div style='font-family:&quot;Avenir Next W01&quot;, &quot;Avenir Next W00&quot;, &quot;Avenir Next&quot;, Avenir, &quot;Helvetica Neue&quot;, sans-serif; font-size:16px;'><br /></div><div style='font-family:&quot;Avenir Next W01&quot;, &quot;Avenir Next W00&quot;, &quot;Avenir Next&quot;, Avenir, &quot;Helvetica Neue&quot;, sans-serif; font-size:16px;'>This layer was derived from the 2020 slice of the <a href='https://livingatlas.arcgis.com/en/browse/?q=worldpop%20density#d=2&amp;q=WorldPop%20Density' style='color:rgb(0, 97, 155); text-decoration-line:none; font-family:inherit;' target='_blank' rel='nofollow ugc noopener noreferrer'>WorldPop Population Density 2000-2020 100m and 1km layers</a>. WorldPop <a href='https://journals.plos.org/plosone/article?id=10.1371%2fjournal.pone.0107042&amp;msclkid=e680f12ec18d11ec9d35ec3fdcf85b40' style='color:rgb(0, 97, 155); text-decoration-line:none; font-family:inherit;' target='_blank' rel='nofollow ugc noopener noreferrer'>modeled</a> this population footprint based on imagery datasets and population data from national statistical organizations and the United Nations. Zooming in to very large scales will often show discrepancies between reality and this or any model. Like all data sources imagery and population counts are subject to many types of error, thus this gridded footprint contains errors of omission and commission. The imagery base maps available in ArcGIS Online were not used in WorldPop's model. Imagery only informs the model of characteristics that indicate a potential for settlement, and cannot intrinsically indicate whether any or how many people live in a building. </div><div style='font-family:&quot;Avenir Next W01&quot;, &quot;Avenir Next W00&quot;, &quot;Avenir Next&quot;, Avenir, &quot;Helvetica Neue&quot;, sans-serif; font-size:16px;'><br /></div><div style='font-family:&quot;Avenir Next W01&quot;, &quot;Avenir Next W00&quot;, &quot;Avenir Next&quot;, Avenir, &quot;Helvetica Neue&quot;, sans-serif; font-size:16px;'>Also see the <a href='https://arcgis-content.maps.arcgis.com/home/item.html?id=dece835b488a468788729b78479790d7' style='color:rgb(0, 97, 155); text-decoration-line:none; font-family:inherit;' target='_blank' rel='nofollow ugc noopener noreferrer'>Urban Density Footprint layer</a>, which like this layer, is intended to provide a fast-drawing cartographic context for urban populations.</div><div style='font-family:&quot;Avenir Next W01&quot;, &quot;Avenir Next W00&quot;, &quot;Avenir Next&quot;, Avenir, &quot;Helvetica Neue&quot;, sans-serif; font-size:16px;'><br /></div><div style='font-family:&quot;Avenir Next W01&quot;, &quot;Avenir Next W00&quot;, &quot;Avenir Next&quot;, Avenir, &quot;Helvetica Neue&quot;, sans-serif; font-size:16px;'>The following processing steps were used to produce this layer in ArcGIS Pro:<br /></div><div style='font-family:&quot;Avenir Next W01&quot;, &quot;Avenir Next W00&quot;, &quot;Avenir Next&quot;, Avenir, &quot;Helvetica Neue&quot;, sans-serif; font-size:16px;'><br /></div><div style='font-family:&quot;Avenir Next W01&quot;, &quot;Avenir Next W00&quot;, &quot;Avenir Next&quot;, Avenir, &quot;Helvetica Neue&quot;, sans-serif; font-size:16px;'><div style='font-family:inherit;'>1. <a href='https://pro.arcgis.com/en/pro-app/2.8/tool-reference/spatial-analyst/int.htm' style='color:rgb(0, 97, 155); text-decoration-line:none; font-family:inherit;' target='_blank' rel='nofollow ugc noopener noreferrer'>Int tool (Spatial Analyst)</a> to truncate double precision values; all values less than 0.99 become 0.</div><div style='font-family:inherit;'>2. <a href='https://pro.arcgis.com/en/pro-app/2.8/tool-reference/spatial-analyst/reclassify.htm' style='color:rgb(0, 97, 155); text-decoration-line:none; font-family:inherit;' target='_blank' rel='nofollow ugc noopener noreferrer'>Reclassify tool</a> (Spatial Analyst) to set values 0 through 14 to NoData (Null) and all other values become <b>1</b>. The figure of 14 was empirically derived as a good balance between reducing errors of commission, i.e., false-positive cells with lower values, while not introducing errors of omission by eliminating obviously populated cells.</div><div style='font-family:inherit;'>3. <a href='https://pro.arcgis.com/en/pro-app/2.8/tool-reference/data-management/copy-raster.htm' style='color:rgb(0, 97, 155); text-decoration-line:none; font-family:inherit;' target='_blank' rel='nofollow ugc noopener noreferrer'>Copy Raster tool</a> with Output Coordinate System environment set to Web Mercator, bit depth to 1 bit, and NoData Value to 0.<br /></div><div style='font-family:inherit;'><br /></div><div style='font-family:inherit;'>Source:</div><div style='font-family:inherit;'><ul><li><font style='font-family:inherit;'><span style='font-family:inherit; font-size:16px;'><a href='https://worldpop.maps.arcgis.com/home/item.html?id=c90197b8948948d7b2194e1b03b11d1e' style='color:rgb(0, 97, 155); text-decoration-line:none; font-family:inherit;' target='_blank' rel='nofollow ugc noopener noreferrer'>WorldPop Population Density 2000-2020 100m</a>, which is created from WorldPop (www.worldpop.org - School of Geography and Environmental Science, University of Southampton; Department of Geography and Geosciences, University of Louisville; Departement de Geographie, Universite de Namur) and Center for International Earth Science Information Network (CIESIN), Columbia University (2018). Global High Resolution Population Denominators Project - Funded by The Bill and Melinda Gates Foundation. </span></font>The DOI for the original WorldPop.org total population population data<span style='font-size:16px;'> is </span><a href='https://www.worldpop.org/doi/10.5258/SOTON/WP00645' style='color:rgb(0, 121, 193); text-decoration-line:none; font-size:16px;' target='_blank' rel='nofollow ugc noopener noreferrer'>10.5258/SOTON/WP00645</a><span style='font-size:16px;'>.</span></li></ul></div></div>",
			"keyword": [
				"Population",
				"Population Footprint",
				"Settlement",
				"Human Settlement",
				"Human Footprint"
			],
			"issued": "2023-09-25T22:12:30.000Z",
			"modified": "2023-09-25T22:15:29.000Z",
			"publisher": {
				"name": "Pacific GeoPortal - Core Organization"
			},
			"contactPoint": {
				"@type": "vcard:Contact",
				"fn": "dkaragulle_pacificcore",
				"hasEmail": "mailto:pacific_geoportal@esri.com"
			},
			"accessLevel": "public",
			"spatial": "157.4086,-29.7353,180.0000,-3.3265",
			"license": "https://creativecommons.org/licenses/by/4.0",
			"distribution": [
				{
					"@type": "dcat:Distribution",
					"title": "ArcGIS Hub Dataset",
					"format": "Web Page",
					"mediaType": "text/html",
					"accessURL": "https://www.pacificgeoportal.com/maps/pacificcore::pacific-region-populated-footprint-in-2020"
				}
			],
			"theme": [
				"geospatial"
			]
		},
		{
			"@type": "dcat:Dataset",
			"identifier": "https://www.arcgis.com/home/item.html?id=af4fb7413687499cb6475dfe339dbb1f",
			"landingPage": "https://www.pacificgeoportal.com/maps/pacificcore::pacific-region-urban-density-footprint-in-2020",
			"title": "Pacific Region Urban Density Footprint in 2020",
			"description": "<div style='font-family:&quot;Avenir Next W01&quot;, &quot;Avenir Next W00&quot;, &quot;Avenir Next&quot;, Avenir, &quot;Helvetica Neue&quot;, sans-serif; font-size:16px;'>This layer is a subset of <a href='https://www.arcgis.com/home/item.html?id=dece835b488a468788729b78479790d7' target='_blank' rel='nofollow ugc noopener noreferrer'>Urban Density Footprint in 2020 global coverage</a> to focus on the Pacific Region. </div><div style='font-family:&quot;Avenir Next W01&quot;, &quot;Avenir Next W00&quot;, &quot;Avenir Next&quot;, Avenir, &quot;Helvetica Neue&quot;, sans-serif; font-size:16px;'><br /></div><div style='font-family:&quot;Avenir Next W01&quot;, &quot;Avenir Next W00&quot;, &quot;Avenir Next&quot;, Avenir, &quot;Helvetica Neue&quot;, sans-serif; font-size:16px;'>This layer represents an estimate of the footprint of urban settings in 2020. It is intended as a fast-drawing cartographic layer to augment base maps and to focus a map reader's attention on the location of human population. This layer is not intended for analysis. </div><div style='font-family:&quot;Avenir Next W01&quot;, &quot;Avenir Next W00&quot;, &quot;Avenir Next&quot;, Avenir, &quot;Helvetica Neue&quot;, sans-serif; font-size:16px;'><br /></div><div style='font-family:&quot;Avenir Next W01&quot;, &quot;Avenir Next W00&quot;, &quot;Avenir Next&quot;, Avenir, &quot;Helvetica Neue&quot;, sans-serif; font-size:16px;'>This layer was derived from the 2020 slice of the <a href='https://livingatlas.arcgis.com/en/browse/?q=worldpop%20density#d=2&amp;q=WorldPop%20Density' style='color:rgb(0, 97, 155); text-decoration-line:none; font-family:inherit;' target='_blank' rel='nofollow ugc noopener noreferrer'>WorldPop Population Density 2000-2020 100m and 1km layers</a>.</div><div style='font-family:&quot;Avenir Next W01&quot;, &quot;Avenir Next W00&quot;, &quot;Avenir Next&quot;, Avenir, &quot;Helvetica Neue&quot;, sans-serif; font-size:16px;'><br /></div><div style='font-family:&quot;Avenir Next W01&quot;, &quot;Avenir Next W00&quot;, &quot;Avenir Next&quot;, Avenir, &quot;Helvetica Neue&quot;, sans-serif; font-size:16px;'>Also see the <a href='https://arcgis-content.maps.arcgis.com/home/item.html?id=564afc8398874a659e6bd964ce783f1d' style='color:rgb(0, 97, 155); text-decoration-line:none; font-family:inherit;' target='_blank' rel='nofollow ugc noopener noreferrer'>Populated Footprint layer</a>, which like this layer, is intended to provide a fast-drawing cartographic context for the footprint of total population.<br /></div><div style='font-family:&quot;Avenir Next W01&quot;, &quot;Avenir Next W00&quot;, &quot;Avenir Next&quot;, Avenir, &quot;Helvetica Neue&quot;, sans-serif; font-size:16px;'><br /></div><div style='font-family:&quot;Avenir Next W01&quot;, &quot;Avenir Next W00&quot;, &quot;Avenir Next&quot;, Avenir, &quot;Helvetica Neue&quot;, sans-serif; font-size:16px;'>The following processing steps were used to produce this layer in ArcGIS Pro:<div style='font-family:inherit;'><div style='font-family:inherit;'><br /></div><div style='font-family:inherit;'>1. <a href='https://pro.arcgis.com/en/pro-app/2.8/tool-reference/spatial-analyst/int.htm' style='color:rgb(0, 121, 193); text-decoration-line:none;' target='_blank' rel='nofollow ugc noopener noreferrer'>Int tool (Spatial Analyst)</a> to truncate double precision values; all values less than 0.99 become 0.</div><div style='font-family:inherit;'>2. <a href='https://pro.arcgis.com/en/pro-app/2.8/tool-reference/spatial-analyst/reclassify.htm' style='color:rgb(0, 121, 193); text-decoration-line:none;' target='_blank' rel='nofollow ugc noopener noreferrer'>Reclassify tool</a> (Spatial Analyst) to set values 0 through 1499 to NoData (Null) and all other values become 1.</div><div style='font-family:inherit;'>3. <a href='https://pro.arcgis.com/en/pro-app/2.8/tool-reference/data-management/copy-raster.htm' style='color:rgb(0, 121, 193); text-decoration-line:none;' target='_blank' rel='nofollow ugc noopener noreferrer'>Copy Raster tool</a> with Output Coordinate System environment set to Web Mercator, bit depth to 1 bit, and NoData Value to 0.</div></div></div><div style='font-family:&quot;Avenir Next W01&quot;, &quot;Avenir Next W00&quot;, &quot;Avenir Next&quot;, Avenir, &quot;Helvetica Neue&quot;, sans-serif; font-size:16px;'><br /></div><div style='font-family:&quot;Avenir Next W01&quot;, &quot;Avenir Next W00&quot;, &quot;Avenir Next&quot;, Avenir, &quot;Helvetica Neue&quot;, sans-serif; font-size:16px;'><div>Source:</div><div><ul><li><font style='font-family:inherit;'><span style='font-family:inherit; font-size:16px;'><a href='https://worldpop.maps.arcgis.com/home/item.html?id=c90197b8948948d7b2194e1b03b11d1e' style='color:rgb(0, 121, 193); text-decoration-line:none; font-family:inherit;' target='_blank' rel='nofollow ugc noopener noreferrer'>WorldPop Population Density 2000-2020 100m</a>, which is created from WorldPop (www.worldpop.org - School of Geography and Environmental Science, University of Southampton; Department of Geography and Geosciences, University of Louisville; Departement de Geographie, Universite de Namur) and Center for International Earth Science Information Network (CIESIN), Columbia University (2018). Global High Resolution Population Denominators Project - Funded by The Bill and Melinda Gates Foundation. </span></font>The DOI for the original WorldPop.org total population population data<span style='font-family:inherit; font-size:16px;'> is </span><a href='https://www.worldpop.org/doi/10.5258/SOTON/WP00645' style='color:rgb(0, 121, 193); text-decoration-line:none; font-family:inherit; font-size:16px;' target='_blank' rel='nofollow ugc noopener noreferrer'>10.5258/SOTON/WP00645</a><span style='font-family:inherit; font-size:16px;'>.</span></li></ul></div></div>",
			"keyword": [
				"Population",
				"Population Footprint",
				"Settlement",
				"Human Settlement",
				"Human Footprint"
			],
			"issued": "2023-09-25T22:05:14.000Z",
			"modified": "2023-09-25T22:08:09.000Z",
			"publisher": {
				"name": "Pacific GeoPortal - Core Organization"
			},
			"contactPoint": {
				"@type": "vcard:Contact",
				"fn": "dkaragulle_pacificcore",
				"hasEmail": "mailto:pacific_geoportal@esri.com"
			},
			"accessLevel": "public",
			"spatial": "174.8694,-21.1715,180.0000,-14.5516",
			"license": "https://creativecommons.org/licenses/by/4.0",
			"distribution": [
				{
					"@type": "dcat:Distribution",
					"title": "ArcGIS Hub Dataset",
					"format": "Web Page",
					"mediaType": "text/html",
					"accessURL": "https://www.pacificgeoportal.com/maps/pacificcore::pacific-region-urban-density-footprint-in-2020"
				}
			],
			"theme": [
				"geospatial"
			]
		},
		{
			"@type": "dcat:Dataset",
			"identifier": "https://www.arcgis.com/home/item.html?id=98fd7ac2ce984be392b9cd6dee97777b",
			"landingPage": "https://www.pacificgeoportal.com/maps/pacificcore::pacific-region-imagery",
			"title": "Pacific Region Imagery",
			"description": "<p style='margin-top:0px; margin-bottom:1.5rem; font-family:&quot;Avenir Next W01&quot;, &quot;Avenir Next W00&quot;, &quot;Avenir Next&quot;, Avenir, &quot;Helvetica Neue&quot;, sans-serif; font-size:16px;'>This layer is a subset from the World Imagery to focus on the Pacific Region. You can access World Imagery from <a href='https://www.arcgis.com/home/item.html?id=10df2279f9684e4a9f6a7f08febac2a9' target='_blank' rel='nofollow ugc noopener noreferrer'>here.</a> </p><p style='margin-top:0px; margin-bottom:1.5rem; font-family:&quot;Avenir Next W01&quot;, &quot;Avenir Next W00&quot;, &quot;Avenir Next&quot;, Avenir, &quot;Helvetica Neue&quot;, sans-serif; font-size:16px;'>World Imagery provides one meter or better satellite and aerial imagery in many parts of the world and lower resolution satellite imagery worldwide. The map includes 15-meter TerraColor imagery at small and mid-scales (~1:591M down to ~1:288k) for the world. The map features Maxar imagery at 0.3-meter resolution for select metropolitan areas around the world, 0.5-meter resolution across the United States and parts of Western Europe, and 0.6-1.2-meter resolution imagery across the rest of the world. In addition to commercial sources, the World Imagery map features high-resolution aerial photography contributed by the GIS User Community. This imagery ranges from 0.3-meter to 0.03-meter resolution, down to ~1:280 in select communities. </p><p style='margin-top:0px; margin-bottom:1.5rem; font-family:&quot;Avenir Next W01&quot;, &quot;Avenir Next W00&quot;, &quot;Avenir Next&quot;, Avenir, &quot;Helvetica Neue&quot;, sans-serif; font-size:16px;'>You can contribute your imagery to this map and have it served by Esri via the <a href='https://livingatlas.arcgis.com/en/participate/#v=community&amp;subTab=what-to-contribute' style='color:rgb(0, 97, 155); text-decoration-line:none; font-family:inherit;' target='_blank' rel='nofollow ugc noopener noreferrer'>Community Maps Program</a>.</p><p style='margin-top:0px; margin-bottom:1.5rem; font-family:&quot;Avenir Next W01&quot;, &quot;Avenir Next W00&quot;, &quot;Avenir Next&quot;, Avenir, &quot;Helvetica Neue&quot;, sans-serif; font-size:16px;'><br /><font size='4' style='font-family:inherit;'>Updates and Coverage</font><br />You can use the <a href='https://www.arcgis.com/apps/MapSeries/index.html?appid=27236479807f43e9ac3ff65d6777e324' style='color:rgb(0, 97, 155); text-decoration-line:none; font-family:inherit;' target='_blank' rel='nofollow ugc noopener noreferrer'>World Imagery Updates</a> app to learn more about recent updates and map coverage.</p><br /><p style='margin-top:0px; margin-bottom:0px; font-family:&quot;Avenir Next W01&quot;, &quot;Avenir Next W00&quot;, &quot;Avenir Next&quot;, Avenir, &quot;Helvetica Neue&quot;, sans-serif; font-size:16px;'></p><p style='margin-top:0px; margin-bottom:1.5rem; font-family:&quot;Avenir Next W01&quot;, &quot;Avenir Next W00&quot;, &quot;Avenir Next&quot;, Avenir, &quot;Helvetica Neue&quot;, sans-serif; font-size:16px;'><font size='4' style='font-family:inherit;'>Citations</font><br />This layer includes imagery provider, collection date, resolution, accuracy, and source of the imagery. With the Identify tool in ArcGIS Desktop or the ArcGIS Online Map Viewer you can see imagery citations. Citations returned apply only to the available imagery at that location and scale. You may need to zoom in to view the best available imagery. Citations can also be accessed in the <a href='https://www.arcgis.com/home/item.html?id=c03a526d94704bfb839445e80de95495' style='color:rgb(0, 97, 155); text-decoration-line:none; font-family:inherit;' target='_blank' rel='nofollow ugc noopener noreferrer'>World Imagery with Metadata web map</a>.</p><p style='margin-top:0px; margin-bottom:1.5rem; font-family:&quot;Avenir Next W01&quot;, &quot;Avenir Next W00&quot;, &quot;Avenir Next&quot;, Avenir, &quot;Helvetica Neue&quot;, sans-serif; font-size:16px;'><br /><font size='4' style='font-family:inherit;'>Use</font><br />You can add this layer to the ArcGIS Online Map Viewer, ArcGIS Desktop, or ArcGIS Pro. To view this layer with a useful reference overlay, open the <a href='https://www.arcgis.com/home/item.html?id=28f49811a6974659988fd279de5ce39f' style='color:rgb(0, 97, 155); text-decoration-line:none; font-family:inherit;' target='_blank' rel='nofollow ugc noopener noreferrer'>Imagery Hybrid</a> web map.</p><p style='margin-top:0px; margin-bottom:1.5rem; font-family:&quot;Avenir Next W01&quot;, &quot;Avenir Next W00&quot;, &quot;Avenir Next&quot;, Avenir, &quot;Helvetica Neue&quot;, sans-serif; font-size:16px;'><br /><font size='4' style='font-family:inherit;'>Feedback</font><br />Have you ever seen a problem in the Esri World Imagery Map that you wanted to report?  You can use the <a href='https://www.arcgis.com/home/item.html?id=ebdfa4146680410bb952c7d532ea5407' style='color:rgb(0, 97, 155); text-decoration-line:none; font-family:inherit;' target='_blank' rel='nofollow ugc noopener noreferrer'>Imagery Map Feedback web map</a> to provide comments on issues. The feedback will be reviewed by the ArcGIS Online team and considered for one of our updates.</p>",
			"keyword": [
				"world",
				"imagery",
				"basemap",
				"satellite",
				"aerial",
				"community",
				"community basemap",
				"orthophotos",
				"esri_basemap",
				"general availability"
			],
			"issued": "2023-09-25T21:46:45.000Z",
			"modified": "2023-09-25T21:50:33.000Z",
			"publisher": {
				"name": "Pacific GeoPortal - Core Organization"
			},
			"contactPoint": {
				"@type": "vcard:Contact",
				"fn": "dkaragulle_pacificcore",
				"hasEmail": "mailto:pacific_geoportal@esri.com"
			},
			"accessLevel": "public",
			"spatial": "-180.0000,-78.4295,-35.0244,67.1177",
			"license": "<img src='https://downloads.esri.com/blogs/arcgisonline/esrilogo_new.png' style='max-width:100%; height:auto; font-family:&quot;Avenir Next W01&quot;, &quot;Avenir Next W00&quot;, &quot;Avenir Next&quot;, Avenir, &quot;Helvetica Neue&quot;, sans-serif; font-size:16px;' /><span style='font-family:&quot;Avenir Next W01&quot;, &quot;Avenir Next W00&quot;, &quot;Avenir Next&quot;, Avenir, &quot;Helvetica Neue&quot;, sans-serif; font-size:16px;'> This work is licensed under the Esri Master License Agreement.</span><br /><div style='font-family:&quot;Avenir Next W01&quot;, &quot;Avenir Next W00&quot;, &quot;Avenir Next&quot;, Avenir, &quot;Helvetica Neue&quot;, sans-serif; font-size:16px;'><a href='https://goto.arcgis.com/termsofuse/viewsummary' style='color:rgb(0, 97, 155); text-decoration-line:none;' target='_blank' rel='nofollow ugc noopener noreferrer'><b>View Summary</b></a> | <b><a href='https://goto.arcgis.com/termsofuse/viewtermsofuse' style='color:rgb(0, 97, 155); text-decoration-line:none;' target='_blank' rel='nofollow ugc noopener noreferrer'>View Terms of Use</a></b></div><div style='font-family:&quot;Avenir Next W01&quot;, &quot;Avenir Next W00&quot;, &quot;Avenir Next&quot;, Avenir, &quot;Helvetica Neue&quot;, sans-serif; font-size:16px;'><br /></div><div style='font-family:&quot;Avenir Next W01&quot;, &quot;Avenir Next W00&quot;, &quot;Avenir Next&quot;, Avenir, &quot;Helvetica Neue&quot;, sans-serif; font-size:16px;'><div><b>Export:</b> This layer is not intended to be used to export tiles for offline.  If you would like to export imagery for offline use in ArcGIS applications, you may use the <a href='https://www.arcgis.com/home/item.html?id=226d23f076da478bba4589e7eae95952' style='color:rgb(0, 97, 155); text-decoration-line:none;' target='_blank' rel='nofollow ugc noopener noreferrer'>World Imagery (for Export)</a> layer, which is intended for this purpose.</div><div><br /></div><div><b>Data Collection and Editing:</b> This layer may be used in various ArcGIS apps to support data collection and editing, with the results used internally or shared with others, as described for these <a href='https://www.arcgis.com/home/item.html?id=8e90a00a0a6845a49262e0b756f57a10' style='color:rgb(0, 97, 155); text-decoration-line:none;' target='_blank' rel='nofollow ugc noopener noreferrer'>use cases</a>.</div></div>",
			"distribution": [
				{
					"@type": "dcat:Distribution",
					"title": "ArcGIS Hub Dataset",
					"format": "Web Page",
					"mediaType": "text/html",
					"accessURL": "https://www.pacificgeoportal.com/maps/pacificcore::pacific-region-imagery"
				}
			],
			"theme": [
				"geospatial"
			]
		},
		{
			"@type": "dcat:Dataset",
			"identifier": "https://www.arcgis.com/home/item.html?id=8f2501b131cf4055a94189dd18ccb7a3",
			"landingPage": "https://www.pacificgeoportal.com/content/eaglegis::swimming-pool-detection-new-zealand",
			"title": "Swimming Pool Detection - New Zealand",
			"description": "<font color='#000000' size='3' style='font-family:inherit;'>Swimming pools are important for property tax assessment because they impact the value of the property. Tax assessors at local government agencies often rely on expensive and infrequent surveys, leading to assessment inaccuracies. Finding pools that are not on the assessment roll (such as those recently constructed) is valuable to assessors and will ultimately mean additional revenue for the community.</font><div style='padding-bottom:0.375rem; max-width:100%; display:inherit; font-family:&quot;Avenir Next W01&quot;, &quot;Avenir Next W00&quot;, &quot;Avenir Next&quot;, Avenir, &quot;Helvetica Neue&quot;, sans-serif; font-size:16px;'><p style='margin-top:0px; margin-bottom:0.0001pt; background-image:initial; background-position:initial; background-size:initial; background-repeat:initial; background-attachment:initial; background-origin:initial; background-clip:initial;'><font color='#000000' size='3' style='font-family:inherit;'><br /></font></p><p style='margin-top:0px; margin-bottom:0.0001pt; background-image:initial; background-position:initial; background-size:initial; background-repeat:initial; background-attachment:initial; background-origin:initial; background-clip:initial;'><font color='#000000' size='3' style='font-family:inherit;'>This deep learning model helps automate the task of finding pools from high resolution satellite imagery. This model can also benefit swimming pool maintenance companies and help redirect their marketing efforts. Public health and mosquito control agencies can also use this model to detect pools and drive field activity and mitigation efforts.</font></p><p style='margin-top:0px; margin-bottom:0.0001pt; background-image:initial; background-position:initial; background-size:initial; background-repeat:initial; background-attachment:initial; background-origin:initial; background-clip:initial;'><br /></p><p style='margin-top:0px; margin-bottom:0.0001pt; background-image:initial; background-position:initial; background-size:initial; background-repeat:initial; background-attachment:initial; background-origin:initial; background-clip:initial;'><font color='#000000' size='4' style='font-family:inherit;'><b>Licensing requirements<br /></b></font></p><p style='margin:0in 52.9pt 0.95pt 0in;'><font color='#000000' style='font-family:inherit;'><span style='font-family:inherit; font-size:medium;'>ArcGIS Desktop</span><i> –</i><span style='font-family:inherit; font-size:medium;'> ArcGIS Image Analyst </span><span style='font-family:inherit; font-size:medium;'>extension for ArcGIS Pro</span></font></p><p style='margin:0in 52.9pt 0.95pt 0in;'><span style='font-family:inherit; font-size:medium;'><font color='#000000' style='font-family:inherit;'>ArcGIS Enterprise – ArcGIS Image Server with raster analytics configured</font></span></p><p style='margin:0in 52.9pt 0.95pt 0in;'><span style='font-family:inherit; font-size:medium;'><font color='#000000' style='font-family:inherit;'>ArcGIS Online – ArcGIS Image for ArcGIS Online</font></span></p><div style='font-family:inherit;'><br /></div><p style='margin-top:0px; margin-bottom:0.0001pt; background-image:initial; background-position:initial; background-size:initial; background-repeat:initial; background-attachment:initial; background-origin:initial; background-clip:initial;'><span style='font-family:inherit;'><font size='4' style='font-family:inherit;'><font color='#000000' style='font-family:inherit;'><b>Using the model<br /></b></font></font></span></p><div style='font-family:inherit; text-align:justify;'><font color='#000000' style='font-family:inherit;'>Follow the </font><a href='https://doc.arcgis.com/en/pretrained-models/latest/imagery/using-pool-detection-usa.htm' style='color:rgb(0, 121, 193); text-decoration-line:none; font-family:inherit;' target='_blank' rel='nofollow ugc noopener noreferrer'>guide</a><font color='#000000' style='font-family:inherit;'> to use the model. Before using this model,</font><font color='#000000' size='4' style='font-family:inherit; font-weight:bold;'><font style='font-weight:400; font-size:16px;'> ensure that the supported deep learning </font><span style='font-weight:400; font-size:17px;'>libraries </span><font style='font-weight:400; font-size:16px;'>are installed.</font><span style='font-family:inherit; font-weight:400; font-size:16px;'> </span><span style='font-weight:400; font-size:medium;'>For more details, check </span><span style='font-weight:400; font-size:medium;'><a href='https://github.com/esri/deep-learning-frameworks' style='color:rgb(0, 121, 193); text-decoration-line:none; font-family:inherit;' target='_blank' rel='nofollow ugc noopener noreferrer'>Deep Learning Libraries Installer for ArcGIS</a></span><span style='font-family:inherit; font-size:15px; font-weight:400;'>.</span></font></div><p style='margin-top:0px; margin-bottom:0px;'></p><p style='margin-top:0px; margin-bottom:0.0001pt; background-image:initial; background-position:initial; background-size:initial; background-repeat:initial; background-attachment:initial; background-origin:initial; background-clip:initial;'><span style='font-family:inherit; text-align:justify;'><font color='#000000' style='font-family:inherit;'><br /></font></span></p><p style='margin-top:0px; margin-bottom:0.0001pt; background-image:initial; background-position:initial; background-size:initial; background-repeat:initial; background-attachment:initial; background-origin:initial; background-clip:initial;'><span style='font-family:inherit;'><font color='#000000' style='font-family:inherit;'>Note: Deep learning is computationally intensive, and a powerful GPU is recommended to process large datasets.</font></span></p><p style='margin-top:0px; margin-bottom:0.0001pt; background-image:initial; background-position:initial; background-size:initial; background-repeat:initial; background-attachment:initial; background-origin:initial; background-clip:initial;'><span style='font-family:inherit;'><font color='#000000' style='font-family:inherit;'><br /></font></span></p><p style='margin-top:0px; margin-bottom:0.0001pt; background-image:initial; background-position:initial; background-size:initial; background-repeat:initial; background-attachment:initial; background-origin:initial; background-clip:initial;'><font color='#000000' style='font-family:inherit;'><span style='font-family:inherit;'><font size='4' style='font-family:inherit;'><b>Input<br /></b></font></span>8-bit, 3-band high resolution (5-7.5 centimeters) imagery</font></p><p style='margin-top:0px; margin-bottom:0.0001pt; background-image:initial; background-position:initial; background-size:initial; background-repeat:initial; background-attachment:initial; background-origin:initial; background-clip:initial;'><span style='font-family:inherit;'><font color='#000000' style='font-family:inherit;'><br /></font></span></p><p style='margin-top:0px; margin-bottom:0.0001pt; background-image:initial; background-position:initial; background-size:initial; background-repeat:initial; background-attachment:initial; background-origin:initial; background-clip:initial;'><font color='#000000' style='font-family:inherit;'><font size='4' style='font-family:inherit;'><b>Output<br /></b></font>Feature class containing bounding boxes depicting pool locations with class BuiltinPool | PopupPool</font></p><br /><img src='https://user-images.githubusercontent.com/62361535/224633843-17ec7aa5-eca0-4c31-883f-cb9b7478caf8.png' /><br /><p style='margin-top:0px; margin-bottom:0.0001pt; background-image:initial; background-position:initial; background-size:initial; background-repeat:initial; background-attachment:initial; background-origin:initial; background-clip:initial;'><font color='#000000' style='font-family:inherit;'><br /></font></p><p style='margin-top:0px; margin-bottom:0.0001pt; background-image:initial; background-position:initial; background-size:initial; background-repeat:initial; background-attachment:initial; background-origin:initial; background-clip:initial;'><font color='#000000' style='font-family:inherit;'><span style='font-family:inherit;'><font size='4' style='font-family:inherit;'><b>Applicable geographies<br /></b></font></span>The model is expected to work well in the New Zealand.</font></p><p style='margin-top:0px; margin-bottom:0.0001pt; background-image:initial; background-position:initial; background-size:initial; background-repeat:initial; background-attachment:initial; background-origin:initial; background-clip:initial;'><span style='font-family:inherit;'><font color='#000000' style='font-family:inherit;'><br /></font></span></p><p style='margin-top:0px; margin-bottom:0.0001pt; background-image:initial; background-position:initial; background-size:initial; background-repeat:initial; background-attachment:initial; background-origin:initial; background-clip:initial;'><font color='#000000' style='font-family:inherit;'><span style='font-family:inherit;'><font size='4' style='font-family:inherit;'><b>Model architecture<br /></b></font></span>The model uses the MMDetection model architecture implemented using </font><span style='color:rgb(0, 0, 0);'>ArcGIS Pro Arcpy</span><font color='#000000' style='font-family:inherit;'>.</font></p><p style='margin-top:0px; margin-bottom:0.0001pt; background-image:initial; background-position:initial; background-size:initial; background-repeat:initial; background-attachment:initial; background-origin:initial; background-clip:initial;'><span style='font-family:inherit;'><font color='#000000' style='font-family:inherit;'><br /></font></span></p><p style='margin-top:0px; margin-bottom:0.0001pt; background-image:initial; background-position:initial; background-size:initial; background-repeat:initial; background-attachment:initial; background-origin:initial; background-clip:initial;'><font color='#000000' style='font-family:inherit;'><font size='4' style='font-family:inherit;'><b>Accuracy metrics<br /></b></font>The model has an average precision score of 0.95.</font></p><table border='1' cellpadding='2' style='background-color:transparent; margin-bottom:1.5rem; width:193.484px; border-collapse:collapse; border-spacing:0px; border:1px solid rgb(204, 204, 204); font-size:14px; font-family:&quot;Helvetica Neue&quot;, Helvetica, Arial, sans-serif;'><tbody><tr style='border-bottom:1px solid rgb(204, 204, 204); box-sizing:border-box; height:23px;'><td style='text-align:center; border-left:1px solid rgb(204, 204, 204); border-right:1px solid rgb(204, 204, 204); padding:0px; box-sizing:border-box; width:32.7188px; height:23px;'><font color='#000000' style='font-family:inherit;'>1 </font></td><td style='text-align:center; border-left:1px solid rgb(204, 204, 204); border-right:1px solid rgb(204, 204, 204); padding:0px; box-sizing:border-box; width:159.766px; height:23px;'><span style='color:rgb(0, 0, 0);'>BuiltInPool</span><br /></td></tr><tr style='border-bottom:none; box-sizing:border-box; height:23.5px;'><td style='text-align:center; border-left:1px solid rgb(204, 204, 204); border-right:1px solid rgb(204, 204, 204); padding:0px; box-sizing:border-box; width:32.7188px; height:23.5px;'><font color='#000000' style='font-family:inherit;'>2</font></td><td style='text-align:center; border-left:1px solid rgb(204, 204, 204); border-right:1px solid rgb(204, 204, 204); padding:0px; box-sizing:border-box; width:159.766px; height:23.5px;'><font color='#000000' style='font-family:inherit;'>PopupPool<br /></font></td></tr></tbody></table><p style='margin-top:0px; margin-bottom:0.0001pt; background-image:initial; background-position:initial; background-size:initial; background-repeat:initial; background-attachment:initial; background-origin:initial; background-clip:initial;'><span style='font-family:inherit;'><font color='#000000' style='font-family:inherit;'><br /></font></span></p><p style='margin-top:0px; margin-bottom:0.0001pt; background-image:initial; background-position:initial; background-size:initial; background-repeat:initial; background-attachment:initial; background-origin:initial; background-clip:initial;'><span style='font-family:inherit;'><b><font color='#000000' size='4' style='font-family:inherit;'>Sample results<br /></font></b></span></p><p style='margin-top:0px; margin-bottom:1.5rem;'><font color='#000000'><font size='3' style='font-family:inherit;'>Here are a few results from the model.<br />(Post processing are recommended to filter out False Positive Object. If the confidence are below certain threshold e.g 5%)<br /></font></font></p><p style='margin-top:0px; margin-bottom:1.5rem;'><font color='#000000' style='font-family:&quot;Avenir Next&quot;, Avenir, &quot;Helvetica Neue&quot;, Helvetica, Arial, sans-serif; font-size:15px;'>To learn how to use this model, see this </font><a href='https://storymaps.arcgis.com/stories/96749c4091c442fe99a4a2f6553c6c52' target='_blank' rel='nofollow ugc noopener noreferrer'>story</a><span style='color:rgb(0, 0, 0); font-family:inherit; font-size:medium;'><br /></span></p><p style='margin-top:0px; margin-bottom:1.5rem;'><img src='https://user-images.githubusercontent.com/62361535/224635922-f211a55d-b6f4-4b4d-8a48-1f4ef9ce6884.png' /></p></div>",
			"keyword": [
				"dlpk",
				"Deep Learning",
				"DL Model Evaluation",
				"Eagle Technology",
				"Esri",
				"New Zealand",
				"eaglegis",
				"pool",
				"pools",
				"swimming",
				"swimming pool",
				"swimming pools",
				"popup"
			],
			"issued": "2023-03-13T06:40:07.000Z",
			"modified": "2023-09-22T21:20:59.000Z",
			"publisher": {
				"name": "Eagle Technology Group Ltd"
			},
			"contactPoint": {
				"@type": "vcard:Contact",
				"fn": "eaglegis",
				"hasEmail": "mailto:ts@eaglegis.co.nz"
			},
			"accessLevel": "public",
			"spatial": "165.9143,-47.4597,178.8342,-33.8362",
			"license": "https://creativecommons.org/licenses/by/4.0",
			"distribution": [
				{
					"@type": "dcat:Distribution",
					"title": "ArcGIS Hub Dataset",
					"format": "Web Page",
					"mediaType": "text/html",
					"accessURL": "https://www.pacificgeoportal.com/content/eaglegis::swimming-pool-detection-new-zealand"
				}
			],
			"theme": [
				"geospatial"
			]
		},
		{
			"@type": "dcat:Dataset",
			"identifier": "https://www.arcgis.com/home/item.html?id=ebc54f498df94224990cf5f6598a5665",
			"landingPage": "https://www.pacificgeoportal.com/content/eaglegis::building-point-classification-new-zealand",
			"title": "Building Point Classification - New Zealand",
			"description": "<div><font color='#000000' face='Avenir Next W01, Avenir Next W00, Avenir Next, Avenir, Helvetica Neue, sans-serif'>This New Zealand Point Cloud Classification Deep Learning Package will classify point clouds into building and background classes. This model is optimized to work with New Zealand aerial LiDAR data.</font></div><div><font color='#000000' face='Avenir Next W01, Avenir Next W00, Avenir Next, Avenir, Helvetica Neue, sans-serif'><br /></font></div><div><font color='#000000' face='Avenir Next W01, Avenir Next W00, Avenir Next, Avenir, Helvetica Neue, sans-serif'>The classification of point cloud datasets to identify Building is useful in applications such as high-quality 3D basemap creation, urban planning, and planning climate change response.</font></div><div><font color='#000000' face='Avenir Next W01, Avenir Next W00, Avenir Next, Avenir, Helvetica Neue, sans-serif'><br /></font></div><div><font color='#000000' face='Avenir Next W01, Avenir Next W00, Avenir Next, Avenir, Helvetica Neue, sans-serif'>Building could have a complex irregular geometrical structure that is hard to capture using traditional means. Deep learning models are highly capable of learning these complex structures and giving superior results.</font><div style='max-width:100%; display:inherit;'><div><font color='#000000'><div><font style='text-align:justify;'><div style='font-family:inherit; text-align:left;'><font size='3' style='font-family:inherit;'><br /></font></div><div style='font-family:inherit; text-align:left;'><font size='3' style='font-family:inherit;'>This model is designed to extract Building in both urban and rural area in New Zealand.</font></div><div style='text-align:left;'><font size='3'><br /><font face='inherit'>The Training/Testing/Validation dataset are taken within New Zealand resulting of a high </font><font face='Avenir Next W01, Avenir Next W00, Avenir Next, Avenir, Helvetica Neue, sans-serif'>reliability</font><font face='inherit'> to recognize the pattern of NZ common building architecture.</font></font><span style='font-family:inherit; font-size:medium;'><br /></span></div></font></div></font></div><div style='font-family:&quot;Avenir Next W01&quot;, &quot;Avenir Next W00&quot;, &quot;Avenir Next&quot;, Avenir, &quot;Helvetica Neue&quot;, sans-serif; font-size:16px;'><font color='#000000' size='3' style='font-family:inherit;'><span style='font-family:inherit; text-align:justify;'><br /></span></font></div><div style='font-family:&quot;Avenir Next W01&quot;, &quot;Avenir Next W00&quot;, &quot;Avenir Next&quot;, Avenir, &quot;Helvetica Neue&quot;, sans-serif; font-size:16px;'><font color='#000000' style='font-family:inherit;'><font style='font-family:&quot;Avenir Next&quot;, Avenir, &quot;Helvetica Neue&quot;, Helvetica, Arial, sans-serif; font-size:15px;'><font size='4' style='font-family:inherit;'><b>Licensing requirements</b><b><br /></b></font><span style='font-family:inherit; font-size:12pt;'>ArcGIS Desktop - </span><span style='font-family:inherit; font-size:16px;'>ArcGIS 3D Analyst </span></font><span style='font-family:&quot;Avenir Next&quot;, Avenir, &quot;Helvetica Neue&quot;, Helvetica, Arial, sans-serif; font-size:12pt;'>extension for ArcGIS Pro</span><span style='font-family:inherit; font-size:medium; text-align:justify;'><br /></span></font></div><div><div style='font-family:inherit; font-size:16px;'><span style='font-family:inherit; font-size:medium;'><font color='#000000' style='font-family:inherit;'><br /></font></span></div><div style='font-family:inherit; font-size:16px;'><font color='#000000' style='font-family:inherit;'><b>Using the model</b><br /></font><div style='font-family:inherit;'><font style='font-family:inherit; color:rgb(0, 0, 0); text-align:justify;'>The model can be used in</font><font style='font-family:inherit; color:rgb(0, 0, 0); text-align:justify;'> ArcGIS Pro's </font><a href='https://pro.arcgis.com/en/pro-app/latest/tool-reference/3d-analyst/classify-point-cloud-using-trained-model.htm' style='color:rgb(0, 121, 193); text-decoration-line:none; text-align:justify;' target='_blank' rel='nofollow ugc noopener noreferrer'>Classify Point Cloud Using Trained Model</a><font style='font-family:inherit; color:rgb(0, 0, 0); text-align:justify;'> tool. </font><font color='#000000' face='Avenir Next W01, Avenir Next W00, Avenir Next, Avenir, Helvetica Neue, sans-serif' style='background-color:transparent; text-align:justify;'>Before using this model,</font><font color='#000000' style='background-color:transparent;'><font style='font-family:inherit; text-align:justify;'> ensure that the supported deep learning frameworks </font><span style='font-family:inherit; text-align:justify; font-size:17px;'>libraries </span><font style='font-family:inherit; text-align:justify;'>are installed.</font><span style='font-family:inherit; text-align:justify;'> </span><span style='font-family:inherit; font-size:medium; text-align:justify;'>For more details, check </span><span style='font-family:inherit; font-size:medium; text-align:justify;'><a href='https://github.com/esri/deep-learning-frameworks' style='color:rgb(0, 121, 193); text-decoration-line:none; font-family:inherit;' target='_blank' rel='nofollow ugc noopener noreferrer'>Deep Learning Libraries Installer for ArcGIS</a></span><span style='font-family:inherit; font-size:medium; text-align:justify;'>.</span></font></div></div><div style='font-family:inherit; font-size:16px; text-align:justify;'><div style='font-family:inherit;'><font style='font-family:inherit;'><font style='font-family:inherit; text-align:start;'><font color='#000000' style='font-family:inherit;'><br /></font></font></font></div><div style='font-family:inherit; text-align:left;'><font style='font-family:inherit;'><font style='font-family:inherit;'><font color='#000000' style='font-family:inherit;'><span style='font-family:inherit;'><span style='font-family:inherit; text-align:justify;'>Note: Deep learning is computationally intensive, and a powerful GPU is recommended to process large datasets.</span></span></font></font></font></div><div style='font-family:inherit;'><font style='font-family:inherit;'><font color='#000000' style='font-family:inherit; text-align:start;'>The model is trained with classified LiDAR that follows the </font></font></div></div><div style='text-align:justify;'><div style='font-family:inherit; font-size:16px; text-align:left;'><font color='#000000' style='font-family:inherit;'><br /></font></div><div style='font-family:inherit; font-size:16px; text-align:left;'><p style='margin-top:0px; margin-bottom:1.5rem;'><font color='#000000' style='font-family:inherit;'><font style='font-family:inherit;'>The model was trained using a training dataset with the full set of points. Therefore, it is important to make the full set of points available to the neural network while </font><span style='font-family:inherit;'>predicting - allowing it to </span><span style='font-family:inherit;'>better discriminate points of 'class of interest' versus background points. </span><span style='font-family:inherit; text-align:justify;'><font face='inherit' style='font-family:inherit;'><span style='font-family:inherit;'>It is recommended to use 'selective/target classification' and 'class preservation' functionalities during prediction to have better control over the classification and </span></font><span style='font-family:inherit;'>scenarios</span><font face='inherit' style='font-family:inherit;'><span style='font-family:inherit;'> with false positives.</span></font></span><br /></font></p><p style='margin-top:0px; margin-bottom:1.5rem; font-family:inherit;'><font color='#000000' style='font-family:inherit;'>The model was trained on airborne lidar datasets and is expected to perform best with similar datasets. Classification of terrestrial point cloud datasets may work but has not been validated. For such cases, this pre-trained model may be fine-tuned to save on cost, time, and compute resources while improving accuracy. <span style='font-family:inherit;'>Another example where fine-tuning this model can be useful is when the object of interest is tram wires, railway wires, etc. which are geometrically similar to electricity wires.</span><span style='font-family:inherit;'> When fine-tuning this model, the target training data characteristics such as class structure, maximum number of points per block and extra attributes should match those of the data originally used for training this model (see Training data section below).</span></font></p></div><div><font style='text-align:start;'><div><p style='font-family:inherit; font-size:16px; margin-top:0px; margin-bottom:1.5rem; color:rgb(0, 0, 0);'><font size='4' style='font-family:inherit;'><b>Output<br /></b></font><b><b><span style='font-family:inherit; background-color:transparent; font-weight:400; text-align:justify;'>The model will classify the point cloud into the following classes with their meaning as </span><font style='font-family:inherit; background-color:transparent; font-weight:400;'>defined by the American Society for Photogrammetry and Remote Sensing (ASPRS) described below</font><span style='font-family:inherit; background-color:transparent; font-weight:400; font-size:medium;'>:</span></b></b></p><div style='font-family:inherit; font-size:16px;'><div style='font-family:inherit;'><table border='1' cellpadding='2' style='margin-bottom:1.5rem; width:193.484px; background-color:transparent; border-collapse:collapse; border-spacing:0px; border:1px solid rgb(204, 204, 204); font-size:14px; font-family:&quot;Helvetica Neue&quot;, Helvetica, Arial, sans-serif;'><tbody><tr style='border-bottom:1px solid rgb(204, 204, 204); box-sizing:border-box; height:23px;'><td style='border-left:1px solid rgb(204, 204, 204); border-right:1px solid rgb(204, 204, 204); padding:0px; box-sizing:border-box; width:32.7188px; height:23px;'><font color='#000000' style='font-family:inherit;'>   0 </font></td><td style='border-left:1px solid rgb(204, 204, 204); border-right:1px solid rgb(204, 204, 204); padding:0px; box-sizing:border-box; width:159.766px; height:23px;'><font color='#000000' style='font-family:inherit;'>      Background</font></td></tr><tr style='border-bottom:none; box-sizing:border-box; height:23.5px;'><td style='border-left:1px solid rgb(204, 204, 204); border-right:1px solid rgb(204, 204, 204); padding:0px; box-sizing:border-box; width:32.7188px; height:23.5px;'><font color='#000000' style='font-family:inherit;'>   6</font></td><td style='border-left:1px solid rgb(204, 204, 204); border-right:1px solid rgb(204, 204, 204); padding:0px; box-sizing:border-box; width:159.766px; height:23.5px;'><font color='#000000' style='font-family:inherit;'>      Building</font></td></tr></tbody></table><div style='font-family:&quot;Helvetica Neue&quot;, Helvetica, Arial, sans-serif; color:rgb(51, 51, 51); box-sizing:border-box; font-size:14px; margin:0px; padding:0px; height:4px; width:240px;'></div><div style='font-family:&quot;Helvetica Neue&quot;, Helvetica, Arial, sans-serif; color:rgb(51, 51, 51); box-sizing:border-box; font-size:14px; margin:0px; padding:0px; height:4px; width:240px;'></div><div style='font-family:&quot;Helvetica Neue&quot;, Helvetica, Arial, sans-serif; color:rgb(51, 51, 51); box-sizing:border-box; font-size:14px; margin:0px; padding:0px; height:4px; width:240px;'></div><div style='font-family:&quot;Helvetica Neue&quot;, Helvetica, Arial, sans-serif; color:rgb(51, 51, 51); box-sizing:border-box; font-size:14px; margin:0px; padding:0px; height:4px; width:240px;'><br /></div></div><b><font size='4' style='font-family:inherit;'><font color='#000000' style='font-family:inherit;'>Applicable geographies</font><br /></font></b><span style='font-family:inherit; color:rgb(0, 0, 0); font-size:medium;'>The model is expected to work well in the New Zealand. </span><span style='font-family:inherit; color:rgb(0, 0, 0); font-size:medium; text-align:justify;'>It's seen to produce favorable results </span><span style='font-family:inherit; color:rgb(0, 0, 0);'>as shown</span><span style='font-family:inherit; color:rgb(0, 0, 0); font-size:medium; text-align:justify;'> in many regions. </span><span style='font-family:inherit; color:rgb(0, 0, 0); text-align:justify;'>However, results can vary for datasets that are statistically dissimilar to training data.</span></div><div style='font-family:inherit; font-size:16px;'><span style='font-family:inherit; color:rgb(0, 0, 0); text-align:justify;'><br />Training dataset - Auckland, Christchurch, Kapiti, Wellington </span><span style='font-family:inherit; color:rgb(0, 0, 0); text-align:justify;'><br />Testing dataset - </span><span style='color:rgb(0, 0, 0); text-align:justify; font-family:inherit;'>Auckland, </span><span style='color:rgb(0, 0, 0); font-family:inherit; text-align:justify;'>Wellington</span></div><div style='font-family:inherit; font-size:16px;'><span style='font-family:inherit; color:rgb(0, 0, 0); text-align:justify;'>Validation/Evaluation dataset - Hutt City</span></div><div style='font-family:inherit; font-size:16px;'><span style='font-family:inherit; color:rgb(0, 0, 0); text-align:justify;'><br /></span></div><div style='font-family:inherit; font-size:16px;'><table border='1' style='margin-bottom:1.5rem; width:229px; background-color:transparent; border-collapse:collapse; border-spacing:0px; border:1px solid rgb(204, 204, 204); text-align:center; font-size:14px; color:rgb(51, 51, 51); font-family:&quot;Helvetica Neue&quot;, Helvetica, Arial, sans-serif; height:70px;'><tbody><tr style='border-bottom:1px solid rgb(204, 204, 204); text-align:left; box-sizing:border-box; height:21px;'><td style='border-left:1px solid rgb(204, 204, 204); border-right:1px solid rgb(204, 204, 204); padding:0px; box-sizing:border-box; height:21px; width:70.2656px;'><font color='#000000'> Dataset</font></td><td style='border-left:1px solid rgb(204, 204, 204); border-right:1px solid rgb(204, 204, 204); padding:0px; box-sizing:border-box; height:21px; width:157.734px;'><font color='#000000'> City</font></td></tr><tr style='border-bottom:1px solid rgb(204, 204, 204); text-align:left; box-sizing:border-box; height:21px;'><td style='border-left:1px solid rgb(204, 204, 204); border-right:1px solid rgb(204, 204, 204); padding:0px; box-sizing:border-box; height:21px; width:70.2656px;'><font color='#000000' style='font-family:inherit;'> Training</font></td><td style='border-left:1px solid rgb(204, 204, 204); border-right:1px solid rgb(204, 204, 204); padding:0px; box-sizing:border-box; height:21px; width:157.734px;'><font color='#000000' style='font-family:inherit;'> </font>Auckland, Christchurch,   Kapiti, Wellington</td></tr><tr style='border-bottom:1px solid rgb(204, 204, 204); text-align:left; box-sizing:border-box; height:21px;'><td style='border-left:1px solid rgb(204, 204, 204); border-right:1px solid rgb(204, 204, 204); padding:0px; box-sizing:border-box; height:21px; width:70.2656px;'><font color='#000000' style='font-family:inherit;'> Testing</font></td><td style='border-left:1px solid rgb(204, 204, 204); border-right:1px solid rgb(204, 204, 204); padding:0px; box-sizing:border-box; height:21px; width:157.734px;'><font color='#000000' style='font-family:inherit;'> </font>Auckland, Wellington </td></tr><tr style='border-bottom:none; text-align:left; box-sizing:border-box; height:5.5px;'><td style='border-left:1px solid rgb(204, 204, 204); border-right:1px solid rgb(204, 204, 204); padding:0px; box-sizing:border-box; height:5.5px; width:70.2656px;'><font color='#000000' style='font-family:inherit;'> Validating</font></td><td style='border-left:1px solid rgb(204, 204, 204); border-right:1px solid rgb(204, 204, 204); padding:0px; box-sizing:border-box; height:5.5px; width:157.734px;'><font color='#000000'> Hutt</font></td></tr></tbody></table></div><p style='font-family:inherit; font-size:16px; margin-top:0pt; margin-bottom:0pt; color:rgb(0, 0, 0); background:transparent;'><b><font size='4' style='font-family:inherit;'>Model architecture<br /></font></b></p><div style='font-family:inherit; font-size:16px; text-align:start; color:rgb(0, 0, 0);'><b><font size='4' style='font-family:inherit;'><span style='font-family:inherit; background-color:transparent; font-weight:400; font-size:16px; text-align:justify;'>This model uses the SemanticQueryNetwork</span></font></b><b><font size='4' style='font-family:inherit;'><span style='font-family:inherit; background-color:transparent; font-weight:400; font-size:16px; text-align:justify;'> model architecture implemented in ArcGIS Pro</span></font></b><b><font size='4' style='font-family:inherit;'><span style='font-family:inherit; background-color:transparent; font-weight:400; font-size:16px; text-align:justify;'>.<br /></span></font></b></div><p style='font-family:inherit; font-size:16px; margin-top:0px; margin-bottom:0px; color:rgb(0, 0, 0);'></p><p style='font-family:inherit; font-size:16px; margin-top:0pt; margin-bottom:0pt; color:rgb(0, 0, 0); background:transparent;'><font style='font-family:inherit; text-align:justify; font-size:15px;'><span style='font-family:inherit; font-size:16px;'><br /></span></font></p><p style='font-family:inherit; font-size:16px; margin-top:0pt; margin-bottom:0pt; color:rgb(0, 0, 0); background:transparent;'><b><font size='4' style='font-family:inherit;'>Accuracy metrics<br /></font></b><span style='font-family:inherit; background-color:transparent;'>The table below summarizes the accuracy of the predictions on the validation dataset.</span></p><p style='font-family:inherit; font-size:16px; margin-top:0pt; margin-bottom:0pt; color:rgb(0, 0, 0); background:transparent;'><span style='font-family:inherit; background-color:transparent;'><br /></span></p><table border='1' cellpadding='2' style='font-family:&quot;Helvetica Neue&quot;, Helvetica, Arial, sans-serif; font-size:14px; background-color:transparent; margin-bottom:1.5rem; width:362.484px; border-collapse:collapse; border-spacing:0px; border:1px solid rgb(204, 204, 204); text-align:center; color:rgb(0, 0, 0); height:100px;'><tbody><tr style='border-bottom:1px solid rgb(204, 204, 204); text-align:left; box-sizing:border-box; height:3px;'><td style='border-left:1px solid rgb(204, 204, 204); border-right:1px solid rgb(204, 204, 204); padding:0px; box-sizing:border-box; width:140px; height:3px;'>  -</td><td style='border-left:1px solid rgb(204, 204, 204); border-right:1px solid rgb(204, 204, 204); padding:0px; box-sizing:border-box; width:66px; height:3px;'> Precision</td><td style='border-left:1px solid rgb(204, 204, 204); border-right:1px solid rgb(204, 204, 204); padding:0px; box-sizing:border-box; width:66px; height:3px;'> Recall</td><td style='border-left:1px solid rgb(204, 204, 204); border-right:1px solid rgb(204, 204, 204); padding:0px; box-sizing:border-box; width:71.4844px; height:3px;'> F1-score</td></tr><tr style='border-bottom:1px solid rgb(204, 204, 204); text-align:left; box-sizing:border-box; height:6px;'><td style='text-align:center; border-left:1px solid rgb(204, 204, 204); border-right:1px solid rgb(204, 204, 204); padding:0px; box-sizing:border-box; width:140px; height:6px;'>  <font face='Arial, sans-serif'>Never Classified</font></td><td style='border-left:1px solid rgb(204, 204, 204); border-right:1px solid rgb(204, 204, 204); padding:0px; box-sizing:border-box; width:66px; height:6px;'> 0.984921</td><td style='border-left:1px solid rgb(204, 204, 204); border-right:1px solid rgb(204, 204, 204); padding:0px; box-sizing:border-box; width:66px; height:6px;'>  0.975853</td><td style='border-left:1px solid rgb(204, 204, 204); border-right:1px solid rgb(204, 204, 204); padding:0px; box-sizing:border-box; width:71.4844px; height:6px;'>  0.979762</td></tr><tr style='border-bottom:1px solid rgb(204, 204, 204); text-align:left; box-sizing:border-box; height:23px;'><td style='text-align:center; border-left:1px solid rgb(204, 204, 204); border-right:1px solid rgb(204, 204, 204); padding:0px; box-sizing:border-box; width:140px; height:23px;'> Building</td><td style='border-left:1px solid rgb(204, 204, 204); border-right:1px solid rgb(204, 204, 204); padding:0px; box-sizing:border-box; width:66px; height:23px;'> 0.951285</td><td style='border-left:1px solid rgb(204, 204, 204); border-right:1px solid rgb(204, 204, 204); padding:0px; box-sizing:border-box; width:66px; height:23px;'>  0.967563</td><td style='border-left:1px solid rgb(204, 204, 204); border-right:1px solid rgb(204, 204, 204); padding:0px; box-sizing:border-box; width:71.4844px; height:23px;'>  0.9584</td></tr></tbody></table><br /><div style='font-family:inherit; font-size:16px; color:rgb(0, 0, 0);'><font size='4' style='font-family:inherit;'><b>Training data<br /></b></font><font style='font-family:inherit;'>This model is trained on classified dataset originally provided by Open TopoGraphy with &lt; 1% of manual labelling and correction.</font></div><div style='font-family:inherit; font-size:16px; color:rgb(0, 0, 0);'><font style='font-family:inherit;'>Train-Test split percentage {Train: 75~%, Test: 25~%} Chosen this ratio based on the analysis from previous epoch statistics which appears to have a descent improvement<br /></font><span style='font-family:inherit;'>The training data used has the following characteristics:</span></div><div style='font-family:inherit; font-size:16px; color:rgb(0, 0, 0);'><br /></div><div><table border='1' cellpadding='2' style='color:rgb(0, 0, 0); font-family:&quot;Helvetica Neue&quot;, Helvetica, Arial, sans-serif; font-size:14px; margin-bottom:1.5rem; width:326.031px; background-color:transparent; border-collapse:collapse; border-spacing:0px; border:1px solid rgb(204, 204, 204);'><tbody><tr style='border-bottom:1px solid rgb(204, 204, 204); box-sizing:border-box; height:21px;'><td style='border-left:1px solid rgb(204, 204, 204); border-right:1px solid rgb(204, 204, 204); padding:0px; box-sizing:border-box; height:21px; width:175px;'> X, Y, and Z linear unit</td><td style='border-left:1px solid rgb(204, 204, 204); border-right:1px solid rgb(204, 204, 204); padding:0px; text-align:center; box-sizing:border-box; height:21px; width:149.031px;'>Meter</td></tr><tr style='border-bottom:1px solid rgb(204, 204, 204); box-sizing:border-box; height:21px;'><td style='border-left:1px solid rgb(204, 204, 204); border-right:1px solid rgb(204, 204, 204); padding:0px; box-sizing:border-box; height:21px; width:175px;'> Z range</td><td style='border-left:1px solid rgb(204, 204, 204); border-right:1px solid rgb(204, 204, 204); padding:0px; text-align:center; box-sizing:border-box; height:21px; width:149.031px;'>-137.74 m to 410.50 m</td></tr><tr style='border-bottom:1px solid rgb(204, 204, 204); box-sizing:border-box; height:21px;'><td style='border-left:1px solid rgb(204, 204, 204); border-right:1px solid rgb(204, 204, 204); padding:0px; box-sizing:border-box; height:21px; width:175px;'> Number of Returns</td><td style='border-left:1px solid rgb(204, 204, 204); border-right:1px solid rgb(204, 204, 204); padding:0px; text-align:center; box-sizing:border-box; height:21px; width:149.031px;'>1 to 5</td></tr><tr style='border-bottom:1px solid rgb(204, 204, 204); box-sizing:border-box; height:21px;'><td style='border-left:1px solid rgb(204, 204, 204); border-right:1px solid rgb(204, 204, 204); padding:0px; box-sizing:border-box; height:21px; width:175px;'> Intensity</td><td style='border-left:1px solid rgb(204, 204, 204); border-right:1px solid rgb(204, 204, 204); padding:0px; text-align:center; box-sizing:border-box; height:21px; width:149.031px;'>16 to 65520</td></tr><tr style='border-bottom:1px solid rgb(204, 204, 204); box-sizing:border-box; height:21.5px;'><td style='border-left:1px solid rgb(204, 204, 204); border-right:1px solid rgb(204, 204, 204); padding:0px; box-sizing:border-box; height:21.5px; width:175px;'> Point spacing</td><td style='border-left:1px solid rgb(204, 204, 204); border-right:1px solid rgb(204, 204, 204); padding:0px; text-align:center; box-sizing:border-box; height:21.5px; width:149.031px;'>0.2 ± 0.1</td></tr><tr style='border-bottom:1px solid rgb(204, 204, 204); box-sizing:border-box; height:21px;'><td style='border-left:1px solid rgb(204, 204, 204); border-right:1px solid rgb(204, 204, 204); padding:0px; box-sizing:border-box; height:21px; width:175px;'> Scan angle</td><td style='border-left:1px solid rgb(204, 204, 204); border-right:1px solid rgb(204, 204, 204); padding:0px; text-align:center; box-sizing:border-box; height:21px; width:149.031px;'>-17 to +17</td></tr><tr style='border-bottom:1px solid rgb(204, 204, 204); box-sizing:border-box; height:21px;'><td style='border-left:1px solid rgb(204, 204, 204); border-right:1px solid rgb(204, 204, 204); padding:0px; box-sizing:border-box; height:21px; width:175px;'> Maximum points per block</td><td style='border-left:1px solid rgb(204, 204, 204); border-right:1px solid rgb(204, 204, 204); padding:0px; text-align:center; box-sizing:border-box; height:21px; width:149.031px;'>8192</td></tr><tr style='border-bottom:1px solid rgb(204, 204, 204); box-sizing:border-box; height:21px;'><td style='border-left:1px solid rgb(204, 204, 204); border-right:1px solid rgb(204, 204, 204); padding:0px; box-sizing:border-box; height:21px; width:175px;'> Block Size</td><td style='border-left:1px solid rgb(204, 204, 204); border-right:1px solid rgb(204, 204, 204); padding:0px; text-align:center; box-sizing:border-box; height:21px; width:149.031px;'>50 Meters<br /></td></tr><tr style='border-bottom:none; box-sizing:border-box; height:21px;'><td style='border-left:1px solid rgb(204, 204, 204); border-right:1px solid rgb(204, 204, 204); padding:0px; box-sizing:border-box; height:21px; width:175px;'> Class structure</td><td style='border-left:1px solid rgb(204, 204, 204); border-right:1px solid rgb(204, 204, 204); padding:0px; text-align:center; box-sizing:border-box; height:21px; width:149.031px;'>[0, 6]</td></tr></tbody></table><b><font size='4' style='font-family:inherit;'>Sample results<br /></font></b><font color='#000000' face='inherit'><span style='font-size:16px;'>Model to classify a dataset with 23pts/m density Wellington city dataset. The model's performance are directly proportional to the dataset point density and noise exlcuded point clouds.</span></font><br /><font color='#000000' style='color:rgb(0, 0, 0); font-family:inherit; font-size:15px;'>To learn how to use this model, see this </font><a href='https://storymaps.arcgis.com/stories/a541b6c1ba014e5db270a9048e546a2e' target='_blank' rel='nofollow ugc noopener noreferrer'>story</a><br /><img src='https://eaglegis.maps.arcgis.com/sharing/rest/content/items/1e89079513864f40a464d478faa74ac7/data' /><br /><font color='#000000' face='inherit'><span style='font-size:16px;'><img /></span></font></div></div></font></div></div></div></div></div>",
			"keyword": [
				"Deep Learning",
				"Eagle Technology",
				"New Zealand",
				"Point Cloud",
				"dlpk",
				"SQN",
				"eaglegis",
				"urban",
				"NZ"
			],
			"issued": "2023-09-17T20:36:54.000Z",
			"modified": "2023-09-22T20:35:50.000Z",
			"publisher": {
				"name": "Eagle Technology Group Ltd"
			},
			"contactPoint": {
				"@type": "vcard:Contact",
				"fn": "eaglegis",
				"hasEmail": "mailto:ts@eaglegis.co.nz"
			},
			"accessLevel": "public",
			"spatial": "",
			"license": "https://creativecommons.org/licenses/by/4.0",
			"distribution": [
				{
					"@type": "dcat:Distribution",
					"title": "ArcGIS Hub Dataset",
					"format": "Web Page",
					"mediaType": "text/html",
					"accessURL": "https://www.pacificgeoportal.com/content/eaglegis::building-point-classification-new-zealand"
				}
			],
			"theme": ""
		},
		{
			"@type": "dcat:Dataset",
			"identifier": "https://www.arcgis.com/home/item.html?id=631a0868cf31440d8af49fcbb937d9b5",
			"landingPage": "https://www.pacificgeoportal.com/maps/pacificcore::air-quality-in-suava",
			"title": "Air Quality in Suava",
			"description": "<div style='font-family:&quot;Avenir Next W01&quot;, &quot;Avenir Next W00&quot;, &quot;Avenir Next&quot;, Avenir, &quot;Helvetica Neue&quot;, sans-serif; font-size:16px;'>This layer is a subset of OpenAQ Recent Conditions in Air Quality Map. You can access the global coverage from <a href='https://www.arcgis.com/home/item.html?id=8dcf5d4e124f480fa8c529fbe25ba04e' target='_blank' rel='nofollow ugc noopener noreferrer'>here.</a> Every day activities such as driving, burning coal for electricity, wildfires, running factories, even cooking and cleaning, release particles into the air. Besides being an irritant, small particles of 10, 2.5, 1 micrometers (PM10, PM2.5, PM1) or less are a health hazard since they can get deep into the respiratory system and damage the delicate tissues.</div><div style='font-family:&quot;Avenir Next W01&quot;, &quot;Avenir Next W00&quot;, &quot;Avenir Next&quot;, Avenir, &quot;Helvetica Neue&quot;, sans-serif; font-size:16px;'><br /></div><span style='font-family:&quot;Avenir Next W01&quot;, &quot;Avenir Next W00&quot;, &quot;Avenir Next&quot;, Avenir, &quot;Helvetica Neue&quot;, sans-serif; font-size:16px;'>The exposure of populations to high levels of small particles increases the risk of respiratory and cardiovascular illnesses. The </span><a href='https://apps.who.int/iris/bitstream/handle/10665/69477/WHO_SDE_PHE_OEH_06.02_eng.pdf;jsessionid=899EE66D4431ABD26FE179B38FFB326D?sequence=1' style='color:rgb(0, 97, 155); text-decoration-line:none; font-family:&quot;Avenir Next W01&quot;, &quot;Avenir Next W00&quot;, &quot;Avenir Next&quot;, Avenir, &quot;Helvetica Neue&quot;, sans-serif; font-size:16px;' target='_blank' rel='nofollow ugc noopener noreferrer'>World Health Organization (WHO) guidelines</a><span style='font-family:&quot;Avenir Next W01&quot;, &quot;Avenir Next W00&quot;, &quot;Avenir Next&quot;, Avenir, &quot;Helvetica Neue&quot;, sans-serif; font-size:16px;'> provide long-term and short-term exposure limits to PM10 and PM2.5:</span><br /><div style='font-family:&quot;Avenir Next W01&quot;, &quot;Avenir Next W00&quot;, &quot;Avenir Next&quot;, Avenir, &quot;Helvetica Neue&quot;, sans-serif; font-size:16px;'><div style='font-family:inherit;'><ul><li>Long-term: PM10 20 µg/m³ annual mean and PM2.5 10 µg/m³</li><li>Short-term: PM10 50 µg/m³ 24-hour mean and PM2.5 25 µg/m³</li></ul><div style='font-family:inherit;'>Exposure to PM10 and PM2.5 above these limits may significantly impact human health.</div></div></div><div style='font-family:&quot;Avenir Next W01&quot;, &quot;Avenir Next W00&quot;, &quot;Avenir Next&quot;, Avenir, &quot;Helvetica Neue&quot;, sans-serif; font-size:16px;'><br /></div><div style='font-family:&quot;Avenir Next W01&quot;, &quot;Avenir Next W00&quot;, &quot;Avenir Next&quot;, Avenir, &quot;Helvetica Neue&quot;, sans-serif; font-size:16px;'>The <a href='https://www.arcgis.com/home/item.html?id=8dcf5d4e124f480fa8c529fbe25ba04e' style='color:rgb(0, 97, 155); text-decoration-line:none; font-family:inherit;' target='_blank' rel='nofollow ugc noopener noreferrer'>OpenAQ Recent Conditions in Air Quality</a> layers show the latest mass concentrations and particulate count for PM2.5, PM10, and PM1 of the stations in the OpenAQ data set with at least one value reported in the past 30 days.<br /></div><div style='font-family:&quot;Avenir Next W01&quot;, &quot;Avenir Next W00&quot;, &quot;Avenir Next&quot;, Avenir, &quot;Helvetica Neue&quot;, sans-serif; font-size:16px;'><br /></div><div style='font-family:&quot;Avenir Next W01&quot;, &quot;Avenir Next W00&quot;, &quot;Avenir Next&quot;, Avenir, &quot;Helvetica Neue&quot;, sans-serif; font-size:16px;'><span style='font-family:inherit; font-weight:bold;'>Source: </span>The source information is the <a href='https://openaq.org/' style='color:rgb(0, 97, 155); text-decoration-line:none; font-family:inherit;' target='_blank' rel='nofollow ugc noopener noreferrer'>OpenAQ community</a> which reports measured concentrations (µg/m³) and particle matter count (particles/cm³) on a global scale by aggregating station data from national networks of air quality.</div><div style='font-family:&quot;Avenir Next W01&quot;, &quot;Avenir Next W00&quot;, &quot;Avenir Next&quot;, Avenir, &quot;Helvetica Neue&quot;, sans-serif; font-size:16px;'><br /></div><div style='font-family:&quot;Avenir Next W01&quot;, &quot;Avenir Next W00&quot;, &quot;Avenir Next&quot;, Avenir, &quot;Helvetica Neue&quot;, sans-serif; font-size:16px;'><span style='font-family:inherit; font-weight:bold;'>Update Frequency: </span>It is updated every hour using the <a href='https://www.arcgis.com/home/group.html?id=8f3721913b474c87910c767e717bdc20' style='color:rgb(0, 97, 155); text-decoration-line:none; font-family:inherit;' target='_blank' rel='nofollow ugc noopener noreferrer'>Aggregated Live Feed (ALF)</a> methodology.</div><div style='font-family:&quot;Avenir Next W01&quot;, &quot;Avenir Next W00&quot;, &quot;Avenir Next&quot;, Avenir, &quot;Helvetica Neue&quot;, sans-serif; font-size:16px;'><br /></div><div style='font-family:&quot;Avenir Next W01&quot;, &quot;Avenir Next W00&quot;, &quot;Avenir Next&quot;, Avenir, &quot;Helvetica Neue&quot;, sans-serif; font-size:16px;'><span style='font-family:inherit; font-weight:bold;'>Area Covered: </span>Global</div><div style='font-family:&quot;Avenir Next W01&quot;, &quot;Avenir Next W00&quot;, &quot;Avenir Next&quot;, Avenir, &quot;Helvetica Neue&quot;, sans-serif; font-size:16px;'><br /></div><div style='font-family:&quot;Avenir Next W01&quot;, &quot;Avenir Next W00&quot;, &quot;Avenir Next&quot;, Avenir, &quot;Helvetica Neue&quot;, sans-serif; font-size:16px;'><div style='font-family:inherit;'><font color='#696969' size='5' style='font-family:inherit;'>Revisions</font></div><div style='font-family:inherit;'><ul><li><font size='3' style='font-family:inherit;'><span style='font-family:inherit; font-weight:bold;'>Jun 23, 2023</span>: Added new fields: Location ID, Station URL; Provider, and Instrument names. The live feed routine was updated to increase reliability and improve the overall update process.</font><font size='3' style='font-family:inherit;'><span style='font-family:inherit; font-weight:bold;'></span></font></li><li><font size='3' style='font-family:inherit;'><span style='font-family:inherit; font-weight:bold;'>Jul 21, 2022</span>: Added service to <a href='https://livingatlas.arcgis.com/livefeeds-status/' style='color:rgb(0, 97, 155); text-decoration-line:none; font-family:inherit;' target='_blank' rel='nofollow ugc noopener noreferrer'>Live Feed Status</a> Page for active monitoring!<br /><span style='font-family:inherit; font-weight:bold;'></span></font></li><li><font size='3' style='font-family:inherit;'><span style='font-family:inherit; font-weight:bold;'>Feb 8, 2022</span>: Update of live feed routine to use OpenAQ API v2:</font><ul><li><font size='3' style='font-family:inherit;'>Addition of PM10 and PM1 layers.</font></li><li><font size='3' style='font-family:inherit;'>Values of particle matter count (particles/cm³) to all layers.</font></li><li><font size='3' style='font-family:inherit;'>Update of field labels.</font></li><li><font size='3' style='font-family:inherit;'>Removal of <span style='font-family:inherit; font-style:italic;'>SourceName </span>field.<br /></font></li></ul><font size='3' style='font-family:inherit;'><span style='font-family:inherit; font-weight:bold;'></span></font></li><li><font size='3' style='font-family:inherit;'><span style='font-family:inherit; font-weight:bold;'>Feb 5, 2020</span>: Official release of Feature Service offering.</font></li></ul><div style='font-family:inherit;'><font size='3' style='font-family:inherit;'>This layer is provided for informational purposes and is not monitored 24/7 for accuracy and currency.</font><div style='font-family:inherit;'><font size='3' style='font-family:inherit;'><br /></font></div><font size='3' style='font-family:inherit;'>If you would like to be alerted to potential issues or simply see when this Service will update next, please visit our <a href='https://livingatlas.arcgis.com/livefeeds-status/' style='color:rgb(0, 97, 155); text-decoration-line:none; font-family:inherit;' target='_blank' rel='nofollow ugc noopener noreferrer'>Live Feed Status</a> Page!</font></div></div></div>",
			"keyword": [
				"Air Quality",
				"PM2.5",
				"Global",
				"livefeeds2",
				"earth observations",
				"environment",
				"esri_environment",
				"OpenAQ",
				"Open AQ",
				"PM10",
				"PM1"
			],
			"issued": "2023-09-22T18:07:44.000Z",
			"modified": "2023-09-22T18:23:36.000Z",
			"publisher": {
				"name": "Pacific GeoPortal - Core Organization"
			},
			"contactPoint": {
				"@type": "vcard:Contact",
				"fn": "dkaragulle_pacificcore",
				"hasEmail": "mailto:pacific_geoportal@esri.com"
			},
			"accessLevel": "public",
			"spatial": "175.9133,-20.2848,180.0000,-15.5457",
			"license": "<img src='https://downloads.esri.com/blogs/arcgisonline/esrilogo_new.png' style='max-width:100%; height:auto; font-family:&quot;Avenir Next W01&quot;, &quot;Avenir Next W00&quot;, &quot;Avenir Next&quot;, Avenir, &quot;Helvetica Neue&quot;, sans-serif; font-size:16px;' /><span style='font-family:&quot;Avenir Next W01&quot;, &quot;Avenir Next W00&quot;, &quot;Avenir Next&quot;, Avenir, &quot;Helvetica Neue&quot;, sans-serif; font-size:16px;'> This work is licensed under the Esri Master License Agreement.</span><br /><div style='font-family:&quot;Avenir Next W01&quot;, &quot;Avenir Next W00&quot;, &quot;Avenir Next&quot;, Avenir, &quot;Helvetica Neue&quot;, sans-serif; font-size:16px;'><a href='https://goto.arcgis.com/termsofuse/viewsummary' style='color:rgb(0, 97, 155); text-decoration-line:none;' target='_blank' rel='nofollow ugc noopener noreferrer'><b>View Summary</b></a> | <a href='https://goto.arcgis.com/termsofuse/viewtermsofuse' style='color:rgb(0, 97, 155); text-decoration-line:none;' target='_blank' rel='nofollow ugc noopener noreferrer'><b>View Terms of Use</b></a></div>",
			"distribution": [
				{
					"@type": "dcat:Distribution",
					"title": "ArcGIS Hub Dataset",
					"format": "Web Page",
					"mediaType": "text/html",
					"accessURL": "https://www.pacificgeoportal.com/maps/pacificcore::air-quality-in-suava"
				}
			],
			"theme": [
				"geospatial"
			]
		},
		{
			"@type": "dcat:Dataset",
			"identifier": "https://www.arcgis.com/home/item.html?id=3bd7575c609f47719a1e3eb338a604ca",
			"landingPage": "https://www.pacificgeoportal.com/apps/pacificcore::coral-reefs-at-risk-of-bleaching-1",
			"title": "Coral Reefs at Risk of Bleaching",
			"description": "<p></p>",
			"keyword": [
				""
			],
			"issued": "2023-09-22T16:51:50.000Z",
			"modified": "2023-09-22T16:52:04.000Z",
			"publisher": {
				"name": "Pacific GeoPortal - Core Organization"
			},
			"contactPoint": {
				"@type": "vcard:Contact",
				"fn": "dkaragulle_pacificcore",
				"hasEmail": "mailto:pacific_geoportal@esri.com"
			},
			"accessLevel": "public",
			"spatial": "",
			"license": "",
			"distribution": [
				{
					"@type": "dcat:Distribution",
					"title": "ArcGIS Hub Dataset",
					"format": "Web Page",
					"mediaType": "text/html",
					"accessURL": "https://www.pacificgeoportal.com/apps/pacificcore::coral-reefs-at-risk-of-bleaching-1"
				}
			],
			"theme": ""
		},
		{
			"@type": "dcat:Dataset",
			"identifier": "https://www.arcgis.com/home/item.html?id=d400f38fd2f147cb9546c59b75b162db",
			"landingPage": "https://www.pacificgeoportal.com/maps/pacificcore::pacific-region-noaa-coral-reef-watch-crw-virtual-stations-for-dashboard",
			"title": "Pacific Region NOAA Coral Reef Watch (CRW) Virtual Stations - for Dashboard",
			"description": "",
			"keyword": [
				"Coral",
				"Reef",
				"Bleaching",
				"NOAA",
				"heat stress",
				"Ocean",
				"oceans",
				"esri_o",
				"esri_environment",
				"environment"
			],
			"issued": "2023-09-22T08:13:20.000Z",
			"modified": "2023-09-22T08:43:33.000Z",
			"publisher": {
				"name": "Pacific GeoPortal - Core Organization"
			},
			"contactPoint": {
				"@type": "vcard:Contact",
				"fn": "klevy_pacificcore",
				"hasEmail": "mailto:pacific_geoportal@esri.com"
			},
			"accessLevel": "public",
			"spatial": "-180.0000,-29.1188,-138.9316,6.3969",
			"license": "",
			"distribution": [
				{
					"@type": "dcat:Distribution",
					"title": "ArcGIS Hub Dataset",
					"format": "Web Page",
					"mediaType": "text/html",
					"accessURL": "https://www.pacificgeoportal.com/maps/pacificcore::pacific-region-noaa-coral-reef-watch-crw-virtual-stations-for-dashboard"
				}
			],
			"theme": [
				"geospatial"
			]
		},
		{
			"@type": "dcat:Dataset",
			"identifier": "https://www.arcgis.com/home/item.html?id=c987b43c36fd46079de02385e55cc569",
			"landingPage": "https://www.pacificgeoportal.com/maps/pacificcore::pacific-region-worldpop-population-density-2000-2020-1km",
			"title": "Pacific Region WorldPop Population Density 2000-2020 1km",
			"description": "<p style='margin-top:0px; margin-bottom:1.5rem; font-family:&quot;Avenir Next W01&quot;, &quot;Avenir Next W00&quot;, &quot;Avenir Next&quot;, Avenir, &quot;Helvetica Neue&quot;, sans-serif; font-size:16px;'>This layer contains <a href='https://www.worldpop.org/' style='color:rgb(0, 97, 155); text-decoration-line:none; font-family:inherit;' target='_blank' rel='nofollow ugc noopener noreferrer'>WorldPop's</a> 1-km resolution annual estimates of population density from the year 2000 to 2020. This layer is a subset of Global WorldPop Population Density 2000-2020 1km Map. You can access the global coverage from: <a href='https://www.arcgis.com/home/item.html?id=38b7672a1977426caa6cf4c62e37b777' style='font-family:&quot;Avenir Next&quot;, Avenir, &quot;Helvetica Neue&quot;, Helvetica, Arial, sans-serif; font-size:15px;' target='_blank' rel='nofollow ugc noopener noreferrer'>WorldPop Population Density 2000-2020 1km</a>. <font style='font-family:inherit;'>The estimates in this layer use WorldPop's </font><a href='https://www.worldpop.org/methods/top_down_constrained_vs_unconstrained' style='font-family:inherit; color:rgb(0, 97, 155); text-decoration-line:none;' target='_blank' rel='nofollow ugc noopener noreferrer'>Top-down unconstrained method</a><font style='font-family:inherit;'> which estimates the total population for each cell with a Random Forest-based model and converted these values to population density by dividing the number of people in each pixel by the pixel surface area. This diagram visually describes this model that uses known populated locations to analyze imagery to find similarly populated locations. </font></p><p style='margin-top:0px; margin-bottom:1.5rem; font-family:&quot;Avenir Next W01&quot;, &quot;Avenir Next W00&quot;, &quot;Avenir Next&quot;, Avenir, &quot;Helvetica Neue&quot;, sans-serif; font-size:16px; text-align:center;'><img alt='top down unconstrained' src='https://data.worldpop.org/tmp/top_down_unconstrained_v1.png' style='max-width:100%; height:auto;' /><br /></p><p style='margin-top:0px; margin-bottom:1.5rem; font-family:&quot;Avenir Next W01&quot;, &quot;Avenir Next W00&quot;, &quot;Avenir Next&quot;, Avenir, &quot;Helvetica Neue&quot;, sans-serif; font-size:16px;'>The DOI for the original WorldPop.org population density data is <a href='https://www.worldpop.org/doi/10.5258/SOTON/WP00674' style='color:rgb(0, 97, 155); text-decoration-line:none; font-family:inherit;' target='_blank' rel='nofollow ugc noopener noreferrer'>10.5258/SOTON/WP00674</a>.<br /></p><p style='margin-top:0px; margin-bottom:1.5rem; font-family:&quot;Avenir Next W01&quot;, &quot;Avenir Next W00&quot;, &quot;Avenir Next&quot;, Avenir, &quot;Helvetica Neue&quot;, sans-serif; font-size:16px;'><b>Recommended Citation:</b> WorldPop (www.worldpop.org - School of Geography and Environmental Science, University of Southampton; Department of Geography and Geosciences, University of Louisville; Departement de Geographie, Universite de Namur) and Center for International Earth Science Information Network (CIESIN), Columbia University (2018). Global High Resolution Population Denominators Project - Funded by The Bill and Melinda Gates Foundation. Accessed from https://worldpop.arcgis.com/arcgis/rest/services/WorldPop_Population_Density_1km/ImageServer, which was acquired from <a href='https://www.worldpop.org/doi/10.5258/SOTON/WP00674' style='color:rgb(0, 97, 155); text-decoration-line:none; font-family:inherit;' target='_blank' rel='nofollow ugc noopener noreferrer'>https://www.worldpop.org/doi/10.5258/SOTON/WP00674</a> on 15 Sep, 2021.</p>",
			"keyword": [
				""
			],
			"issued": "2023-09-20T18:29:47.000Z",
			"modified": "2023-09-20T18:33:49.000Z",
			"publisher": {
				"name": "Pacific GeoPortal - Core Organization"
			},
			"contactPoint": {
				"@type": "vcard:Contact",
				"fn": "dkaragulle_pacificcore",
				"hasEmail": "mailto:pacific_geoportal@esri.com"
			},
			"accessLevel": "public",
			"spatial": "141.9874,-17.8172,165.1466,1.8174",
			"license": "https://creativecommons.org/licenses/by/4.0",
			"distribution": [
				{
					"@type": "dcat:Distribution",
					"title": "ArcGIS Hub Dataset",
					"format": "Web Page",
					"mediaType": "text/html",
					"accessURL": "https://www.pacificgeoportal.com/maps/pacificcore::pacific-region-worldpop-population-density-2000-2020-1km"
				}
			],
			"theme": [
				"geospatial"
			]
		},
		{
			"@type": "dcat:Dataset",
			"identifier": "https://www.arcgis.com/home/item.html?id=c3b23134659b4c4bad141fe3db85b8ab",
			"landingPage": "https://www.pacificgeoportal.com/maps/pacificcore::pacific-region-countries-1",
			"title": "Pacific Region Countries",
			"description": "<span style='font-family:&quot;Avenir Next W01&quot;, &quot;Avenir Next W00&quot;, &quot;Avenir Next&quot;, Avenir, &quot;Helvetica Neue&quot;, sans-serif; font-size:16px;'>Pacific Countries represents detailed boundaries for the countries of the pacific region as of December 2021.</span><br /><br /><span style='font-family:&quot;Avenir Next W01&quot;, &quot;Avenir Next W00&quot;, &quot;Avenir Next&quot;, Avenir, &quot;Helvetica Neue&quot;, sans-serif; font-size:16px;'>Included are attribute fields for names and country code, along with continent, and display fields.</span><div style='font-family:&quot;Avenir Next W01&quot;, &quot;Avenir Next W00&quot;, &quot;Avenir Next&quot;, Avenir, &quot;Helvetica Neue&quot;, sans-serif; font-size:16px;'><br /></div><div style='font-family:&quot;Avenir Next W01&quot;, &quot;Avenir Next W00&quot;, &quot;Avenir Next&quot;, Avenir, &quot;Helvetica Neue&quot;, sans-serif; font-size:16px;'>This data is sourced from <a href='https://www.garmin.com/en-US/' style='color:rgb(0, 97, 155); text-decoration-line:none;' target='_blank' rel='nofollow ugc noopener noreferrer'>Garmin International, Inc</a> and updated annually.<br /></div><div style='font-family:&quot;Avenir Next W01&quot;, &quot;Avenir Next W00&quot;, &quot;Avenir Next&quot;, Avenir, &quot;Helvetica Neue&quot;, sans-serif; font-size:16px;'><br /></div><div style='font-family:&quot;Avenir Next W01&quot;, &quot;Avenir Next W00&quot;, &quot;Avenir Next&quot;, Avenir, &quot;Helvetica Neue&quot;, sans-serif; font-size:16px;'>Its the subset of the <a href='https://www.arcgis.com/home/item.html?id=ac80670eb213440ea5899bbf92a04998' style='color:rgb(0, 97, 155); text-decoration-line:none; font-family:inherit;' target='_blank' rel='nofollow ugc noopener noreferrer'>World Countries</a> from Living Atlas of the World. </div><div style='font-family:&quot;Avenir Next W01&quot;, &quot;Avenir Next W00&quot;, &quot;Avenir Next&quot;, Avenir, &quot;Helvetica Neue&quot;, sans-serif; font-size:16px;'><br /></div><div style='font-family:&quot;Avenir Next W01&quot;, &quot;Avenir Next W00&quot;, &quot;Avenir Next&quot;, Avenir, &quot;Helvetica Neue&quot;, sans-serif; font-size:16px;'>You can access the feature layer that is used to build this web mao from <a href='https://www.arcgis.com/home/item.html?id=b12c2ad5dbb04bcc812ba6c6e2a1eb2f' target='_blank' rel='nofollow ugc noopener noreferrer'>here.</a> </div>",
			"keyword": [
				"Pacific Region Countries"
			],
			"issued": "2023-09-15T21:31:20.000Z",
			"modified": "2023-09-20T02:58:36.000Z",
			"publisher": {
				"name": "Pacific GeoPortal - Core Organization"
			},
			"contactPoint": {
				"@type": "vcard:Contact",
				"fn": "dkaragulle_pacificcore",
				"hasEmail": "mailto:pacific_geoportal@esri.com"
			},
			"accessLevel": "public",
			"spatial": "75.5854,-62.2588,180.0000,61.8654",
			"license": "<img src='https://downloads.esri.com/blogs/arcgisonline/esrilogo_new.png' style='max-width:100%; height:auto; font-family:&quot;Avenir Next W01&quot;, &quot;Avenir Next W00&quot;, &quot;Avenir Next&quot;, Avenir, &quot;Helvetica Neue&quot;, sans-serif; font-size:16px;' /><span style='font-family:&quot;Avenir Next W01&quot;, &quot;Avenir Next W00&quot;, &quot;Avenir Next&quot;, Avenir, &quot;Helvetica Neue&quot;, sans-serif; font-size:16px;'> This work is licensed under the Esri Master License Agreement.</span><br /><div style='font-family:&quot;Avenir Next W01&quot;, &quot;Avenir Next W00&quot;, &quot;Avenir Next&quot;, Avenir, &quot;Helvetica Neue&quot;, sans-serif; font-size:16px;'><a href='https://goto.arcgis.com/termsofuse/viewsummary' style='color:rgb(0, 97, 155); text-decoration-line:none;' target='_blank' rel='nofollow ugc noopener noreferrer'><b>View Summary</b></a> | <b><a href='https://goto.arcgis.com/termsofuse/viewtermsofuse' style='color:rgb(0, 97, 155); text-decoration-line:none;' target='_blank' rel='nofollow ugc noopener noreferrer'>View Terms of Use</a></b></div>",
			"distribution": [
				{
					"@type": "dcat:Distribution",
					"title": "ArcGIS Hub Dataset",
					"format": "Web Page",
					"mediaType": "text/html",
					"accessURL": "https://www.pacificgeoportal.com/maps/pacificcore::pacific-region-countries-1"
				}
			],
			"theme": [
				"geospatial"
			]
		},
		{
			"@type": "dcat:Dataset",
			"identifier": "https://www.arcgis.com/home/item.html?id=b12c2ad5dbb04bcc812ba6c6e2a1eb2f&sublayer=0",
			"landingPage": "https://www.pacificgeoportal.com/datasets/pacificcore::pacific-region-countries",
			"title": "Pacific Region Countries",
			"description": "<span style='font-family:&quot;Avenir Next W01&quot;, &quot;Avenir Next W00&quot;, &quot;Avenir Next&quot;, Avenir, &quot;Helvetica Neue&quot;, sans-serif; font-size:16px;'>Pacific Countries represents detailed boundaries for the countries of the pacific region as of December 2021.</span><br /><br /><span style='font-family:&quot;Avenir Next W01&quot;, &quot;Avenir Next W00&quot;, &quot;Avenir Next&quot;, Avenir, &quot;Helvetica Neue&quot;, sans-serif; font-size:16px;'>Included are attribute fields for names and country code, along with continent, and display fields.</span><div><span style='font-family:&quot;Avenir Next W01&quot;, &quot;Avenir Next W00&quot;, &quot;Avenir Next&quot;, Avenir, &quot;Helvetica Neue&quot;, sans-serif; font-size:16px;'><br /></span></div><div><span style='font-family:&quot;Avenir Next W01&quot;, &quot;Avenir Next W00&quot;, &quot;Avenir Next&quot;, Avenir, &quot;Helvetica Neue&quot;, sans-serif; font-size:16px;'>This data is sourced from </span><a href='https://www.garmin.com/en-US/' style='color:rgb(0, 97, 155); text-decoration-line:none; font-family:&quot;Avenir Next W01&quot;, &quot;Avenir Next W00&quot;, &quot;Avenir Next&quot;, Avenir, &quot;Helvetica Neue&quot;, sans-serif; font-size:16px;' target='_blank' rel='nofollow ugc noopener noreferrer'>Garmin International, Inc</a><span style='font-family:&quot;Avenir Next W01&quot;, &quot;Avenir Next W00&quot;, &quot;Avenir Next&quot;, Avenir, &quot;Helvetica Neue&quot;, sans-serif; font-size:16px;'> and updated annually.</span><span style='font-family:&quot;Avenir Next W01&quot;, &quot;Avenir Next W00&quot;, &quot;Avenir Next&quot;, Avenir, &quot;Helvetica Neue&quot;, sans-serif; font-size:16px;'><br /></span></div><div><span style='font-family:&quot;Avenir Next W01&quot;, &quot;Avenir Next W00&quot;, &quot;Avenir Next&quot;, Avenir, &quot;Helvetica Neue&quot;, sans-serif; font-size:16px;'><br /></span></div><div><span style='font-family:&quot;Avenir Next W01&quot;, &quot;Avenir Next W00&quot;, &quot;Avenir Next&quot;, Avenir, &quot;Helvetica Neue&quot;, sans-serif; font-size:16px;'>Its the subset of the </span><a href='https://www.arcgis.com/home/item.html?id=ac80670eb213440ea5899bbf92a04998' target='_blank' rel='nofollow ugc noopener noreferrer'>World Countries</a> from Living Atlas of the World. </div>",
			"keyword": [
				"layer",
				"polygon",
				"countries",
				"ISO codes",
				"names",
				"international boundaries",
				"borders",
				"coastlines",
				"boundaries",
				"society",
				"World",
				"2013",
				"2010",
				"2019",
				"2021"
			],
			"issued": "2023-09-15T21:07:54.000Z",
			"modified": "2026-06-08T07:10:31.208Z",
			"publisher": {
				"name": "Pacific GeoPortal - Core Organization"
			},
			"contactPoint": {
				"@type": "vcard:Contact",
				"fn": "dkaragulle_pacificcore",
				"hasEmail": "mailto:pacific_geoportal@esri.com"
			},
			"accessLevel": "public",
			"spatial": "-180.0000,-89.0000,180.0000,83.6655",
			"license": "<img src='https://downloads.esri.com/blogs/arcgisonline/esrilogo_new.png' style='max-width:100%; height:auto; font-family:&quot;Avenir Next W01&quot;, &quot;Avenir Next W00&quot;, &quot;Avenir Next&quot;, Avenir, &quot;Helvetica Neue&quot;, sans-serif; font-size:16px;' /><span style='font-family:&quot;Avenir Next W01&quot;, &quot;Avenir Next W00&quot;, &quot;Avenir Next&quot;, Avenir, &quot;Helvetica Neue&quot;, sans-serif; font-size:16px;'> This work is licensed under the Esri Master License Agreement.</span><br /><div style='font-family:&quot;Avenir Next W01&quot;, &quot;Avenir Next W00&quot;, &quot;Avenir Next&quot;, Avenir, &quot;Helvetica Neue&quot;, sans-serif; font-size:16px;'><a href='https://goto.arcgis.com/termsofuse/viewsummary' style='color:rgb(0, 97, 155); text-decoration-line:none;' target='_blank' rel='nofollow ugc noopener noreferrer'><b>View Summary</b></a> | <b><a href='https://goto.arcgis.com/termsofuse/viewtermsofuse' style='color:rgb(0, 97, 155); text-decoration-line:none;' target='_blank' rel='nofollow ugc noopener noreferrer'>View Terms of Use</a></b></div>",
			"distribution": [
				{
					"@type": "dcat:Distribution",
					"title": "ArcGIS Hub Dataset",
					"format": "Web Page",
					"mediaType": "text/html",
					"accessURL": "https://www.pacificgeoportal.com/datasets/pacificcore::pacific-region-countries"
				},
				{
					"@type": "dcat:Distribution",
					"title": "ArcGIS GeoService",
					"format": "ArcGIS GeoServices REST API",
					"mediaType": "application/json",
					"accessURL": "https://services.arcgis.com/P3ePLMYs2RVChkJx/arcgis/rest/services/World_Countries/FeatureServer/0"
				},
				{
					"@type": "dcat:Distribution",
					"title": "CSV",
					"format": "CSV",
					"mediaType": "text/csv",
					"accessURL": "https://www.pacificgeoportal.com/api/download/v1/items/b12c2ad5dbb04bcc812ba6c6e2a1eb2f/csv?layers=0"
				},
				{
					"@type": "dcat:Distribution",
					"title": "Shapefile",
					"format": "ZIP",
					"mediaType": "application/zip",
					"accessURL": "https://www.pacificgeoportal.com/api/download/v1/items/b12c2ad5dbb04bcc812ba6c6e2a1eb2f/shapefile?layers=0"
				},
				{
					"@type": "dcat:Distribution",
					"title": "GeoJSON",
					"format": "GeoJSON",
					"mediaType": "application/vnd.geo+json",
					"accessURL": "https://www.pacificgeoportal.com/api/download/v1/items/b12c2ad5dbb04bcc812ba6c6e2a1eb2f/geojson?layers=0"
				},
				{
					"@type": "dcat:Distribution",
					"title": "KML",
					"format": "KML",
					"mediaType": "application/vnd.google-earth.kml+xml",
					"accessURL": "https://www.pacificgeoportal.com/api/download/v1/items/b12c2ad5dbb04bcc812ba6c6e2a1eb2f/kml?layers=0"
				},
				{
					"@type": "dcat:Distribution",
					"title": "File Geodatabase",
					"format": "ZIP",
					"mediaType": "application/zip",
					"accessURL": "https://www.pacificgeoportal.com/api/download/v1/items/b12c2ad5dbb04bcc812ba6c6e2a1eb2f/filegdb?layers=0"
				},
				{
					"@type": "dcat:Distribution",
					"title": "Feature Collection",
					"format": "TXT",
					"mediaType": "text/plain",
					"accessURL": "https://www.pacificgeoportal.com/api/download/v1/items/b12c2ad5dbb04bcc812ba6c6e2a1eb2f/featureCollection?layers=0"
				},
				{
					"@type": "dcat:Distribution",
					"title": "Excel",
					"format": "XLSX",
					"mediaType": "application/vnd.ms-excel",
					"accessURL": "https://www.pacificgeoportal.com/api/download/v1/items/b12c2ad5dbb04bcc812ba6c6e2a1eb2f/excel?layers=0"
				},
				{
					"@type": "dcat:Distribution",
					"title": "GeoPackage",
					"format": "GPKG",
					"mediaType": "application/geopackage+sqlite3",
					"accessURL": "https://www.pacificgeoportal.com/api/download/v1/items/b12c2ad5dbb04bcc812ba6c6e2a1eb2f/geoPackage?layers=0"
				},
				{
					"@type": "dcat:Distribution",
					"title": "SQLite Geodatabase",
					"format": "GDB",
					"mediaType": "application/geopackage+sqlite3",
					"accessURL": "https://www.pacificgeoportal.com/api/download/v1/items/b12c2ad5dbb04bcc812ba6c6e2a1eb2f/sqlite?layers=0"
				}
			],
			"theme": [
				"geospatial"
			]
		},
		{
			"@type": "dcat:Dataset",
			"identifier": "https://www.arcgis.com/home/item.html?id=239db2b13a58485f983488a0e0513752",
			"landingPage": "https://www.pacificgeoportal.com/apps/pacificcore::pacific-region-current-weather-conditions",
			"title": "Pacific Region: Current Weather Conditions",
			"description": "<p>This current weather and wind map is updated from data provided by the National Oceanic and Atmospheric Administration (NOAA). Although the data includes approximately 11 weather variables for each location, the symbols on the map represent wind speed and direction. Click on the arrows for additional information.</p>",
			"keyword": [
				""
			],
			"issued": "2023-09-19T19:43:53.000Z",
			"modified": "2023-09-19T21:09:12.000Z",
			"publisher": {
				"name": "Pacific GeoPortal - Core Organization"
			},
			"contactPoint": {
				"@type": "vcard:Contact",
				"fn": "dkaragulle_pacificcore",
				"hasEmail": "mailto:pacific_geoportal@esri.com"
			},
			"accessLevel": "public",
			"spatial": "",
			"license": "",
			"distribution": [
				{
					"@type": "dcat:Distribution",
					"title": "ArcGIS Hub Dataset",
					"format": "Web Page",
					"mediaType": "text/html",
					"accessURL": "https://www.pacificgeoportal.com/apps/pacificcore::pacific-region-current-weather-conditions"
				},
				{
					"@type": "dcat:Distribution",
					"title": "ArcGIS GeoService",
					"format": "ArcGIS GeoServices REST API",
					"mediaType": "application/json",
					"accessURL": "https://storymaps.arcgis.com/stories/239db2b13a58485f983488a0e0513752"
				}
			],
			"theme": ""
		},
		{
			"@type": "dcat:Dataset",
			"identifier": "https://www.arcgis.com/home/item.html?id=acb991f0b0c547d0835d50f251eb3298",
			"landingPage": "https://www.pacificgeoportal.com/apps/pacificcore::pacific-region-recent-earthquakes",
			"title": "Pacific Region: Recent Earthquakes",
			"description": "<p>This map shows earthquakes by magnitude, and also provides earthquake impact details. Impact is measured relative to population and takes into account economic and fatality loss. Data from the <strong>U.S. Geological Survey</strong> is used to update this map every five minutes. Significant earthquakes remain on the map for 30 days.</p><p>Zoom into larger earthquakes to see representation of shake intensity zones from light to extreme.</p>",
			"keyword": [
				""
			],
			"issued": "2023-09-19T18:53:40.000Z",
			"modified": "2023-09-19T19:15:45.000Z",
			"publisher": {
				"name": "Pacific GeoPortal - Core Organization"
			},
			"contactPoint": {
				"@type": "vcard:Contact",
				"fn": "dkaragulle_pacificcore",
				"hasEmail": "mailto:pacific_geoportal@esri.com"
			},
			"accessLevel": "public",
			"spatial": "",
			"license": "",
			"distribution": [
				{
					"@type": "dcat:Distribution",
					"title": "ArcGIS Hub Dataset",
					"format": "Web Page",
					"mediaType": "text/html",
					"accessURL": "https://www.pacificgeoportal.com/apps/pacificcore::pacific-region-recent-earthquakes"
				},
				{
					"@type": "dcat:Distribution",
					"title": "ArcGIS GeoService",
					"format": "ArcGIS GeoServices REST API",
					"mediaType": "application/json",
					"accessURL": "https://storymaps.arcgis.com/stories/acb991f0b0c547d0835d50f251eb3298"
				}
			],
			"theme": ""
		},
		{
			"@type": "dcat:Dataset",
			"identifier": "https://www.arcgis.com/home/item.html?id=0e2e3d0d0ef843e690169cac2f5620f9",
			"landingPage": "https://www.pacificgeoportal.com/content/eaglegis::tree-point-classification-new-zealand",
			"title": "Tree Point Classification - New Zealand",
			"description": "<div><font color='#000000' face='Avenir Next W01, Avenir Next W00, Avenir Next, Avenir, Helvetica Neue, sans-serif'><span style='font-size:3;'>This New Zealand Point Cloud Classification Deep Learning Package will classify point clouds into tree and background classes. This model is optimized to work with New Zealand aerial LiDAR data.</span></font></div><div><font color='#000000' face='Avenir Next W01, Avenir Next W00, Avenir Next, Avenir, Helvetica Neue, sans-serif'><span style='font-size:3;'><br /></span></font></div><div><font color='#000000' face='Avenir Next W01, Avenir Next W00, Avenir Next, Avenir, Helvetica Neue, sans-serif'><span style='font-size:3;'>The classification of point cloud datasets to identify Trees is useful in applications such as high-quality 3D basemap creation, urban planning, forestry workflows, and planning climate change response.</span></font></div><div><font color='#000000' face='Avenir Next W01, Avenir Next W00, Avenir Next, Avenir, Helvetica Neue, sans-serif'><span style='font-size:3;'><br /></span></font></div><div><font color='#000000' face='Avenir Next W01, Avenir Next W00, Avenir Next, Avenir, Helvetica Neue, sans-serif'><span style='font-size:3;'>Trees could have a complex irregular geometrical structure that is hard to capture using traditional means. Deep learning models are highly capable of learning these complex structures and giving superior results.</span></font><div style='max-width:100%; display:inherit;'><div><font color='#000000'><div><font style='text-align:justify;'><div style='font-family:inherit; text-align:left;'><font size='3' style='font-family:inherit;'><br /></font></div><div style='font-family:inherit; text-align:left;'><font size='3' style='font-family:inherit;'>This model is designed to extract Tree in both urban and rural area in New Zealand.</font></div><div style='text-align:left;'><font size='3'><br /><font face='inherit'>The Training/Testing/Validation dataset are taken within New Zealand resulting of a high </font><font face='Avenir Next W01, Avenir Next W00, Avenir Next, Avenir, Helvetica Neue, sans-serif'>reliability</font><font face='inherit'> to recognize the pattern of NZ common building architecture.</font></font><span style='font-family:inherit; font-size:medium;'><br /></span></div></font></div></font></div><div style='font-family:&quot;Avenir Next W01&quot;, &quot;Avenir Next W00&quot;, &quot;Avenir Next&quot;, Avenir, &quot;Helvetica Neue&quot;, sans-serif; font-size:16px;'><font color='#000000' size='3' style='font-family:inherit;'><span style='font-family:inherit; font-size:medium; text-align:justify;'><br /></span></font></div><div style='font-family:&quot;Avenir Next W01&quot;, &quot;Avenir Next W00&quot;, &quot;Avenir Next&quot;, Avenir, &quot;Helvetica Neue&quot;, sans-serif; font-size:16px;'><font color='#000000' style='font-family:inherit;'><font style='font-family:&quot;Avenir Next&quot;, Avenir, &quot;Helvetica Neue&quot;, Helvetica, Arial, sans-serif; font-size:15px;'><font size='4' style='font-family:inherit;'><b>Licensing requirements</b><b><br /></b></font><span style='font-family:inherit; font-size:12pt;'>ArcGIS Desktop - </span><span style='font-family:inherit; font-size:16px;'>ArcGIS 3D Analyst </span></font><span style='font-family:&quot;Avenir Next&quot;, Avenir, &quot;Helvetica Neue&quot;, Helvetica, Arial, sans-serif; font-size:12pt;'>extension for ArcGIS Pro</span><span style='font-family:inherit; font-size:medium; text-align:justify;'><br /></span></font></div><div style='font-family:inherit; font-size:16px;'><div><span style='font-family:inherit; font-size:medium;'><font color='#000000' style='font-family:inherit;'><br /></font></span></div><div style='font-family:inherit;'><font color='#000000' style='font-family:inherit;'><b>Using the model</b><br /></font><div style='font-family:inherit;'><font style='font-family:inherit; color:rgb(0, 0, 0); text-align:justify;'>The model can be used in</font><font style='font-family:inherit; color:rgb(0, 0, 0); text-align:justify;'><span style='font-family:inherit;'> ArcGIS Pro's </span></font><a href='https://pro.arcgis.com/en/pro-app/latest/tool-reference/3d-analyst/classify-point-cloud-using-trained-model.htm' style='color:rgb(0, 121, 193); text-decoration-line:none; text-align:justify;' target='_blank' rel='nofollow ugc noopener noreferrer'>Classify Point Cloud Using Trained Model</a><font style='font-family:inherit; color:rgb(0, 0, 0); text-align:justify;'> tool. </font><font color='#000000' face='Avenir Next W01, Avenir Next W00, Avenir Next, Avenir, Helvetica Neue, sans-serif' style='background-color:transparent; text-align:justify;'>Before using this model,</font><font color='#000000' style='background-color:transparent;'><font style='font-family:inherit; text-align:justify;'> ensure that the supported deep learning frameworks </font><span style='font-family:inherit; text-align:justify; font-size:17px;'>libraries </span><font style='font-family:inherit; text-align:justify;'>are installed.</font><span style='font-family:inherit; text-align:justify;'> </span><span style='font-family:inherit; font-size:medium; text-align:justify;'>For more details, check </span><span style='font-family:inherit; font-size:medium; text-align:justify;'><a href='https://github.com/esri/deep-learning-frameworks' style='color:rgb(0, 121, 193); text-decoration-line:none; font-family:inherit;' target='_blank' rel='nofollow ugc noopener noreferrer'>Deep Learning Libraries Installer for ArcGIS</a></span><span style='font-family:inherit; font-size:medium; text-align:justify;'>.</span></font></div></div><div style='font-family:inherit; text-align:justify;'><div style='font-family:inherit;'><font style='font-family:inherit;'><font style='font-family:inherit; text-align:start;'><font color='#000000' style='font-family:inherit;'><br /></font></font></font></div><div style='font-family:inherit; text-align:left;'><font style='font-family:inherit;'><font style='font-family:inherit;'><font color='#000000' style='font-family:inherit;'><span style='font-family:inherit;'><span style='font-family:inherit; text-align:justify;'>Note: Deep learning is computationally intensive, and a powerful GPU is recommended to process large datasets.</span></span></font></font></font></div><div style='font-family:inherit;'><font style='font-family:inherit;'><font color='#000000' style='font-family:inherit; text-align:start;'><div style='font-family:inherit;'><p style='margin-top:0pt; margin-bottom:0pt; font-family:inherit; background:transparent;'><br /></p><p style='margin-top:0pt; margin-bottom:0pt; background:transparent;'><font size='4' style='font-family:inherit;'><b>Input</b><b><br /></b></font><span style='background-color:transparent;'>The model is trained with classified LiDAR that follows the </span><a href='https://www.linz.govt.nz/resources/guide/new-zealand-national-aerial-lidar-base-specification' target='_blank' rel='nofollow ugc noopener noreferrer'>LINZ base specification</a><span style='background-color:transparent;'>. The input data should be similar to this specification.</span></p><p style='margin-top:0pt; margin-bottom:0pt; background:transparent;'><span style='background-color:transparent;'><br /></span></p><p style='margin-top:0pt; margin-bottom:0pt; background:transparent;'><span style='background-color:transparent;'>Note: The model is dependent on additional attributes such as Intensity, Number of Returns, etc, similar to the LINZ base specification.  </span><span style='font-family:inherit;'>This model is trained to work on classified and unclassified point clouds that are in a projected coordinate system, in which the units of X, Y and Z are based on the metric system of measurement. If the dataset is in degrees or feet, it needs to be re-projected accordingly. </span></p></div></font></font></div></div><div style='font-family:inherit; text-align:justify;'><div style='font-family:inherit; text-align:left;'><font color='#000000' style='font-family:inherit;'><br /></font></div><div style='font-family:inherit; text-align:left;'><p style='margin-top:0px; margin-bottom:1.5rem;'><font color='#000000' style='font-family:inherit;'><font style='font-family:inherit;'>The model was trained using a training dataset with the full set of points. Therefore, it is important to make the full set of points available to the neural network while </font><span style='font-family:inherit;'>predicting - allowing it to </span><span style='font-family:inherit;'>better discriminate points of 'class of interest' versus background points. </span><span style='font-family:inherit; text-align:justify;'><font face='inherit' style='font-family:inherit;'><span style='font-family:inherit;'>It is recommended to use 'selective/target classification' and 'class preservation' functionalities during prediction to have better control over the classification and </span></font><span style='font-family:inherit;'>scenarios</span><font face='inherit' style='font-family:inherit;'><span style='font-family:inherit;'> with false positives.</span></font></span><br /></font></p><p style='margin-top:0px; margin-bottom:1.5rem; font-family:inherit;'><font color='#000000' style='font-family:inherit;'>The model was trained on airborne lidar datasets and is expected to perform best with similar datasets. Classification of terrestrial point cloud datasets may work but has not been validated. For such cases, this pre-trained model may be fine-tuned to save on cost, time, and compute resources while improving accuracy. <span style='font-family:inherit;'>Another example where fine-tuning this model can be useful is when the object of interest is tram wires, railway wires, etc. which are geometrically similar to electricity wires.</span><span style='font-family:inherit;'> When fine-tuning this model, the target training data characteristics such as class structure, maximum number of points per block and extra attributes should match those of the data originally used for training this model (see Training data section below).</span></font></p></div><div style='font-family:inherit;'><font style='font-family:inherit; text-align:start;'><div style='font-family:inherit;'><p style='margin-top:0px; margin-bottom:1.5rem; color:rgb(0, 0, 0);'><font size='4' style='font-family:inherit;'><b>Output<br /></b></font><b><b><span style='font-family:inherit; background-color:transparent; font-weight:400; text-align:justify;'>The model will classify the point cloud into the following classes with their meaning as </span><font style='font-family:inherit; background-color:transparent; font-weight:400;'>defined by the American Society for Photogrammetry and Remote Sensing (ASPRS) described below</font><span style='font-family:inherit; background-color:transparent; font-weight:400; font-size:medium;'>:</span></b></b></p><div style='font-family:inherit;'><div style='font-family:inherit;'><table border='1' cellpadding='2' style='margin-bottom:1.5rem; width:193.484px; background-color:transparent; border-collapse:collapse; border-spacing:0px; border:1px solid rgb(204, 204, 204); font-size:14px; font-family:&quot;Helvetica Neue&quot;, Helvetica, Arial, sans-serif;'><tbody><tr style='border-bottom:1px solid rgb(204, 204, 204); box-sizing:border-box; height:23px;'><td style='border-left:1px solid rgb(204, 204, 204); border-right:1px solid rgb(204, 204, 204); padding:0px; box-sizing:border-box; width:32.7188px; height:23px;'><font color='#000000' style='font-family:inherit;'>   0 </font></td><td style='border-left:1px solid rgb(204, 204, 204); border-right:1px solid rgb(204, 204, 204); padding:0px; box-sizing:border-box; width:159.766px; height:23px;'><font color='#000000' style='font-family:inherit;'>      Background</font></td></tr><tr style='border-bottom:none; box-sizing:border-box; height:23.5px;'><td style='border-left:1px solid rgb(204, 204, 204); border-right:1px solid rgb(204, 204, 204); padding:0px; box-sizing:border-box; width:32.7188px; height:23.5px;'><font color='#000000' style='font-family:inherit;'>   5</font></td><td style='border-left:1px solid rgb(204, 204, 204); border-right:1px solid rgb(204, 204, 204); padding:0px; box-sizing:border-box; width:159.766px; height:23.5px;'><font color='#000000' style='font-family:inherit;'> <span style='font-family:inherit; box-sizing:border-box;'>Trees / High-</span>vegetation</font></td></tr></tbody></table><div style='font-family:&quot;Helvetica Neue&quot;, Helvetica, Arial, sans-serif; color:rgb(51, 51, 51); box-sizing:border-box; font-size:14px; margin:0px; padding:0px; height:4px; width:240px;'></div><div style='font-family:&quot;Helvetica Neue&quot;, Helvetica, Arial, sans-serif; color:rgb(51, 51, 51); box-sizing:border-box; font-size:14px; margin:0px; padding:0px; height:4px; width:240px;'></div><div style='font-family:&quot;Helvetica Neue&quot;, Helvetica, Arial, sans-serif; color:rgb(51, 51, 51); box-sizing:border-box; font-size:14px; margin:0px; padding:0px; height:4px; width:240px;'></div><div style='font-family:&quot;Helvetica Neue&quot;, Helvetica, Arial, sans-serif; color:rgb(51, 51, 51); box-sizing:border-box; font-size:14px; margin:0px; padding:0px; height:4px; width:240px;'><br /></div></div><b><font size='4' style='font-family:inherit;'><font color='#000000' style='font-family:inherit;'>Applicable geographies</font><br /></font></b><span style='font-family:inherit; color:rgb(0, 0, 0); font-size:medium;'>The model is expected to work well in the New Zealand. </span><span style='font-family:inherit; color:rgb(0, 0, 0); font-size:medium; text-align:justify;'>It's seen to produce favorable results </span><span style='font-family:inherit; color:rgb(0, 0, 0);'>as shown</span><span style='font-family:inherit; color:rgb(0, 0, 0); font-size:medium; text-align:justify;'> in many regions. </span><span style='font-family:inherit; color:rgb(0, 0, 0); text-align:justify;'>However, results can vary for datasets that are statistically dissimilar to training data.<br />Training dataset - Wellington City<br />Testing dataset - Tawa City</span></div><div style='font-family:inherit;'><span style='font-family:inherit; color:rgb(0, 0, 0); text-align:justify;'>Validation/Evaluation dataset - Christchurch City</span></div><div style='font-family:inherit;'><span style='font-family:inherit; color:rgb(0, 0, 0); text-align:justify;'><br /></span></div><div style='font-family:inherit;'><table border='1' style='margin-bottom:1.5rem; width:229px; background-color:transparent; border-collapse:collapse; border-spacing:0px; border:1px solid rgb(204, 204, 204); text-align:center; font-size:14px; color:rgb(51, 51, 51); font-family:&quot;Helvetica Neue&quot;, Helvetica, Arial, sans-serif; height:70px;'><tbody><tr style='border-bottom:1px solid rgb(204, 204, 204); text-align:left; box-sizing:border-box; height:21px;'><td style='border-left:1px solid rgb(204, 204, 204); border-right:1px solid rgb(204, 204, 204); padding:0px; box-sizing:border-box; height:21px; width:70.2656px;'><font color='#000000'> Dataset</font></td><td style='border-left:1px solid rgb(204, 204, 204); border-right:1px solid rgb(204, 204, 204); padding:0px; box-sizing:border-box; height:21px; width:157.734px;'><font color='#000000'> City</font></td></tr><tr style='border-bottom:1px solid rgb(204, 204, 204); text-align:left; box-sizing:border-box; height:21px;'><td style='border-left:1px solid rgb(204, 204, 204); border-right:1px solid rgb(204, 204, 204); padding:0px; box-sizing:border-box; height:21px; width:70.2656px;'><font color='#000000' style='font-family:inherit;'> Training</font></td><td style='border-left:1px solid rgb(204, 204, 204); border-right:1px solid rgb(204, 204, 204); padding:0px; box-sizing:border-box; height:21px; width:157.734px;'><font color='#000000' style='font-family:inherit;'> Wellington</font></td></tr><tr style='border-bottom:1px solid rgb(204, 204, 204); text-align:left; box-sizing:border-box; height:21px;'><td style='border-left:1px solid rgb(204, 204, 204); border-right:1px solid rgb(204, 204, 204); padding:0px; box-sizing:border-box; height:21px; width:70.2656px;'><font color='#000000' style='font-family:inherit;'> Testing</font></td><td style='border-left:1px solid rgb(204, 204, 204); border-right:1px solid rgb(204, 204, 204); padding:0px; box-sizing:border-box; height:21px; width:157.734px;'><font color='#000000' style='font-family:inherit;'> Tawa</font></td></tr><tr style='border-bottom:none; text-align:left; box-sizing:border-box; height:5.5px;'><td style='border-left:1px solid rgb(204, 204, 204); border-right:1px solid rgb(204, 204, 204); padding:0px; box-sizing:border-box; height:5.5px; width:70.2656px;'><font color='#000000' style='font-family:inherit;'> Validating</font></td><td style='border-left:1px solid rgb(204, 204, 204); border-right:1px solid rgb(204, 204, 204); padding:0px; box-sizing:border-box; height:5.5px; width:157.734px;'><font color='#000000' style='font-family:inherit;'> Christchurch</font><br /></td></tr></tbody></table></div><p style='margin-top:0pt; margin-bottom:0pt; color:rgb(0, 0, 0); font-family:inherit; background:transparent;'><b><font size='4' style='font-family:inherit;'>Model architecture<br /></font></b></p><div style='font-family:inherit; color:rgb(0, 0, 0);'><b><font size='4' style='font-family:inherit;'><span style='font-family:inherit; background-color:transparent; font-weight:400; font-size:16px; text-align:justify;'>This model uses the </span></font></b><a href='https://developers.arcgis.com/python/guide/point-cloud-segmentation-using-pointcnn/' style='color:rgb(0, 121, 193); text-decoration-line:none; font-family:inherit;' target='_blank' rel='nofollow ugc noopener noreferrer'>PointCNN</a><b><font size='4' style='font-family:inherit;'><span style='font-family:inherit; background-color:transparent; font-weight:400; font-size:16px; text-align:justify;'> model architecture implemented in </span></font></b><a href='https://developers.arcgis.com/python/' style='color:rgb(0, 121, 193); text-decoration-line:none; font-family:inherit;' target='_blank' rel='nofollow ugc noopener noreferrer'>ArcGIS API for Python</a><b><font size='4' style='font-family:inherit;'><span style='font-family:inherit; background-color:transparent; font-weight:400; font-size:16px; text-align:justify;'>.<br /></span></font></b></div><p style='margin-top:0px; margin-bottom:0px; color:rgb(0, 0, 0);'></p><p style='margin-top:0pt; margin-bottom:0pt; color:rgb(0, 0, 0); font-family:inherit; background:transparent;'><font style='font-family:inherit; text-align:justify; font-size:15px;'><span style='font-family:inherit; font-size:16px;'><br /></span></font></p><p style='margin-top:0pt; margin-bottom:0pt; color:rgb(0, 0, 0); font-family:inherit; background:transparent;'><b><font size='4' style='font-family:inherit;'>Accuracy metrics<br /></font></b><span style='font-family:inherit; background-color:transparent;'>The table below summarizes the accuracy of the predictions on the validation dataset.</span></p><p style='margin-top:0pt; margin-bottom:0pt; color:rgb(0, 0, 0); font-family:inherit; background:transparent;'><span style='font-family:inherit; background-color:transparent;'><br /></span></p><table border='1' cellpadding='2' style='background-color:transparent; margin-bottom:1.5rem; width:362.484px; border-collapse:collapse; border-spacing:0px; border:1px solid rgb(204, 204, 204); text-align:center; font-size:14px; color:rgb(0, 0, 0); font-family:&quot;Helvetica Neue&quot;, Helvetica, Arial, sans-serif; height:100px;'><tbody><tr style='border-bottom:1px solid rgb(204, 204, 204); text-align:left; box-sizing:border-box; height:3px;'><td style='border-left:1px solid rgb(204, 204, 204); border-right:1px solid rgb(204, 204, 204); padding:0px; box-sizing:border-box; width:140px; height:3px;'>  -</td><td style='border-left:1px solid rgb(204, 204, 204); border-right:1px solid rgb(204, 204, 204); padding:0px; box-sizing:border-box; width:66px; height:3px;'> Precision</td><td style='border-left:1px solid rgb(204, 204, 204); border-right:1px solid rgb(204, 204, 204); padding:0px; box-sizing:border-box; width:66px; height:3px;'> Recall</td><td style='border-left:1px solid rgb(204, 204, 204); border-right:1px solid rgb(204, 204, 204); padding:0px; box-sizing:border-box; width:71.4844px; height:3px;'> F1-score</td></tr><tr style='border-bottom:1px solid rgb(204, 204, 204); text-align:left; box-sizing:border-box; height:6px;'><td style='text-align:center; border-left:1px solid rgb(204, 204, 204); border-right:1px solid rgb(204, 204, 204); padding:0px; box-sizing:border-box; width:140px; height:6px;'>  <font face='Arial, sans-serif'>Never Classified</font></td><td style='border-left:1px solid rgb(204, 204, 204); border-right:1px solid rgb(204, 204, 204); padding:0px; box-sizing:border-box; width:66px; height:6px;'> 0.991200</td><td style='border-left:1px solid rgb(204, 204, 204); border-right:1px solid rgb(204, 204, 204); padding:0px; box-sizing:border-box; width:66px; height:6px;'>  0.975404</td><td style='border-left:1px solid rgb(204, 204, 204); border-right:1px solid rgb(204, 204, 204); padding:0px; box-sizing:border-box; width:71.4844px; height:6px;'>  0.983239</td></tr><tr style='border-bottom:1px solid rgb(204, 204, 204); text-align:left; box-sizing:border-box; height:23px;'><td style='text-align:center; border-left:1px solid rgb(204, 204, 204); border-right:1px solid rgb(204, 204, 204); padding:0px; box-sizing:border-box; width:140px; height:23px;'> High Vegetation</td><td style='border-left:1px solid rgb(204, 204, 204); border-right:1px solid rgb(204, 204, 204); padding:0px; box-sizing:border-box; width:66px; height:23px;'> 0.933569</td><td style='border-left:1px solid rgb(204, 204, 204); border-right:1px solid rgb(204, 204, 204); padding:0px; box-sizing:border-box; width:66px; height:23px;'>  0.975559</td><td style='border-left:1px solid rgb(204, 204, 204); border-right:1px solid rgb(204, 204, 204); padding:0px; box-sizing:border-box; width:71.4844px; height:23px;'>  0.954102</td></tr></tbody></table><div style='font-family:inherit; color:rgb(0, 0, 0);'><font size='4' style='font-family:inherit;'><b>Training data<br /></b></font><font style='font-family:inherit;'>This model is trained on classified dataset originally provided by Open TopoGraphy with &lt; 1% of manual labelling and correction.</font></div><div style='font-family:inherit; color:rgb(0, 0, 0);'><font style='font-family:inherit;'>Train-Test split percentage {Train: 80%, Test: 20%} Chosen this ratio based on the analysis from previous epoch statistics which appears to have a descent improvement<br /></font><span style='font-family:inherit;'>The training data used has the following characteristics:</span></div><div style='font-family:inherit; color:rgb(0, 0, 0);'><br /></div><div style='font-family:inherit; color:rgb(0, 0, 0);'><table border='1' cellpadding='2' style='margin-bottom:1.5rem; width:326.031px; background-color:transparent; border-collapse:collapse; border-spacing:0px; border:1px solid rgb(204, 204, 204); font-size:14px; font-family:&quot;Helvetica Neue&quot;, Helvetica, Arial, sans-serif;'><tbody><tr style='border-bottom:1px solid rgb(204, 204, 204); box-sizing:border-box; height:21px;'><td style='border-left:1px solid rgb(204, 204, 204); border-right:1px solid rgb(204, 204, 204); padding:0px; box-sizing:border-box; height:21px; width:175px;'> X, Y, and Z linear unit</td><td style='border-left:1px solid rgb(204, 204, 204); border-right:1px solid rgb(204, 204, 204); padding:0px; text-align:center; box-sizing:border-box; height:21px; width:149.031px;'>Meter</td></tr><tr style='border-bottom:1px solid rgb(204, 204, 204); box-sizing:border-box; height:21px;'><td style='border-left:1px solid rgb(204, 204, 204); border-right:1px solid rgb(204, 204, 204); padding:0px; box-sizing:border-box; height:21px; width:175px;'> Z range</td><td style='border-left:1px solid rgb(204, 204, 204); border-right:1px solid rgb(204, 204, 204); padding:0px; text-align:center; box-sizing:border-box; height:21px; width:149.031px;'>-121.69 m to 26.84 m</td></tr><tr style='border-bottom:1px solid rgb(204, 204, 204); box-sizing:border-box; height:21px;'><td style='border-left:1px solid rgb(204, 204, 204); border-right:1px solid rgb(204, 204, 204); padding:0px; box-sizing:border-box; height:21px; width:175px;'> Number of Returns</td><td style='border-left:1px solid rgb(204, 204, 204); border-right:1px solid rgb(204, 204, 204); padding:0px; text-align:center; box-sizing:border-box; height:21px; width:149.031px;'>1 to 5</td></tr><tr style='border-bottom:1px solid rgb(204, 204, 204); box-sizing:border-box; height:21px;'><td style='border-left:1px solid rgb(204, 204, 204); border-right:1px solid rgb(204, 204, 204); padding:0px; box-sizing:border-box; height:21px; width:175px;'> Intensity</td><td style='border-left:1px solid rgb(204, 204, 204); border-right:1px solid rgb(204, 204, 204); padding:0px; text-align:center; box-sizing:border-box; height:21px; width:149.031px;'>16 to 65520</td></tr><tr style='border-bottom:1px solid rgb(204, 204, 204); box-sizing:border-box; height:21.5px;'><td style='border-left:1px solid rgb(204, 204, 204); border-right:1px solid rgb(204, 204, 204); padding:0px; box-sizing:border-box; height:21.5px; width:175px;'> Point spacing</td><td style='border-left:1px solid rgb(204, 204, 204); border-right:1px solid rgb(204, 204, 204); padding:0px; text-align:center; box-sizing:border-box; height:21.5px; width:149.031px;'>0.2 ± 0.1</td></tr><tr style='border-bottom:1px solid rgb(204, 204, 204); box-sizing:border-box; height:21px;'><td style='border-left:1px solid rgb(204, 204, 204); border-right:1px solid rgb(204, 204, 204); padding:0px; box-sizing:border-box; height:21px; width:175px;'> Scan angle</td><td style='border-left:1px solid rgb(204, 204, 204); border-right:1px solid rgb(204, 204, 204); padding:0px; text-align:center; box-sizing:border-box; height:21px; width:149.031px;'>-15 to +15</td></tr><tr style='border-bottom:1px solid rgb(204, 204, 204); box-sizing:border-box; height:21px;'><td style='border-left:1px solid rgb(204, 204, 204); border-right:1px solid rgb(204, 204, 204); padding:0px; box-sizing:border-box; height:21px; width:175px;'> Maximum points per block</td><td style='border-left:1px solid rgb(204, 204, 204); border-right:1px solid rgb(204, 204, 204); padding:0px; text-align:center; box-sizing:border-box; height:21px; width:149.031px;'>8192</td></tr><tr style='border-bottom:1px solid rgb(204, 204, 204); box-sizing:border-box; height:21px;'><td style='border-left:1px solid rgb(204, 204, 204); border-right:1px solid rgb(204, 204, 204); padding:0px; box-sizing:border-box; height:21px; width:175px;'> Block Size</td><td style='border-left:1px solid rgb(204, 204, 204); border-right:1px solid rgb(204, 204, 204); padding:0px; text-align:center; box-sizing:border-box; height:21px; width:149.031px;'>20 Meters<br /></td></tr><tr style='border-bottom:none; box-sizing:border-box; height:21px;'><td style='border-left:1px solid rgb(204, 204, 204); border-right:1px solid rgb(204, 204, 204); padding:0px; box-sizing:border-box; height:21px; width:175px;'> Class structure</td><td style='border-left:1px solid rgb(204, 204, 204); border-right:1px solid rgb(204, 204, 204); padding:0px; text-align:center; box-sizing:border-box; height:21px; width:149.031px;'>[0, 5]</td></tr></tbody></table><b><font size='4' style='font-family:inherit;'>Sample results<br /></font></b>Model to classify a dataset with 5pts/m density Christchurch city dataset. The model's performance are directly proportional to the dataset point density and noise exlcuded point clouds.<br /><font color='#000000' style='font-size:15px;'>To learn how to use this model, see this </font><a href='https://storymaps.arcgis.com/stories/476a1fa7316e43b28ae30afe95563f19' target='_blank' rel='nofollow ugc noopener noreferrer'>story</a><br /><img alt='SampleResult0' src='https://eaglegis.maps.arcgis.com/sharing/rest/content/items/8a76743a117947b5ada09438642b5d52/data' /><br /><img /><br /></div></div></font></div></div></div></div></div>",
			"keyword": [
				"Deep Learning",
				"Eagle Technology",
				"New Zealand",
				"Point Cloud",
				"dlpk",
				"pointcnn",
				"eaglegis",
				"urban",
				"NZ"
			],
			"issued": "2022-07-25T22:18:54.000Z",
			"modified": "2023-09-18T01:09:27.000Z",
			"publisher": {
				"name": "Eagle Technology Group Ltd"
			},
			"contactPoint": {
				"@type": "vcard:Contact",
				"fn": "eaglegis",
				"hasEmail": "mailto:ts@eaglegis.co.nz"
			},
			"accessLevel": "public",
			"spatial": "163.8527,-47.6571,179.5732,-34.0089",
			"license": "https://creativecommons.org/licenses/by/4.0",
			"distribution": [
				{
					"@type": "dcat:Distribution",
					"title": "ArcGIS Hub Dataset",
					"format": "Web Page",
					"mediaType": "text/html",
					"accessURL": "https://www.pacificgeoportal.com/content/eaglegis::tree-point-classification-new-zealand"
				}
			],
			"theme": [
				"geospatial"
			]
		},
		{
			"@type": "dcat:Dataset",
			"identifier": "https://www.arcgis.com/home/item.html?id=3f448990f22f49c2a4f46091a79c5428",
			"landingPage": "https://www.pacificgeoportal.com/apps/eaglegis::introducing-nz-vector-basemaps",
			"title": "Introducing NZ Vector Basemaps",
			"description": "<p>Beneath every engaging web map lies an unsung hero... a basemap! Basemaps help you to provide context to your geospatial data, and for many years we have offered raster basemaps in the New Zealand Transverse Mercator (NZTM) projection using New Zealand data. However, over the past year we've been working hard on the next generation of New Zealand basemaps: <strong>vector basemaps</strong>.</p><p>At the end of 2019, we released our first New Zealand Vector Basemap, and since then we have been actively working on adding new styles and updating the datasets which they comprise. Our aim, being to provide you with the most up-to-date basemaps which complement your own operational layers.</p><p>To date, we have released the following styles:</p>",
			"keyword": [
				"ArcGIS StoryMap",
				"Content",
				"StoryMap",
				"NZ",
				"New Zealand",
				"Basemap",
				"Vector",
				"NZTM",
				"Topographic",
				"Hillshade",
				"Aotearoa"
			],
			"issued": "2019-12-12T20:00:52.000Z",
			"modified": "2023-09-12T02:17:01.000Z",
			"publisher": {
				"name": "Eagle Technology Group Ltd"
			},
			"contactPoint": {
				"@type": "vcard:Contact",
				"fn": "eaglegis",
				"hasEmail": "mailto:ts@eaglegis.co.nz"
			},
			"accessLevel": "public",
			"spatial": "163.8527,-47.6571,179.5732,-34.0089",
			"license": "https://creativecommons.org/licenses/by/4.0",
			"distribution": [
				{
					"@type": "dcat:Distribution",
					"title": "ArcGIS Hub Dataset",
					"format": "Web Page",
					"mediaType": "text/html",
					"accessURL": "https://www.pacificgeoportal.com/apps/eaglegis::introducing-nz-vector-basemaps"
				},
				{
					"@type": "dcat:Distribution",
					"title": "ArcGIS GeoService",
					"format": "ArcGIS GeoServices REST API",
					"mediaType": "application/json",
					"accessURL": "https://storymaps.arcgis.com/stories/3f448990f22f49c2a4f46091a79c5428"
				}
			],
			"theme": [
				"geospatial"
			]
		},
		{
			"@type": "dcat:Dataset",
			"identifier": "https://www.arcgis.com/home/item.html?id=8f985a3b19eb4213b60712df0f190a98",
			"landingPage": "https://www.pacificgeoportal.com/apps/eaglegis::nz-vector-basemap-updates",
			"title": "NZ Vector Basemap Updates",
			"description": "<p>At the end of 2019, we released our first New Zealand Vector Basemap, and since then we have been actively working on adding new styles and updating the datasets which they comprise. Our aim, being to provide you with the most up-to-date basemaps which bring context to your own operational layers.</p>",
			"keyword": [
				"ArcGIS StoryMap",
				"Content",
				"StoryMap",
				"NZ",
				"New Zealand",
				"Basemap",
				"Vector",
				"NZTM",
				"Aotearoa",
				"Canvas",
				"Light",
				"Dark",
				"Navigation",
				"Styles",
				"Eagle",
				"Eagle Technology",
				"Update",
				"Changelog",
				"Summary",
				"Topographic"
			],
			"issued": "2020-05-12T00:35:13.000Z",
			"modified": "2023-09-12T02:05:32.000Z",
			"publisher": {
				"name": "Eagle Technology Group Ltd"
			},
			"contactPoint": {
				"@type": "vcard:Contact",
				"fn": "eaglegis",
				"hasEmail": "mailto:ts@eaglegis.co.nz"
			},
			"accessLevel": "public",
			"spatial": "",
			"license": "https://creativecommons.org/licenses/by/4.0",
			"distribution": [
				{
					"@type": "dcat:Distribution",
					"title": "ArcGIS Hub Dataset",
					"format": "Web Page",
					"mediaType": "text/html",
					"accessURL": "https://www.pacificgeoportal.com/apps/eaglegis::nz-vector-basemap-updates"
				},
				{
					"@type": "dcat:Distribution",
					"title": "ArcGIS GeoService",
					"format": "ArcGIS GeoServices REST API",
					"mediaType": "application/json",
					"accessURL": "https://storymaps.arcgis.com/stories/8f985a3b19eb4213b60712df0f190a98"
				}
			],
			"theme": ""
		},
		{
			"@type": "dcat:Dataset",
			"identifier": "https://www.arcgis.com/home/item.html?id=48ae671cf14c4351bc304a8c93672f23",
			"landingPage": "https://www.pacificgeoportal.com/content/eaglegis::car-detection-new-zealand",
			"title": "Car Detection - New Zealand",
			"description": "<div><font color='#000000' face='Avenir Next W01, Avenir Next W00, Avenir Next, Avenir, Helvetica Neue, sans-serif'><span style='font-size:16px;'>This New Zealand car detection Deep Learning Package will detect cars from high resolution imagery. This model is re-trained from the Esri <a href='https://www.arcgis.com/home/item.html?id=cfc57b507f914d1593f5871bf0d52999' target='_blank' rel='nofollow ugc noopener noreferrer'>Car Detection - USA</a> Deep Learning Package and is trained to work better within the New Zealand geography.</span></font></div><div><font color='#000000' face='Avenir Next W01, Avenir Next W00, Avenir Next, Avenir, Helvetica Neue, sans-serif'><span style='font-size:16px;'><br /></span></font></div><div><font color='#000000' face='Avenir Next W01, Avenir Next W00, Avenir Next, Avenir, Helvetica Neue, sans-serif'><span style='font-size:16px;'>The model precision had also improved from 0.81 to 0.89. The package is trained to be more aggressive in terms of car detecting and is able to detect most cars that are fully covered in shade or partially blocked by tree canopy.</span></font></div><div><font color='#000000' face='Avenir Next W01, Avenir Next W00, Avenir Next, Avenir, Helvetica Neue, sans-serif'><span style='font-size:16px;'> <br /></span></font></div><div style='margin-bottom:3rem;'><div style='max-width:100%; display:inherit;'><p style='font-family:&quot;Avenir Next W01&quot;, &quot;Avenir Next W00&quot;, &quot;Avenir Next&quot;, Avenir, &quot;Helvetica Neue&quot;, sans-serif; font-size:16px; margin-top:0px; margin-bottom:1.5rem; background-image:initial; background-position:initial; background-size:initial; background-repeat:initial; background-attachment:initial; background-origin:initial; background-clip:initial;'><span style='font-family:inherit;'><span style='font-family:inherit; color:black;'>This deep learning model is used to detect cars in high resolution drone or aerial imagery.</span> </span><span style='font-family:inherit; color:black;'>Car detection can be used for applications such as traffic management and analysis, parking lot utilization, urban planning, etc. It can also be used as a proxy for deriving economic indicators and estimating retail sales. High resolution aerial and drone imagery can be used for car detection due to its high spatio-temporal coverage.</span><br /></p><p style='font-family:&quot;Avenir Next W01&quot;, &quot;Avenir Next W00&quot;, &quot;Avenir Next&quot;, Avenir, &quot;Helvetica Neue&quot;, sans-serif; font-size:16px; margin-top:0px; margin-bottom:1.5rem; background-image:initial; background-position:initial; background-size:initial; background-repeat:initial; background-attachment:initial; background-origin:initial; background-clip:initial;'><span style='font-family:inherit; color:black;'><b><font size='4' style='font-family:inherit;'>Licensing requirements</font><br /></b></span><span style='font-family:inherit; color:black;'>ArcGIS Desktop</span><span style='color:rgb(0, 0, 0); font-size:medium;'> – </span><span style='font-family:inherit; color:black;'>ArcGIS Image Analyst and ArcGIS 3D Analyst extensions for ArcGIS Pro</span><span style='font-family:inherit; color:black;'><br /></span><span style='font-family:inherit; color:black;'>ArcGIS Online</span><span style='color:rgb(0, 0, 0); font-size:medium;'> – </span><span style='font-family:inherit; color:black;'>ArcGIS Image for ArcGIS Online</span><span style='font-family:inherit; color:black;'><br /></span></p><p style='font-family:&quot;Avenir Next W01&quot;, &quot;Avenir Next W00&quot;, &quot;Avenir Next&quot;, Avenir, &quot;Helvetica Neue&quot;, sans-serif; font-size:16px; margin-top:0px; margin-bottom:1.5rem; background-image:initial; background-position:initial; background-size:initial; background-repeat:initial; background-attachment:initial; background-origin:initial; background-clip:initial;'><span style='font-family:inherit;'><font color='#000000' style='font-family:inherit;'><b><font size='4' style='font-family:inherit;'>Using the model<br /></font></b></font></span><font style='text-align:justify;'><font color='#000000' style='font-family:inherit; font-size:15px;'><span style='font-family:inherit; font-size:16px;'>Follow the </span></font><a href='https://doc.arcgis.com/en/pretrained-models/latest/imagery/using-car-detection-usa.htm' style='color:rgb(0, 121, 193); text-decoration-line:none; font-family:inherit;' target='_blank' rel='nofollow ugc noopener noreferrer'>guide</a><font color='#000000' style='font-family:inherit; font-size:15px;'><span style='font-family:inherit; font-size:16px;'> to use the model. Before using this model,</span></font><span style='font-family:inherit; color:rgb(14, 16, 26);'> ensure that the supported deep learning </span></font><span style='text-align:justify; font-size:17px;'>libraries </span><font style='text-align:justify;'><span style='font-family:inherit; color:rgb(14, 16, 26);'>are installed.</span></font><span style='font-family:inherit; text-align:justify;'> </span><span style='text-align:justify; font-size:medium; color:rgb(14, 16, 26);'>For more details, check </span><span style='color:black; text-align:justify; font-size:medium;'><a href='https://github.com/esri/deep-learning-frameworks' style='color:rgb(0, 121, 193); text-decoration-line:none; font-family:inherit;' target='_blank' rel='nofollow ugc noopener noreferrer'>Deep Learning Libraries Installer for ArcGIS</a></span><span style='font-family:inherit; color:black;'>.</span></p><p style='font-family:&quot;Avenir Next W01&quot;, &quot;Avenir Next W00&quot;, &quot;Avenir Next&quot;, Avenir, &quot;Helvetica Neue&quot;, sans-serif; font-size:16px; margin-top:0px; margin-bottom:0px;'></p><p style='font-family:&quot;Avenir Next W01&quot;, &quot;Avenir Next W00&quot;, &quot;Avenir Next&quot;, Avenir, &quot;Helvetica Neue&quot;, sans-serif; font-size:16px; margin-top:0px; margin-bottom:1.5rem; background-image:initial; background-position:initial; background-size:initial; background-repeat:initial; background-attachment:initial; background-origin:initial; background-clip:initial;'><span style='font-family:inherit;'><span style='font-family:inherit; color:black;'>Note: Deep learning is computationally intensive, and a powerful GPU is recommended to process large datasets.</span></span></p><p style='margin-top:0px; margin-bottom:1.5rem; background-image:initial; background-position:initial; background-size:initial; background-repeat:initial; background-attachment:initial; background-origin:initial; background-clip:initial;'><span style='font-family:inherit; font-size:16px;'><span style='font-family:inherit; color:black;'><b><font size='4' style='font-family:inherit;'>Input</font><br /></b></span></span><font color='#000000' face='inherit'><span style='font-size:16px;'>High resolution RGB imagery (7.5 </span></font><font color='#000000' face='Avenir Next W01, Avenir Next W00, Avenir Next, Avenir, Helvetica Neue, sans-serif'><span style='font-size:16px;'>centimetre</span></font><font color='#000000' face='inherit'><span style='font-size:16px;'> spatial resolution)</span></font></p><p style='font-family:&quot;Avenir Next W01&quot;, &quot;Avenir Next W00&quot;, &quot;Avenir Next&quot;, Avenir, &quot;Helvetica Neue&quot;, sans-serif; font-size:16px; margin-top:0px; margin-bottom:0.0001pt; background-image:initial; background-position:initial; background-size:initial; background-repeat:initial; background-attachment:initial; background-origin:initial; background-clip:initial;'><b><span style='font-family:inherit; color:black;'><font size='4' style='font-family:inherit;'>Output</font><br /></span></b><span style='font-family:inherit; color:rgb(0, 0, 0);'>Feature class containing detected cars<br /><br /></span></p><p style='font-family:&quot;Avenir Next W01&quot;, &quot;Avenir Next W00&quot;, &quot;Avenir Next&quot;, Avenir, &quot;Helvetica Neue&quot;, sans-serif; font-size:16px; margin-top:0px; margin-bottom:0.0001pt; background-image:initial; background-position:initial; background-size:initial; background-repeat:initial; background-attachment:initial; background-origin:initial; background-clip:initial;'><span style='font-family:inherit; color:black;'><b><font size='4' style='font-family:inherit;'>Applicable geographies</font><br /></b></span><span style='font-family:inherit; color:black;'>The model is expected to work well with the New Zealand localised data.<br /><br /></span></p><p style='font-family:&quot;Avenir Next W01&quot;, &quot;Avenir Next W00&quot;, &quot;Avenir Next&quot;, Avenir, &quot;Helvetica Neue&quot;, sans-serif; font-size:16px; margin-top:0px; margin-bottom:1.5rem; background-image:initial; background-position:initial; background-size:initial; background-repeat:initial; background-attachment:initial; background-origin:initial; background-clip:initial;'><span style='font-family:inherit;'><span style='font-family:inherit; color:black;'><b><font size='4' style='font-family:inherit;'>Model architecture</font><br /></b></span></span><span style='font-family:inherit; color:black;'>This model uses the </span><a href='https://developers.arcgis.com/python/guide/how-maskrcnn-works/' style='color:rgb(0, 121, 193); text-decoration-line:none; font-family:inherit;' target='_blank' rel='nofollow ugc noopener noreferrer'>MaskRCNN</a><span style='font-family:inherit; color:black;'> model architecture implemented in ArcGIS Pro Arcpy.<br /></span></p><p style='font-family:&quot;Avenir Next W01&quot;, &quot;Avenir Next W00&quot;, &quot;Avenir Next&quot;, Avenir, &quot;Helvetica Neue&quot;, sans-serif; font-size:16px; margin-top:0px; margin-bottom:1.5rem; background-image:initial; background-position:initial; background-size:initial; background-repeat:initial; background-attachment:initial; background-origin:initial; background-clip:initial;'><span style='font-family:inherit;'><span style='font-family:inherit; color:black;'><b><font size='4' style='font-family:inherit;'>Accuracy metrics</font><br /></b></span></span><span style='font-family:inherit; color:black;'>This model has an average precision score of 0.89.<br /></span></p><p style='font-family:&quot;Avenir Next W01&quot;, &quot;Avenir Next W00&quot;, &quot;Avenir Next&quot;, Avenir, &quot;Helvetica Neue&quot;, sans-serif; font-size:16px; margin-top:0px; margin-bottom:1.5rem; background-image:initial; background-position:initial; background-size:initial; background-repeat:initial; background-attachment:initial; background-origin:initial; background-clip:initial;'><span style='font-family:inherit;'><b><span style='font-family:inherit; color:black;'><font size='4' style='font-family:inherit;'>Sample results<br /></font></span></b></span><font color='#000000'><font size='3' style='font-family:inherit;'>Here are a few results from the model.<br />(Post processing are recommended to filter out False Positive Object.<br />e.g (confidence &gt;= x | 0.95) |&amp; ((shape_area/shape_length) &gt;= x | 0.5) |&amp; (class == Car) |&amp; Regularize(feature)<br />3% of detected object will need to be filtered out a</font></font><span style='color:rgb(0, 0, 0); font-size:medium;'>veragely</span><span style='color:rgb(0, 0, 0); font-size:medium;'> </span><span style='font-family:inherit; font-size:medium; color:rgb(0, 0, 0);'>.</span></p><p style='font-family:&quot;Avenir Next W01&quot;, &quot;Avenir Next W00&quot;, &quot;Avenir Next&quot;, Avenir, &quot;Helvetica Neue&quot;, sans-serif; font-size:16px; margin-top:0px; margin-bottom:1.5rem; background-image:initial; background-position:initial; background-size:initial; background-repeat:initial; background-attachment:initial; background-origin:initial; background-clip:initial;'><font color='#000000' style='font-family:&quot;Avenir Next&quot;, Avenir, &quot;Helvetica Neue&quot;, Helvetica, Arial, sans-serif; font-size:15px;'>To learn how to use this model, see this </font><a href='https://storymaps.arcgis.com/stories/4636e528c97d4b2a9b2989d68d6bbd35' style='font-family:&quot;Avenir Next&quot;, Avenir, &quot;Helvetica Neue&quot;, Helvetica, Arial, sans-serif; font-size:15px;' target='_blank' rel='nofollow ugc noopener noreferrer'>story</a><span style='font-family:inherit; font-size:medium; color:rgb(0, 0, 0);'><br /></span></p><p style='font-family:&quot;Avenir Next W01&quot;, &quot;Avenir Next W00&quot;, &quot;Avenir Next&quot;, Avenir, &quot;Helvetica Neue&quot;, sans-serif; font-size:16px; margin-top:0px; margin-bottom:1.5rem; background-image:initial; background-position:initial; background-size:initial; background-repeat:initial; background-attachment:initial; background-origin:initial; background-clip:initial;'><img alt='Sample result1' src='https://user-images.githubusercontent.com/62361535/194192472-1d1b4332-de76-43f4-aff8-d0d77fd2537c.png' /></p><p style='font-family:&quot;Avenir Next W01&quot;, &quot;Avenir Next W00&quot;, &quot;Avenir Next&quot;, Avenir, &quot;Helvetica Neue&quot;, sans-serif; font-size:16px; margin-top:0px; margin-bottom:1.5rem; background-image:initial; background-position:initial; background-size:initial; background-repeat:initial; background-attachment:initial; background-origin:initial; background-clip:initial;'><img alt='sampleResult2' src='https://user-images.githubusercontent.com/62361535/194192589-349c796b-7f9c-4de8-b636-8fe7771cd1b2.png' style='font-family:&quot;Avenir Next&quot;, Avenir, &quot;Helvetica Neue&quot;, Helvetica, Arial, sans-serif; font-size:15px;' /><font color='#000000'><font size='3' style='font-family:inherit;'><br /></font></font></p></div></div>",
			"keyword": [
				"Deep Learning",
				"Eagle Technology",
				"New Zealand",
				"Car Detection",
				"dlpk",
				"deep learning",
				"NZ",
				"eaglegis"
			],
			"issued": "2022-10-06T00:28:50.000Z",
			"modified": "2023-04-21T05:24:49.000Z",
			"publisher": {
				"name": "Eagle Technology Group Ltd"
			},
			"contactPoint": {
				"@type": "vcard:Contact",
				"fn": "eaglegis",
				"hasEmail": "mailto:ts@eaglegis.co.nz"
			},
			"accessLevel": "public",
			"spatial": "163.8527,-47.6571,179.5732,-34.0089",
			"license": "https://creativecommons.org/licenses/by/4.0",
			"distribution": [
				{
					"@type": "dcat:Distribution",
					"title": "ArcGIS Hub Dataset",
					"format": "Web Page",
					"mediaType": "text/html",
					"accessURL": "https://www.pacificgeoportal.com/content/eaglegis::car-detection-new-zealand"
				}
			],
			"theme": [
				"geospatial"
			]
		},
		{
			"@type": "dcat:Dataset",
			"identifier": "https://www.arcgis.com/home/item.html?id=23d46b7e7f7d41abae01885b64834af8",
			"landingPage": "https://www.pacificgeoportal.com/content/eaglegis::solar-panel-detection-new-zealand",
			"title": "Solar Panel Detection - New Zealand",
			"description": "<div><font color='#000000' face='Avenir Next W01, Avenir Next W00, Avenir Next, Avenir, Helvetica Neue, sans-serif'><span style='font-size:3;'>This New Zealand solar panel detection Deep Learning Package can detect solar panels from high resolution imagery. This model is trained on high resolution imagery from New Zealand.</span></font></div><div><font color='#000000' face='Avenir Next W01, Avenir Next W00, Avenir Next, Avenir, Helvetica Neue, sans-serif'><span style='font-size:3;'><br /></span></font></div><div><font color='#000000' face='Avenir Next W01, Avenir Next W00, Avenir Next, Avenir, Helvetica Neue, sans-serif'><span style='font-size:3;'>Solar power is environmentally friendly and is being promoted by government agencies and power distribution companies. Government agencies can use solar panel detection to offer incentives such as tax exemptions and credits to residents who have installed solar panels. Policymakers can use it to gauge adoption and frame schemes to spread awareness and promote solar power utilization in areas that lack its use. This information can also serve as an input to solar panel installation and utility companies and help redirect their marketing efforts.</span></font><br /><p style='margin:12pt 0cm; font-family:&quot;Avenir Next W01&quot;, &quot;Avenir Next W00&quot;, &quot;Avenir Next&quot;, Avenir, &quot;Helvetica Neue&quot;, sans-serif; font-size:16px; font-weight:400; background-image:initial; background-position:initial; background-size:initial; background-repeat:initial; background-attachment:initial; background-origin:initial; background-clip:initial;'><font color='#000000' style='font-family:inherit;'><span style='font-family:inherit;'><span style='font-family:inherit;'>Traditional ways of obtaining information on solar panel installation, such as surveys and on-site visits, are time consuming and error-prone. </span></span><span style='font-family:&quot;Avenir Next&quot;, Avenir, &quot;Helvetica Neue&quot;, Helvetica, Arial, sans-serif;'>Deep learning models are highly capable of learning complex semantics and can produce superior results. </span><span style='font-family:inherit;'> Use this deep learning model to automate the task of solar panel detection, reducing time and effort required significantly.</span></font></p><div><br /></div><div style='padding-bottom:0.375rem; max-width:100%; display:inherit;'><p style='margin-top:0px; margin-bottom:0.0001pt; font-family:&quot;Avenir Next W01&quot;, &quot;Avenir Next W00&quot;, &quot;Avenir Next&quot;, Avenir, &quot;Helvetica Neue&quot;, sans-serif; font-size:16px; background-image:initial; background-position:initial; background-size:initial; background-repeat:initial; background-attachment:initial; background-origin:initial; background-clip:initial;'><font color='#000000' size='4' style='font-family:inherit;'><b>Licensing requirements<br /></b></font></p><p style='margin:0in 52.9pt 0.95pt 0in; font-family:&quot;Avenir Next W01&quot;, &quot;Avenir Next W00&quot;, &quot;Avenir Next&quot;, Avenir, &quot;Helvetica Neue&quot;, sans-serif; font-size:16px;'><font color='#000000' style='font-family:inherit;'><span style='font-family:inherit; font-size:medium;'>ArcGIS Desktop</span><i> –</i><span style='font-family:inherit; font-size:medium;'> ArcGIS Image Analyst </span><span style='font-family:inherit; font-size:medium;'>extension for ArcGIS Pro</span></font></p><p style='margin:0in 52.9pt 0.95pt 0in; font-family:&quot;Avenir Next W01&quot;, &quot;Avenir Next W00&quot;, &quot;Avenir Next&quot;, Avenir, &quot;Helvetica Neue&quot;, sans-serif; font-size:16px;'><span style='font-family:inherit; color:rgb(0, 0, 0); font-size:medium;'>ArcGIS Online – ArcGIS Image for ArcGIS Online</span><br /></p><div style='font-family:inherit; font-size:16px;'><font color='#000000' style='font-family:inherit;'><br /></font></div><div><p style='margin-top:0px; margin-bottom:1.5rem; font-family:inherit; font-size:16px; background-image:initial; background-position:initial; background-size:initial; background-repeat:initial; background-attachment:initial; background-origin:initial; background-clip:initial;'><font color='#000000' style='font-family:inherit;'><b><font size='4' style='font-family:inherit;'>Using the model<br /></font></b></font><font color='#000000' style='font-family:inherit; text-align:justify;'>Follow the </font><a href='https://doc.arcgis.com/en/pretrained-models/latest/imagery/using-solar-panel-detection-usa.htm' target='_blank' rel='nofollow ugc noopener noreferrer'>guide</a><font color='#000000' style='font-family:inherit; text-align:justify;'> to use the model. Before using this model,</font><font color='#000000' style='font-family:inherit;'><font style='text-align:justify;'> ensure that the supported deep learning </font><span style='text-align:justify; font-size:17px;'>libraries </span><font style='text-align:justify;'>are installed.</font><span style='font-family:inherit; text-align:justify;'> </span><span style='text-align:justify; font-size:medium;'>For more details, check </span></font><a href='https://github.com/esri/deep-learning-frameworks' target='_blank' rel='nofollow ugc noopener noreferrer'>Deep Learning Libraries Installer for ArcGIS</a><font color='#000000' style='font-family:inherit;'>.</font></p><p style='margin-top:0px; margin-bottom:1.5rem; background-image:initial; background-position:initial; background-size:initial; background-repeat:initial; background-attachment:initial; background-origin:initial; background-clip:initial;'><font color='#000000'><font face='inherit'><span style='font-size:16px;'>When using the Detect Objects using Deep Learning geoprocessing tool, ticking the Non Maximum Suppression box is </span></font><font face='Avenir Next W01, Avenir Next W00, Avenir Next, Avenir, Helvetica Neue, sans-serif'><span style='font-size:16px;'>recommended, for reference a Max Overlap Ratio of 0.3 was used for the example images below. </span></font></font></p><p style='margin-top:0px; margin-bottom:0px; font-family:inherit; font-size:16px;'></p><p style='margin-top:0px; margin-bottom:1.5rem; font-family:inherit; font-size:16px; background-image:initial; background-position:initial; background-size:initial; background-repeat:initial; background-attachment:initial; background-origin:initial; background-clip:initial;'><font color='#000000' style='font-family:inherit;'>Note: Deep learning is computationally intensive, and a powerful GPU is recommended to process large datasets.<br /></font></p></div><p style='margin-top:0px; margin-bottom:0px; font-family:&quot;Avenir Next W01&quot;, &quot;Avenir Next W00&quot;, &quot;Avenir Next&quot;, Avenir, &quot;Helvetica Neue&quot;, sans-serif; font-size:16px;'></p><p style='margin-top:12pt; margin-bottom:1.5rem; font-family:&quot;Avenir Next W01&quot;, &quot;Avenir Next W00&quot;, &quot;Avenir Next&quot;, Avenir, &quot;Helvetica Neue&quot;, sans-serif; font-size:16px;'><font color='#000000' style='font-family:inherit;'><b><font size='4' style='font-family:inherit;'>Input</font></b><span style='font-family:&quot;Times New Roman&quot;, serif;'><font size='4' style='font-family:inherit;'><b><br /></b></font></span>High resolution (7.5 cm) RGB imagery.</font></p><p style='margin-top:12pt; margin-bottom:1.5rem; font-family:&quot;Avenir Next W01&quot;, &quot;Avenir Next W00&quot;, &quot;Avenir Next&quot;, Avenir, &quot;Helvetica Neue&quot;, sans-serif;'><font color='#000000' style='font-family:inherit;'><b><font size='4'>Output</font></b><span style='font-size:16px; font-family:&quot;Times New Roman&quot;, serif;'><font size='4' style='font-family:inherit;'><b><br /></b></font></span><span style='font-size:16px;'>Feature class containing detected solar panels.</span><br /><br /><b><font size='4' style='font-family:inherit;'>Applicable geographies</font><br /></b><span style='font-size:16px;'>The model is expected to work well in New Zealand.</span><br /></font></p><font color='#000000' style='font-family:inherit; font-size:16px;'><b><font size='4' style='font-family:inherit;'>Model architecture</font><br /></b>This model uses the </font><a href='https://developers.arcgis.com/python/guide/how-maskrcnn-works/' style='font-family:&quot;Avenir Next W01&quot;, &quot;Avenir Next W00&quot;, &quot;Avenir Next&quot;, Avenir, &quot;Helvetica Neue&quot;, sans-serif; font-size:16px;' target='_blank' rel='nofollow ugc noopener noreferrer'>MaskRCNN</a><font color='#000000' style='font-family:inherit; font-size:16px;'> model architecture implemented in ArcGIS API for Python.<br /><br /><b><font size='4' style='font-family:inherit;'>Accuracy metrics</font><br /></b>This model has an average precision score of 0.83.</font></div><div style='padding-bottom:0.375rem; max-width:100%; display:inherit;'><font color='#000000' style='font-family:inherit; font-size:16px;'><br /><b><font size='4' style='font-family:inherit;'>Sample results</font><br /></b></font><font color='#000000'>Some results from the model are displayed below: <br />To learn how to use this model, see this </font><a href='https://storymaps.arcgis.com/stories/b9de83bf40644200a946ec5575efb56d' target='_blank' rel='nofollow ugc noopener noreferrer'>story</a></div><div style='padding-bottom:0.375rem; max-width:100%; display:inherit;'><img src='https://user-images.githubusercontent.com/62361535/211974620-a7f1190e-d56c-453e-994d-50bf372f8d30.PNG' /><br /></div><div style='padding-bottom:0.375rem; max-width:100%; display:inherit;'><br /></div><div style='padding-bottom:0.375rem; max-width:100%; display:inherit;'><img src='https://user-images.githubusercontent.com/62361535/211974588-0be62ca7-5dfa-47f1-8b0a-a916f7e3c4ef.PNG' /><br /></div><div style='padding-bottom:0.375rem; max-width:100%; display:inherit;'><font color='#000000'><br /></font></div></div>",
			"keyword": [
				"Deep Learning",
				"Eagle Technology",
				"New Zealand",
				"Kiwi",
				"Solar",
				"Solar Panels",
				"dlpk",
				"deep learning",
				"NZ",
				"eaglegis"
			],
			"issued": "2023-01-12T23:14:13.000Z",
			"modified": "2023-04-21T05:23:40.000Z",
			"publisher": {
				"name": "Eagle Technology Group Ltd"
			},
			"contactPoint": {
				"@type": "vcard:Contact",
				"fn": "eaglegis",
				"hasEmail": "mailto:ts@eaglegis.co.nz"
			},
			"accessLevel": "public",
			"spatial": "163.8527,-47.6571,179.5732,-34.0089",
			"license": "https://creativecommons.org/licenses/by/4.0",
			"distribution": [
				{
					"@type": "dcat:Distribution",
					"title": "ArcGIS Hub Dataset",
					"format": "Web Page",
					"mediaType": "text/html",
					"accessURL": "https://www.pacificgeoportal.com/content/eaglegis::solar-panel-detection-new-zealand"
				}
			],
			"theme": [
				"geospatial"
			]
		},
		{
			"@type": "dcat:Dataset",
			"identifier": "https://www.arcgis.com/home/item.html?id=fbd0e89c7220421e92365910ce5aefa4&sublayer=0",
			"landingPage": "https://www.pacificgeoportal.com/datasets/eaglegis::nz-functional-urban-areas-current",
			"title": "NZ Functional Urban Areas - Current",
			"description": "<div><font size='3' style='font-family:&quot;Avenir Next W01&quot;, &quot;Avenir Next W00&quot;, &quot;Avenir Next&quot;, Avenir, &quot;Helvetica Neue&quot;, Helvetica, Arial, sans-serif !important;'>Topicality: 01-01-2023</font></div><div><font size='3'><span style='font-family:&quot;Avenir Next W01&quot;, &quot;Avenir Next W00&quot;, &quot;Avenir Next&quot;, Avenir, &quot;Helvetica Neue&quot;, Helvetica, Arial, sans-serif; font-size:medium;'>Projection: New Zealand Transverse Mercator (NZTM)</span></font></div><div><font size='3'><br /></font></div><div><font size='3'>This layer contains the latest set of the functional urban areas as maintained by StatsNZ and defined by StatsNZ.</font></div><div><font size='3'><br /></font></div><div><font size='3'>The functional urban area (FUA) classification identifies small urban areas and rural areas that are integrated with major, large, and medium urban areas to create FUAs. The FUA classification uses the urban rural (UR) geography to demarcate urban areas, and statistical area 1 areas(SA1s) to demarcate surrounding hinterland (the commuting zone) within FUAs, and rural and water areas outside FUAs.</font></div><div><font size='3'><br /></font></div><div><font size='3'>This layer get updated yearly with the latest boundary data.<font style='font-family:&quot;Avenir Next W01&quot;, &quot;Avenir Next W00&quot;, &quot;Avenir Next&quot;, Avenir, &quot;Helvetica Neue&quot;, Helvetica, Arial, sans-serif;'>\n You can use this layer when you need any year of boundary data in your \nmap. By setting a filter on the dataset year you can filter on specific \nyear of the dataset.</font></font><div><font size='3' style='font-family:&quot;Avenir Next W01&quot;, &quot;Avenir Next W00&quot;, &quot;Avenir Next&quot;, Avenir, &quot;Helvetica Neue&quot;, Helvetica, Arial, sans-serif;'><br /></font></div><font size='3'>For information about the fields in this dataset go to the Data tab</font><font size='3'><span style='font-weight:bold;'><br /></span></font></div><div><font size='3'><span style='font-weight:bold;'><br /></span></font></div><div><font size='3'><span style='font-weight:bold;'>FUA type (TFUA)</span></font></div><div><font size='3'>FUAs are further categorised by population size. The urban core’s \npopulation rather than the entire FUA’s population is used to maintain \nconsistency between the descriptions of UR urban area and FUA type. <br /></font><p><font size='3'>The \ncategories are, by code:</font></p>\n<font size='3'>​1. Metropolitan area – more than 100,000 residents living in the urban core<br />2. Large regional centre – urban core population 30,000–99,999<br />3. Medium regional centre – urban core population 10,000–29,999<br /></font></div><div><font size='3'>4. Small regional centre – urban core population 5,000–9,999<br /></font></div><div><font size='3'>9. Area outside functional urban area</font></div><div><font size='3'><br /></font></div><div><font size='3'>​The Greymouth urban area population is less than 10,000 but is \nclassified as a medium regional centre, consistent with its treatment as\n a medium urban area in the UA classification.<br /></font>\n<p><font size='3'>​To differentiate from the UR classification, when referring to FUAs \nby name, their FUA type should also be mentioned, for example, \nChristchurch metropolitan area, Whangarei regional centre.</font></p>\n<p><font size='3'><span style='font-weight:bold;'>​FUA indicator (IFUA)</span><br />The IFUA classifies UR2023 urban areas and rural SA1s according to \ntheir character within their FUA. The indicators, with their codes in \nbrackets, are:</font></p>\n<ul><li><font size='3'>urban area within functional urban area – urban core (101), secondary urban core (102), satellite urban area (103),</font></li><li><font size='3'>rural area within functional urban area – hinterland (201)</font></li><li><font size='3'>area outside functional urban area – land area outside functional \nurban area (901), water area outside functional urban area (902).</font></li></ul><div><div><span style='font-weight:bold;'>About the layer</span><br /><ul><li><font face='Avenir Next W01, Avenir Next W00, Avenir Next, Avenir, Helvetica Neue, Helvetica, Arial, sans-serif' size='3'>This layer get updated yearly with the latest boundary data.</font></li><li><font face='Avenir Next W01, Avenir Next W00, Avenir Next, Avenir, Helvetica Neue, Helvetica, Arial, sans-serif' size='3'><font style='font-family:&quot;Avenir Next W01&quot;, &quot;Avenir Next W00&quot;, &quot;Avenir Next&quot;, Avenir, &quot;Helvetica Neue&quot;, Helvetica, Arial, sans-serif;'>A layer with the full archive of the data for all the available years is available </font></font><a href='https://www.arcgis.com/home/item.html?id=fca8fe85142f45e99b264fe8c1ce6870' target='_blank' rel='nofollow ugc noopener noreferrer'>here.</a></li><li><font face='Avenir Next W01, Avenir Next W00, Avenir Next, Avenir, Helvetica Neue, Helvetica, Arial, sans-serif' size='3'>For information about the fields in this dataset go to the Data tab.</font></li></ul></div><div><font size='3'>The layer is further generalised by Eagle Technology for improved performance on the web, <span style='font-family:&quot;Avenir Next W01&quot;, &quot;Avenir Next W00&quot;, &quot;Avenir Next&quot;, Avenir, &quot;Helvetica Neue&quot;, sans-serif;'>therefore it doesn't fully represent the official boundaries.</span></font></div><div style='font-family:&quot;Avenir Next W01&quot;, &quot;Avenir Next W00&quot;, &quot;Avenir Next&quot;, Avenir, &quot;Helvetica Neue&quot;, Helvetica, Arial, sans-serif !important;'><div><font size='3'><br /></font></div><div><font size='3' style='font-family:&quot;Avenir Next W01&quot;, &quot;Avenir Next W00&quot;, &quot;Avenir Next&quot;, Avenir, &quot;Helvetica Neue&quot;, Helvetica, Arial, sans-serif;'>The official dataset can be found on<font face='Avenir Next W01, Avenir Next W00, Avenir Next, Avenir, Helvetica Neue, Helvetica, Arial, sans-serif'> </font></font><a href='https://datafinder.stats.govt.nz/data/category/annual-boundaries/' target='_blank' rel='nofollow ugc noopener noreferrer'>https://datafinder.stats.govt.nz.</a></div><div><font size='3'><br /></font></div></div><div style='font-family:&quot;Avenir Next W01&quot;, &quot;Avenir Next W00&quot;, &quot;Avenir Next&quot;, Avenir, &quot;Helvetica Neue&quot;, Helvetica, Arial, sans-serif !important; font-size:17px;'><div><font color='#2f4f4f' size='3'>This\n layer is offered by Eagle Technology (Official Esri Distributor). Eagle\n Technology offers services that can be used in the ArcGIS platform. The\n Content team at Eagle Technology updates the layers on a regular basis \nand regularly adds new content to the Living Atlas. By using this \ncontent and combining it with other data you can create new information \nproducts quickly and easily.</font></div><div><font color='#2f4f4f' size='3'><br /></font></div><div><font color='#2f4f4f' size='3'>If you have any questions or comments about the content, please let us now  at </font><font size='3'><a href='mailto:livingatlas@eagle.co.nz' style='color:rgb(0, 121, 193); text-decoration-line:none;' target='_blank' rel='nofollow ugc noopener noreferrer'>livingatlas@eagle.co.nz</a></font></div></div></div></div>",
			"keyword": [
				"Boundary",
				"Boundaries",
				"New zealand",
				"Statistics New Zealand",
				"StatsNZ",
				"Eagle technology",
				"Nz",
				"Content",
				"Kiwi",
				"eaglegis"
			],
			"issued": "2023-04-05T10:13:54.000Z",
			"modified": "2025-12-19T00:26:38.084Z",
			"publisher": {
				"name": "Eagle Technology Group Ltd"
			},
			"contactPoint": {
				"@type": "vcard:Contact",
				"fn": "eaglegis",
				"hasEmail": "mailto:ts@eaglegis.co.nz"
			},
			"accessLevel": "public",
			"spatial": "166.2620,-47.2230,-177.6189,-33.7734",
			"license": "https://creativecommons.org/licenses/by/4.0",
			"distribution": [
				{
					"@type": "dcat:Distribution",
					"title": "ArcGIS Hub Dataset",
					"format": "Web Page",
					"mediaType": "text/html",
					"accessURL": "https://www.pacificgeoportal.com/datasets/eaglegis::nz-functional-urban-areas-current"
				},
				{
					"@type": "dcat:Distribution",
					"title": "ArcGIS GeoService",
					"format": "ArcGIS GeoServices REST API",
					"mediaType": "application/json",
					"accessURL": "https://services.arcgis.com/XTtANUDT8Va4DLwI/arcgis/rest/services/nz_functional_urban_areas/FeatureServer/0"
				},
				{
					"@type": "dcat:Distribution",
					"title": "CSV",
					"format": "CSV",
					"mediaType": "text/csv",
					"accessURL": "https://www.pacificgeoportal.com/api/download/v1/items/fbd0e89c7220421e92365910ce5aefa4/csv?layers=0"
				},
				{
					"@type": "dcat:Distribution",
					"title": "Shapefile",
					"format": "ZIP",
					"mediaType": "application/zip",
					"accessURL": "https://www.pacificgeoportal.com/api/download/v1/items/fbd0e89c7220421e92365910ce5aefa4/shapefile?layers=0"
				},
				{
					"@type": "dcat:Distribution",
					"title": "GeoJSON",
					"format": "GeoJSON",
					"mediaType": "application/vnd.geo+json",
					"accessURL": "https://www.pacificgeoportal.com/api/download/v1/items/fbd0e89c7220421e92365910ce5aefa4/geojson?layers=0"
				},
				{
					"@type": "dcat:Distribution",
					"title": "KML",
					"format": "KML",
					"mediaType": "application/vnd.google-earth.kml+xml",
					"accessURL": "https://www.pacificgeoportal.com/api/download/v1/items/fbd0e89c7220421e92365910ce5aefa4/kml?layers=0"
				}
			],
			"theme": [
				"geospatial"
			]
		},
		{
			"@type": "dcat:Dataset",
			"identifier": "https://www.arcgis.com/home/item.html?id=fca8fe85142f45e99b264fe8c1ce6870&sublayer=0",
			"landingPage": "https://www.pacificgeoportal.com/datasets/eaglegis::nz-functional-urban-areas-archive",
			"title": "NZ Functional Urban Areas - Archive",
			"description": "<div><font size='3' style='font-family:&quot;Avenir Next W01&quot;, &quot;Avenir Next W00&quot;, &quot;Avenir Next&quot;, Avenir, &quot;Helvetica Neue&quot;, Helvetica, Arial, sans-serif !important;'>Topicality: 01-01-2023</font></div><div><font size='3'><span style='font-family:&quot;Avenir Next W01&quot;, &quot;Avenir Next W00&quot;, &quot;Avenir Next&quot;, Avenir, &quot;Helvetica Neue&quot;, Helvetica, Arial, sans-serif; font-size:medium;'>Projection: New Zealand Transverse Mercator (NZTM)</span></font></div><div><font size='3'><br /></font></div><div><font size='3'>This layer contains the archive of the functional urban areas as maintained by StatsNZ and defined by StatsNZ.</font></div><div><font size='3'><br /></font></div><div><font size='3'>The functional urban area (FUA) classification identifies small urban areas and rural areas that are integrated with major, large, and medium urban areas to create FUAs. The FUA classification uses the urban rural (UR) geography to demarcate urban areas, and statistical area 1 areas(SA1s) to demarcate surrounding hinterland (the commuting zone) within FUAs, and rural and water areas outside FUAs.</font></div><div><font size='3'><br /></font></div><div><font size='3'>This layer get updated yearly with the latest boundary data.<font style='font-family:&quot;Avenir Next W01&quot;, &quot;Avenir Next W00&quot;, &quot;Avenir Next&quot;, Avenir, &quot;Helvetica Neue&quot;, Helvetica, Arial, sans-serif;'>\n You can use this layer when you need any year of boundary data in your \nmap. By setting a filter on the dataset year you can filter on specific \nyear of the dataset.</font></font><div><font size='3' style='font-family:&quot;Avenir Next W01&quot;, &quot;Avenir Next W00&quot;, &quot;Avenir Next&quot;, Avenir, &quot;Helvetica Neue&quot;, Helvetica, Arial, sans-serif;'><br /></font></div><font size='3'>For information about the fields in this dataset go to the Data tab</font><font size='3'><span style='font-weight:bold;'><br /></span></font></div><div><font size='3'><span style='font-weight:bold;'><br /></span></font></div><div><font size='3'><span style='font-weight:bold;'>FUA type (TFUA)</span></font></div><div><font size='3'>FUAs are further categorised by population size. The urban core’s \npopulation rather than the entire FUA’s population is used to maintain \nconsistency between the descriptions of UR urban area and FUA type. <br /></font><p><font size='3'>The \ncategories are, by code:</font></p>\n<font size='3'>​1. Metropolitan area – more than 100,000 residents living in the urban core<br />2. Large regional centre – urban core population 30,000–99,999<br />3. Medium regional centre – urban core population 10,000–29,999<br /></font></div><div><font size='3'>4. Small regional centre – urban core population 5,000–9,999<br /></font></div><div><font size='3'>9. Area outside functional urban area</font></div><div><font size='3'><br /></font></div><div><font size='3'>​The Greymouth urban area population is less than 10,000 but is \nclassified as a medium regional centre, consistent with its treatment as\n a medium urban area in the UA classification.<br /></font>\n<p><font size='3'>​To differentiate from the UR classification, when referring to FUAs \nby name, their FUA type should also be mentioned, for example, \nChristchurch metropolitan area, Whangarei regional centre.</font></p>\n<p><font size='3'><span style='font-weight:bold;'>​FUA indicator (IFUA)</span><br />The IFUA classifies UR2023 urban areas and rural SA1s according to \ntheir character within their FUA. The indicators, with their codes in \nbrackets, are:</font></p>\n<ul><li><font size='3'>urban area within functional urban area – urban core (101), secondary urban core (102), satellite urban area (103),</font></li><li><font size='3'>rural area within functional urban area – hinterland (201)</font></li><li><font size='3'>area outside functional urban area – land area outside functional \nurban area (901), water area outside functional urban area (902).</font></li></ul><div><div><font size='3'>The layer is further generalised by Eagle Technology for improved performance on the web, <span style='font-family:&quot;Avenir Next W01&quot;, &quot;Avenir Next W00&quot;, &quot;Avenir Next&quot;, Avenir, &quot;Helvetica Neue&quot;, sans-serif;'>therefore it doesn't fully represent the official boundaries.</span></font></div><div><font size='3' style='font-family:&quot;Avenir Next W01&quot;, &quot;Avenir Next W00&quot;, &quot;Avenir Next&quot;, Avenir, &quot;Helvetica Neue&quot;, Helvetica, Arial, sans-serif;'><br /></font></div><font size='3' style='font-family:&quot;Avenir Next W01&quot;, &quot;Avenir Next W00&quot;, &quot;Avenir Next&quot;, Avenir, &quot;Helvetica Neue&quot;, Helvetica, Arial, sans-serif;'>If\n you only need the latest boundary data in your map you can use the </font><a href='https://www.arcgis.com/home/item.html?id=fbd0e89c7220421e92365910ce5aefa4' target='_blank' rel='nofollow ugc noopener noreferrer'>current version</a><font size='3' style='font-family:&quot;Avenir Next W01&quot;, &quot;Avenir Next W00&quot;, &quot;Avenir Next&quot;, Avenir, &quot;Helvetica Neue&quot;, Helvetica, Arial, sans-serif;'> of this dataset. All the current versions of Stats NZ \nBoundary layers can be found <a href='https://www.arcgis.com/home/group.html?id=b22e4f0012a8426dac21cd3d02f25c67' target='_blank' rel='nofollow ugc noopener noreferrer'>here</a>.</font><div style='font-family:&quot;Avenir Next W01&quot;, &quot;Avenir Next W00&quot;, &quot;Avenir Next&quot;, Avenir, &quot;Helvetica Neue&quot;, Helvetica, Arial, sans-serif !important;'><div><font size='3'><br /></font></div><div><font size='3' style='font-family:&quot;Avenir Next W01&quot;, &quot;Avenir Next W00&quot;, &quot;Avenir Next&quot;, Avenir, &quot;Helvetica Neue&quot;, Helvetica, Arial, sans-serif;'>The official dataset can be found on<font face='Avenir Next W01, Avenir Next W00, Avenir Next, Avenir, Helvetica Neue, Helvetica, Arial, sans-serif'> </font></font><font size='3'><a href='https://datafinder.stats.govt.nz/data/category/annual-boundaries/2022/' target='_blank' rel='nofollow ugc noopener noreferrer'>https://datafinder.stats.govt.nz.</a></font></div><div><font size='3'><br /></font></div></div><div style='font-family:&quot;Avenir Next W01&quot;, &quot;Avenir Next W00&quot;, &quot;Avenir Next&quot;, Avenir, &quot;Helvetica Neue&quot;, Helvetica, Arial, sans-serif !important; font-size:17px;'><div><font color='#2f4f4f' size='3'>This\n layer is offered by Eagle Technology (Official Esri Distributor). Eagle\n Technology offers services that can be used in the ArcGIS platform. The\n Content team at Eagle Technology updates the layers on a regular basis \nand regularly adds new content to the Living Atlas. By using this \ncontent and combining it with other data you can create new information \nproducts quickly and easily.</font></div><div><font color='#2f4f4f' size='3'><br /></font></div><div><font color='#2f4f4f' size='3'>If you have any questions or comments about the content, please let us now  at </font><font size='3'><a href='mailto:livingatlas@eagle.co.nz' style='color:rgb(0, 121, 193); text-decoration-line:none;' target='_blank' rel='nofollow ugc noopener noreferrer'>livingatlas@eagle.co.nz</a></font></div></div></div></div>",
			"keyword": [
				"Boundary",
				"Boundaries",
				"New zealand",
				"Statistics New Zealand",
				"StatsNZ",
				"Eagle technology",
				"Nz",
				"Content",
				"Kiwi",
				"eaglegis"
			],
			"issued": "2023-01-18T00:56:43.000Z",
			"modified": "2025-12-19T00:26:38.084Z",
			"publisher": {
				"name": "Eagle Technology Group Ltd"
			},
			"contactPoint": {
				"@type": "vcard:Contact",
				"fn": "eaglegis",
				"hasEmail": "mailto:ts@eaglegis.co.nz"
			},
			"accessLevel": "public",
			"spatial": "166.2620,-47.2230,-177.6189,-33.7734",
			"license": "https://creativecommons.org/licenses/by/4.0",
			"distribution": [
				{
					"@type": "dcat:Distribution",
					"title": "ArcGIS Hub Dataset",
					"format": "Web Page",
					"mediaType": "text/html",
					"accessURL": "https://www.pacificgeoportal.com/datasets/eaglegis::nz-functional-urban-areas-archive"
				},
				{
					"@type": "dcat:Distribution",
					"title": "ArcGIS GeoService",
					"format": "ArcGIS GeoServices REST API",
					"mediaType": "application/json",
					"accessURL": "https://services.arcgis.com/XTtANUDT8Va4DLwI/arcgis/rest/services/nz_functional_urban_areas_archive/FeatureServer/0"
				},
				{
					"@type": "dcat:Distribution",
					"title": "CSV",
					"format": "CSV",
					"mediaType": "text/csv",
					"accessURL": "https://www.pacificgeoportal.com/api/download/v1/items/fca8fe85142f45e99b264fe8c1ce6870/csv?layers=0"
				},
				{
					"@type": "dcat:Distribution",
					"title": "Shapefile",
					"format": "ZIP",
					"mediaType": "application/zip",
					"accessURL": "https://www.pacificgeoportal.com/api/download/v1/items/fca8fe85142f45e99b264fe8c1ce6870/shapefile?layers=0"
				},
				{
					"@type": "dcat:Distribution",
					"title": "GeoJSON",
					"format": "GeoJSON",
					"mediaType": "application/vnd.geo+json",
					"accessURL": "https://www.pacificgeoportal.com/api/download/v1/items/fca8fe85142f45e99b264fe8c1ce6870/geojson?layers=0"
				},
				{
					"@type": "dcat:Distribution",
					"title": "KML",
					"format": "KML",
					"mediaType": "application/vnd.google-earth.kml+xml",
					"accessURL": "https://www.pacificgeoportal.com/api/download/v1/items/fca8fe85142f45e99b264fe8c1ce6870/kml?layers=0"
				},
				{
					"@type": "dcat:Distribution",
					"title": "File Geodatabase",
					"format": "ZIP",
					"mediaType": "application/zip",
					"accessURL": "https://www.pacificgeoportal.com/api/download/v1/items/fca8fe85142f45e99b264fe8c1ce6870/filegdb?layers=0"
				},
				{
					"@type": "dcat:Distribution",
					"title": "Feature Collection",
					"format": "TXT",
					"mediaType": "text/plain",
					"accessURL": "https://www.pacificgeoportal.com/api/download/v1/items/fca8fe85142f45e99b264fe8c1ce6870/featureCollection?layers=0"
				},
				{
					"@type": "dcat:Distribution",
					"title": "Excel",
					"format": "XLSX",
					"mediaType": "application/vnd.ms-excel",
					"accessURL": "https://www.pacificgeoportal.com/api/download/v1/items/fca8fe85142f45e99b264fe8c1ce6870/excel?layers=0"
				},
				{
					"@type": "dcat:Distribution",
					"title": "GeoPackage",
					"format": "GPKG",
					"mediaType": "application/geopackage+sqlite3",
					"accessURL": "https://www.pacificgeoportal.com/api/download/v1/items/fca8fe85142f45e99b264fe8c1ce6870/geoPackage?layers=0"
				},
				{
					"@type": "dcat:Distribution",
					"title": "SQLite Geodatabase",
					"format": "GDB",
					"mediaType": "application/geopackage+sqlite3",
					"accessURL": "https://www.pacificgeoportal.com/api/download/v1/items/fca8fe85142f45e99b264fe8c1ce6870/sqlite?layers=0"
				}
			],
			"theme": [
				"geospatial"
			]
		},
		{
			"@type": "dcat:Dataset",
			"identifier": "https://www.arcgis.com/home/item.html?id=39385cbe41d6415e8b1774a6dbfef9ad",
			"landingPage": "https://www.pacificgeoportal.com/maps/esriau::what-percent-of-the-population-is-married-2021",
			"title": "What percent of the population is married?   2021",
			"description": "<p style='margin:12pt 0cm 0cm; background-image:initial; background-position:initial; background-size:initial; background-repeat:initial; background-attachment:initial; background-origin:initial; background-clip:initial;'><font face='Calibri Light, sans-serif' size='3'>This map shows the percentage of the population that is married. Data is available for Country, Greater Capital City Statistical Area (GCCSA), Local Government Area (LGA), Statistical Area Level 1 (SA1) and 2 (SA2), and State Suburb (SSC) boundaries.</font></p><p style='margin:12pt 0cm 0cm; background-image:initial; background-position:initial; background-size:initial; background-repeat:initial; background-attachment:initial; background-origin:initial; background-clip:initial;'><font face='Calibri Light, sans-serif' size='3'>This map contains layers that contain some of the more commonly used variables from the </font><font size='3' style='font-family:&quot;Avenir Next W01&quot;, &quot;Avenir Next W00&quot;, &quot;Avenir Next&quot;, Avenir, &quot;Helvetica Neue&quot;, sans-serif;'><span style='font-family:&quot;Calibri Light&quot;, sans-serif; color:black;'><a href='https://www.abs.gov.au/census/2021-census-data-release-plans/2021-census-product-release-guide#community-profiles' style='color:rgb(0, 121, 193); text-decoration-line:none; font-family:inherit;' target='_blank' rel='nofollow ugc noopener noreferrer'><span style='font-family:inherit;'>General Community Profile</span></a></span><span style='font-family:&quot;Calibri Light&quot;, sans-serif;'> information from the </span><span style='font-family:&quot;Calibri Light&quot;, sans-serif; color:black;'><a href='https://www.abs.gov.au/' style='color:rgb(0, 121, 193); text-decoration-line:none; font-family:inherit;' target='_blank' rel='nofollow ugc noopener noreferrer'><span style='font-family:inherit;'>Australian Bureau of Statistics</span></a></span><span style='font-family:&quot;Calibri Light&quot;, sans-serif;'> 2021 census. Data is available for Country, Greater Capital City Statistical Area (GCCSA), Local Government Area (LGA), Statistical Area Level 1 (SA1) and 2 (SA2), and Suburb and Localities (SAL) boundaries.</span></font></p><p style='margin:12pt 0cm 0cm; background-image:initial; background-position:initial; background-size:initial; background-repeat:initial; background-attachment:initial; background-origin:initial; background-clip:initial; font-family:&quot;Avenir Next W01&quot;, &quot;Avenir Next W00&quot;, &quot;Avenir Next&quot;, Avenir, &quot;Helvetica Neue&quot;, sans-serif;'><span style='font-family:&quot;Calibri Light&quot;, sans-serif;'><font size='3'>The General Community Profile contains a series of tables showing the characteristics of persons, families and dwellings in a selected geographic area. The data is based on place of usual residence (that is, where people usually live, rather than where they were counted on Census night). Community Profiles are excellent tools for researching, planning and analysing geographic areas for a number of social, economic and demographic characteristics.</font></span></p><p style='margin:12pt 0cm 0cm; background-image:initial; background-position:initial; background-size:initial; background-repeat:initial; background-attachment:initial; background-origin:initial; background-clip:initial; font-family:&quot;Avenir Next W01&quot;, &quot;Avenir Next W00&quot;, &quot;Avenir Next&quot;, Avenir, &quot;Helvetica Neue&quot;, sans-serif;'><font size='3'><span style='font-family:&quot;Calibri Light&quot;, sans-serif; color:black;'><a href='https://www.abs.gov.au/census/find-census-data/datapacks' style='color:rgb(0, 121, 193); text-decoration-line:none; font-family:inherit;' target='_blank' rel='nofollow ugc noopener noreferrer'><span style='font-family:inherit;'>Download the data here</span></a></span><span style='font-family:&quot;Calibri Light&quot;, sans-serif;'>.</span><br /></font></p><p style='margin:12pt 0cm 0cm; background-image:initial; background-position:initial; background-size:initial; background-repeat:initial; background-attachment:initial; background-origin:initial; background-clip:initial; font-family:&quot;Avenir Next W01&quot;, &quot;Avenir Next W00&quot;, &quot;Avenir Next&quot;, Avenir, &quot;Helvetica Neue&quot;, sans-serif;'><span style='font-family:&quot;Calibri Light&quot;, sans-serif;'><b><font size='3' style='font-family:inherit;'>Data and Geography notes:</font></b></span></p><ul><li><span style='font-family:&quot;Calibri Light&quot;, sans-serif;'><font size='3'>View the Readme files located in the DataPacks and GeoPackages zip files.</font></span></li><li><font size='3'><span style='font-family:&quot;Calibri Light&quot;, sans-serif;'>To access the 2021 DataPacks, visit </span><span style='font-family:&quot;Calibri Light&quot;, sans-serif; color:black;'><a href='https://www.abs.gov.au/census/find-census-data/datapacks' style='color:rgb(0, 121, 193); text-decoration-line:none; font-family:inherit;' target='_blank' rel='nofollow ugc noopener noreferrer'><span style='font-family:inherit;'>https://www.abs.gov.au/census/find-census-data/datapacks</span></a></span></font></li><li><font size='3'><span style='font-family:&quot;Calibri Light&quot;, sans-serif;'>Glossary terms and definitions of classifications can be found in the </span><span style='font-family:&quot;Calibri Light&quot;, sans-serif; color:black;'><a href='https://www.abs.gov.au/census/guide-census-data/census-dictionary/2021/glossary' style='color:rgb(0, 121, 193); text-decoration-line:none; font-family:inherit;' target='_blank' rel='nofollow ugc noopener noreferrer'><span style='font-family:inherit;'>2021 Census Dictionary</span></a></span></font></li><li><font size='3'><span style='font-family:&quot;Calibri Light&quot;, sans-serif;'>More information about Census data products is available at </span><span style='font-family:&quot;Calibri Light&quot;, sans-serif; color:black;'><a href='https://www.abs.gov.au/census/guide-census-data/about-census-tools/datapacks' style='color:rgb(0, 121, 193); text-decoration-line:none; font-family:inherit;' target='_blank' rel='nofollow ugc noopener noreferrer'><span style='font-family:inherit;'>https://www.abs.gov.au/census/guide-census-data/about-census-tools/datapacks</span></a></span></font></li></ul><p style='margin:12pt 0cm 0cm; background-image:initial; background-position:initial; background-size:initial; background-repeat:initial; background-attachment:initial; background-origin:initial; background-clip:initial; font-family:&quot;Avenir Next W01&quot;, &quot;Avenir Next W00&quot;, &quot;Avenir Next&quot;, Avenir, &quot;Helvetica Neue&quot;, sans-serif;'><span style='font-family:&quot;Calibri Light&quot;, sans-serif;'><b><font size='3'>Detailed geography information: </font></b></span></p><ul><li><font size='3'><span style='font-family:&quot;Calibri Light&quot;, sans-serif; color:black;'><a href='https://www.abs.gov.au/statistics/standards/australian-statistical-geography-standard-asgs-edition-3/jul2021-jun2026/main-structure-and-greater-capital-city-statistical-areas' style='color:rgb(0, 121, 193); text-decoration-line:none; font-family:inherit;' target='_blank' rel='nofollow ugc noopener noreferrer'><span style='font-family:inherit;'>https://www.abs.gov.au/statistics/standards/australian-statistical-geography-standard-asgs-edition-3/jul2021-jun2026/main-structure-and-greater-capital-city-statistical-areas</span></a></span><span style='font-family:&quot;Calibri Light&quot;, sans-serif;'>: 2021 Statistical Area Level 1 (SA1), 2021 Statistical Area Level 2 (SA2), 2021 Greater Capital City Statistical Areas (GCCSA), 2021 Australia (AUS)</span></font></li><li><font size='3'><span style='font-family:&quot;Calibri Light&quot;, sans-serif; color:black;'><a href='https://www.abs.gov.au/statistics/standards/australian-statistical-geography-standard-asgs-edition-3/jul2021-jun2026/non-abs-structures' style='color:rgb(0, 121, 193); text-decoration-line:none; font-family:inherit;' target='_blank' rel='nofollow ugc noopener noreferrer'><span style='font-family:inherit;'>https://www.abs.gov.au/statistics/standards/australian-statistical-geography-standard-asgs-edition-3/jul2021-jun2026/non-abs-structures</span></a></span><span style='font-family:&quot;Calibri Light&quot;, sans-serif;'>: 2021 Suburbs and Localities (SAL), 2021 Local Government Areas (LGA)</span></font></li></ul><p style='margin-top:0px; margin-bottom:0cm; background-image:initial; background-position:initial; background-size:initial; background-repeat:initial; background-attachment:initial; background-origin:initial; background-clip:initial; font-family:&quot;Avenir Next W01&quot;, &quot;Avenir Next W00&quot;, &quot;Avenir Next&quot;, Avenir, &quot;Helvetica Neue&quot;, sans-serif;'><span style='font-family:&quot;Calibri Light&quot;, sans-serif;'><font size='3'>Please note that there are data assumptions that should be considered when analysing the ABS Census data. These are detailed within the Census documents referenced above. These include:</font></span></p><ul><li><span style='font-family:&quot;Calibri Light&quot;, sans-serif;'><font size='3'>Registered Marital Status<br />In December 2017, amendments to the Marriage Act 1961 came into effect enabling marriage equality for all couples. For 2021, registered marriages include all couples.</font></span></li><li><span style='font-family:&quot;Calibri Light&quot;, sans-serif;'><font size='3'>Core Activity Need for Assistance<br />Measures the number of people with a profound or severe core activity limitation. People with a profound or severe core activity limitation are those needing assistance in their day to day lives in one or more of the three core activity areas of self-care, mobility and communication because of a long-term health condition (lasting six months or more), a disability (lasting six months or more), or old age. </font></span></li><li><span style='font-family:&quot;Calibri Light&quot;, sans-serif;'><font size='3'>Number of Motor Vehicles<br />Excludes motorbikes, motor scooters and heavy vehicles.</font></span></li></ul><p style='margin-top:0px; margin-bottom:0cm; background-image:initial; background-position:initial; background-size:initial; background-repeat:initial; background-attachment:initial; background-origin:initial; background-clip:initial; font-family:&quot;Avenir Next W01&quot;, &quot;Avenir Next W00&quot;, &quot;Avenir Next&quot;, Avenir, &quot;Helvetica Neue&quot;, sans-serif;'><span style='font-family:&quot;Calibri Light&quot;, sans-serif;'><font size='3'>Please note that there are small random adjustments made to all cell values to protect the confidentiality of data. These adjustments may cause the sum of rows or columns to differ by small amounts from table totals.</font></span></p><div style='font-family:&quot;Avenir Next W01&quot;, &quot;Avenir Next W00&quot;, &quot;Avenir Next&quot;, Avenir, &quot;Helvetica Neue&quot;, sans-serif;'><font size='3'><b>Source</b>: <a href='https://www.abs.gov.au/' style='color:rgb(0, 121, 193); text-decoration-line:none; font-family:inherit;' target='_blank' rel='nofollow ugc noopener noreferrer'>Australian Bureau of Statistics</a></font></div><p style='margin-top:0px; margin-bottom:0.75rem; font-family:&quot;Avenir Next W01&quot;, &quot;Avenir Next W00&quot;, &quot;Avenir Next&quot;, Avenir, &quot;Helvetica Neue&quot;, sans-serif; max-width:100%;'><span style='font-family:inherit; max-width:100%; display:inherit;'></span></p><div style='font-family:&quot;Avenir Next W01&quot;, &quot;Avenir Next W00&quot;, &quot;Avenir Next&quot;, Avenir, &quot;Helvetica Neue&quot;, sans-serif;'><font size='3'><img src='https://urbanobservatory.maps.arcgis.com/sharing/rest/content/items/30ad1685fb2e4701b49dccd0d23cc975/data' style='max-width:100%; height:auto;' /></font></div>",
			"keyword": [
				"ABS",
				"marital status",
				"married",
				"divorced",
				"separated",
				"widowed",
				"never married",
				"demographics",
				"people",
				"australia",
				"Census",
				"Census2016"
			],
			"issued": "2023-03-30T06:25:02.000Z",
			"modified": "2023-03-30T06:47:26.000Z",
			"publisher": {
				"name": "Esri Australia"
			},
			"contactPoint": {
				"@type": "vcard:Contact",
				"fn": "Esri_Australia",
				"hasEmail": "https://esriaustralia.com.au/contact-us"
			},
			"accessLevel": "public",
			"spatial": "151.0895,-33.9596,151.3243,-33.7807",
			"license": "https://creativecommons.org/licenses/by/4.0",
			"distribution": [
				{
					"@type": "dcat:Distribution",
					"title": "ArcGIS Hub Dataset",
					"format": "Web Page",
					"mediaType": "text/html",
					"accessURL": "https://www.pacificgeoportal.com/maps/esriau::what-percent-of-the-population-is-married-2021"
				}
			],
			"theme": [
				"geospatial"
			]
		},
		{
			"@type": "dcat:Dataset",
			"identifier": "https://www.arcgis.com/home/item.html?id=eacaf4dfe8c14c0e88378cb97f924a38",
			"landingPage": "https://www.pacificgeoportal.com/maps/esriau::what-is-the-predominant-marital-status-2021-census-",
			"title": "What is the predominant marital status? 2021 Census ",
			"description": "<p style='margin:12pt 0cm 0cm; background-image:initial; background-position:initial; background-size:initial; background-repeat:initial; background-attachment:initial; background-origin:initial; background-clip:initial;'><span style='font-size:12pt; font-family:&quot;Calibri Light&quot;, sans-serif;'>This web map contains layers that contain s</span><font face='Calibri Light, sans-serif'><span style='font-size:16px;'>ome of the more commonly used variables from the</span></font><span style='font-size:12pt; font-family:&quot;Calibri Light&quot;, sans-serif;'> </span><span style='font-size:11.5pt; font-family:&quot;Calibri Light&quot;, sans-serif; color:black;'><a href='https://www.abs.gov.au/census/2021-census-data-release-plans/2021-census-product-release-guide#community-profiles' target='_blank' rel='nofollow ugc noopener noreferrer'><span style='font-size:12pt; color:rgb(0, 121, 193);'>General Community Profile</span></a></span><span style='font-size:12pt; font-family:&quot;Calibri Light&quot;, sans-serif;'> information from the </span><span style='font-size:11.5pt; font-family:&quot;Calibri Light&quot;, sans-serif; color:black;'><a href='https://www.abs.gov.au/' target='_blank' rel='nofollow ugc noopener noreferrer'><span style='font-size:12pt; color:rgb(0, 121, 193);'>Australian Bureau of Statistics</span></a></span><span style='font-size:12pt; font-family:&quot;Calibri Light&quot;, sans-serif;'> 2021 census. Data is available for Country, Greater Capital City Statistical Area (GCCSA), Local Government Area (LGA), Statistical Area Level 1 (SA1) and 2 (SA2), and Suburb and Localities (SAL) boundaries.</span></p><p style='margin:12pt 0cm 0cm; background-image:initial; background-position:initial; background-size:initial; background-repeat:initial; background-attachment:initial; background-origin:initial; background-clip:initial;'><span style='font-size:12pt; font-family:&quot;Calibri Light&quot;, sans-serif;'>The General Community Profile contains a series of tables showing the characteristics of persons, families and dwellings in a selected geographic area. The data is based on place of usual residence (that is, where people usually live, rather than where they were counted on Census night). Community Profiles are excellent tools for researching, planning and analysing geographic areas for a number of social, economic and demographic characteristics.</span></p><p style='margin:12pt 0cm 0cm; background-image:initial; background-position:initial; background-size:initial; background-repeat:initial; background-attachment:initial; background-origin:initial; background-clip:initial;'><span style='font-size:11.5pt; font-family:&quot;Calibri Light&quot;, sans-serif; color:black;'><a href='https://www.abs.gov.au/census/find-census-data/datapacks' target='_blank' rel='nofollow ugc noopener noreferrer'><span style='font-size:12pt; color:rgb(0, 121, 193);'>Download the data here</span></a></span><span style='font-size:12pt; font-family:&quot;Calibri Light&quot;, sans-serif;'>.</span><br /></p><p style='margin:12pt 0cm 0cm; background-image:initial; background-position:initial; background-size:initial; background-repeat:initial; background-attachment:initial; background-origin:initial; background-clip:initial;'><span style='font-family:&quot;Calibri Light&quot;, sans-serif;'><b><font size='3'>Data and Geography notes:</font></b></span></p><ul><li><span style='font-size:12pt; font-family:&quot;Calibri Light&quot;, sans-serif;'>View the Readme files located in the DataPacks and GeoPackages zip files.</span></li><li><span style='font-size:12pt; font-family:&quot;Calibri Light&quot;, sans-serif;'>To access the 2021 DataPacks, visit </span><span style='font-size:11.5pt; font-family:&quot;Calibri Light&quot;, sans-serif; color:black;'><a href='https://www.abs.gov.au/census/find-census-data/datapacks' target='_blank' rel='nofollow ugc noopener noreferrer'><span style='font-size:12pt; color:rgb(0, 121, 193);'>https://www.abs.gov.au/census/find-census-data/datapacks</span></a></span></li><li><span style='font-size:12pt; font-family:&quot;Calibri Light&quot;, sans-serif;'>Glossary terms and definitions of classifications can be found in the </span><span style='font-size:11.5pt; font-family:&quot;Calibri Light&quot;, sans-serif; color:black;'><a href='https://www.abs.gov.au/census/guide-census-data/census-dictionary/2021/glossary' target='_blank' rel='nofollow ugc noopener noreferrer'><span style='font-size:12pt; color:rgb(0, 121, 193);'>2021 Census Dictionary</span></a></span></li><li><span style='font-size:12pt; font-family:&quot;Calibri Light&quot;, sans-serif;'>More information about Census data products is available at </span><span style='font-size:11.5pt; font-family:&quot;Calibri Light&quot;, sans-serif; color:black;'><a href='https://www.abs.gov.au/census/guide-census-data/about-census-tools/datapacks' target='_blank' rel='nofollow ugc noopener noreferrer'><span style='font-size:12pt; color:rgb(0, 121, 193);'>https://www.abs.gov.au/census/guide-census-data/about-census-tools/datapacks</span></a></span></li></ul><p style='margin:12pt 0cm 0cm; background-image:initial; background-position:initial; background-size:initial; background-repeat:initial; background-attachment:initial; background-origin:initial; background-clip:initial;'><span style='font-size:12pt; font-family:&quot;Calibri Light&quot;, sans-serif;'><b>Detailed geography information: </b></span></p><ul><li><span style='font-size:11.5pt; font-family:&quot;Calibri Light&quot;, sans-serif; color:black;'><a href='https://www.abs.gov.au/statistics/standards/australian-statistical-geography-standard-asgs-edition-3/jul2021-jun2026/main-structure-and-greater-capital-city-statistical-areas' target='_blank' rel='nofollow ugc noopener noreferrer'><span style='font-size:12pt; color:rgb(0, 121, 193);'>https://www.abs.gov.au/statistics/standards/australian-statistical-geography-standard-asgs-edition-3/jul2021-jun2026/main-structure-and-greater-capital-city-statistical-areas</span></a></span><span style='font-size:12pt; font-family:&quot;Calibri Light&quot;, sans-serif;'>: 2021 Statistical Area Level 1 (SA1), 2021 Statistical Area Level 2 (SA2), 2021 Greater Capital City Statistical Areas (GCCSA), 2021 Australia (AUS)</span></li><li><span style='font-size:11.5pt; font-family:&quot;Calibri Light&quot;, sans-serif; color:black;'><a href='https://www.abs.gov.au/statistics/standards/australian-statistical-geography-standard-asgs-edition-3/jul2021-jun2026/non-abs-structures' target='_blank' rel='nofollow ugc noopener noreferrer'><span style='font-size:12pt; color:rgb(0, 121, 193);'>https://www.abs.gov.au/statistics/standards/australian-statistical-geography-standard-asgs-edition-3/jul2021-jun2026/non-abs-structures</span></a></span><span style='font-size:12pt; font-family:&quot;Calibri Light&quot;, sans-serif;'>: 2021 Suburbs and Localities (SAL), 2021 Local Government Areas (LGA)</span></li></ul><p style='margin-bottom:0cm; background-image:initial; background-position:initial; background-size:initial; background-repeat:initial; background-attachment:initial; background-origin:initial; background-clip:initial;'><span style='font-size:12pt; font-family:&quot;Calibri Light&quot;, sans-serif;'>Please note that there are data assumptions that should be considered when analysing the ABS Census data. These are detailed within the Census documents referenced above. These include:</span></p><ul><li><span style='font-size:12pt; font-family:&quot;Calibri Light&quot;, sans-serif;'>Registered Marital Status<br />In December 2017, amendments to the Marriage Act 1961 came into effect enabling marriage equality for all couples. For 2021, registered marriages include all couples.</span></li><li><span style='font-size:11.5pt; font-family:&quot;Calibri Light&quot;, sans-serif;'>Core Activity Need for Assistance<br />Measures the number of people with a profound or severe core activity limitation. People with a profound or severe core activity limitation are those needing assistance in their day to day lives in one or more of the three core activity areas of self-care, mobility and communication because of a long-term health condition (lasting six months or more), a disability (lasting six months or more), or old age. </span></li><li><span style='font-size:11.5pt; font-family:&quot;Calibri Light&quot;, sans-serif;'>Number of Motor Vehicles<br />Excludes motorbikes, motor scooters and heavy vehicles.</span></li></ul><p style='margin-bottom:0cm; background-image:initial; background-position:initial; background-size:initial; background-repeat:initial; background-attachment:initial; background-origin:initial; background-clip:initial;'><span style='font-size:11.5pt; font-family:&quot;Calibri Light&quot;, sans-serif;'>Please note that there are small random adjustments made to all cell values to protect the confidentiality of data. These adjustments may cause the sum of rows or columns to differ by small amounts from table totals.</span></p><div><b>Source</b>: <a href='https://www.abs.gov.au/' target='_blank' rel='nofollow ugc noopener noreferrer'>Australian Bureau of Statistics</a></div><div><img src='https://urbanobservatory.maps.arcgis.com/sharing/rest/content/items/30ad1685fb2e4701b49dccd0d23cc975/data' /></div>",
			"keyword": [
				"ABS",
				"marital status",
				"married",
				"divorced",
				"separated",
				"widowed",
				"never married",
				"demographics",
				"people",
				"australia",
				"Census2021"
			],
			"issued": "2023-02-23T04:11:28.000Z",
			"modified": "2023-03-28T04:28:52.000Z",
			"publisher": {
				"name": "Esri Australia"
			},
			"contactPoint": {
				"@type": "vcard:Contact",
				"fn": "Esri_Australia",
				"hasEmail": "https://esriaustralia.com.au/contact-us"
			},
			"accessLevel": "public",
			"spatial": "151.0743,-33.9760,151.3057,-33.7972",
			"license": "https://creativecommons.org/licenses/by/4.0",
			"distribution": [
				{
					"@type": "dcat:Distribution",
					"title": "ArcGIS Hub Dataset",
					"format": "Web Page",
					"mediaType": "text/html",
					"accessURL": "https://www.pacificgeoportal.com/maps/esriau::what-is-the-predominant-marital-status-2021-census-"
				}
			],
			"theme": [
				"geospatial"
			]
		},
		{
			"@type": "dcat:Dataset",
			"identifier": "https://www.arcgis.com/home/item.html?id=dc6c58731fd845b7b8c7f1c1963ee67b",
			"landingPage": "https://www.pacificgeoportal.com/maps/esriau::what-is-the-most-common-number-of-cars-per-house-2021-census",
			"title": "What is the most common number of cars per house? 2021 Census",
			"description": "<p style='margin:12pt 0cm 0cm; background-image:initial; background-position:initial; background-size:initial; background-repeat:initial; background-attachment:initial; background-origin:initial; background-clip:initial;'><span style='font-size:12pt; font-family:&quot;Calibri Light&quot;, sans-serif;'>This web map contains layers that contain s</span><font face='Calibri Light, sans-serif'><span style='font-size:16px;'>ome of the more commonly used variables from the</span></font><span style='font-size:12pt; font-family:&quot;Calibri Light&quot;, sans-serif;'> </span><span style='font-size:11.5pt; font-family:&quot;Calibri Light&quot;, sans-serif; color:black;'><a href='https://www.abs.gov.au/census/2021-census-data-release-plans/2021-census-product-release-guide#community-profiles' target='_blank' rel='nofollow ugc noopener noreferrer'><span style='font-size:12pt; color:rgb(0, 121, 193);'>General Community Profile</span></a></span><span style='font-size:12pt; font-family:&quot;Calibri Light&quot;, sans-serif;'> information from the </span><span style='font-size:11.5pt; font-family:&quot;Calibri Light&quot;, sans-serif; color:black;'><a href='https://www.abs.gov.au/' target='_blank' rel='nofollow ugc noopener noreferrer'><span style='font-size:12pt; color:rgb(0, 121, 193);'>Australian Bureau of Statistics</span></a></span><span style='font-size:12pt; font-family:&quot;Calibri Light&quot;, sans-serif;'> 2021 census. Data is available for Country, Greater Capital City Statistical Area (GCCSA), Local Government Area (LGA), Statistical Area Level 1 (SA1) and 2 (SA2), and Suburb and Localities (SAL) boundaries.</span></p><p style='margin:12pt 0cm 0cm; background-image:initial; background-position:initial; background-size:initial; background-repeat:initial; background-attachment:initial; background-origin:initial; background-clip:initial;'><span style='font-size:12pt; font-family:&quot;Calibri Light&quot;, sans-serif;'>The General Community Profile contains a series of tables showing the characteristics of persons, families and dwellings in a selected geographic area. The data is based on place of usual residence (that is, where people usually live, rather than where they were counted on Census night). Community Profiles are excellent tools for researching, planning and analysing geographic areas for a number of social, economic and demographic characteristics.</span></p><p style='margin:12pt 0cm 0cm; background-image:initial; background-position:initial; background-size:initial; background-repeat:initial; background-attachment:initial; background-origin:initial; background-clip:initial;'><span style='font-size:11.5pt; font-family:&quot;Calibri Light&quot;, sans-serif; color:black;'><a href='https://www.abs.gov.au/census/find-census-data/datapacks' target='_blank' rel='nofollow ugc noopener noreferrer'><span style='font-size:12pt; color:rgb(0, 121, 193);'>Download the data here</span></a></span><span style='font-size:12pt; font-family:&quot;Calibri Light&quot;, sans-serif;'>.</span><br /></p><p style='margin:12pt 0cm 0cm; background-image:initial; background-position:initial; background-size:initial; background-repeat:initial; background-attachment:initial; background-origin:initial; background-clip:initial;'><span style='font-family:&quot;Calibri Light&quot;, sans-serif;'><b><font size='3'>Data and Geography notes:</font></b></span></p><ul><li><span style='font-size:12pt; font-family:&quot;Calibri Light&quot;, sans-serif;'>View the Readme files located in the DataPacks and GeoPackages zip files.</span></li><li><span style='font-size:12pt; font-family:&quot;Calibri Light&quot;, sans-serif;'>To access the 2021 DataPacks, visit </span><span style='font-size:11.5pt; font-family:&quot;Calibri Light&quot;, sans-serif; color:black;'><a href='https://www.abs.gov.au/census/find-census-data/datapacks' target='_blank' rel='nofollow ugc noopener noreferrer'><span style='font-size:12pt; color:rgb(0, 121, 193);'>https://www.abs.gov.au/census/find-census-data/datapacks</span></a></span></li><li><span style='font-size:12pt; font-family:&quot;Calibri Light&quot;, sans-serif;'>Glossary terms and definitions of classifications can be found in the </span><span style='font-size:11.5pt; font-family:&quot;Calibri Light&quot;, sans-serif; color:black;'><a href='https://www.abs.gov.au/census/guide-census-data/census-dictionary/2021/glossary' target='_blank' rel='nofollow ugc noopener noreferrer'><span style='font-size:12pt; color:rgb(0, 121, 193);'>2021 Census Dictionary</span></a></span></li><li><span style='font-size:12pt; font-family:&quot;Calibri Light&quot;, sans-serif;'>More information about Census data products is available at </span><span style='font-size:11.5pt; font-family:&quot;Calibri Light&quot;, sans-serif; color:black;'><a href='https://www.abs.gov.au/census/guide-census-data/about-census-tools/datapacks' target='_blank' rel='nofollow ugc noopener noreferrer'><span style='font-size:12pt; color:rgb(0, 121, 193);'>https://www.abs.gov.au/census/guide-census-data/about-census-tools/datapacks</span></a></span></li></ul><p style='margin:12pt 0cm 0cm; background-image:initial; background-position:initial; background-size:initial; background-repeat:initial; background-attachment:initial; background-origin:initial; background-clip:initial;'><span style='font-size:12pt; font-family:&quot;Calibri Light&quot;, sans-serif;'><b>Detailed geography information: </b></span></p><ul><li><span style='font-size:11.5pt; font-family:&quot;Calibri Light&quot;, sans-serif; color:black;'><a href='https://www.abs.gov.au/statistics/standards/australian-statistical-geography-standard-asgs-edition-3/jul2021-jun2026/main-structure-and-greater-capital-city-statistical-areas' target='_blank' rel='nofollow ugc noopener noreferrer'><span style='font-size:12pt; color:rgb(0, 121, 193);'>https://www.abs.gov.au/statistics/standards/australian-statistical-geography-standard-asgs-edition-3/jul2021-jun2026/main-structure-and-greater-capital-city-statistical-areas</span></a></span><span style='font-size:12pt; font-family:&quot;Calibri Light&quot;, sans-serif;'>: 2021 Statistical Area Level 1 (SA1), 2021 Statistical Area Level 2 (SA2), 2021 Greater Capital City Statistical Areas (GCCSA), 2021 Australia (AUS)</span></li><li><span style='font-size:11.5pt; font-family:&quot;Calibri Light&quot;, sans-serif; color:black;'><a href='https://www.abs.gov.au/statistics/standards/australian-statistical-geography-standard-asgs-edition-3/jul2021-jun2026/non-abs-structures' target='_blank' rel='nofollow ugc noopener noreferrer'><span style='font-size:12pt; color:rgb(0, 121, 193);'>https://www.abs.gov.au/statistics/standards/australian-statistical-geography-standard-asgs-edition-3/jul2021-jun2026/non-abs-structures</span></a></span><span style='font-size:12pt; font-family:&quot;Calibri Light&quot;, sans-serif;'>: 2021 Suburbs and Localities (SAL), 2021 Local Government Areas (LGA)</span></li></ul><p style='margin-bottom:0cm; background-image:initial; background-position:initial; background-size:initial; background-repeat:initial; background-attachment:initial; background-origin:initial; background-clip:initial;'><span style='font-size:12pt; font-family:&quot;Calibri Light&quot;, sans-serif;'>Please note that there are data assumptions that should be considered when analysing the ABS Census data. These are detailed within the Census documents referenced above. These include:</span></p><ul><li><span style='font-size:12pt; font-family:&quot;Calibri Light&quot;, sans-serif;'>Registered Marital Status<br />In December 2017, amendments to the Marriage Act 1961 came into effect enabling marriage equality for all couples. For 2021, registered marriages include all couples.</span></li><li><span style='font-size:11.5pt; font-family:&quot;Calibri Light&quot;, sans-serif;'>Core Activity Need for Assistance<br />Measures the number of people with a profound or severe core activity limitation. People with a profound or severe core activity limitation are those needing assistance in their day to day lives in one or more of the three core activity areas of self-care, mobility and communication because of a long-term health condition (lasting six months or more), a disability (lasting six months or more), or old age. </span></li><li><span style='font-size:11.5pt; font-family:&quot;Calibri Light&quot;, sans-serif;'>Number of Motor Vehicles<br />Excludes motorbikes, motor scooters and heavy vehicles.</span></li></ul><p style='margin-bottom:0cm; background-image:initial; background-position:initial; background-size:initial; background-repeat:initial; background-attachment:initial; background-origin:initial; background-clip:initial;'><span style='font-size:11.5pt; font-family:&quot;Calibri Light&quot;, sans-serif;'>Please note that there are small random adjustments made to all cell values to protect the confidentiality of data. These adjustments may cause the sum of rows or columns to differ by small amounts from table totals.</span></p><div><b>Source</b>: <a href='https://www.abs.gov.au/' target='_blank' rel='nofollow ugc noopener noreferrer'>Australian Bureau of Statistics</a></div><p style='margin-top:0px; margin-bottom:0.75rem; max-width:100%;'><span style='max-width:100%; display:inherit;'></span></p><div><img src='https://urbanobservatory.maps.arcgis.com/sharing/rest/content/items/30ad1685fb2e4701b49dccd0d23cc975/data' /></div>",
			"keyword": [
				"cars",
				"demographics",
				"people",
				"dwelling",
				"household",
				"car",
				"vehicle",
				"motor vehicle",
				"Australia",
				"Census",
				"Census2021"
			],
			"issued": "2023-03-03T04:04:54.000Z",
			"modified": "2023-03-15T22:37:44.000Z",
			"publisher": {
				"name": "Esri Australia"
			},
			"contactPoint": {
				"@type": "vcard:Contact",
				"fn": "Esri_Australia",
				"hasEmail": "https://esriaustralia.com.au/contact-us"
			},
			"accessLevel": "public",
			"spatial": "150.9288,-34.0489,151.4850,-33.6912",
			"license": "https://creativecommons.org/licenses/by/4.0",
			"distribution": [
				{
					"@type": "dcat:Distribution",
					"title": "ArcGIS Hub Dataset",
					"format": "Web Page",
					"mediaType": "text/html",
					"accessURL": "https://www.pacificgeoportal.com/maps/esriau::what-is-the-most-common-number-of-cars-per-house-2021-census"
				}
			],
			"theme": [
				"geospatial"
			]
		},
		{
			"@type": "dcat:Dataset",
			"identifier": "https://www.arcgis.com/home/item.html?id=b7c3148b44c843c7adc7f1492726419f",
			"landingPage": "https://www.pacificgeoportal.com/maps/esriau::what-is-australias-unemployment-rate-2021-census",
			"title": "What is Australia's unemployment rate?  2021 Census",
			"description": "<p style='margin:12pt 0cm 0cm; background-image:initial; background-position:initial; background-size:initial; background-repeat:initial; background-attachment:initial; background-origin:initial; background-clip:initial;'><span style='font-size:12pt; font-family:&quot;Calibri Light&quot;, sans-serif;'>This web map contains layers that contain s</span><font face='Calibri Light, sans-serif'><span style='font-size:16px;'>ome of the more commonly used variables from the</span></font><span style='font-size:12pt; font-family:&quot;Calibri Light&quot;, sans-serif;'> </span><span style='font-size:11.5pt; font-family:&quot;Calibri Light&quot;, sans-serif; color:black;'><a href='https://www.abs.gov.au/census/2021-census-data-release-plans/2021-census-product-release-guide#community-profiles' target='_blank' rel='nofollow ugc noopener noreferrer'><span style='font-size:12pt; color:rgb(0, 121, 193);'>General Community Profile</span></a></span><span style='font-size:12pt; font-family:&quot;Calibri Light&quot;, sans-serif;'> information from the </span><span style='font-size:11.5pt; font-family:&quot;Calibri Light&quot;, sans-serif; color:black;'><a href='https://www.abs.gov.au/' target='_blank' rel='nofollow ugc noopener noreferrer'><span style='font-size:12pt; color:rgb(0, 121, 193);'>Australian Bureau of Statistics</span></a></span><span style='font-size:12pt; font-family:&quot;Calibri Light&quot;, sans-serif;'> 2021 census. Data is available for Country, Greater Capital City Statistical Area (GCCSA), Local Government Area (LGA), Statistical Area Level 1 (SA1) and 2 (SA2), and Suburb and Localities (SAL) boundaries.</span></p><p style='margin:12pt 0cm 0cm; background-image:initial; background-position:initial; background-size:initial; background-repeat:initial; background-attachment:initial; background-origin:initial; background-clip:initial;'><span style='font-size:12pt; font-family:&quot;Calibri Light&quot;, sans-serif;'>The General Community Profile contains a series of tables showing the characteristics of persons, families and dwellings in a selected geographic area. The data is based on place of usual residence (that is, where people usually live, rather than where they were counted on Census night). Community Profiles are excellent tools for researching, planning and analysing geographic areas for a number of social, economic and demographic characteristics.</span></p><p style='margin:12pt 0cm 0cm; background-image:initial; background-position:initial; background-size:initial; background-repeat:initial; background-attachment:initial; background-origin:initial; background-clip:initial;'><span style='font-size:11.5pt; font-family:&quot;Calibri Light&quot;, sans-serif; color:black;'><a href='https://www.abs.gov.au/census/find-census-data/datapacks' target='_blank' rel='nofollow ugc noopener noreferrer'><span style='font-size:12pt; color:rgb(0, 121, 193);'>Download the data here</span></a></span><span style='font-size:12pt; font-family:&quot;Calibri Light&quot;, sans-serif;'>.</span><br /></p><p style='margin:12pt 0cm 0cm; background-image:initial; background-position:initial; background-size:initial; background-repeat:initial; background-attachment:initial; background-origin:initial; background-clip:initial;'><span style='font-family:&quot;Calibri Light&quot;, sans-serif;'><b><font size='3'>Data and Geography notes:</font></b></span></p><ul><li><span style='font-size:12pt; font-family:&quot;Calibri Light&quot;, sans-serif;'>View the Readme files located in the DataPacks and GeoPackages zip files.</span></li><li><span style='font-size:12pt; font-family:&quot;Calibri Light&quot;, sans-serif;'>To access the 2021 DataPacks, visit </span><span style='font-size:11.5pt; font-family:&quot;Calibri Light&quot;, sans-serif; color:black;'><a href='https://www.abs.gov.au/census/find-census-data/datapacks' target='_blank' rel='nofollow ugc noopener noreferrer'><span style='font-size:12pt; color:rgb(0, 121, 193);'>https://www.abs.gov.au/census/find-census-data/datapacks</span></a></span></li><li><span style='font-size:12pt; font-family:&quot;Calibri Light&quot;, sans-serif;'>Glossary terms and definitions of classifications can be found in the </span><span style='font-size:11.5pt; font-family:&quot;Calibri Light&quot;, sans-serif; color:black;'><a href='https://www.abs.gov.au/census/guide-census-data/census-dictionary/2021/glossary' target='_blank' rel='nofollow ugc noopener noreferrer'><span style='font-size:12pt; color:rgb(0, 121, 193);'>2021 Census Dictionary</span></a></span></li><li><span style='font-size:12pt; font-family:&quot;Calibri Light&quot;, sans-serif;'>More information about Census data products is available at </span><span style='font-size:11.5pt; font-family:&quot;Calibri Light&quot;, sans-serif; color:black;'><a href='https://www.abs.gov.au/census/guide-census-data/about-census-tools/datapacks' target='_blank' rel='nofollow ugc noopener noreferrer'><span style='font-size:12pt; color:rgb(0, 121, 193);'>https://www.abs.gov.au/census/guide-census-data/about-census-tools/datapacks</span></a></span></li></ul><p style='margin:12pt 0cm 0cm; background-image:initial; background-position:initial; background-size:initial; background-repeat:initial; background-attachment:initial; background-origin:initial; background-clip:initial;'><span style='font-size:12pt; font-family:&quot;Calibri Light&quot;, sans-serif;'><b>Detailed geography information: </b></span></p><ul><li><span style='font-size:11.5pt; font-family:&quot;Calibri Light&quot;, sans-serif; color:black;'><a href='https://www.abs.gov.au/statistics/standards/australian-statistical-geography-standard-asgs-edition-3/jul2021-jun2026/main-structure-and-greater-capital-city-statistical-areas' target='_blank' rel='nofollow ugc noopener noreferrer'><span style='font-size:12pt; color:rgb(0, 121, 193);'>https://www.abs.gov.au/statistics/standards/australian-statistical-geography-standard-asgs-edition-3/jul2021-jun2026/main-structure-and-greater-capital-city-statistical-areas</span></a></span><span style='font-size:12pt; font-family:&quot;Calibri Light&quot;, sans-serif;'>: 2021 Statistical Area Level 1 (SA1), 2021 Statistical Area Level 2 (SA2), 2021 Greater Capital City Statistical Areas (GCCSA), 2021 Australia (AUS)</span></li><li><span style='font-size:11.5pt; font-family:&quot;Calibri Light&quot;, sans-serif; color:black;'><a href='https://www.abs.gov.au/statistics/standards/australian-statistical-geography-standard-asgs-edition-3/jul2021-jun2026/non-abs-structures' target='_blank' rel='nofollow ugc noopener noreferrer'><span style='font-size:12pt; color:rgb(0, 121, 193);'>https://www.abs.gov.au/statistics/standards/australian-statistical-geography-standard-asgs-edition-3/jul2021-jun2026/non-abs-structures</span></a></span><span style='font-size:12pt; font-family:&quot;Calibri Light&quot;, sans-serif;'>: 2021 Suburbs and Localities (SAL), 2021 Local Government Areas (LGA)</span></li></ul><p style='margin-bottom:0cm; background-image:initial; background-position:initial; background-size:initial; background-repeat:initial; background-attachment:initial; background-origin:initial; background-clip:initial;'><span style='font-size:12pt; font-family:&quot;Calibri Light&quot;, sans-serif;'>Please note that there are data assumptions that should be considered when analysing the ABS Census data. These are detailed within the Census documents referenced above. These include:</span></p><ul><li><span style='font-size:12pt; font-family:&quot;Calibri Light&quot;, sans-serif;'>Registered Marital Status<br />In December 2017, amendments to the Marriage Act 1961 came into effect enabling marriage equality for all couples. For 2021, registered marriages include all couples.</span></li><li><span style='font-size:11.5pt; font-family:&quot;Calibri Light&quot;, sans-serif;'>Core Activity Need for Assistance<br />Measures the number of people with a profound or severe core activity limitation. People with a profound or severe core activity limitation are those needing assistance in their day to day lives in one or more of the three core activity areas of self-care, mobility and communication because of a long-term health condition (lasting six months or more), a disability (lasting six months or more), or old age. </span></li><li><span style='font-size:11.5pt; font-family:&quot;Calibri Light&quot;, sans-serif;'>Number of Motor Vehicles<br />Excludes motorbikes, motor scooters and heavy vehicles.</span></li></ul><p style='margin-bottom:0cm; background-image:initial; background-position:initial; background-size:initial; background-repeat:initial; background-attachment:initial; background-origin:initial; background-clip:initial;'><span style='font-size:11.5pt; font-family:&quot;Calibri Light&quot;, sans-serif;'>Please note that there are small random adjustments made to all cell values to protect the confidentiality of data. These adjustments may cause the sum of rows or columns to differ by small amounts from table totals.</span></p><div><b>Source</b>: <a href='https://www.abs.gov.au/' target='_blank' rel='nofollow ugc noopener noreferrer'>Australian Bureau of Statistics</a></div><p style='margin-top:0px; margin-bottom:0.75rem; max-width:100%;'><span style='max-width:100%; display:inherit;'></span></p><div><img src='https://urbanobservatory.maps.arcgis.com/sharing/rest/content/items/30ad1685fb2e4701b49dccd0d23cc975/data' /></div>",
			"keyword": [
				"ABS",
				"demographics",
				"people",
				"employed",
				"unemployed",
				"unemployment",
				"job",
				"work",
				"income",
				"Australia",
				"Census2021"
			],
			"issued": "2023-03-03T05:38:49.000Z",
			"modified": "2023-03-15T21:53:46.000Z",
			"publisher": {
				"name": "Esri Australia"
			},
			"contactPoint": {
				"@type": "vcard:Contact",
				"fn": "Esri_Australia",
				"hasEmail": "https://esriaustralia.com.au/contact-us"
			},
			"accessLevel": "public",
			"spatial": "151.0679,-33.9596,151.3460,-33.7807",
			"license": "https://creativecommons.org/licenses/by/4.0",
			"distribution": [
				{
					"@type": "dcat:Distribution",
					"title": "ArcGIS Hub Dataset",
					"format": "Web Page",
					"mediaType": "text/html",
					"accessURL": "https://www.pacificgeoportal.com/maps/esriau::what-is-australias-unemployment-rate-2021-census"
				}
			],
			"theme": [
				"geospatial"
			]
		},
		{
			"@type": "dcat:Dataset",
			"identifier": "https://www.arcgis.com/home/item.html?id=6b43dcea81604f898e53160f606f68ad",
			"landingPage": "https://www.pacificgeoportal.com/maps/esriau::what-is-the-predominant-marital-status-2016-census",
			"title": "What is the predominant marital status? 2016 Census",
			"description": "This map shows the predominant marital status of an area: married, divorced, separated, never married, separated. Data is available for Country, Greater Capital City Statistical Area (GCCSA), Local Government Area (LGA), Statistical Area Level 1 (SA1) and 2 (SA2), and State Suburb (SSC) boundaries.<div><div><br /></div><div>Data is from the <a href='https://www.abs.gov.au/websitedbs/censushome.nsf/home/communityprofiles?opendocument&amp;navpos=230' rel='nofollow ugc' target='_blank'>General Community Profile</a> from the <a href='https://www.abs.gov.au/' rel='nofollow ugc' target='_blank'>Australian Bureau of Statistics</a> 2016 census. The General Community Profile is new for the 2016 Census. It replaces the 2011 Basic and Expanded Community Profiles and has been created by merging components of both these profiles. It contains a series of tables showing the characteristics of persons, families and dwellings in a selected geographic area. The data is based on place of usual residence (that is, where people usually live, rather than where they were counted on Census night). Community Profiles are excellent tools for researching, planning and analysing geographic areas for a number of social, economic and demographic characteristics.<br /></div><div><br /></div><div>To see the full list of attributes available in<a href='https://www.arcgis.com/home/item.html?id=b6c13795c5cd4405a36256c3a5e0891d' rel='nofollow ugc' target='_blank'> this service</a>, go to the &quot;Data&quot; tab, and choose &quot;Fields&quot; at the top right. </div><div><br /></div><a href='https://www.abs.gov.au/websitedbs/d3310114.nsf/home/2016%20datapacks' rel='nofollow ugc' target='_blank'>Download the data here</a>.<div><br /><div><b>Data notes</b>:</div><div><p style='margin-top:0px; margin-bottom:0px; box-sizing:border-box; padding:0px; border:0px; max-width:65rem;'></p><ul><li>View the Readme files located in the DataPacks and GeoPackages zip files.</li><li>To access the 2016 DataPacks samples, view the <a href='https://www.abs.gov.au/AUSSTATS/abs@.nsf/Latestproducts/2079.0Main%20Features32016?opendocument&amp;tabname=Summary&amp;prodno=2079.0&amp;issue=2016&amp;num=&amp;view=' rel='nofollow ugc' style='box-sizing:border-box; border-bottom:1px solid rgb(204, 204, 204);'>Community Profile, DataPack and TableBuilder Templates publication (cat no. 2079.0)</a></li><li>Glossary terms and definitions of classifications can be found in the <a href='https://www.abs.gov.au/ausstats/abs@.nsf/mf/2901.0' rel='nofollow ugc' style='box-sizing:border-box; border-bottom:1px solid rgb(204, 204, 204);'>2016 Census Dictionary</a></li><li>More information about Census data products is available in the <a href='https://www.abs.gov.au/ausstats/abs@.nsf/Latestproducts/2916.0Main%20Features202016?opendocument&amp;tabname=Summary&amp;prodno=2916.0&amp;issue=2016&amp;num=&amp;view=' rel='nofollow ugc' style='box-sizing:border-box; border-bottom:1px solid rgb(204, 204, 204);'>QuickStats, Community Profiles and DataPacks user guide, Australia (Cat no. 2916.0)</a></li><li>DataPacks and Geopackages for Western Australia State Electoral Divisions (WA SEDs) may not be correct and should not be used as per <a href='https://www.abs.gov.au/websitedbs/D3310114.nsf/home/2016%20Census%20Data%20Corrections' rel='nofollow ugc' style='box-sizing:border-box; border-bottom:1px solid rgb(204, 204, 204);'>Corrections to 2016 Data</a>. Data for these boundaries can be obtained using QuickStats or Census TableBuilder using a <a href='https://www.abs.gov.au/AUSSTATS/abs@.nsf/DetailsPage/1270.0.55.003July%202017?OpenDocument' rel='nofollow ugc' style='box-sizing:border-box; border-bottom:1px solid rgb(204, 204, 204);'>geographic recode</a> and following <a href='https://www.abs.gov.au/ausstats/abs@.nsf/Lookup/by%20Subject/1406.0.55.005~User%20Guide~Main%20Features~Custom%20data~60' rel='nofollow ugc' style='box-sizing:border-box; border-bottom:1px solid rgb(204, 204, 204);'>these instructions</a> on working with custom groups. </li></ul><p></p><div><br /></div><div><b>Source</b>: <a href='https://www.abs.gov.au/' rel='nofollow ugc' target='_blank'>Australian Bureau of Statistics</a></div><div><img alt='' src='https://urbanobservatory.maps.arcgis.com/sharing/rest/content/items/30ad1685fb2e4701b49dccd0d23cc975/data' /></div></div></div></div>",
			"keyword": [
				"ABS",
				"marital status",
				"married",
				"divorced",
				"separated",
				"widowed",
				"never married",
				"demographics",
				"people",
				"australia",
				"Census2016"
			],
			"issued": "2021-05-19T22:24:56.000Z",
			"modified": "2023-02-23T03:50:42.000Z",
			"publisher": {
				"name": "Esri Australia"
			},
			"contactPoint": {
				"@type": "vcard:Contact",
				"fn": "Esri_Australia",
				"hasEmail": "https://esriaustralia.com.au/contact-us"
			},
			"accessLevel": "public",
			"spatial": "151.0632,-33.9455,151.3168,-33.8277",
			"license": "https://creativecommons.org/licenses/by/4.0",
			"distribution": [
				{
					"@type": "dcat:Distribution",
					"title": "ArcGIS Hub Dataset",
					"format": "Web Page",
					"mediaType": "text/html",
					"accessURL": "https://www.pacificgeoportal.com/maps/esriau::what-is-the-predominant-marital-status-2016-census"
				}
			],
			"theme": [
				"geospatial"
			]
		},
		{
			"@type": "dcat:Dataset",
			"identifier": "https://www.arcgis.com/home/item.html?id=185db01a0bc245cfa39963798b902b8d",
			"landingPage": "https://www.pacificgeoportal.com/maps/esriau::what-is-the-most-common-number-of-cars-per-house-2016-census",
			"title": "What is the most common number of cars per house? 2016 Census",
			"description": "<p style='margin-top:0px; margin-bottom:0.75rem; max-width:100%;'><span style='max-width:100%; display:inherit;'>This map shows the predominant number of cars per dwelling (0 to 4 vehicles) by Greater Capital City Statistical Area (GCCSA), Local Government Area (LGA), Statistical Area Level 1 (SA1), and State Suburb (SSC) boundaries.</span></p><div><div>Data is from the <a href='https://www.abs.gov.au/websitedbs/censushome.nsf/home/communityprofiles?opendocument&amp;navpos=230' target='_blank' rel='nofollow ugc noopener noreferrer'>General Community Profile</a> from the <a href='https://www.abs.gov.au/' target='_blank' rel='nofollow ugc noopener noreferrer'>Australian Bureau of Statistics</a> 2016 census. The General Community Profile is new for the 2016 Census. It replaces the 2011 Basic and Expanded Community Profiles and has been created by merging components of both these profiles. It contains a series of tables showing the characteristics of persons, families and dwellings in a selected geographic area. The data is based on place of usual residence (that is, where people usually live, rather than where they were counted on Census night). Community Profiles are excellent tools for researching, planning and analysing geographic areas for a number of social, economic and demographic characteristics.<br /></div><div><br /></div><div>To see the full list of attributes available in<a href='https://www.arcgis.com/home/item.html?id=b9e7b62c866b4a91a6e9d2aa2794e6de' target='_blank' rel='nofollow ugc noopener noreferrer'> this service</a>, go to the &quot;Data&quot; tab, and choose &quot;Fields&quot; at the top right. </div><div><br /></div><a href='https://www.abs.gov.au/websitedbs/d3310114.nsf/home/2016%20datapacks' target='_blank' rel='nofollow ugc noopener noreferrer'>Download the data here</a>.<div><br /><div><b>Data notes</b>:</div><div><p style='margin-top:0px; margin-bottom:0px; box-sizing:border-box; padding:0px; border:0px; max-width:65rem;'></p><ul><li>View the Readme files located in the DataPacks and GeoPackages zip files.</li><li>To access the 2016 DataPacks samples, view the <a href='https://www.abs.gov.au/AUSSTATS/abs@.nsf/Latestproducts/2079.0Main%20Features32016?opendocument&amp;tabname=Summary&amp;prodno=2079.0&amp;issue=2016&amp;num=&amp;view=' style='box-sizing:border-box; border-bottom:1px solid rgb(204, 204, 204);' rel='nofollow ugc'>Community Profile, DataPack and TableBuilder Templates publication (cat no. 2079.0)</a></li><li>Glossary terms and definitions of classifications can be found in the <a href='https://www.abs.gov.au/ausstats/abs@.nsf/mf/2901.0' style='box-sizing:border-box; border-bottom:1px solid rgb(204, 204, 204);' rel='nofollow ugc'>2016 Census Dictionary</a></li><li>More information about Census data products is available in the <a href='https://www.abs.gov.au/ausstats/abs@.nsf/Latestproducts/2916.0Main%20Features202016?opendocument&amp;tabname=Summary&amp;prodno=2916.0&amp;issue=2016&amp;num=&amp;view=' style='box-sizing:border-box; border-bottom:1px solid rgb(204, 204, 204);' rel='nofollow ugc'>QuickStats, Community Profiles and DataPacks user guide, Australia (Cat no. 2916.0)</a></li><li>DataPacks and Geopackages for Western Australia State Electoral Divisions (WA SEDs) may not be correct and should not be used as per <a href='https://www.abs.gov.au/websitedbs/D3310114.nsf/home/2016%20Census%20Data%20Corrections' style='box-sizing:border-box; border-bottom:1px solid rgb(204, 204, 204);' rel='nofollow ugc'>Corrections to 2016 Data</a>. Data for these boundaries can be obtained using QuickStats or Census TableBuilder using a <a href='https://www.abs.gov.au/AUSSTATS/abs@.nsf/DetailsPage/1270.0.55.003July%202017?OpenDocument' style='box-sizing:border-box; border-bottom:1px solid rgb(204, 204, 204);' rel='nofollow ugc'>geographic recode</a> and following <a href='https://www.abs.gov.au/ausstats/abs@.nsf/Lookup/by%20Subject/1406.0.55.005~User%20Guide~Main%20Features~Custom%20data~60' style='box-sizing:border-box; border-bottom:1px solid rgb(204, 204, 204);' rel='nofollow ugc'>these instructions</a> on working with custom groups. </li></ul><p></p><div><br /></div><div><b>Source</b>: <a href='https://www.abs.gov.au/' target='_blank' rel='nofollow ugc noopener noreferrer'>Australian Bureau of Statistics</a></div><div><img src='https://urbanobservatory.maps.arcgis.com/sharing/rest/content/items/30ad1685fb2e4701b49dccd0d23cc975/data' /></div></div></div></div>",
			"keyword": [
				"cars",
				"demographics",
				"people",
				"dwelling",
				"household",
				"car",
				"vehicle",
				"motor vehicle",
				"Census2016",
				"Australia"
			],
			"issued": "2021-05-19T22:24:51.000Z",
			"modified": "2023-02-23T03:02:08.000Z",
			"publisher": {
				"name": "Esri Australia"
			},
			"contactPoint": {
				"@type": "vcard:Contact",
				"fn": "Esri_Australia",
				"hasEmail": "https://esriaustralia.com.au/contact-us"
			},
			"accessLevel": "public",
			"spatial": "150.9827,-34.0316,151.4311,-33.7086",
			"license": "https://creativecommons.org/licenses/by/4.0",
			"distribution": [
				{
					"@type": "dcat:Distribution",
					"title": "ArcGIS Hub Dataset",
					"format": "Web Page",
					"mediaType": "text/html",
					"accessURL": "https://www.pacificgeoportal.com/maps/esriau::what-is-the-most-common-number-of-cars-per-house-2016-census"
				}
			],
			"theme": [
				"geospatial"
			]
		},
		{
			"@type": "dcat:Dataset",
			"identifier": "https://www.arcgis.com/home/item.html?id=2a0a3c01693d4901862f709df8990f4e",
			"landingPage": "https://www.pacificgeoportal.com/maps/esriau::what-is-the-predominant-year-of-arrival-to-australia-2016-census",
			"title": "What is the predominant year of arrival to Australia? 2016 Census",
			"description": "<p style='margin-top: 0px; margin-bottom: 0.75rem; overflow-wrap: break-word; max-width: 100%;'><span style='overflow-wrap: break-word; max-width: 100%; display: inherit;'>This map shows the predominant year of arrival to Australia. Data is available for Country, Greater Capital City Statistical Area (GCCSA), Local Government Area (LGA), Statistical Area Level 1 (SA1) and 2 (SA2), and State Suburb (SSC) boundaries.</span></p><div><div>Data is from the <a href='https://www.abs.gov.au/websitedbs/censushome.nsf/home/communityprofiles?opendocument&amp;navpos=230' target='_blank' rel='nofollow ugc noopener noreferrer'>General Community Profile</a> from the <a href='https://www.abs.gov.au/' target='_blank' rel='nofollow ugc noopener noreferrer'>Australian Bureau of Statistics</a> 2016 census. The General Community Profile is new for the 2016 Census. It replaces the 2011 Basic and Expanded Community Profiles and has been created by merging components of both these profiles. It contains a series of tables showing the characteristics of persons, families and dwellings in a selected geographic area. The data is based on place of usual residence (that is, where people usually live, rather than where they were counted on Census night). Community Profiles are excellent tools for researching, planning and analysing geographic areas for a number of social, economic and demographic characteristics.<br /></div><div><br /></div><div>To see the full list of attributes available in<a href='https://www.arcgis.com/home/item.html?id=b9e7b62c866b4a91a6e9d2aa2794e6de' target='_blank' rel='nofollow ugc noopener noreferrer'> this service</a>, go to the &quot;Data&quot; tab, and choose &quot;Fields&quot; at the top right. </div><div><br /></div><a href='https://www.abs.gov.au/websitedbs/d3310114.nsf/home/2016%20datapacks' target='_blank' rel='nofollow ugc noopener noreferrer'>Download the data here</a>.<div><br /><div><b>Data notes</b>:</div><div><p style='margin-top: 0px; margin-bottom: 0px; box-sizing: border-box; padding: 0px; border: 0px; max-width: 65rem;'></p><ul><li>View the Readme files located in the DataPacks and GeoPackages zip files.</li><li>To access the 2016 DataPacks samples, view the <a href='https://www.abs.gov.au/AUSSTATS/abs@.nsf/Latestproducts/2079.0Main%20Features32016?opendocument&amp;tabname=Summary&amp;prodno=2079.0&amp;issue=2016&amp;num=&amp;view=' style='box-sizing: border-box; border-bottom: 1px solid rgb(204, 204, 204);' rel='nofollow ugc'>Community Profile, DataPack and TableBuilder Templates publication (cat no. 2079.0)</a></li><li>Glossary terms and definitions of classifications can be found in the <a href='https://www.abs.gov.au/ausstats/abs@.nsf/mf/2901.0' style='box-sizing: border-box; border-bottom: 1px solid rgb(204, 204, 204);' rel='nofollow ugc'>2016 Census Dictionary</a></li><li>More information about Census data products is available in the <a href='https://www.abs.gov.au/ausstats/abs@.nsf/Latestproducts/2916.0Main%20Features202016?opendocument&amp;tabname=Summary&amp;prodno=2916.0&amp;issue=2016&amp;num=&amp;view=' style='box-sizing: border-box; border-bottom: 1px solid rgb(204, 204, 204);' rel='nofollow ugc'>QuickStats, Community Profiles and DataPacks user guide, Australia (Cat no. 2916.0)</a></li><li>DataPacks and Geopackages for Western Australia State Electoral Divisions (WA SEDs) may not be correct and should not be used as per <a href='https://www.abs.gov.au/websitedbs/D3310114.nsf/home/2016%20Census%20Data%20Corrections' style='box-sizing: border-box; border-bottom: 1px solid rgb(204, 204, 204);' rel='nofollow ugc'>Corrections to 2016 Data</a>. Data for these boundaries can be obtained using QuickStats or Census TableBuilder using a <a href='https://www.abs.gov.au/AUSSTATS/abs@.nsf/DetailsPage/1270.0.55.003July%202017?OpenDocument' style='box-sizing: border-box; border-bottom: 1px solid rgb(204, 204, 204);' rel='nofollow ugc'>geographic recode</a> and following <a href='https://www.abs.gov.au/ausstats/abs@.nsf/Lookup/by%20Subject/1406.0.55.005~User%20Guide~Main%20Features~Custom%20data~60' style='box-sizing: border-box; border-bottom: 1px solid rgb(204, 204, 204);' rel='nofollow ugc'>these instructions</a> on working with custom groups. </li></ul><p></p><div><br /></div><div><b>Source</b>: <a href='https://www.abs.gov.au/' target='_blank' rel='nofollow ugc noopener noreferrer'>Australian Bureau of Statistics</a></div><div><img alt='' src='https://urbanobservatory.maps.arcgis.com/sharing/rest/content/items/30ad1685fb2e4701b49dccd0d23cc975/data' /></div></div></div></div>",
			"keyword": [
				"ABS",
				"demographics",
				"people",
				"australia",
				"immigrate",
				"immigrant",
				"arrival",
				"year",
				"Census2016",
				"Australia"
			],
			"issued": "2021-05-19T22:25:01.000Z",
			"modified": "2023-02-23T03:01:43.000Z",
			"publisher": {
				"name": "Esri Australia"
			},
			"contactPoint": {
				"@type": "vcard:Contact",
				"fn": "Esri_Australia",
				"hasEmail": "https://esriaustralia.com.au/contact-us"
			},
			"accessLevel": "public",
			"spatial": "151.0959,-33.9509,151.3179,-33.7895",
			"license": "https://creativecommons.org/licenses/by/4.0",
			"distribution": [
				{
					"@type": "dcat:Distribution",
					"title": "ArcGIS Hub Dataset",
					"format": "Web Page",
					"mediaType": "text/html",
					"accessURL": "https://www.pacificgeoportal.com/maps/esriau::what-is-the-predominant-year-of-arrival-to-australia-2016-census"
				}
			],
			"theme": [
				"geospatial"
			]
		},
		{
			"@type": "dcat:Dataset",
			"identifier": "https://www.arcgis.com/home/item.html?id=2eaaab3e58e24b3e89443c81c4cf0ca4",
			"landingPage": "https://www.pacificgeoportal.com/maps/2eaaab3e58e24b3e89443c81c4cf0ca4",
			"title": "{{name}}",
			"description": "{{description}}",
			"keyword": [
				"RBI",
				"basemap",
				"Peta",
				"BIG"
			],
			"issued": "2020-04-20T20:50:06.000Z",
			"modified": "{{modified:toISO}}",
			"publisher": {
				"name": "{{source}}"
			},
			"contactPoint": {
				"@type": "vcard:Contact",
				"fn": "esri_id_content",
				"hasEmail": "http://esriindonesia.co.id"
			},
			"accessLevel": "public",
			"spatial": "",
			"license": "This maps provided by Badan Informasi Geospatial (BIG) as Mapping Agency in Indonesia. all the data in this services actually are public that can be accessed from this url: <a href='https://tanahair.indonesia.go.id/' rel='nofollow ugc'>https://tanahair.indonesia.go.id/</a> and this url. <a href='http://portal.ina-sdi.or.id/portal/home/' rel='nofollow ugc'>https://portal.ina-sdi.or.id/portal/home/</a>  any data changes responsibility is belong to BIG.",
			"distribution": [
				{
					"@type": "dcat:Distribution",
					"title": "ArcGIS Hub Dataset",
					"format": "Web Page",
					"mediaType": "text/html",
					"accessURL": "https://www.pacificgeoportal.com/maps/2eaaab3e58e24b3e89443c81c4cf0ca4"
				}
			],
			"theme": ""
		},
		{
			"@type": "dcat:Dataset",
			"identifier": "https://www.arcgis.com/home/item.html?id=6c0488fd7bcb455fadc66e505cbd21a9",
			"landingPage": "https://www.pacificgeoportal.com/apps/esriau::language-spoken-at-home-census-2016",
			"title": "Language spoken at Home (Census 2016)",
			"description": "<div style='box-sizing: inherit; color: rgb(110, 110, 110); font-family: &quot;Avenir Next W00&quot;, &quot;Helvetica Neue&quot;, Helvetica, Arial, sans-serif; font-size: 14px;'><b>Does the person speak a language other than English at home? </b><br /><br />This map takes a look at answers to this question from Census Night.</div><div style='box-sizing: inherit; color: rgb(110, 110, 110); font-family: &quot;Avenir Next W00&quot;, &quot;Helvetica Neue&quot;, Helvetica, Arial, sans-serif; font-size: 14px;'><b><br /></b></div><div style='box-sizing: inherit; color: rgb(110, 110, 110); font-family: &quot;Avenir Next W00&quot;, &quot;Helvetica Neue&quot;, Helvetica, Arial, sans-serif; font-size: 14px;'><b>Colour:</b></div><div style='box-sizing: inherit; color: rgb(110, 110, 110); font-family: &quot;Avenir Next W00&quot;, &quot;Helvetica Neue&quot;, Helvetica, Arial, sans-serif; font-size: 14px;'>For each SA1 geography, the colour indicates which language 'wins'.<br /><br />SA1 geographies not coloured are either tied between two languages or not enough data <br /><br /><b>Colour Intensity:</b><br />The colour intensity compares the values of the winner to all other values and returns its dominance over other languages in the same geography<br /><br /><b>Notes:</b><br /><ul><li><a href='http://www.censusdata.abs.gov.au/census_services/getproduct/census/2016/quickstat/2?opendocument' style='color: purple; text-decoration-line: none; box-sizing: inherit;'>Only considers top 6 languages for VIC</a></li><li><a href='http://www.abs.gov.au/websitedbs/D3310114.nsf/Home/2016%20DataPacks' style='color: purple; text-decoration-line: none; box-sizing: inherit;'>Census 2016 DataPacks</a></li><li><a href='https://www.esri.com/arcgis-blog/products/js-api-arcgis/mapping/creating-a-predominance-visualization-with-arcade/' style='color: purple; text-decoration-line: none; box-sizing: inherit;'>Predominance Visualisations</a></li><li><a href='https://developers.arcgis.com/javascript/latest/sample-code/featurelayerview-query-stats/index.html' style='color: purple; text-decoration-line: none; box-sizing: inherit;'>Source Code</a></li></ul>Notice that while one language level appears to dominate certain geographies, it doesn't necessarily mean it represents the majority of the population. In fact, as you explore most areas, you will find the predominant language makes up just a fraction of the population due to the number of languages considered.</div>",
			"keyword": [
				"Census",
				"Australia",
				"Melbourne",
				"ABS",
				"Census2016",
				"Victoria"
			],
			"issued": "2019-05-26T06:26:53.000Z",
			"modified": "2020-11-22T22:51:33.000Z",
			"publisher": {
				"name": "Esri Australia"
			},
			"contactPoint": {
				"@type": "vcard:Contact",
				"fn": "jakc",
				"hasEmail": "https://esriaustralia.com.au/contact-us"
			},
			"accessLevel": "public",
			"spatial": "",
			"license": "Reference only",
			"distribution": [
				{
					"@type": "dcat:Distribution",
					"title": "ArcGIS Hub Dataset",
					"format": "Web Page",
					"mediaType": "text/html",
					"accessURL": "https://www.pacificgeoportal.com/apps/esriau::language-spoken-at-home-census-2016"
				},
				{
					"@type": "dcat:Distribution",
					"title": "ArcGIS GeoService",
					"format": "ArcGIS GeoServices REST API",
					"mediaType": "application/json",
					"accessURL": "https://s3-ap-southeast-2.amazonaws.com/languagesofaustralia.com/public/language.html"
				}
			],
			"theme": ""
		},
		{
			"@type": "dcat:Dataset",
			"identifier": "https://www.arcgis.com/home/item.html?id=40c7a548640d4965a0dfd2e20c426f30&sublayer=0",
			"landingPage": "https://www.pacificgeoportal.com/datasets/eaglegis::nz-general-electorate-districts-2020",
			"title": "NZ General Electorate Districts - 2020",
			"description": "<div>Topicality: April 2020 <br /></div><div>Projection: New Zealand Transverse Mercator (NZTM) <br /></div><div><span><br /></span></div><div><span>This layer contains the \nboundaries that comprise the 65 New Zealand general electorates released\n by the Representation Commission in April 2020. These boundaries will be used for the 2020 and 2023 general elections. This layer is clipped \nand generalised, therefore it doesn't fully represent the official \nboundaries.</span></div><div><br /></div><div>The Representation Commission is convened by the Surveyor-General, its role is to re-draw electorate boundaries to make sure each electorate has about the same number of people. We calculate the general electoral population, number of general electorates, and North Island and South Island electoral quotas using the formula specified in the Electoral Act 1993. When setting the boundaries, the Representation Commission also considers existing boundaries, communities of interest, the infrastructure that links communities (such as main roads), topographical features, and any projected variation in the population of those electorates during their existence.</div><div><br /></div><div>The official dataset can be found on <a href='https://datafinder.stats.govt.nz/layer/104580-general-electorates-2020/' rel='nofollow ugc' target='_blank'>StatsNZ</a></div><div><br /></div><div>For an overview of the attributes click <a href='https://eaglegis.maps.arcgis.com/home/item.html?id=40c7a548640d4965a0dfd2e20c426f30#data' rel='nofollow ugc'>here</a></div><div><br /></div><div>This layer is offered by Eagle Technology (Official Esri Distributor). Eagle Technology offers services that can be used in the ArcGIS platform. The Content team at Eagle Technology updates the layers on a regular basis and regularly adds new content to the Living Atlas. By using this content and combining it with other data you can create new information products quickly and easily.<br /><br />If you have any questions or comments about the content, please let us now  at <a href='mailto:livingatlas@eagle.co.nz' rel='nofollow ugc' target='_blank'>livingatlas@eagle.co.nz</a></div><div><br /></div>",
			"keyword": [
				"eaglegis",
				"Boundary",
				"New Zealand",
				"StatsNZ",
				"Boundaries",
				"data",
				"dataset",
				"Eagle Technology",
				"open",
				"layer",
				"web",
				"web layer",
				"service",
				"map map layer",
				"NZ",
				"Content",
				"Kiwi",
				"2020",
				"electorate",
				"general electorate",
				"election",
				"elections"
			],
			"issued": "2020-10-13T04:05:45.000Z",
			"modified": "2020-10-14T02:43:24.499Z",
			"publisher": {
				"name": "Eagle Technology Group Ltd"
			},
			"contactPoint": {
				"@type": "vcard:Contact",
				"fn": "eaglegis",
				"hasEmail": "mailto:ts@eaglegis.co.nz"
			},
			"accessLevel": "public",
			"spatial": "166.2620,-47.2230,-177.6190,-33.7734",
			"license": "https://creativecommons.org/licenses/by/4.0",
			"distribution": [
				{
					"@type": "dcat:Distribution",
					"title": "ArcGIS Hub Dataset",
					"format": "Web Page",
					"mediaType": "text/html",
					"accessURL": "https://www.pacificgeoportal.com/datasets/eaglegis::nz-general-electorate-districts-2020"
				},
				{
					"@type": "dcat:Distribution",
					"title": "ArcGIS GeoService",
					"format": "ArcGIS GeoServices REST API",
					"mediaType": "application/json",
					"accessURL": "https://services.arcgis.com/XTtANUDT8Va4DLwI/arcgis/rest/services/General_Electorates_2020/FeatureServer/0"
				},
				{
					"@type": "dcat:Distribution",
					"title": "CSV",
					"format": "CSV",
					"mediaType": "text/csv",
					"accessURL": "https://www.pacificgeoportal.com/api/download/v1/items/40c7a548640d4965a0dfd2e20c426f30/csv?layers=0"
				},
				{
					"@type": "dcat:Distribution",
					"title": "Shapefile",
					"format": "ZIP",
					"mediaType": "application/zip",
					"accessURL": "https://www.pacificgeoportal.com/api/download/v1/items/40c7a548640d4965a0dfd2e20c426f30/shapefile?layers=0"
				},
				{
					"@type": "dcat:Distribution",
					"title": "GeoJSON",
					"format": "GeoJSON",
					"mediaType": "application/vnd.geo+json",
					"accessURL": "https://www.pacificgeoportal.com/api/download/v1/items/40c7a548640d4965a0dfd2e20c426f30/geojson?layers=0"
				},
				{
					"@type": "dcat:Distribution",
					"title": "KML",
					"format": "KML",
					"mediaType": "application/vnd.google-earth.kml+xml",
					"accessURL": "https://www.pacificgeoportal.com/api/download/v1/items/40c7a548640d4965a0dfd2e20c426f30/kml?layers=0"
				},
				{
					"@type": "dcat:Distribution",
					"title": "File Geodatabase",
					"format": "ZIP",
					"mediaType": "application/zip",
					"accessURL": "https://www.pacificgeoportal.com/api/download/v1/items/40c7a548640d4965a0dfd2e20c426f30/filegdb?layers=0"
				},
				{
					"@type": "dcat:Distribution",
					"title": "Feature Collection",
					"format": "TXT",
					"mediaType": "text/plain",
					"accessURL": "https://www.pacificgeoportal.com/api/download/v1/items/40c7a548640d4965a0dfd2e20c426f30/featureCollection?layers=0"
				},
				{
					"@type": "dcat:Distribution",
					"title": "Excel",
					"format": "XLSX",
					"mediaType": "application/vnd.ms-excel",
					"accessURL": "https://www.pacificgeoportal.com/api/download/v1/items/40c7a548640d4965a0dfd2e20c426f30/excel?layers=0"
				},
				{
					"@type": "dcat:Distribution",
					"title": "GeoPackage",
					"format": "GPKG",
					"mediaType": "application/geopackage+sqlite3",
					"accessURL": "https://www.pacificgeoportal.com/api/download/v1/items/40c7a548640d4965a0dfd2e20c426f30/geoPackage?layers=0"
				},
				{
					"@type": "dcat:Distribution",
					"title": "SQLite Geodatabase",
					"format": "GDB",
					"mediaType": "application/geopackage+sqlite3",
					"accessURL": "https://www.pacificgeoportal.com/api/download/v1/items/40c7a548640d4965a0dfd2e20c426f30/sqlite?layers=0"
				}
			],
			"theme": [
				"geospatial"
			]
		},
		{
			"@type": "dcat:Dataset",
			"identifier": "https://www.arcgis.com/home/item.html?id=841312b2d53249a591ea964395cc9d61&sublayer=0",
			"landingPage": "https://www.pacificgeoportal.com/datasets/eaglegis::nz-māori-electorate-districts-2020",
			"title": "NZ Māori Electorate Districts - 2020",
			"description": "<div>Topicality: April 2020 <br /></div><div>Projection: New Zealand Transverse Mercator (NZTM) <br /></div><div><span><br /></span></div><div><span>This layer contains the \nboundaries that comprise the seven Māori electorates released by the \nRepresentation Commission in April 2020. These boundaries will be used for the 2020 and 2023 general elections. This layer is clipped and \ngeneralised, therefore it doesn't fully represent the official \nboundaries.</span></div><div><br /></div><div>The Representation Commission is convened by the Surveyor-General, its role is to re-draw electorate boundaries to make sure each electorate has about the same number of people. We calculate the Māori electoral population, number of Māori electorates and electoral quota using the formula specified in the Electoral Act 1993. When setting the boundaries, the Representation Commission also considers existing boundaries, communities of interest (including iwi affiliations), the infrastructure that links communities (such as main roads), topographical features, and any projected variation in the population of those electorates during their existence. <br /></div><div><br /></div><div>The official dataset can be found on <a href='https://datafinder.stats.govt.nz/layer/104579-maori-electorates-2020/' rel='nofollow ugc' target='_blank'>StatsNZ</a></div><div><br /></div><div>For an overview of the attributes click <a href='https://eaglegis.maps.arcgis.com/home/item.html?id=841312b2d53249a591ea964395cc9d61#data' rel='nofollow ugc'>here</a></div><div><br /></div><div>This layer is offered by Eagle Technology (Official Esri Distributor). Eagle Technology offers services that can be used in the ArcGIS platform. The Content team at Eagle Technology updates the layers on a regular basis and regularly adds new content to the Living Atlas. By using this content and combining it with other data you can create new information products quickly and easily.<br /><br />If you have any questions or comments about the content, please let us now  at <a href='mailto:livingatlas@eagle.co.nz' rel='nofollow ugc' target='_blank'>livingatlas@eagle.co.nz</a></div><div><br /></div>",
			"keyword": [
				"eaglegis",
				"Boundary",
				"New Zealand",
				"StatsNZ",
				"Boundaries",
				"data",
				"dataset",
				"Eagle Technology",
				"open",
				"layer",
				"web",
				"web layer",
				"service",
				"map map layer",
				"NZ",
				"Content",
				"Kiwi",
				"2020",
				"electorate",
				"general electorate",
				"election",
				"elections",
				"Māori",
				"Maori"
			],
			"issued": "2020-10-13T04:06:38.000Z",
			"modified": "2020-10-14T02:43:17.210Z",
			"publisher": {
				"name": "Eagle Technology Group Ltd"
			},
			"contactPoint": {
				"@type": "vcard:Contact",
				"fn": "eaglegis",
				"hasEmail": "mailto:ts@eaglegis.co.nz"
			},
			"accessLevel": "public",
			"spatial": "166.2620,-47.2230,-177.6190,-33.7734",
			"license": "https://creativecommons.org/licenses/by/4.0",
			"distribution": [
				{
					"@type": "dcat:Distribution",
					"title": "ArcGIS Hub Dataset",
					"format": "Web Page",
					"mediaType": "text/html",
					"accessURL": "https://www.pacificgeoportal.com/datasets/eaglegis::nz-māori-electorate-districts-2020"
				},
				{
					"@type": "dcat:Distribution",
					"title": "ArcGIS GeoService",
					"format": "ArcGIS GeoServices REST API",
					"mediaType": "application/json",
					"accessURL": "https://services.arcgis.com/XTtANUDT8Va4DLwI/arcgis/rest/services/Maori_Electorates_2020/FeatureServer/0"
				},
				{
					"@type": "dcat:Distribution",
					"title": "CSV",
					"format": "CSV",
					"mediaType": "text/csv",
					"accessURL": "https://www.pacificgeoportal.com/api/download/v1/items/841312b2d53249a591ea964395cc9d61/csv?layers=0"
				},
				{
					"@type": "dcat:Distribution",
					"title": "Shapefile",
					"format": "ZIP",
					"mediaType": "application/zip",
					"accessURL": "https://www.pacificgeoportal.com/api/download/v1/items/841312b2d53249a591ea964395cc9d61/shapefile?layers=0"
				},
				{
					"@type": "dcat:Distribution",
					"title": "GeoJSON",
					"format": "GeoJSON",
					"mediaType": "application/vnd.geo+json",
					"accessURL": "https://www.pacificgeoportal.com/api/download/v1/items/841312b2d53249a591ea964395cc9d61/geojson?layers=0"
				},
				{
					"@type": "dcat:Distribution",
					"title": "KML",
					"format": "KML",
					"mediaType": "application/vnd.google-earth.kml+xml",
					"accessURL": "https://www.pacificgeoportal.com/api/download/v1/items/841312b2d53249a591ea964395cc9d61/kml?layers=0"
				},
				{
					"@type": "dcat:Distribution",
					"title": "File Geodatabase",
					"format": "ZIP",
					"mediaType": "application/zip",
					"accessURL": "https://www.pacificgeoportal.com/api/download/v1/items/841312b2d53249a591ea964395cc9d61/filegdb?layers=0"
				},
				{
					"@type": "dcat:Distribution",
					"title": "Feature Collection",
					"format": "TXT",
					"mediaType": "text/plain",
					"accessURL": "https://www.pacificgeoportal.com/api/download/v1/items/841312b2d53249a591ea964395cc9d61/featureCollection?layers=0"
				},
				{
					"@type": "dcat:Distribution",
					"title": "Excel",
					"format": "XLSX",
					"mediaType": "application/vnd.ms-excel",
					"accessURL": "https://www.pacificgeoportal.com/api/download/v1/items/841312b2d53249a591ea964395cc9d61/excel?layers=0"
				},
				{
					"@type": "dcat:Distribution",
					"title": "GeoPackage",
					"format": "GPKG",
					"mediaType": "application/geopackage+sqlite3",
					"accessURL": "https://www.pacificgeoportal.com/api/download/v1/items/841312b2d53249a591ea964395cc9d61/geoPackage?layers=0"
				},
				{
					"@type": "dcat:Distribution",
					"title": "SQLite Geodatabase",
					"format": "GDB",
					"mediaType": "application/geopackage+sqlite3",
					"accessURL": "https://www.pacificgeoportal.com/api/download/v1/items/841312b2d53249a591ea964395cc9d61/sqlite?layers=0"
				}
			],
			"theme": [
				"geospatial"
			]
		},
		{
			"@type": "dcat:Dataset",
			"identifier": "https://www.arcgis.com/home/item.html?id=4663aef6b8e04541b39f92ae9325f06d&sublayer=0",
			"landingPage": "https://www.pacificgeoportal.com/datasets/eaglegis::fiji-census-2017-province",
			"title": "Fiji Census  2017 - province",
			"description": "<div><div style='font-size:17px; font-family:&quot;Avenir Next W01&quot;, &quot;Avenir Next W00&quot;, &quot;Avenir Next&quot;, Avenir, &quot;Helvetica Neue&quot;, Helvetica, Arial, sans-serif !important;'><span style='font-weight:bold;'><font size='3'>Topicality: 2017<br /></font></span></div><div><span style='font-weight:bold;'><font size='3'><span style='font-size:medium;'>Projection: Fiji 1986 - Fiji Map Grid</span></font></span></div></div><div><font size='3'><br /></font></div><div><font size='3'>This layer contains population and household information from the 2007 and 2017 census per province by the Bureau of Statistics Fiji.</font></div><div><font size='3'><br /></font></div><div><font size='3'>The data is made available by the Bureau of Statistics Fiji. More information about the 2017 Census and other statistics can be found on their website: <a href='https://www.statsfiji.gov.fj/' rel='nofollow ugc' target='_blank'>https://www.statsfiji.gov.fj/</a><br /></font></div><div><br /></div><div><a href='https://eaglegis.maps.arcgis.com/home/item.html?id=4663aef6b8e04541b39f92ae9325f06d&amp;view=table&amp;sortOrder=true&amp;sortField=defaultFSOrder#data' rel='nofollow ugc' target='_self'>View the complete list of attributes here</a></div><div><br /></div><div><font size='3'>The layer is further generalised by Eagle Technology for improved performance on the web, <span style='font-family:&quot;Avenir Next W01&quot;, &quot;Avenir Next W00&quot;, &quot;Avenir Next&quot;, Avenir, &quot;Helvetica Neue&quot;, sans-serif;'>therefore it doesn't fully represent the official boundaries. The simplification is done using the Retain Critical points (Douglas-Peucker) algorithm with a simplification tolerance of 5 meters.<br /></span></font></div><div><font size='3'><br /></font></div><div><div style='font-size:17px; font-family:&quot;Avenir Next W01&quot;, &quot;Avenir Next W00&quot;, &quot;Avenir Next&quot;, Avenir, &quot;Helvetica Neue&quot;, Helvetica, Arial, sans-serif !important;'><div><font color='#2f4f4f' size='3'>This layer is offered by Eagle Technology (Official Esri Distributor). Eagle Technology offers services that can be used in the ArcGIS platform. The Content team at Eagle Technology updates the layers on a regular basis and regularly adds new content to the Living Atlas. By using this content and combining it with other data you can create new information products quickly and easily.</font></div><div><font color='#2f4f4f' size='3'><br /></font></div><div><font color='#2f4f4f' size='3'>If you have any questions or comments about the content, please let us now  at </font><font size='3'><a href='mailto:livingatlas@eagle.co.nz' rel='nofollow ugc' style='color:rgb(0, 121, 193); text-decoration-line:none;' target='_blank'>livingatlas@eagle.co.nz</a>.</font></div></div></div>",
			"keyword": [
				"Fiji",
				"Census",
				"2017",
				"Demographics",
				"Statistics",
				"Population",
				"Housholds",
				"eaglegis",
				"Age",
				"age groups"
			],
			"issued": "2020-09-16T03:45:58.000Z",
			"modified": "2020-09-18T02:06:32.655Z",
			"publisher": {
				"name": "Eagle Technology Group Ltd"
			},
			"contactPoint": {
				"@type": "vcard:Contact",
				"fn": "eaglegis",
				"hasEmail": "mailto:ts@eaglegis.co.nz"
			},
			"accessLevel": "public",
			"spatial": "176.8440,-21.0483,-178.3397,-12.4518",
			"license": "https://creativecommons.org/licenses/by/4.0",
			"distribution": [
				{
					"@type": "dcat:Distribution",
					"title": "ArcGIS Hub Dataset",
					"format": "Web Page",
					"mediaType": "text/html",
					"accessURL": "https://www.pacificgeoportal.com/datasets/eaglegis::fiji-census-2017-province"
				},
				{
					"@type": "dcat:Distribution",
					"title": "ArcGIS GeoService",
					"format": "ArcGIS GeoServices REST API",
					"mediaType": "application/json",
					"accessURL": "https://services.arcgis.com/XTtANUDT8Va4DLwI/arcgis/rest/services/Fiji_2017_census_province/FeatureServer/0"
				},
				{
					"@type": "dcat:Distribution",
					"title": "CSV",
					"format": "CSV",
					"mediaType": "text/csv",
					"accessURL": "https://www.pacificgeoportal.com/api/download/v1/items/4663aef6b8e04541b39f92ae9325f06d/csv?layers=0"
				},
				{
					"@type": "dcat:Distribution",
					"title": "Shapefile",
					"format": "ZIP",
					"mediaType": "application/zip",
					"accessURL": "https://www.pacificgeoportal.com/api/download/v1/items/4663aef6b8e04541b39f92ae9325f06d/shapefile?layers=0"
				},
				{
					"@type": "dcat:Distribution",
					"title": "GeoJSON",
					"format": "GeoJSON",
					"mediaType": "application/vnd.geo+json",
					"accessURL": "https://www.pacificgeoportal.com/api/download/v1/items/4663aef6b8e04541b39f92ae9325f06d/geojson?layers=0"
				},
				{
					"@type": "dcat:Distribution",
					"title": "KML",
					"format": "KML",
					"mediaType": "application/vnd.google-earth.kml+xml",
					"accessURL": "https://www.pacificgeoportal.com/api/download/v1/items/4663aef6b8e04541b39f92ae9325f06d/kml?layers=0"
				},
				{
					"@type": "dcat:Distribution",
					"title": "File Geodatabase",
					"format": "ZIP",
					"mediaType": "application/zip",
					"accessURL": "https://www.pacificgeoportal.com/api/download/v1/items/4663aef6b8e04541b39f92ae9325f06d/filegdb?layers=0"
				},
				{
					"@type": "dcat:Distribution",
					"title": "Feature Collection",
					"format": "TXT",
					"mediaType": "text/plain",
					"accessURL": "https://www.pacificgeoportal.com/api/download/v1/items/4663aef6b8e04541b39f92ae9325f06d/featureCollection?layers=0"
				},
				{
					"@type": "dcat:Distribution",
					"title": "Excel",
					"format": "XLSX",
					"mediaType": "application/vnd.ms-excel",
					"accessURL": "https://www.pacificgeoportal.com/api/download/v1/items/4663aef6b8e04541b39f92ae9325f06d/excel?layers=0"
				},
				{
					"@type": "dcat:Distribution",
					"title": "GeoPackage",
					"format": "GPKG",
					"mediaType": "application/geopackage+sqlite3",
					"accessURL": "https://www.pacificgeoportal.com/api/download/v1/items/4663aef6b8e04541b39f92ae9325f06d/geoPackage?layers=0"
				},
				{
					"@type": "dcat:Distribution",
					"title": "SQLite Geodatabase",
					"format": "GDB",
					"mediaType": "application/geopackage+sqlite3",
					"accessURL": "https://www.pacificgeoportal.com/api/download/v1/items/4663aef6b8e04541b39f92ae9325f06d/sqlite?layers=0"
				}
			],
			"theme": [
				"geospatial"
			]
		},
		{
			"@type": "dcat:Dataset",
			"identifier": "https://www.arcgis.com/home/item.html?id=66f66c57343f4b7c846dd426e8b29da8",
			"landingPage": "https://www.pacificgeoportal.com/apps/LearnGIS::earthquake-watch",
			"title": "Earthquake Watch",
			"description": "This dashboard was modified from David Nyenhuis' <a href='Modified from David Nyenhuis' map ' target='_blank'>map</a>, using his blog <a href='https://www.esri.com/arcgis-blog/products/ops-dashboard/real-time/making-an-auto-focusing-real-time-dashboard/' target='_blank'>Making an Auto-Focusing Real-Time Dashboard</a>.<div>Earthquake events are from the <a href='https://www.arcgis.com/home/item.html?id=af7568d8579048f7b42e534891824029' target='_blank'>Living Atlas Recent Earthquakes layer</a>.</div>",
			"keyword": [
				"USGS",
				"Earthquake",
				"PAGER",
				"Live Feed",
				"hazards",
				"Learn ArcGIS"
			],
			"issued": "2019-04-03T17:40:47.000Z",
			"modified": "2020-08-28T10:31:20.000Z",
			"publisher": {
				"name": "Esri Tutorials"
			},
			"contactPoint": {
				"@type": "vcard:Contact",
				"fn": "Learn_ArcGIS",
				"hasEmail": "mailto:learnarcgissupport@esri.com"
			},
			"accessLevel": "public",
			"spatial": "",
			"license": "",
			"distribution": [
				{
					"@type": "dcat:Distribution",
					"title": "ArcGIS Hub Dataset",
					"format": "Web Page",
					"mediaType": "text/html",
					"accessURL": "https://www.pacificgeoportal.com/apps/LearnGIS::earthquake-watch"
				}
			],
			"theme": ""
		},
		{
			"@type": "dcat:Dataset",
			"identifier": "https://www.arcgis.com/home/item.html?id=84ba9c03786e462d960e3172bc1b2204",
			"landingPage": "https://www.pacificgeoportal.com/apps/EsriOceans::coral-bleaching-locations",
			"title": "Coral Bleaching Locations",
			"description": "<div><span style='text-align: justify;'>Coral reefs are one of the most diverse and ecologically important areas of the world. However, many reefs, are threatened by ocean temperatures that are increasingly becoming warmer than the coral animals' natural tolerance. According to </span><a href='https://oceanservice.noaa.gov/facts/coral_bleach.html' target='_blank'>NOAA</a><span style='text-align: justify;'>, when </span>water is too warm, corals will expel the algae (zooxanthellae) living in their tissues causing the coral to turn completely white. This is called coral bleaching. When a coral bleaches, it is not dead. Corals can survive a bleaching event, but they are under more stress and are subject to mortality.</div><span style='text-align: justify;'><div><br /></div>The </span><a href='https://coralreefwatch.noaa.gov/' target='_blank'>NOAA Coral Reef Watch</a><span style='text-align: justify;'> program uses satellite data to provide current reef environmental conditions to quickly identify areas at risk for coral bleaching. The station data displayed in this map are derived from satellite based measurements of ocean temperature. These &quot;virtual stations&quot; are not actual buoys or <i>in situ</i> stations transmitting data, rather a spatial analyses for reef locations around the world are derived from 5-km resolution raster data. </span><div><span style='text-align: justify;'><br /></span></div><div><span style='text-align: justify;'><b>Each station has several variables: </b></span></div><div><span style='text-align: justify;'><i>Alert Level</i>: an index of the likelihood of coral bleaching, scaled from 0 (no heat stress) to 4 (coral mortality likely) based on the attributes below<br /><br /></span></div><div><span style='text-align: justify;'><i>Sea surface temperature</i>: average nighttime temperature of the ocean surface derived from satellite measurements<br /><br /></span></div><div style='text-align: justify;'><i>Temperature anomaly</i>: a comparison of the current surface temperature to the historical average measured by satellites<br /><br /></div><div style='text-align: justify;'><i>Hotspot</i>: number of degrees above the coral's threshold tolerance (a long-term historical summer-time average)<br /><br /></div><div style='text-align: justify;'><i>Degree Heating Week</i>: amount of accumulated heat stress experienced by corals (i.e., a sum of Hotspots). Values above 8 deg C-weeks are associated with widespread bleaching and mortality</div><div><br /></div>",
			"keyword": [
				"NOAA",
				"Coral",
				"Bleaching",
				"satellite",
				"ocean",
				"heat stress",
				"web app"
			],
			"issued": "2019-03-05T20:13:52.000Z",
			"modified": "2020-07-09T02:05:20.000Z",
			"publisher": {
				"name": "Esri Ocean and Coastal Environments"
			},
			"contactPoint": {
				"@type": "vcard:Contact",
				"fn": "kvangraafeiland_oceans",
				"hasEmail": "mailto:KVanGraafeiland@esri.com"
			},
			"accessLevel": "public",
			"spatial": "",
			"license": "<span style='font-family: &quot;Avenir Next W01&quot;, &quot;Avenir Next W00&quot;, &quot;Avenir Next&quot;, Avenir, &quot;Helvetica Neue&quot;, sans-serif; font-size: 17px; overflow: auto;'><img alt='Esri logo' src='http://downloads.esri.com/blogs/arcgisonline/esrilogo_new.png' style='max-width: 100%; height: auto; border: 0px currentcolor;' /> </span><span style='font-family: &quot;Avenir Next W01&quot;, &quot;Avenir Next W00&quot;, &quot;Avenir Next&quot;, Avenir, &quot;Helvetica Neue&quot;, sans-serif; font-size: 17px;'>This work is licensed under the Esri Master License Agreement.</span><div style='font-family: &quot;Avenir Next W01&quot;, &quot;Avenir Next W00&quot;, &quot;Avenir Next&quot;, Avenir, &quot;Helvetica Neue&quot;, sans-serif; font-size: 17px; margin: 0px; padding: 0px;'><a href='http://links.esri.com/tou_summary' style='color: rgb(0, 121, 193); text-decoration-line: none;' target='_blank'>View Summary</a><span style='line-height: 1.3846;'> | </span><a href='http://links.esri.com/agol_tou' style='color: rgb(0, 121, 193); text-decoration-line: none; line-height: 1.3846;' target='_blank'>View Terms of Use</a></div>",
			"distribution": [
				{
					"@type": "dcat:Distribution",
					"title": "ArcGIS Hub Dataset",
					"format": "Web Page",
					"mediaType": "text/html",
					"accessURL": "https://www.pacificgeoportal.com/apps/EsriOceans::coral-bleaching-locations"
				}
			],
			"theme": ""
		},
		{
			"@type": "dcat:Dataset",
			"identifier": "https://www.arcgis.com/home/item.html?id=6b39c6275cac4fa8a065ca3b1da4fdfc&sublayer=0",
			"landingPage": "https://www.pacificgeoportal.com/datasets/eaglegis::new-zealand-census-2018-statistical-area-2",
			"title": "New Zealand Census 2018 - Statistical Area 2",
			"description": "<div><div style='font-size:17px; font-family:&quot;Avenir Next W01&quot;, &quot;Avenir Next W00&quot;, &quot;Avenir Next&quot;, Avenir, &quot;Helvetica Neue&quot;, Helvetica, Arial, sans-serif !important;'><font size='3'>Topicality: 27-09-2019</font></div><div style='font-size:17px; font-family:&quot;Avenir Next W01&quot;, &quot;Avenir Next W00&quot;, &quot;Avenir Next&quot;, Avenir, &quot;Helvetica Neue&quot;, Helvetica, Arial, sans-serif !important;'><div><font size='3'><span style='font-size:medium;'>Projection: New Zealand Transverse Mercator (NZTM)</span></font></div><div><font size='3'><span style='font-size:medium;'><br /></span></font></div><div><font size='3'><span>This dataset contains \noccupied and unoccupied private dwelling counts from and usually \nresident population counts from the 2006, 2013, and 2018 Censuses, with \npercentage changes between the 2013 Census and 2018 Censuses, by \nstatistical area 2.</span></font></div><div><font size='3'><span><br /></span></font></div><div><font size='3'><span>The data is sourced from https://datafinder.stats.govt.nz and is a combination of the following two datasets:</span></font><font size='3'><br /></font></div><div><ul><li><a href='https://datafinder.stats.govt.nz/layer/103905-2018-census-occupied-and-unoccupied-private-dwellings-by-statistical-area-2/' rel='nofollow ugc' target='_blank'>2018 Census occupied and unoccupied private dwellings by Statistical Area 2</a></li><li><a href='https://datafinder.stats.govt.nz/layer/103902-2018-census-usually-resident-population-and-age-groups-by-statistical-area-2/' rel='nofollow ugc' target='_blank'>2018 Census usually resident population and age groups by Statistical Area 2</a></li></ul></div></div><p><font size='3'>These statistical area 2 boundaries extend to the 12 mile limit and are as at 1 January 2018, for further information see <a href='https://datafinder.stats.govt.nz/layer/92212-statistical-area-2-2018-generalised/' rel='nofollow ugc' target='_self'>Statistical Area 2 2018 (generalised)</a>.</font></p>\n<p><font size='3'>This data uses fixed random rounding to protect confidentiality. Some counts of less than 6 are suppressed according to <a href='https://www.stats.govt.nz/methods/applying-confidentiality-rules-to-2018-census-data-and-summary-of-changes-since-2013' rel='nofollow ugc'>2018 confidentiality rules</a><br /></font></p><div style='font-size:17px; font-family:&quot;Avenir Next W01&quot;, &quot;Avenir Next W00&quot;, &quot;Avenir Next&quot;, Avenir, &quot;Helvetica Neue&quot;, Helvetica, Arial, sans-serif !important;'><div><font color='#2f4f4f' size='3'>This\n layer is offered by Eagle Technology (Official Esri Distributor). Eagle\n Technology offers services that can be used in the ArcGIS platform. The\n Content team at Eagle Technology updates the layers on a regular basis \nand regularly adds new content to the Living Atlas. By using this \ncontent and combining it with other data you can create new information \nproducts quickly and easily.</font></div><div><font color='#2f4f4f' size='3'><br /></font></div><div><font color='#2f4f4f' size='3'>If you have any questions or comments about the content, please let us now  at </font><font size='3'><a href='mailto:livingatlas@eagle.co.nz' rel='nofollow ugc' style='color:rgb(0, 121, 193); text-decoration-line:none;' target='_blank'>livingatlas@eagle.co.nz</a>.</font></div></div></div>",
			"keyword": [
				"Census 2018",
				"Kiwi",
				"Census",
				"2018",
				"Boundary",
				"New Zealand",
				"Statistics New Zealand",
				"StatsNZ",
				"Boundaries",
				"Council",
				"Region",
				"data",
				"dataset",
				"Eagle Technology",
				"open",
				"layer",
				"web",
				"web layer",
				"service",
				"map",
				"map layer",
				"NZ",
				"Content",
				"municipalities",
				"Territorial Authority",
				"Authority",
				"Authorities",
				"border",
				"boundary",
				"StatNZ",
				"Community",
				"Board",
				"Communit Board",
				"local",
				"local board",
				"city",
				"council",
				"Statistical",
				"Statistics",
				"demography",
				"statistical area",
				"area",
				"2020",
				"demographics",
				"eaglegis"
			],
			"issued": "2020-03-23T00:36:13.000Z",
			"modified": "2020-03-24T01:56:21.111Z",
			"publisher": {
				"name": "Eagle Technology Group Ltd"
			},
			"contactPoint": {
				"@type": "vcard:Contact",
				"fn": "eaglegis",
				"hasEmail": "mailto:ts@eaglegis.co.nz"
			},
			"accessLevel": "public",
			"spatial": "165.9056,-47.6217,-177.0721,-33.5600",
			"license": "https://creativecommons.org/licenses/by/4.0",
			"distribution": [
				{
					"@type": "dcat:Distribution",
					"title": "ArcGIS Hub Dataset",
					"format": "Web Page",
					"mediaType": "text/html",
					"accessURL": "https://www.pacificgeoportal.com/datasets/eaglegis::new-zealand-census-2018-statistical-area-2"
				},
				{
					"@type": "dcat:Distribution",
					"title": "ArcGIS GeoService",
					"format": "ArcGIS GeoServices REST API",
					"mediaType": "application/json",
					"accessURL": "https://services.arcgis.com/XTtANUDT8Va4DLwI/arcgis/rest/services/New_Zealand_Census_2018_Statistical_Area_2/FeatureServer/0"
				},
				{
					"@type": "dcat:Distribution",
					"title": "CSV",
					"format": "CSV",
					"mediaType": "text/csv",
					"accessURL": "https://www.pacificgeoportal.com/api/download/v1/items/6b39c6275cac4fa8a065ca3b1da4fdfc/csv?layers=0"
				},
				{
					"@type": "dcat:Distribution",
					"title": "Shapefile",
					"format": "ZIP",
					"mediaType": "application/zip",
					"accessURL": "https://www.pacificgeoportal.com/api/download/v1/items/6b39c6275cac4fa8a065ca3b1da4fdfc/shapefile?layers=0"
				},
				{
					"@type": "dcat:Distribution",
					"title": "GeoJSON",
					"format": "GeoJSON",
					"mediaType": "application/vnd.geo+json",
					"accessURL": "https://www.pacificgeoportal.com/api/download/v1/items/6b39c6275cac4fa8a065ca3b1da4fdfc/geojson?layers=0"
				},
				{
					"@type": "dcat:Distribution",
					"title": "KML",
					"format": "KML",
					"mediaType": "application/vnd.google-earth.kml+xml",
					"accessURL": "https://www.pacificgeoportal.com/api/download/v1/items/6b39c6275cac4fa8a065ca3b1da4fdfc/kml?layers=0"
				},
				{
					"@type": "dcat:Distribution",
					"title": "File Geodatabase",
					"format": "ZIP",
					"mediaType": "application/zip",
					"accessURL": "https://www.pacificgeoportal.com/api/download/v1/items/6b39c6275cac4fa8a065ca3b1da4fdfc/filegdb?layers=0"
				},
				{
					"@type": "dcat:Distribution",
					"title": "Feature Collection",
					"format": "TXT",
					"mediaType": "text/plain",
					"accessURL": "https://www.pacificgeoportal.com/api/download/v1/items/6b39c6275cac4fa8a065ca3b1da4fdfc/featureCollection?layers=0"
				},
				{
					"@type": "dcat:Distribution",
					"title": "Excel",
					"format": "XLSX",
					"mediaType": "application/vnd.ms-excel",
					"accessURL": "https://www.pacificgeoportal.com/api/download/v1/items/6b39c6275cac4fa8a065ca3b1da4fdfc/excel?layers=0"
				},
				{
					"@type": "dcat:Distribution",
					"title": "GeoPackage",
					"format": "GPKG",
					"mediaType": "application/geopackage+sqlite3",
					"accessURL": "https://www.pacificgeoportal.com/api/download/v1/items/6b39c6275cac4fa8a065ca3b1da4fdfc/geoPackage?layers=0"
				},
				{
					"@type": "dcat:Distribution",
					"title": "SQLite Geodatabase",
					"format": "GDB",
					"mediaType": "application/geopackage+sqlite3",
					"accessURL": "https://www.pacificgeoportal.com/api/download/v1/items/6b39c6275cac4fa8a065ca3b1da4fdfc/sqlite?layers=0"
				}
			],
			"theme": [
				"geospatial"
			]
		},
		{
			"@type": "dcat:Dataset",
			"identifier": "https://www.arcgis.com/home/item.html?id=6a8147ca6fd543848697ebc4be08d529&sublayer=0",
			"landingPage": "https://www.pacificgeoportal.com/datasets/eaglegis::new-zealand-census-2018-territorial-authority",
			"title": "New Zealand Census 2018 - Territorial Authority",
			"description": "<div style='font-family: &quot;Avenir Next W01&quot;, &quot;Avenir Next W00&quot;, &quot;Avenir Next&quot;, Avenir, &quot;Helvetica Neue&quot;, Helvetica, Arial, sans-serif !important; color: rgb(76, 76, 76); font-style: normal; font-variant-ligatures: normal; font-variant-caps: normal; font-weight: 400; letter-spacing: normal; orphans: 2; text-align: start; text-indent: 0px; text-transform: none; white-space: normal; widows: 2; word-spacing: 0px; -webkit-text-stroke-width: 0px; background-color: rgb(255, 255, 255); text-decoration-style: initial; text-decoration-color: initial; font-size: 17px;'><font size='3' style='font-family: inherit;'>Topicality: 27-09-2019</font></div><div style='font-family: &quot;Avenir Next W01&quot;, &quot;Avenir Next W00&quot;, &quot;Avenir Next&quot;, Avenir, &quot;Helvetica Neue&quot;, Helvetica, Arial, sans-serif !important; color: rgb(76, 76, 76); font-style: normal; font-variant-ligatures: normal; font-variant-caps: normal; font-weight: 400; letter-spacing: normal; orphans: 2; text-align: start; text-indent: 0px; text-transform: none; white-space: normal; widows: 2; word-spacing: 0px; -webkit-text-stroke-width: 0px; background-color: rgb(255, 255, 255); text-decoration-style: initial; text-decoration-color: initial; font-size: 17px;'><div style='font-family: inherit;'><font size='3' style='font-family: inherit;'><span style='font-family: inherit; font-size: medium;'>Projection: New Zealand Transverse Mercator (NZTM)</span></font></div><div style='font-family: inherit;'><font size='3' style='font-family: inherit;'><span style='font-family: inherit; font-size: medium;'><br /></span></font></div><div style='font-family: inherit;'><font size='3' style='font-family: inherit;'><span style='font-family: inherit;'>This dataset contains occupied and unoccupied private dwelling counts from and usually resident population counts from the 2006, 2013, and 2018 Censuses, with percentage changes between the 2013 Census and 2018 Censuses, by Territorial Authority.</span></font></div><div style='font-family: inherit;'><font size='3' style='font-family: inherit;'><span style='font-family: inherit;'><br /></span></font></div><div style='font-family: inherit;'><font size='3' style='font-family: inherit;'><span style='font-family: inherit;'>The data is sourced from https://datafinder.stats.govt.nz and is a combination of the following two datasets:</span></font><font size='3' style='font-family: inherit;'><br /></font></div><div style='font-family: inherit;'><ul><li><font size='3'><a href='https://datafinder.stats.govt.nz/layer/103906-2018-census-occupied-and-unoccupied-private-dwellings-by-territorial-authority-and-auckland-local-board-areas/' rel='nofollow ugc' target='_blank'>2018 Census occupied and unoccupied private dwellings by Territorial Authority</a></font></li><li><font size='3'><a href='https://datafinder.stats.govt.nz/layer/103903-2018-census-usually-resident-population-and-age-groups-by-territorial-authority-and-auckland-local-board-areas/' rel='nofollow ugc' target='_blank'>2018 Census usually resident population and age groups byTerritorial Authori</a><span style='color: rgb(0, 121, 193); text-decoration: none; font-family: inherit;'><span style='color: rgb(76, 76, 76);'>ty</span></span></font></li></ul><p><font size='3'>This data uses fixed random rounding to protect confidentiality, for further information see <a href='https://www.stats.govt.nz/methods/applying-confidentiality-rules-to-2018-census-data-and-summary-of-changes-since-2013' rel='nofollow ugc'>2018 confidentiality rules</a>.  </font></p>\n<p><font size='3'>Note: the 2018 Census counted fewer dwellings in the Marlborough \ndistrict than existed at census time. This was mainly in the Marlborough\n Sounds. If you intend to use dwelling counts at this geography, please \ncontact <a href='mailto:census.external.relations@stats.govt.nz' rel='nofollow ugc' target='_self'>census.external.relations@stats.govt.nz</a> for more information.</font></p></div></div><div style='font-family: &quot;Avenir Next W01&quot;, &quot;Avenir Next W00&quot;, &quot;Avenir Next&quot;, Avenir, &quot;Helvetica Neue&quot;, Helvetica, Arial, sans-serif !important; color: rgb(76, 76, 76); font-style: normal; font-variant-ligatures: normal; font-variant-caps: normal; font-weight: 400; letter-spacing: normal; orphans: 2; text-align: start; text-indent: 0px; text-transform: none; white-space: normal; widows: 2; word-spacing: 0px; -webkit-text-stroke-width: 0px; background-color: rgb(255, 255, 255); text-decoration-style: initial; text-decoration-color: initial; font-size: 17px;'><div style='font-family: inherit;'><font color='#2f4f4f' size='3' style='font-family: inherit;'>This layer is offered by Eagle Technology (Official Esri Distributor). Eagle Technology offers services that can be used in the ArcGIS platform. The Content team at Eagle Technology updates the layers on a regular basis and regularly adds new content to the Living Atlas. By using this content and combining it with other data you can create new information products quickly and easily.</font></div><div style='font-family: inherit;'><font color='#2f4f4f' size='3' style='font-family: inherit;'><br /></font></div><div style='font-family: inherit;'><font color='#2f4f4f' size='3' style='font-family: inherit;'>If you have any questions or comments about the content, please let us now  at </font><font size='3' style='font-family: inherit;'><a href='mailto:livingatlas@eagle.co.nz' rel='nofollow ugc' style='color: rgb(0, 121, 193); text-decoration: none; font-family: inherit;' target='_blank'>livingatlas@eagle.co.nz</a>.</font></div></div>",
			"keyword": [
				"Census 2018",
				"Kiwi",
				"Census",
				"2018",
				"Boundary",
				"New Zealand",
				"Statistics New Zealand",
				"StatsNZ",
				"Boundaries",
				"Council",
				"Region",
				"data",
				"dataset",
				"Eagle Technology",
				"open",
				"layer",
				"web",
				"web layer",
				"service",
				"map",
				"map layer",
				"NZ",
				"Content",
				"municipalities",
				"Territorial Authority",
				"Authority",
				"Authorities",
				"border",
				"boundary",
				"StatNZ",
				"Community",
				"Board",
				"Communit Board",
				"local",
				"local board",
				"city",
				"council",
				"demography",
				"area",
				"2020",
				"demographics",
				"eaglegis"
			],
			"issued": "2020-03-23T11:06:02.000Z",
			"modified": "2020-03-24T02:03:34.438Z",
			"publisher": {
				"name": "Eagle Technology Group Ltd"
			},
			"contactPoint": {
				"@type": "vcard:Contact",
				"fn": "eaglegis",
				"hasEmail": "mailto:ts@eaglegis.co.nz"
			},
			"accessLevel": "public",
			"spatial": "165.9056,-47.6217,-177.0721,-33.5600",
			"license": "https://creativecommons.org/licenses/by/4.0",
			"distribution": [
				{
					"@type": "dcat:Distribution",
					"title": "ArcGIS Hub Dataset",
					"format": "Web Page",
					"mediaType": "text/html",
					"accessURL": "https://www.pacificgeoportal.com/datasets/eaglegis::new-zealand-census-2018-territorial-authority"
				},
				{
					"@type": "dcat:Distribution",
					"title": "ArcGIS GeoService",
					"format": "ArcGIS GeoServices REST API",
					"mediaType": "application/json",
					"accessURL": "https://services.arcgis.com/XTtANUDT8Va4DLwI/arcgis/rest/services/New_Zealand_Census_2018_Territorial_Authority/FeatureServer/0"
				},
				{
					"@type": "dcat:Distribution",
					"title": "CSV",
					"format": "CSV",
					"mediaType": "text/csv",
					"accessURL": "https://www.pacificgeoportal.com/api/download/v1/items/6a8147ca6fd543848697ebc4be08d529/csv?layers=0"
				},
				{
					"@type": "dcat:Distribution",
					"title": "Shapefile",
					"format": "ZIP",
					"mediaType": "application/zip",
					"accessURL": "https://www.pacificgeoportal.com/api/download/v1/items/6a8147ca6fd543848697ebc4be08d529/shapefile?layers=0"
				},
				{
					"@type": "dcat:Distribution",
					"title": "GeoJSON",
					"format": "GeoJSON",
					"mediaType": "application/vnd.geo+json",
					"accessURL": "https://www.pacificgeoportal.com/api/download/v1/items/6a8147ca6fd543848697ebc4be08d529/geojson?layers=0"
				},
				{
					"@type": "dcat:Distribution",
					"title": "KML",
					"format": "KML",
					"mediaType": "application/vnd.google-earth.kml+xml",
					"accessURL": "https://www.pacificgeoportal.com/api/download/v1/items/6a8147ca6fd543848697ebc4be08d529/kml?layers=0"
				},
				{
					"@type": "dcat:Distribution",
					"title": "File Geodatabase",
					"format": "ZIP",
					"mediaType": "application/zip",
					"accessURL": "https://www.pacificgeoportal.com/api/download/v1/items/6a8147ca6fd543848697ebc4be08d529/filegdb?layers=0"
				},
				{
					"@type": "dcat:Distribution",
					"title": "Feature Collection",
					"format": "TXT",
					"mediaType": "text/plain",
					"accessURL": "https://www.pacificgeoportal.com/api/download/v1/items/6a8147ca6fd543848697ebc4be08d529/featureCollection?layers=0"
				},
				{
					"@type": "dcat:Distribution",
					"title": "Excel",
					"format": "XLSX",
					"mediaType": "application/vnd.ms-excel",
					"accessURL": "https://www.pacificgeoportal.com/api/download/v1/items/6a8147ca6fd543848697ebc4be08d529/excel?layers=0"
				},
				{
					"@type": "dcat:Distribution",
					"title": "GeoPackage",
					"format": "GPKG",
					"mediaType": "application/geopackage+sqlite3",
					"accessURL": "https://www.pacificgeoportal.com/api/download/v1/items/6a8147ca6fd543848697ebc4be08d529/geoPackage?layers=0"
				},
				{
					"@type": "dcat:Distribution",
					"title": "SQLite Geodatabase",
					"format": "GDB",
					"mediaType": "application/geopackage+sqlite3",
					"accessURL": "https://www.pacificgeoportal.com/api/download/v1/items/6a8147ca6fd543848697ebc4be08d529/sqlite?layers=0"
				}
			],
			"theme": [
				"geospatial"
			]
		},
		{
			"@type": "dcat:Dataset",
			"identifier": "https://www.arcgis.com/home/item.html?id=b7d6aa1005c74696ae15f17c21273383&sublayer=0",
			"landingPage": "https://www.pacificgeoportal.com/datasets/eaglegis::nz-supermarkets",
			"title": "NZ Supermarkets",
			"description": "<div><span>Topicality: April 2020</span></div><div><span>Projection: New Zealand Transverse Mercator (NZTM)<br /></span></div><div><span><br /></span></div><div><span>This layer shows New Zealand supermarket building outlines, sourced and published by LINZ. The \nlayers has information about the name and address of the supermarket.</span></div><div><span><br /></span></div><div><font color='#2f4f4f' size='3'>This\n layer is offered by Eagle Technology (Official Esri Distributor). Eagle\n Technology offers services that can be used in the ArcGIS platform. The\n Content team at Eagle Technology updates the layers on a regular basis \nand regularly adds new content to the Living Atlas. By using this \ncontent and combining it with other data you can create new information \nproducts quickly and easily.</font><div><font color='#2f4f4f' size='3'><br /></font></div><div><font color='#2f4f4f' size='3'>If you have any questions or comments about the content, please let us now  at </font><font size='3'><a href='mailto:livingatlas@eagle.co.nz' rel='nofollow ugc' style='color:rgb(0, 121, 193); text-decoration-line:none;' target='_blank'>livingatlas@eagle.co.nz</a>.</font></div><span></span></div>",
			"keyword": [
				"Base Data",
				"Supermarkets",
				"Pak 'n Save",
				"Fresh Choice",
				"New World",
				"kiwi",
				"New Zealand",
				"NZ",
				"commercial",
				"Four Square",
				"grocery",
				"groceries",
				"Countdown",
				"FreshChoice",
				"Newworld",
				"count down",
				"pak n save",
				"LINZ",
				"Supermarket"
			],
			"issued": "2020-04-22T01:19:32.000Z",
			"modified": "2020-04-22T01:30:20.949Z",
			"publisher": {
				"name": "Eagle Technology Group Ltd"
			},
			"contactPoint": {
				"@type": "vcard:Contact",
				"fn": "eaglegis",
				"hasEmail": "mailto:ts@eaglegis.co.nz"
			},
			"accessLevel": "public",
			"spatial": "167.5716,-46.8725,178.1724,-34.7048",
			"license": "https://creativecommons.org/licenses/by/4.0",
			"distribution": [
				{
					"@type": "dcat:Distribution",
					"title": "ArcGIS Hub Dataset",
					"format": "Web Page",
					"mediaType": "text/html",
					"accessURL": "https://www.pacificgeoportal.com/datasets/eaglegis::nz-supermarkets"
				},
				{
					"@type": "dcat:Distribution",
					"title": "ArcGIS GeoService",
					"format": "ArcGIS GeoServices REST API",
					"mediaType": "application/json",
					"accessURL": "https://services.arcgis.com/XTtANUDT8Va4DLwI/arcgis/rest/services/LINZ_Supermarkets_building_outlines/FeatureServer/0"
				},
				{
					"@type": "dcat:Distribution",
					"title": "CSV",
					"format": "CSV",
					"mediaType": "text/csv",
					"accessURL": "https://www.pacificgeoportal.com/api/download/v1/items/b7d6aa1005c74696ae15f17c21273383/csv?layers=0"
				},
				{
					"@type": "dcat:Distribution",
					"title": "Shapefile",
					"format": "ZIP",
					"mediaType": "application/zip",
					"accessURL": "https://www.pacificgeoportal.com/api/download/v1/items/b7d6aa1005c74696ae15f17c21273383/shapefile?layers=0"
				},
				{
					"@type": "dcat:Distribution",
					"title": "GeoJSON",
					"format": "GeoJSON",
					"mediaType": "application/vnd.geo+json",
					"accessURL": "https://www.pacificgeoportal.com/api/download/v1/items/b7d6aa1005c74696ae15f17c21273383/geojson?layers=0"
				},
				{
					"@type": "dcat:Distribution",
					"title": "KML",
					"format": "KML",
					"mediaType": "application/vnd.google-earth.kml+xml",
					"accessURL": "https://www.pacificgeoportal.com/api/download/v1/items/b7d6aa1005c74696ae15f17c21273383/kml?layers=0"
				},
				{
					"@type": "dcat:Distribution",
					"title": "File Geodatabase",
					"format": "ZIP",
					"mediaType": "application/zip",
					"accessURL": "https://www.pacificgeoportal.com/api/download/v1/items/b7d6aa1005c74696ae15f17c21273383/filegdb?layers=0"
				},
				{
					"@type": "dcat:Distribution",
					"title": "Feature Collection",
					"format": "TXT",
					"mediaType": "text/plain",
					"accessURL": "https://www.pacificgeoportal.com/api/download/v1/items/b7d6aa1005c74696ae15f17c21273383/featureCollection?layers=0"
				},
				{
					"@type": "dcat:Distribution",
					"title": "Excel",
					"format": "XLSX",
					"mediaType": "application/vnd.ms-excel",
					"accessURL": "https://www.pacificgeoportal.com/api/download/v1/items/b7d6aa1005c74696ae15f17c21273383/excel?layers=0"
				},
				{
					"@type": "dcat:Distribution",
					"title": "GeoPackage",
					"format": "GPKG",
					"mediaType": "application/geopackage+sqlite3",
					"accessURL": "https://www.pacificgeoportal.com/api/download/v1/items/b7d6aa1005c74696ae15f17c21273383/geoPackage?layers=0"
				},
				{
					"@type": "dcat:Distribution",
					"title": "SQLite Geodatabase",
					"format": "GDB",
					"mediaType": "application/geopackage+sqlite3",
					"accessURL": "https://www.pacificgeoportal.com/api/download/v1/items/b7d6aa1005c74696ae15f17c21273383/sqlite?layers=0"
				}
			],
			"theme": [
				"geospatial"
			]
		},
		{
			"@type": "dcat:Dataset",
			"identifier": "https://www.arcgis.com/home/item.html?id=b089ed95a3244a65ba0e9113c68b9d15",
			"landingPage": "https://www.pacificgeoportal.com/apps/eaglegis::new-zealand-census-65-and-over",
			"title": "New Zealand Census - 65 and over",
			"description": "<div>This app shows the population and the population 65 years and over. This app is based of the data from the 2018 Census, published by StatNZ.</div><div><br /></div><div>For more information on the the data please refer to the respective layer:</div><div>- <a href='https://eaglegis.maps.arcgis.com/home/item.html?id=6b39c6275cac4fa8a065ca3b1da4fdfc' rel='nofollow ugc' target='_blank'>Census 2018 - Statistical Area 2</a></div><div>- <a href='https://eaglegis.maps.arcgis.com/home/item.html?id=6a8147ca6fd543848697ebc4be08d529' rel='nofollow ugc' target='_blank'>Census 2018 - Territorial Authority</a></div><div><br /></div>",
			"keyword": [
				"65 and over",
				"population",
				"Statistical Area 2",
				"NZ",
				"New Zealand",
				"Kiwi",
				"Census 2018"
			],
			"issued": "2020-03-23T09:57:09.000Z",
			"modified": "2020-03-25T03:20:55.000Z",
			"publisher": {
				"name": "Eagle Technology Group Ltd"
			},
			"contactPoint": {
				"@type": "vcard:Contact",
				"fn": "eaglegis",
				"hasEmail": "mailto:ts@eaglegis.co.nz"
			},
			"accessLevel": "public",
			"spatial": "",
			"license": "https://creativecommons.org/licenses/by/4.0",
			"distribution": [
				{
					"@type": "dcat:Distribution",
					"title": "ArcGIS Hub Dataset",
					"format": "Web Page",
					"mediaType": "text/html",
					"accessURL": "https://www.pacificgeoportal.com/apps/eaglegis::new-zealand-census-65-and-over"
				},
				{
					"@type": "dcat:Distribution",
					"title": "ArcGIS GeoService",
					"format": "ArcGIS GeoServices REST API",
					"mediaType": "application/json",
					"accessURL": "https://eaglegis.maps.arcgis.com/apps/Media/index.html?appid=b089ed95a3244a65ba0e9113c68b9d15"
				}
			],
			"theme": ""
		},
		{
			"@type": "dcat:Dataset",
			"identifier": "https://www.arcgis.com/home/item.html?id=b834a68d7a484c5fb473d4ba90d35e71",
			"landingPage": "https://www.pacificgeoportal.com/maps/esri::openstreetmap",
			"title": "OpenStreetMap",
			"description": "<p><span>This web map </span><span><span><span><span><span><span><span><span><span><span>references the live tiled map service from the OpenStreetMap  (OSM) project. OpenStreetMap (OSM) is an open collaborative project to  create a free editable map of the world. Volunteers gather location data  using GPS, local knowledge, and other free sources of information and upload it. The resulting free map can be  viewed and downloaded from the OpenStreetMap server: <a href='https://www.openstreetmap.org/'>https://www.OpenStreetMap.org</a>.  See that website for additional information about OpenStreetMap. It is made available as a basemap for GIS work in ESRI products under a <a href='https://creativecommons.org/licenses/by-sa/2.0'>Creative Commons Attribution-ShareAlike license</a>. </span></span></span></span></span></span></span></span></span></span><br /><span><br /><span><span><span><span><span><span><span><span><span><span><span><span><span><span><span><span><span><span><span><span><span><span><span><span><span><span><span><span><span><span><span><span><span><span><span><span><span><span><span><span><span><span><span><span><span><span><span><span><span><span><span><span><span><span><span><span><span><span><span><span><span><span><span><span><span><span><span><span><span><span><span><span><span><span><b>Tip:</b> This service is one of the basemaps used in the <a target='_self'>ArcGIS.com map viewer</a>.  Simply click one of those links to launch the interactive application  of your choice, and then choose Open Street Map from the  Basemap control to start using this service. You'll also find this  service in the Basemap gallery in ArcGIS Explorer Desktop and ArcGIS  Desktop 10. </span></span></span></span></span></span></span></span></span></span></span></span></span></span></span></span></span></span></span></span></span></span></span></span></span></span></span></span></span></span></span></span></span></span></span></span></span></span></span></span></span></span></span></span></span></span></span></span></span></span></span></span></span></span></span></span></span></span></span></span></span></span></span></span></span></span></span></span></span></span></span></span></span></span><br /></span></p><p><span><span><span><span><span><span><span><span><span><span><span><span><span><span><b>Tip:</b> Here are some well known locations as they appear in this web map, accessed by launching the web map with a URL that contains location parameters: </span></span></span></span></span></span></span></span></span></span></span></span></span></span><a href='https://www.arcgis.com/home/webmap/viewer.html?webmap=b834a68d7a484c5fb473d4ba90d35e71&amp;extent=23.436623,37.747474,24.053230,38.143839' target='_self'>Athens</a>, <a href='https://www.arcgis.com/home/webmap/viewer.html?webmap=b834a68d7a484c5fb473d4ba90d35e71&amp;extent=31.118824,29.965451,31.385586,30.165420' target='_self'>Cairo</a>, <a href='https://www.arcgis.com/home/webmap/viewer.html?webmap=b834a68d7a484c5fb473d4ba90d35e71&amp;extent=106.498348,-6.500653,107.132122,-6.007164' target='_self'>Jakarta</a>, <a href='https://www.arcgis.com/home/webmap/viewer.html?webmap=b834a68d7a484c5fb473d4ba90d35e71&amp;center=37.620621,55.747985&amp;level=11' target='_self'>Moscow</a>, <a href='https://www.arcgis.com/home/webmap/viewer.html?webmap=b834a68d7a484c5fb473d4ba90d35e71&amp;center=72.884045,19.120813&amp;level=11' target='_self'>Mumbai</a>, <a href='https://www.arcgis.com/home/webmap/viewer.html?webmap=b834a68d7a484c5fb473d4ba90d35e71&amp;extent=36.777168,-1.341149,36.918789,-1.223763' target='_self'>Nairobi</a>, <a href='https://www.arcgis.com/home/webmap/viewer.html?webmap=b834a68d7a484c5fb473d4ba90d35e71&amp;extent=2.234474,48.815845,2.457290,48.926723' target='_self'>Paris</a>, <a href='https://www.arcgis.com/home/webmap/viewer.html?webmap=b834a68d7a484c5fb473d4ba90d35e71&amp;extent=-43.342309,-23.030222,-43.056321,-22.850322' target='_self'>Rio De Janeiro</a>, <a href='https://www.arcgis.com/home/webmap/viewer.html?webmap=b834a68d7a484c5fb473d4ba90d35e71&amp;extent=121.317204,31.139435,121.617611,31.342271' target='_self'>Shanghai</a></p>",
			"keyword": [
				"world",
				"Open Street Map",
				"OSM",
				"OpenStreetMap",
				"international",
				"road",
				"roads",
				"street",
				"streets",
				"wiki",
				"basemap",
				"current",
				"transportation",
				"partner_basemap"
			],
			"issued": "2010-05-22T16:04:55.000Z",
			"modified": "2020-01-06T15:56:52.000Z",
			"publisher": {
				"name": "Esri"
			},
			"contactPoint": {
				"@type": "vcard:Contact",
				"fn": "esri",
				"hasEmail": "{{orgContactEmail}}"
			},
			"accessLevel": "public",
			"spatial": "-30.9265,29.5065,47.1204,59.5176",
			"license": "https://creativecommons.org/licenses/by-sa/2.0",
			"distribution": [
				{
					"@type": "dcat:Distribution",
					"title": "ArcGIS Hub Dataset",
					"format": "Web Page",
					"mediaType": "text/html",
					"accessURL": "https://www.pacificgeoportal.com/maps/esri::openstreetmap"
				}
			],
			"theme": [
				"geospatial"
			]
		},
		{
			"@type": "dcat:Dataset",
			"identifier": "https://www.arcgis.com/home/item.html?id=84c20f0aa7ae4b3eb7b60df68172acd6",
			"landingPage": "https://www.pacificgeoportal.com/maps/84c20f0aa7ae4b3eb7b60df68172acd6",
			"title": "Coral Reef Bleaching (Current Conditions)",
			"description": "\n\n<p style='margin: 0px; line-height: normal;'><span style='margin: 0px; color: black; font-family: &quot;Segoe UI&quot;,sans-serif; font-size: 9pt;'>Coral reefs are one of the most diverse and ecologically important\nareas of the world. However, many reefs, are threatened by ocean temperatures\nthat are increasingly becoming warmer than the coral animals' natural\ntolerance. According to </span><u><span style='margin: 0px; color: rgb(0, 102, 204); font-family: &quot;Segoe UI&quot;,sans-serif; font-size: 9pt;'><a href='https://oceanservice.noaa.gov/facts/coral_bleach.html'><span style='margin: 0px; color: rgb(0, 102, 204);'>NOAA</span></a></span></u><span style='margin: 0px; color: black; font-family: &quot;Segoe UI&quot;,sans-serif; font-size: 9pt;'>, when water is too warm, corals will expel the algae\n(zooxanthellae) living in their tissues causing the coral to turn completely\nwhite. This is called coral bleaching. When a coral bleaches, it is not dead.\nCorals can survive a bleaching event, but they are under more stress and are\nsubject to mortality.</span></p>\n\n<p style='margin: 0px; line-height: normal;'><span style='margin: 0px; color: black; font-family: &quot;Segoe UI&quot;,sans-serif; font-size: 9pt;'><font color='#000000' face='Times New Roman' size='3'><br /></font>\n<br />\n</span></p>\n\n<p style='margin: 0px; line-height: normal;'><span style='margin: 0px; color: black; font-family: &quot;Segoe UI&quot;,sans-serif; font-size: 9pt;'>The </span><u><span style='margin: 0px; color: rgb(0, 102, 204); font-family: &quot;Segoe UI&quot;,sans-serif; font-size: 9pt;'><a href='https://coralreefwatch.noaa.gov/'><span style='margin: 0px; color: rgb(0, 102, 204);'>NOAA Coral\nReef Watch</span></a></span></u><span style='margin: 0px; color: black; font-family: &quot;Segoe UI&quot;,sans-serif; font-size: 9pt;'> program uses satellite data to provide current reef environmental\nconditions to quickly identify areas at risk for coral bleaching. The station\ndata displayed in this map are derived from satellite based measurements of\nocean temperature. These &quot;virtual stations&quot; are not actual buoys or <i>in situ</i> stations transmitting data,\nrather a spatial analyses for reef locations around the world are derived from\n5 km resolution raster data. </span></p>\n\n<p style='margin: 0px; text-align: justify; line-height: normal;'><span style='margin: 0px; color: black; font-family: &quot;Segoe UI&quot;,sans-serif; font-size: 9pt;'><font color='#000000' face='Times New Roman' size='3'><br /></font>\n<br />\n</span></p>\n\n<p style='margin: 0px; text-align: justify; line-height: normal;'><span style='margin: 0px; color: black; font-family: &quot;Segoe UI&quot;,sans-serif; font-size: 9pt;'>There are\n213 points for the virtual stations around the world along with polygons\ndescribing the major tropical coral reef systems. </span></p>\n\n<p style='margin: 0px; line-height: normal;'><span style='margin: 0px; color: black; font-family: &quot;Segoe UI&quot;,sans-serif; font-size: 9pt;'><font color='#000000' face='Times New Roman' size='3'><br /></font>\n<br />\n</span></p>\n\n<p style='margin: 0px; line-height: normal;'><b><span style='margin: 0px; color: black; font-family: &quot;Segoe UI&quot;,sans-serif; font-size: 9pt;'>Each station has several variables: </span></b><span style='margin: 0px; color: black; font-family: &quot;Segoe UI&quot;,sans-serif; font-size: 9pt;'></span></p>\n\n<p style='margin: 0px 0px 0px 48px; text-align: justify; line-height: normal; text-indent: -0.25in;'><span style='margin: 0px; color: black; font-family: &quot;Times New Roman&quot;,serif; font-size: 9pt;'><span style='margin: 0px;'>·<span style='font: 7pt &quot;Times New Roman&quot;; margin: 0px; font-size-adjust: none; font-stretch: normal;'>         \n</span></span></span><i><span style='margin: 0px; color: black; font-family: &quot;Segoe UI&quot;,sans-serif; font-size: 9pt;'>Alert\nLevel</span></i><span style='margin: 0px; color: black; font-family: &quot;Segoe UI&quot;,sans-serif; font-size: 9pt;'>: an index of the likelihood of coral bleaching, scaled from 0 (no\nheat stress) to 4 (coral mortality likely) based on the attributes below</span></p>\n\n<p style='margin: 0px 0px 0px 48px; text-align: justify; line-height: normal; text-indent: -0.25in;'><span style='margin: 0px; color: black; font-family: &quot;Times New Roman&quot;,serif; font-size: 9pt;'><span style='margin: 0px;'>·<span style='font: 7pt &quot;Times New Roman&quot;; margin: 0px; font-size-adjust: none; font-stretch: normal;'>         \n</span></span></span><i><span style='margin: 0px; color: black; font-family: &quot;Segoe UI&quot;,sans-serif; font-size: 9pt;'>Sea\nsurface temperature</span></i><span style='margin: 0px; color: black; font-family: &quot;Segoe UI&quot;,sans-serif; font-size: 9pt;'>: average temperature of the ocean surface derived from satellite\nmeasurements</span></p>\n\n<p style='margin: 0px 0px 0px 48px; text-align: justify; line-height: normal; text-indent: -0.25in;'><span style='margin: 0px; color: black; font-family: &quot;Times New Roman&quot;,serif; font-size: 9pt;'><span style='margin: 0px;'>·<span style='font: 7pt &quot;Times New Roman&quot;; margin: 0px; font-size-adjust: none; font-stretch: normal;'>         \n</span></span></span><i><span style='margin: 0px; color: black; font-family: &quot;Segoe UI&quot;,sans-serif; font-size: 9pt;'>Temperature\nanomaly</span></i><span style='margin: 0px; color: black; font-family: &quot;Segoe UI&quot;,sans-serif; font-size: 9pt;'>: a comparison of the current surface temperature to the 1981-2010\nhistorical average</span></p>\n\n<p style='margin: 0px 0px 0px 48px; text-align: justify; line-height: normal; text-indent: -0.25in;'><span style='margin: 0px; color: black; font-family: &quot;Times New Roman&quot;,serif; font-size: 9pt;'><span style='margin: 0px;'>·<span style='font: 7pt &quot;Times New Roman&quot;; margin: 0px; font-size-adjust: none; font-stretch: normal;'>         \n</span></span></span><i><span style='margin: 0px; color: black; font-family: &quot;Segoe UI&quot;,sans-serif; font-size: 9pt;'>Hotspots</span></i><span style='margin: 0px; color: black; font-family: &quot;Segoe UI&quot;,sans-serif; font-size: 9pt;'>: number\nof degrees above the coral's threshold tolerance</span></p>\n\n<p style='margin: 0px 0px 0px 48px; text-align: justify; line-height: normal; text-indent: -0.25in;'><span style='margin: 0px; color: black; font-family: &quot;Times New Roman&quot;,serif; font-size: 9pt;'><span style='margin: 0px;'>·<span style='font: 7pt &quot;Times New Roman&quot;; margin: 0px; font-size-adjust: none; font-stretch: normal;'>         \n</span></span></span><i><span style='margin: 0px; color: black; font-family: &quot;Segoe UI&quot;,sans-serif; font-size: 9pt;'>Degree\nHeating Weeks</span></i><span style='margin: 0px; color: black; font-family: &quot;Segoe UI&quot;,sans-serif; font-size: 9pt;'>: accumulated thermal stress experienced by corals</span></p>",
			"keyword": [
				"coral",
				"reef",
				"bleach",
				"bleaching",
				"NOAA",
				"risk"
			],
			"issued": "2019-05-30T21:36:50.000Z",
			"modified": "2019-06-05T13:45:09.000Z",
			"publisher": {
				"name": "{{source}}"
			},
			"contactPoint": {
				"@type": "vcard:Contact",
				"fn": "SnorkelingQuest",
				"hasEmail": "{{orgContactEmail}}"
			},
			"accessLevel": "public",
			"spatial": "-111.5197,-15.2386,-38.4825,44.0584",
			"license": "This is public data from NOAA.",
			"distribution": [
				{
					"@type": "dcat:Distribution",
					"title": "ArcGIS Hub Dataset",
					"format": "Web Page",
					"mediaType": "text/html",
					"accessURL": "https://www.pacificgeoportal.com/maps/84c20f0aa7ae4b3eb7b60df68172acd6"
				}
			],
			"theme": [
				"geospatial"
			]
		},
		{
			"@type": "dcat:Dataset",
			"identifier": "https://www.arcgis.com/home/item.html?id=7bc0b8c75b0244b7a8128ae1f398bfc0",
			"landingPage": "https://www.pacificgeoportal.com/content/esri::bioclimate-projections-12-annual-precipitation",
			"title": "Bioclimate Projections: (12) Annual Precipitation",
			"description": "<p><span style='color:#dc143c;'><strong>Retirement Notice:</strong></span><strong> This </strong><a target='_blank' href='https://goto.arcgis.com/termsofuse/beta' rel='nofollow ugc noopener noreferrer'><strong>beta</strong></a><strong> item will be retired in December 2026. A</strong><a target='_blank' href='https://www.arcgis.com/home/item.html?id=59ffddea52ac4875afa8605b1a9e7568' rel='nofollow ugc noopener noreferrer'><strong> new version of this item</strong></a><strong>&nbsp;is available for your use. </strong>Esri recommends updating your maps and apps to use the new version.</p><div><p><span style='background-attachment:initial; background-clip:initial; background-image:initial; background-origin:initial; background-position:initial; background-repeat:initial; background-size:initial;'>This layer represents CMIP6 future projections of total annual precipitation. This layer can be used to compare with recent climate histories to better understand the potential impacts of future climate change.</span></p><p><a target='_blank' href='https://worldclim.org/' rel='nofollow ugc noopener noreferrer'><span style='background-attachment:initial; background-clip:initial; background-image:initial; background-origin:initial; background-position:initial; background-repeat:initial; background-size:initial;'>WorldClim</span></a><span style='background-attachment:initial; background-clip:initial; background-image:initial; background-origin:initial; background-position:initial; background-repeat:initial; background-size:initial;'>&nbsp;produced this projection as part of a series of&nbsp;</span><a target='_blank' href='https://pubs.usgs.gov/ds/691/ds691.pdf' rel='nofollow ugc noopener noreferrer'><span style='background-attachment:initial; background-clip:initial; background-image:initial; background-origin:initial; background-position:initial; background-repeat:initial; background-size:initial;'>19 bioclimate variables identified by the USGS</span></a><span style='background-attachment:initial; background-clip:initial; background-image:initial; background-origin:initial; background-position:initial; background-repeat:initial; background-size:initial;'>&nbsp;and provides this description:</span><br /><br /><i>\"Bioclimatic variables are derived from the monthly temperature and rainfall values in order to generate more biologically meaningful variables. These are often used in species distribution modeling and related ecological modeling techniques. The bioclimatic variables represent annual trends (e.g., mean annual temperature, annual precipitation) seasonality (e.g., annual range in temperature and precipitation) and extreme or limiting environmental factors (e.g., temperature of the coldest and warmest month, and precipitation of the wet and dry quarters). A quarter is a period of three months (1/4 of the year).\"</i></p><p style='background-attachment:initial; background-clip:initial; background-image:initial; background-origin:initial; background-position:initial; background-repeat:initial; background-size:initial; margin-bottom:0in;'><strong>Time Extent:</strong>&nbsp;averages from 2021-2040, 2041-2060, 2061-2080, 2081-2100<br /><strong>Units:</strong>&nbsp;mm<br /><strong>Cell Size:</strong> 2.5 minutes (~5 km)<br /><strong>Source Type:</strong> Stretched<br /><strong>Pixel Type:</strong> 32 Bit Float<br /><strong>Data Projection:</strong> GCS WGS84<br /><strong>Mosaic Projection:</strong> GCS WGS84<br /><strong>Extent:</strong> Global<br /><strong>Source:</strong> <a target='_blank' href='https://worldclim.org/data/cmip6/cmip6_clim2.5m.html' rel='nofollow ugc noopener noreferrer'>WorldClim CMIP6 Bioclimate</a><br />&nbsp;</p><p><strong>Climate Scenarios</strong></p><p>The CMIP6 climate experiments use&nbsp;<a target='_blank' href='https://www.carbonbrief.org/explainer-how-shared-socioeconomic-pathways-explore-future-climate-change/' rel='nofollow ugc noopener noreferrer'>Shared Socioeconomic Pathways (SSPs)</a>&nbsp;to model future climate scenarios. Each SSP pairs a human/community behavior component with the traditional RCP greenhouse gas forcing from the previous CMIP5. Three SSPs were chosen by Esri to be included in the service based on user requests: SSP2 4.5, SSP3 7.0 and SSP5 8.5.</p><figure><table style='background-color:rgb(248, 249, 250); border-collapse:collapse;' width='850' cellpadding='0' cellspacing='0' border='1'><tbody><tr><td style='background-color:rgb(234, 236, 240); border:1pt solid rgb(162, 169, 177); padding:2.4pt 4.8pt;'><p style='margin:12pt 0in; text-align:center;'><span style='color:rgb(32,33,34); font-family:Arial, sans-serif; font-size:10.5pt;'><strong>SSP</strong></span></p></td><td style='background-color:rgb(234, 236, 240); border-bottom:1pt solid rgb(162, 169, 177); border-image:initial; border-left-style:none; border-right:1pt solid rgb(162, 169, 177); border-top:1pt solid rgb(162, 169, 177); padding:2.4pt 4.8pt;'><p style='margin:12pt 0in; text-align:center;'><span style='color:rgb(32,33,34); font-family:Arial, sans-serif; font-size:10.5pt;'><strong>Scenario</strong></span></p></td><td style='background-color:rgb(234, 236, 240); border-bottom:1pt solid rgb(162, 169, 177); border-image:initial; border-left-style:none; border-right:1pt solid rgb(162, 169, 177); border-top:1pt solid rgb(162, 169, 177); padding:2.4pt 4.8pt;'><p style='margin:12pt 0in; text-align:center;'><span style='color:rgb(32,33,34); font-family:Arial, sans-serif; font-size:10.5pt;'><strong>Estimated warming</strong></span><br /><span style='color:rgb(32,33,34); font-family:Arial, sans-serif; font-size:10.5pt;'><strong>(2041–2060)</strong></span></p></td><td style='background-color:rgb(234, 236, 240); border-bottom:1pt solid rgb(162, 169, 177); border-image:initial; border-left-style:none; border-right:1pt solid rgb(162, 169, 177); border-top:1pt solid rgb(162, 169, 177); padding:2.4pt 4.8pt;'><p style='margin:12pt 0in; text-align:center;'><span style='color:rgb(32,33,34); font-family:Arial, sans-serif; font-size:10.5pt;'><strong>Estimated warming</strong></span><br /><span style='color:rgb(32,33,34); font-family:Arial, sans-serif; font-size:10.5pt;'><strong>(2081–2100)</strong></span></p></td><td style='background-color:rgb(234, 236, 240); border-bottom:1pt solid rgb(162, 169, 177); border-image:initial; border-left-style:none; border-right:1pt solid rgb(162, 169, 177); border-top:1pt solid rgb(162, 169, 177); padding:2.4pt 4.8pt;'><p style='margin:12pt 0in; text-align:center;'><span style='color:rgb(32,33,34); font-family:Arial, sans-serif; font-size:10.5pt;'><strong>Very likely range in °C</strong></span><br /><span style='color:rgb(32,33,34); font-family:Arial, sans-serif; font-size:10.5pt;'><strong>(2081–2100)</strong></span></p></td></tr><tr><td style='border-bottom:1pt solid rgb(162, 169, 177); border-image:initial; border-left:1pt solid rgb(162, 169, 177); border-right:1pt solid rgb(162, 169, 177); border-top-style:none; padding:2.4pt 4.8pt;'><p style='margin:12pt 0in; text-align:center;'><span style='color:rgb(32,33,34); font-family:Arial, sans-serif; font-size:10.5pt;'>SSP2-4.5</span></p></td><td style='border-bottom:1pt solid rgb(162, 169, 177); border-left-style:none; border-right:1pt solid rgb(162, 169, 177); border-top-style:none; padding:2.4pt 4.8pt;'><p style='margin:12pt 0in; text-align:center;'><span style='color:rgb(32,33,34); font-family:Arial, sans-serif; font-size:10.5pt;'>intermediate GHG emissions:</span><br /><span style='color:rgb(32,33,34); font-family:Arial, sans-serif; font-size:10.5pt;'>CO</span><span style='color:rgb(32,33,34); font-family:Arial, sans-serif; font-size:8.5pt;'><sub>2</sub></span><span style='color:rgb(32,33,34); font-family:Arial, sans-serif; font-size:10.5pt;'>&nbsp;emissions around current levels until 2050, then falling but not reaching net zero by 2100</span></p></td><td style='border-bottom:1pt solid rgb(162, 169, 177); border-left-style:none; border-right:1pt solid rgb(162, 169, 177); border-top-style:none; padding:2.4pt 4.8pt;'><p style='margin:12pt 0in; text-align:center;'><span style='color:rgb(32,33,34); font-family:Arial, sans-serif; font-size:10.5pt;'>2.0 °C</span></p></td><td style='border-bottom:1pt solid rgb(162, 169, 177); border-left-style:none; border-right:1pt solid rgb(162, 169, 177); border-top-style:none; padding:2.4pt 4.8pt;'><p style='margin:12pt 0in; text-align:center;'><span style='color:rgb(32,33,34); font-family:Arial, sans-serif; font-size:10.5pt;'>2.7 °C</span></p></td><td style='border-bottom:1pt solid rgb(162, 169, 177); border-left-style:none; border-right:1pt solid rgb(162, 169, 177); border-top-style:none; padding:2.4pt 4.8pt;'><p style='margin:12pt 0in; text-align:center;'><span style='color:rgb(32,33,34); font-family:Arial, sans-serif; font-size:10.5pt;'>2.1 – 3.5</span></p></td></tr><tr><td style='border-bottom:1pt solid rgb(162, 169, 177); border-image:initial; border-left:1pt solid rgb(162, 169, 177); border-right:1pt solid rgb(162, 169, 177); border-top-style:none; padding:2.4pt 4.8pt;'><p style='margin:12pt 0in; text-align:center;'><span style='color:rgb(32,33,34); font-family:Arial, sans-serif; font-size:10.5pt;'>SSP3-7.0</span></p></td><td style='border-bottom:1pt solid rgb(162, 169, 177); border-left-style:none; border-right:1pt solid rgb(162, 169, 177); border-top-style:none; padding:2.4pt 4.8pt;'><p style='margin:12pt 0in; text-align:center;'><span style='color:rgb(32,33,34); font-family:Arial, sans-serif; font-size:10.5pt;'>high GHG emissions:</span><br /><span style='color:rgb(32,33,34); font-family:Arial, sans-serif; font-size:10.5pt;'>CO</span><span style='color:rgb(32,33,34); font-family:Arial, sans-serif; font-size:8.5pt;'><sub>2</sub></span><span style='color:rgb(32,33,34); font-family:Arial, sans-serif; font-size:10.5pt;'>&nbsp;emissions double by 2100</span></p></td><td style='border-bottom:1pt solid rgb(162, 169, 177); border-left-style:none; border-right:1pt solid rgb(162, 169, 177); border-top-style:none; padding:2.4pt 4.8pt;'><p style='margin:12pt 0in; text-align:center;'><span style='color:rgb(32,33,34); font-family:Arial, sans-serif; font-size:10.5pt;'>2.1 °C</span></p></td><td style='border-bottom:1pt solid rgb(162, 169, 177); border-left-style:none; border-right:1pt solid rgb(162, 169, 177); border-top-style:none; padding:2.4pt 4.8pt;'><p style='margin:12pt 0in; text-align:center;'><span style='color:rgb(32,33,34); font-family:Arial, sans-serif; font-size:10.5pt;'>3.6 °C</span></p></td><td style='border-bottom:1pt solid rgb(162, 169, 177); border-left-style:none; border-right:1pt solid rgb(162, 169, 177); border-top-style:none; padding:2.4pt 4.8pt;'><p style='margin:12pt 0in; text-align:center;'><span style='color:rgb(32,33,34); font-family:Arial, sans-serif; font-size:10.5pt;'>2.8 – 4.6</span></p></td></tr><tr><td style='border-bottom:1pt solid rgb(162, 169, 177); border-image:initial; border-left:1pt solid rgb(162, 169, 177); border-right:1pt solid rgb(162, 169, 177); border-top-style:none; padding:2.4pt 4.8pt;'><p style='margin:12pt 0in; text-align:center;'><span style='color:rgb(32,33,34); font-family:Arial, sans-serif; font-size:10.5pt;'>SSP5-8.5</span></p></td><td style='border-bottom:1pt solid rgb(162, 169, 177); border-left-style:none; border-right:1pt solid rgb(162, 169, 177); border-top-style:none; padding:2.4pt 4.8pt;'><p style='margin:12pt 0in; text-align:center;'><span style='color:rgb(32,33,34); font-family:Arial, sans-serif; font-size:10.5pt;'>very high GHG emissions:</span><br /><span style='color:rgb(32,33,34); font-family:Arial, sans-serif; font-size:10.5pt;'>CO</span><span style='color:rgb(32,33,34); font-family:Arial, sans-serif; font-size:8.5pt;'><sub>2</sub></span><span style='color:rgb(32,33,34); font-family:Arial, sans-serif; font-size:10.5pt;'>&nbsp;emissions triple by 2075</span></p></td><td style='border-bottom:1pt solid rgb(162, 169, 177); border-left-style:none; border-right:1pt solid rgb(162, 169, 177); border-top-style:none; padding:2.4pt 4.8pt;'><p style='margin:12pt 0in; text-align:center;'><span style='color:rgb(32,33,34); font-family:Arial, sans-serif; font-size:10.5pt;'>2.4 °C</span></p></td><td style='border-bottom:1pt solid rgb(162, 169, 177); border-left-style:none; border-right:1pt solid rgb(162, 169, 177); border-top-style:none; padding:2.4pt 4.8pt;'><p style='margin:12pt 0in; text-align:center;'><span style='color:rgb(32,33,34); font-family:Arial, sans-serif; font-size:10.5pt;'>4.4 °C</span></p></td><td style='border-bottom:1pt solid rgb(162, 169, 177); border-left-style:none; border-right:1pt solid rgb(162, 169, 177); border-top-style:none; padding:2.4pt 4.8pt;'><p style='margin:12pt 0in; text-align:center;'><span style='color:rgb(32,33,34); font-family:Arial, sans-serif; font-size:10.5pt;'>3.3 – 5.7</span></p></td></tr></tbody></table></figure><p>While the 8.5 scenario is no longer generally considered likely, SSP3 7.0 has been included and is considered the high end of possibilities. SSP5 8.5 has been retained since many organizations report to this threshold. The warming associated with SSP2 4.5 is equivalent to the global targets set at the 2021 United Nations COP26 meetings in Glasgow.&nbsp;</p><p><strong>Processing the Climate Data</strong></p><p>WorldClim provides 20-year averaged outputs for the various SSPs from 24 global climate models. A selection of 13 models were averaged for each variable and time based on&nbsp;<a target='_blank' href='https://rmets.onlinelibrary.wiley.com/doi/full/10.1002/joc.7566' rel='nofollow ugc noopener noreferrer'>Mahony et al 2022</a>. These models included ACCESS-ESM1-5, BCC-CSM2-MR, CanESM5, CNRM-ESM2-1, EC-Earth3-Veg, GFDL-ESM4, GISS-E2-1-G, INM-CM5-0,&nbsp;&nbsp;IPSL-CM6A-LR, MIROC6, MPI-ESM1-2-HR, MRI-ESM2-0, UKESM1-0-LL. GFDL-ESM4 was not available for SSP2 4.5 or SSP5 8.5.&nbsp;</p><p><strong>Accessing the Multidimensional Information</strong></p><p>The time and SSP scenario are built into the layer using a multidimensional raster. Enable the time slider to move across the 20-year average periods. In ArcGIS Online and Pro, use the Multidimensional Filter to select the SSP (SSP2 4.5 is the default).&nbsp;<br /><br /><strong>What can you do with this layer?</strong></p><p>These multidimensional imagery tiles support analysis using ArcGIS Online or Pro. Use the&nbsp;<a target='_blank' href='https://arcgis.com/home/item.html?id=e56c9cb70aa949adb791c4311003d9ae' rel='nofollow ugc noopener noreferrer'>Bioclimate Baseline layer</a>&nbsp;to see the difference in pixels and calculate change from the historic period into the future. Use the&nbsp;<a target='_blank' href='https://pro.arcgis.com/en/pro-app/latest/help/data/imagery/an-overview-of-multidimensional-raster-data.htm' rel='nofollow ugc noopener noreferrer'>Multidimensional&nbsp;</a>tab in ArcGIS Pro to access a variety of useful tools. Each layer or variable can be styled using the Image Display options.&nbsp;</p><p><strong>Known Quality Issues</strong></p><p>Each model is downscaled from ~100km resolution to ~5km resolution by WorldClim. Some artifacts are inevitable, especially at a global scale. Some variables have distinct transitions, especially in Greenland. Also, SSP2 4.5 has missing data for several variables in Antarctica.<br />&nbsp;</p><p><strong>Related Layers</strong></p><p><a target='_blank' href='https://arcgis.com/home/item.html?id=fdaa1b7912e440efb9e29cf5d6156bb0' rel='nofollow ugc noopener noreferrer'>Bioclimate 1&nbsp;&nbsp;Annual Mean Temperature</a><br /><a target='_blank' href='https://arcgis.com/home/item.html?id=8012b34e8c854d6fbcfe4eab437ea397' rel='nofollow ugc noopener noreferrer'>Bioclimate 2&nbsp;&nbsp;Mean Diurnal Range</a><br /><a target='_blank' href='https://arcgis.com/home/item.html?id=ef9f5d6a16ca41ada0c0075a8da46d48' rel='nofollow ugc noopener noreferrer'>Bioclimate 3&nbsp;&nbsp;Isothermality</a><br /><a target='_blank' href='https://arcgis.com/home/item.html?id=64799fea8774463aad909020b6590dc8' rel='nofollow ugc noopener noreferrer'>Bioclimate 4&nbsp;&nbsp;Temperature Seasonality</a><br /><a target='_blank' href='https://arcgis.com/home/item.html?id=8433250e0a4148f5a3889c66e78abdf1' rel='nofollow ugc noopener noreferrer'>Bioclimate 5&nbsp;&nbsp;Max Temperature of Warmest Month</a><br /><a target='_blank' href='https://arcgis.com/home/item.html?id=c531d32ab5d746b88a884b6e54f3216e' rel='nofollow ugc noopener noreferrer'>Bioclimate 6&nbsp;&nbsp;Min Temperature Of Coldest Month</a><br /><a target='_blank' href='https://arcgis.com/home/item.html?id=808cfb3ab1614f8ab7e364de737e9e98' rel='nofollow ugc noopener noreferrer'>Bioclimate 7&nbsp;&nbsp;Temperature Annual Range</a><br /><a target='_blank' href='https://arcgis.com/home/item.html?id=b5990aa16fd94bb691a09449716ed7e5' rel='nofollow ugc noopener noreferrer'>Bioclimate 8&nbsp;&nbsp;Mean Temperature Of Wettest Quarter</a><br /><a target='_blank' href='https://arcgis.com/home/item.html?id=231770161a46467e8de9fdd9fd92dad7' rel='nofollow ugc noopener noreferrer'>Bioclimate 9&nbsp;&nbsp;Mean Temperature Of Driest Quarter</a><br /><a target='_blank' href='https://arcgis.com/home/item.html?id=3b98ddf1c78d4f0c88bd297f85847c68' rel='nofollow ugc noopener noreferrer'>Bioclimate 10&nbsp;&nbsp;Mean Temperature Of Warmest Quarter</a><br /><a target='_blank' href='https://arcgis.com/home/item.html?id=1a96d928c93c4e8fbc6a2391afd1da2f' rel='nofollow ugc noopener noreferrer'>Bioclimate 11&nbsp;&nbsp;Mean Temperature Of Coldest Quarter</a><br /><a target='_blank' href='https://arcgis.com/home/item.html?id=7bc0b8c75b0244b7a8128ae1f398bfc0' rel='nofollow ugc noopener noreferrer'>Bioclimate 12&nbsp;&nbsp;Annual Precipitation</a><br /><a target='_blank' href='https://arcgis.com/home/item.html?id=36fde801c8124f93b46b727b9873c993' rel='nofollow ugc noopener noreferrer'>Bioclimate 13&nbsp;&nbsp;Precipitation Of Wettest Month</a><br /><a target='_blank' href='https://arcgis.com/home/item.html?id=e26b01e4fa0a4aec9c5db991467b31a7' rel='nofollow ugc noopener noreferrer'>Bioclimate 14&nbsp;&nbsp;Precipitation Of Driest Month</a><br /><a target='_blank' href='https://arcgis.com/home/item.html?id=33558b5fef8642338f33918d498f41cf' rel='nofollow ugc noopener noreferrer'>Bioclimate 15&nbsp;&nbsp;Precipitation Seasonality</a><br /><a target='_blank' href='https://arcgis.com/home/item.html?id=1324c4e0c86a40e9b7529e91c6bdf220' rel='nofollow ugc noopener noreferrer'>Bioclimate 16&nbsp;&nbsp;Precipitation Of Wettest Quarter</a><br /><a target='_blank' href='https://arcgis.com/home/item.html?id=86fe2a87fe9144f9a5c330a3b5890df0' rel='nofollow ugc noopener noreferrer'>Bioclimate 17&nbsp;&nbsp;Precipitation Of Driest Quarter</a><br /><a target='_blank' href='https://arcgis.com/home/item.html?id=eb8227050ac24b3bb4a47abb924fbc56' rel='nofollow ugc noopener noreferrer'>Bioclimate 18&nbsp;&nbsp;Precipitation Of Warmest Quarter</a><br /><a target='_blank' href='https://arcgis.com/home/item.html?id=ec067623611d40d086193b21a3a4fce1' rel='nofollow ugc noopener noreferrer'>Bioclimate 19&nbsp;&nbsp;Precipitation Of Coldest Quarter</a><br /><a target='_blank' href='https://arcgis.com/home/item.html?id=e56c9cb70aa949adb791c4311003d9ae' rel='nofollow ugc noopener noreferrer'>Bioclimate Baseline 1970-2000</a></p></div>",
			"keyword": [
				"esri_environment",
				"retiring-2026-12"
			],
			"issued": "2022-05-12T15:45:18.000Z",
			"modified": "2026-05-13T19:41:52.000Z",
			"publisher": {
				"name": "Esri"
			},
			"contactPoint": {
				"@type": "vcard:Contact",
				"fn": "esri_environment",
				"hasEmail": "{{orgContactEmail}}"
			},
			"accessLevel": "public",
			"spatial": "-180.0000,-90.0000,180.0000,90.0000",
			"license": "<p><img src='https://downloads.esri.com/blogs/arcgisonline/esrilogo_new.png' width='113' height='43' /> This work is licensed under the Esri Master License Agreement.&nbsp;</p><p><a target='_blank' href='https://goto.arcgis.com/termsofuse/viewsummary' rel='nofollow ugc noopener noreferrer'>View Summary</a> | <a target='_blank' href='https://goto.arcgis.com/termsofuse/viewtermsofuse' rel='nofollow ugc noopener noreferrer'>View Terms of Use</a></p>",
			"distribution": [
				{
					"@type": "dcat:Distribution",
					"title": "ArcGIS Hub Dataset",
					"format": "Web Page",
					"mediaType": "text/html",
					"accessURL": "https://www.pacificgeoportal.com/content/esri::bioclimate-projections-12-annual-precipitation"
				},
				{
					"@type": "dcat:Distribution",
					"title": "ArcGIS GeoService",
					"format": "ArcGIS GeoServices REST API",
					"mediaType": "application/json",
					"accessURL": "https://tiledimageservices.arcgis.com/P3ePLMYs2RVChkJx/arcgis/rest/services/Bioclimate_Projections__Annual_Precipitation/ImageServer"
				}
			],
			"theme": [
				"geospatial"
			]
		},
		{
			"@type": "dcat:Dataset",
			"identifier": "https://www.arcgis.com/home/item.html?id=1a96d928c93c4e8fbc6a2391afd1da2f",
			"landingPage": "https://www.pacificgeoportal.com/content/esri::bioclimate-projections-11-mean-temperature-of-coldest-quarter",
			"title": "Bioclimate Projections: (11) Mean Temperature of Coldest Quarter",
			"description": "<p><span style='color:#dc143c;'><strong>Retirement Notice:</strong></span><strong>&nbsp;This </strong><a target='_blank' href='https://goto.arcgis.com/termsofuse/beta' rel='nofollow ugc noopener noreferrer'><strong>beta</strong></a><strong> item will be retired in December 2026. A</strong><a target='_blank' href='https://www.arcgis.com/home/item.html?id=46c7dc89c9314d36bdb1491bc1a8e092' rel='nofollow ugc noopener noreferrer'><strong> new version of this item</strong></a><strong>&nbsp;is available for your use.</strong> Esri recommends updating your maps and apps to use the new version.</p><div><p><span style='background-attachment:initial; background-clip:initial; background-image:initial; background-origin:initial; background-position:initial; background-repeat:initial; background-size:initial;'>This layer represents CMIP6 future projections of mean temperature during the three coldest months of the year. This layer can be used to compare with recent climate histories to better understand the potential impacts of future climate change.</span></p><p><a target='_blank' href='https://worldclim.org/' rel='nofollow ugc noopener noreferrer'><span style='background-attachment:initial; background-clip:initial; background-image:initial; background-origin:initial; background-position:initial; background-repeat:initial; background-size:initial;'>WorldClim</span></a><span style='background-attachment:initial; background-clip:initial; background-image:initial; background-origin:initial; background-position:initial; background-repeat:initial; background-size:initial;'>&nbsp;produced this projection as part of a series of&nbsp;</span><a target='_blank' href='https://pubs.usgs.gov/ds/691/ds691.pdf' rel='nofollow ugc noopener noreferrer'><span style='background-attachment:initial; background-clip:initial; background-image:initial; background-origin:initial; background-position:initial; background-repeat:initial; background-size:initial;'>19 bioclimate variables identified by the USGS</span></a><span style='background-attachment:initial; background-clip:initial; background-image:initial; background-origin:initial; background-position:initial; background-repeat:initial; background-size:initial;'>&nbsp;and provides this description:</span><br /><br /><i>\"Bioclimatic variables are derived from the monthly temperature and rainfall values in order to generate more biologically meaningful variables. These are often used in species distribution modeling and related ecological modeling techniques. The bioclimatic variables represent annual trends (e.g., mean annual temperature, annual precipitation) seasonality (e.g., annual range in temperature and precipitation) and extreme or limiting environmental factors (e.g., temperature of the coldest and warmest month, and precipitation of the wet and dry quarters). A quarter is a period of three months (1/4 of the year).\"</i></p><p style='background-attachment:initial; background-clip:initial; background-image:initial; background-origin:initial; background-position:initial; background-repeat:initial; background-size:initial; margin-bottom:0in;'><strong>Time Extent:</strong>&nbsp;averages from 2021-2040, 2041-2060, 2061-2080, 2081-2100<br /><strong>Units:</strong>&nbsp;deg C<br /><strong>Cell Size:</strong> 2.5 minutes (~5 km)<br /><strong>Source Type:</strong> Stretched<br /><strong>Pixel Type:</strong> 32 Bit Float<br /><strong>Data Projection:</strong> GCS WGS84<br /><strong>Mosaic Projection:</strong> GCS WGS84<br /><strong>Extent:</strong> Global<br /><strong>Source:</strong> <a target='_blank' href='https://worldclim.org/data/cmip6/cmip6_clim2.5m.html' rel='nofollow ugc noopener noreferrer'>WorldClim CMIP6 Bioclimate</a></p><p>&nbsp;</p><p><strong>Climate Scenarios</strong></p><p>The CMIP6 climate experiments use&nbsp;<a target='_blank' href='https://www.carbonbrief.org/explainer-how-shared-socioeconomic-pathways-explore-future-climate-change/' rel='nofollow ugc noopener noreferrer'>Shared Socioeconomic Pathways (SSPs)</a>&nbsp;to model future climate scenarios. Each SSP pairs a human/community behavior component with the traditional RCP greenhouse gas forcing from the previous CMIP5. Three SSPs were chosen by Esri to be included in the service based on user requests: SSP2 4.5, SSP3 7.0 and SSP5 8.5.</p><figure><table style='background-color:rgb(248, 249, 250); border-collapse:collapse;' width='850' cellpadding='0' cellspacing='0' border='1'><tbody><tr><td style='background-color:rgb(234, 236, 240); border:1pt solid rgb(162, 169, 177); padding:2.4pt 4.8pt;'><p style='margin:12pt 0in; text-align:center;'><span style='color:rgb(32,33,34); font-family:Arial, sans-serif; font-size:10.5pt;'><strong>SSP</strong></span></p></td><td style='background-color:rgb(234, 236, 240); border-bottom:1pt solid rgb(162, 169, 177); border-image:initial; border-left-style:none; border-right:1pt solid rgb(162, 169, 177); border-top:1pt solid rgb(162, 169, 177); padding:2.4pt 4.8pt;'><p style='margin:12pt 0in; text-align:center;'><span style='color:rgb(32,33,34); font-family:Arial, sans-serif; font-size:10.5pt;'><strong>Scenario</strong></span></p></td><td style='background-color:rgb(234, 236, 240); border-bottom:1pt solid rgb(162, 169, 177); border-image:initial; border-left-style:none; border-right:1pt solid rgb(162, 169, 177); border-top:1pt solid rgb(162, 169, 177); padding:2.4pt 4.8pt;'><p style='margin:12pt 0in; text-align:center;'><span style='color:rgb(32,33,34); font-family:Arial, sans-serif; font-size:10.5pt;'><strong>Estimated warming</strong></span><br /><span style='color:rgb(32,33,34); font-family:Arial, sans-serif; font-size:10.5pt;'><strong>(2041–2060)</strong></span></p></td><td style='background-color:rgb(234, 236, 240); border-bottom:1pt solid rgb(162, 169, 177); border-image:initial; border-left-style:none; border-right:1pt solid rgb(162, 169, 177); border-top:1pt solid rgb(162, 169, 177); padding:2.4pt 4.8pt;'><p style='margin:12pt 0in; text-align:center;'><span style='color:rgb(32,33,34); font-family:Arial, sans-serif; font-size:10.5pt;'><strong>Estimated warming</strong></span><br /><span style='color:rgb(32,33,34); font-family:Arial, sans-serif; font-size:10.5pt;'><strong>(2081–2100)</strong></span></p></td><td style='background-color:rgb(234, 236, 240); border-bottom:1pt solid rgb(162, 169, 177); border-image:initial; border-left-style:none; border-right:1pt solid rgb(162, 169, 177); border-top:1pt solid rgb(162, 169, 177); padding:2.4pt 4.8pt;'><p style='margin:12pt 0in; text-align:center;'><span style='color:rgb(32,33,34); font-family:Arial, sans-serif; font-size:10.5pt;'><strong>Very likely range in °C</strong></span><br /><span style='color:rgb(32,33,34); font-family:Arial, sans-serif; font-size:10.5pt;'><strong>(2081–2100)</strong></span></p></td></tr><tr><td style='border-bottom:1pt solid rgb(162, 169, 177); border-image:initial; border-left:1pt solid rgb(162, 169, 177); border-right:1pt solid rgb(162, 169, 177); border-top-style:none; padding:2.4pt 4.8pt;'><p style='margin:12pt 0in; text-align:center;'><span style='color:rgb(32,33,34); font-family:Arial, sans-serif; font-size:10.5pt;'>SSP2-4.5</span></p></td><td style='border-bottom:1pt solid rgb(162, 169, 177); border-left-style:none; border-right:1pt solid rgb(162, 169, 177); border-top-style:none; padding:2.4pt 4.8pt;'><p style='margin:12pt 0in; text-align:center;'><span style='color:rgb(32,33,34); font-family:Arial, sans-serif; font-size:10.5pt;'>intermediate GHG emissions:</span><br /><span style='color:rgb(32,33,34); font-family:Arial, sans-serif; font-size:10.5pt;'>CO</span><span style='color:rgb(32,33,34); font-family:Arial, sans-serif; font-size:8.5pt;'><sub>2</sub></span><span style='color:rgb(32,33,34); font-family:Arial, sans-serif; font-size:10.5pt;'>&nbsp;emissions around current levels until 2050, then falling but not reaching net zero by 2100</span></p></td><td style='border-bottom:1pt solid rgb(162, 169, 177); border-left-style:none; border-right:1pt solid rgb(162, 169, 177); border-top-style:none; padding:2.4pt 4.8pt;'><p style='margin:12pt 0in; text-align:center;'><span style='color:rgb(32,33,34); font-family:Arial, sans-serif; font-size:10.5pt;'>2.0 °C</span></p></td><td style='border-bottom:1pt solid rgb(162, 169, 177); border-left-style:none; border-right:1pt solid rgb(162, 169, 177); border-top-style:none; padding:2.4pt 4.8pt;'><p style='margin:12pt 0in; text-align:center;'><span style='color:rgb(32,33,34); font-family:Arial, sans-serif; font-size:10.5pt;'>2.7 °C</span></p></td><td style='border-bottom:1pt solid rgb(162, 169, 177); border-left-style:none; border-right:1pt solid rgb(162, 169, 177); border-top-style:none; padding:2.4pt 4.8pt;'><p style='margin:12pt 0in; text-align:center;'><span style='color:rgb(32,33,34); font-family:Arial, sans-serif; font-size:10.5pt;'>2.1 – 3.5</span></p></td></tr><tr><td style='border-bottom:1pt solid rgb(162, 169, 177); border-image:initial; border-left:1pt solid rgb(162, 169, 177); border-right:1pt solid rgb(162, 169, 177); border-top-style:none; padding:2.4pt 4.8pt;'><p style='margin:12pt 0in; text-align:center;'><span style='color:rgb(32,33,34); font-family:Arial, sans-serif; font-size:10.5pt;'>SSP3-7.0</span></p></td><td style='border-bottom:1pt solid rgb(162, 169, 177); border-left-style:none; border-right:1pt solid rgb(162, 169, 177); border-top-style:none; padding:2.4pt 4.8pt;'><p style='margin:12pt 0in; text-align:center;'><span style='color:rgb(32,33,34); font-family:Arial, sans-serif; font-size:10.5pt;'>high GHG emissions:</span><br /><span style='color:rgb(32,33,34); font-family:Arial, sans-serif; font-size:10.5pt;'>CO</span><span style='color:rgb(32,33,34); font-family:Arial, sans-serif; font-size:8.5pt;'><sub>2</sub></span><span style='color:rgb(32,33,34); font-family:Arial, sans-serif; font-size:10.5pt;'>&nbsp;emissions double by 2100</span></p></td><td style='border-bottom:1pt solid rgb(162, 169, 177); border-left-style:none; border-right:1pt solid rgb(162, 169, 177); border-top-style:none; padding:2.4pt 4.8pt;'><p style='margin:12pt 0in; text-align:center;'><span style='color:rgb(32,33,34); font-family:Arial, sans-serif; font-size:10.5pt;'>2.1 °C</span></p></td><td style='border-bottom:1pt solid rgb(162, 169, 177); border-left-style:none; border-right:1pt solid rgb(162, 169, 177); border-top-style:none; padding:2.4pt 4.8pt;'><p style='margin:12pt 0in; text-align:center;'><span style='color:rgb(32,33,34); font-family:Arial, sans-serif; font-size:10.5pt;'>3.6 °C</span></p></td><td style='border-bottom:1pt solid rgb(162, 169, 177); border-left-style:none; border-right:1pt solid rgb(162, 169, 177); border-top-style:none; padding:2.4pt 4.8pt;'><p style='margin:12pt 0in; text-align:center;'><span style='color:rgb(32,33,34); font-family:Arial, sans-serif; font-size:10.5pt;'>2.8 – 4.6</span></p></td></tr><tr><td style='border-bottom:1pt solid rgb(162, 169, 177); border-image:initial; border-left:1pt solid rgb(162, 169, 177); border-right:1pt solid rgb(162, 169, 177); border-top-style:none; padding:2.4pt 4.8pt;'><p style='margin:12pt 0in; text-align:center;'><span style='color:rgb(32,33,34); font-family:Arial, sans-serif; font-size:10.5pt;'>SSP5-8.5</span></p></td><td style='border-bottom:1pt solid rgb(162, 169, 177); border-left-style:none; border-right:1pt solid rgb(162, 169, 177); border-top-style:none; padding:2.4pt 4.8pt;'><p style='margin:12pt 0in; text-align:center;'><span style='color:rgb(32,33,34); font-family:Arial, sans-serif; font-size:10.5pt;'>very high GHG emissions:</span><br /><span style='color:rgb(32,33,34); font-family:Arial, sans-serif; font-size:10.5pt;'>CO</span><span style='color:rgb(32,33,34); font-family:Arial, sans-serif; font-size:8.5pt;'><sub>2</sub></span><span style='color:rgb(32,33,34); font-family:Arial, sans-serif; font-size:10.5pt;'>&nbsp;emissions triple by 2075</span></p></td><td style='border-bottom:1pt solid rgb(162, 169, 177); border-left-style:none; border-right:1pt solid rgb(162, 169, 177); border-top-style:none; padding:2.4pt 4.8pt;'><p style='margin:12pt 0in; text-align:center;'><span style='color:rgb(32,33,34); font-family:Arial, sans-serif; font-size:10.5pt;'>2.4 °C</span></p></td><td style='border-bottom:1pt solid rgb(162, 169, 177); border-left-style:none; border-right:1pt solid rgb(162, 169, 177); border-top-style:none; padding:2.4pt 4.8pt;'><p style='margin:12pt 0in; text-align:center;'><span style='color:rgb(32,33,34); font-family:Arial, sans-serif; font-size:10.5pt;'>4.4 °C</span></p></td><td style='border-bottom:1pt solid rgb(162, 169, 177); border-left-style:none; border-right:1pt solid rgb(162, 169, 177); border-top-style:none; padding:2.4pt 4.8pt;'><p style='margin:12pt 0in; text-align:center;'><span style='color:rgb(32,33,34); font-family:Arial, sans-serif; font-size:10.5pt;'>3.3 – 5.7</span></p></td></tr></tbody></table></figure><p>While the 8.5 scenario is no longer generally considered likely, SSP3 7.0 has been included and is considered the high end of possibilities. SSP5 8.5 has been retained since many organizations report to this threshold. The warming associated with SSP2 4.5 is equivalent to the global targets set at the 2021 United Nations COP26 meetings in Glasgow.&nbsp;</p><p><strong>Processing the Climate Data</strong></p><p>WorldClim provides 20-year averaged outputs for the various SSPs from 24 global climate models. A selection of 13 models were averaged for each variable and time based on&nbsp;<a target='_blank' href='https://rmets.onlinelibrary.wiley.com/doi/full/10.1002/joc.7566' rel='nofollow ugc noopener noreferrer'>Mahony et al 2022</a>. These models included ACCESS-ESM1-5, BCC-CSM2-MR, CanESM5, CNRM-ESM2-1, EC-Earth3-Veg, GFDL-ESM4, GISS-E2-1-G, INM-CM5-0,&nbsp;&nbsp;IPSL-CM6A-LR, MIROC6, MPI-ESM1-2-HR, MRI-ESM2-0, UKESM1-0-LL. GFDL-ESM4 was not available for SSP2 4.5 or SSP5 8.5.&nbsp;</p><p><strong>Accessing the Multidimensional Information</strong></p><p>The time and SSP scenario are built into the layer using a multidimensional raster. Enable the time slider to move across the 20-year average periods. In ArcGIS Online and Pro, use the Multidimensional Filter to select the SSP (SSP2 4.5 is the default).&nbsp;<br /><br /><strong>What can you do with this layer?</strong></p><p>These multidimensional imagery tiles support analysis using ArcGIS Online or Pro. Use the&nbsp;<a target='_blank' href='https://arcgis.com/home/item.html?id=e56c9cb70aa949adb791c4311003d9ae' rel='nofollow ugc noopener noreferrer'>Bioclimate Baseline layer</a>&nbsp;to see the difference in pixels and calculate change from the historic period into the future. Use the&nbsp;<a target='_blank' href='https://pro.arcgis.com/en/pro-app/latest/help/data/imagery/an-overview-of-multidimensional-raster-data.htm' rel='nofollow ugc noopener noreferrer'>Multidimensional&nbsp;</a>tab in ArcGIS Pro to access a variety of useful tools. Each layer or variable can be styled using the Image Display options.&nbsp;</p><p><strong>Known Quality Issues</strong></p><p>Each model is downscaled from ~100km resolution to ~5km resolution by WorldClim. Some artifacts are inevitable, especially at a global scale. Some variables have distinct transitions, especially in Greenland. Also, SSP2 4.5 has missing data for several variables in Antarctica.</p><p><strong>Related Layers</strong></p><p><a target='_blank' href='https://arcgis.com/home/item.html?id=fdaa1b7912e440efb9e29cf5d6156bb0' rel='nofollow ugc noopener noreferrer'>Bioclimate 1&nbsp;&nbsp;Annual Mean Temperature</a><br /><a target='_blank' href='https://arcgis.com/home/item.html?id=8012b34e8c854d6fbcfe4eab437ea397' rel='nofollow ugc noopener noreferrer'>Bioclimate 2&nbsp;&nbsp;Mean Diurnal Range</a><br /><a target='_blank' href='https://arcgis.com/home/item.html?id=ef9f5d6a16ca41ada0c0075a8da46d48' rel='nofollow ugc noopener noreferrer'>Bioclimate 3&nbsp;&nbsp;Isothermality</a><br /><a target='_blank' href='https://arcgis.com/home/item.html?id=64799fea8774463aad909020b6590dc8' rel='nofollow ugc noopener noreferrer'>Bioclimate 4&nbsp;&nbsp;Temperature Seasonality</a><br /><a target='_blank' href='https://arcgis.com/home/item.html?id=8433250e0a4148f5a3889c66e78abdf1' rel='nofollow ugc noopener noreferrer'>Bioclimate 5&nbsp;&nbsp;Max Temperature of Warmest Month</a><br /><a target='_blank' href='https://arcgis.com/home/item.html?id=c531d32ab5d746b88a884b6e54f3216e' rel='nofollow ugc noopener noreferrer'>Bioclimate 6&nbsp;&nbsp;Min Temperature Of Coldest Month</a><br /><a target='_blank' href='https://arcgis.com/home/item.html?id=808cfb3ab1614f8ab7e364de737e9e98' rel='nofollow ugc noopener noreferrer'>Bioclimate 7&nbsp;&nbsp;Temperature Annual Range</a><br /><a target='_blank' href='https://arcgis.com/home/item.html?id=b5990aa16fd94bb691a09449716ed7e5' rel='nofollow ugc noopener noreferrer'>Bioclimate 8&nbsp;&nbsp;Mean Temperature Of Wettest Quarter</a><br /><a target='_blank' href='https://arcgis.com/home/item.html?id=231770161a46467e8de9fdd9fd92dad7' rel='nofollow ugc noopener noreferrer'>Bioclimate 9&nbsp;&nbsp;Mean Temperature Of Driest Quarter</a><br /><a target='_blank' href='https://arcgis.com/home/item.html?id=3b98ddf1c78d4f0c88bd297f85847c68' rel='nofollow ugc noopener noreferrer'>Bioclimate 10&nbsp;&nbsp;Mean Temperature Of Warmest Quarter</a><br /><a target='_blank' href='https://arcgis.com/home/item.html?id=1a96d928c93c4e8fbc6a2391afd1da2f' rel='nofollow ugc noopener noreferrer'>Bioclimate 11&nbsp;&nbsp;Mean Temperature Of Coldest Quarter</a><br /><a target='_blank' href='https://arcgis.com/home/item.html?id=7bc0b8c75b0244b7a8128ae1f398bfc0' rel='nofollow ugc noopener noreferrer'>Bioclimate 12&nbsp;&nbsp;Annual Precipitation</a><br /><a target='_blank' href='https://arcgis.com/home/item.html?id=36fde801c8124f93b46b727b9873c993' rel='nofollow ugc noopener noreferrer'>Bioclimate 13&nbsp;&nbsp;Precipitation Of Wettest Month</a><br /><a target='_blank' href='https://arcgis.com/home/item.html?id=e26b01e4fa0a4aec9c5db991467b31a7' rel='nofollow ugc noopener noreferrer'>Bioclimate 14&nbsp;&nbsp;Precipitation Of Driest Month</a><br /><a target='_blank' href='https://arcgis.com/home/item.html?id=33558b5fef8642338f33918d498f41cf' rel='nofollow ugc noopener noreferrer'>Bioclimate 15&nbsp;&nbsp;Precipitation Seasonality</a><br /><a target='_blank' href='https://arcgis.com/home/item.html?id=1324c4e0c86a40e9b7529e91c6bdf220' rel='nofollow ugc noopener noreferrer'>Bioclimate 16&nbsp;&nbsp;Precipitation Of Wettest Quarter</a><br /><a target='_blank' href='https://arcgis.com/home/item.html?id=86fe2a87fe9144f9a5c330a3b5890df0' rel='nofollow ugc noopener noreferrer'>Bioclimate 17&nbsp;&nbsp;Precipitation Of Driest Quarter</a><br /><a target='_blank' href='https://arcgis.com/home/item.html?id=eb8227050ac24b3bb4a47abb924fbc56' rel='nofollow ugc noopener noreferrer'>Bioclimate 18&nbsp;&nbsp;Precipitation Of Warmest Quarter</a><br /><a target='_blank' href='https://arcgis.com/home/item.html?id=ec067623611d40d086193b21a3a4fce1' rel='nofollow ugc noopener noreferrer'>Bioclimate 19&nbsp;&nbsp;Precipitation Of Coldest Quarter</a><br /><a target='_blank' href='https://arcgis.com/home/item.html?id=e56c9cb70aa949adb791c4311003d9ae' rel='nofollow ugc noopener noreferrer'>Bioclimate Baseline 1970-2000</a></p></div>",
			"keyword": [
				"esri_environment",
				"retiring-2026-12"
			],
			"issued": "2022-05-12T15:49:10.000Z",
			"modified": "2026-05-13T19:41:38.000Z",
			"publisher": {
				"name": "Esri"
			},
			"contactPoint": {
				"@type": "vcard:Contact",
				"fn": "esri_environment",
				"hasEmail": "{{orgContactEmail}}"
			},
			"accessLevel": "public",
			"spatial": "-180.0000,-90.0000,180.0000,90.0000",
			"license": "<p><img src='https://downloads.esri.com/blogs/arcgisonline/esrilogo_new.png' width='113' height='43' /> This work is licensed under the Esri Master License Agreement.&nbsp;</p><p><a target='_blank' href='https://goto.arcgis.com/termsofuse/viewsummary' rel='nofollow ugc noopener noreferrer'>View Summary</a> | <a target='_blank' href='https://goto.arcgis.com/termsofuse/viewtermsofuse' rel='nofollow ugc noopener noreferrer'>View Terms of Use</a></p>",
			"distribution": [
				{
					"@type": "dcat:Distribution",
					"title": "ArcGIS Hub Dataset",
					"format": "Web Page",
					"mediaType": "text/html",
					"accessURL": "https://www.pacificgeoportal.com/content/esri::bioclimate-projections-11-mean-temperature-of-coldest-quarter"
				},
				{
					"@type": "dcat:Distribution",
					"title": "ArcGIS GeoService",
					"format": "ArcGIS GeoServices REST API",
					"mediaType": "application/json",
					"accessURL": "https://tiledimageservices.arcgis.com/P3ePLMYs2RVChkJx/arcgis/rest/services/Bioclimate_Projections__Mean_Temperature_of_Coldest_Quarter/ImageServer"
				}
			],
			"theme": [
				"geospatial"
			]
		},
		{
			"@type": "dcat:Dataset",
			"identifier": "https://www.arcgis.com/home/item.html?id=231770161a46467e8de9fdd9fd92dad7",
			"landingPage": "https://www.pacificgeoportal.com/content/esri::bioclimate-projections-09-mean-temperature-of-driest-quarter",
			"title": "Bioclimate Projections: (09) Mean Temperature of Driest Quarter",
			"description": "<p><span style='color:#dc143c;'><strong>Retirement Notice:</strong></span><strong>&nbsp;This </strong><a target='_blank' href='https://goto.arcgis.com/termsofuse/beta' rel='nofollow ugc noopener noreferrer'><strong>beta</strong></a><strong> item will be retired in December 2026. A</strong><a target='_blank' href='https://www.arcgis.com/home/item.html?id=a6fa293c9be74f4d801f46a28ad2fa19' rel='nofollow ugc noopener noreferrer'><strong> new version of this item</strong></a><strong>&nbsp;is available for your use.</strong> Esri recommends updating your maps and apps to use the new version.</p><div><p><span style='background-attachment:initial; background-clip:initial; background-image:initial; background-origin:initial; background-position:initial; background-repeat:initial; background-size:initial;'>This layer represents CMIP6 future projections of mean temperature during the three driest months of the year. This layer can be used to compare with recent climate histories to better understand the potential impacts of future climate change.</span></p><p><a target='_blank' href='https://worldclim.org/' rel='nofollow ugc noopener noreferrer'><span style='background-attachment:initial; background-clip:initial; background-image:initial; background-origin:initial; background-position:initial; background-repeat:initial; background-size:initial;'>WorldClim</span></a><span style='background-attachment:initial; background-clip:initial; background-image:initial; background-origin:initial; background-position:initial; background-repeat:initial; background-size:initial;'>&nbsp;produced this projection as part of a series of&nbsp;</span><a target='_blank' href='https://pubs.usgs.gov/ds/691/ds691.pdf' rel='nofollow ugc noopener noreferrer'><span style='background-attachment:initial; background-clip:initial; background-image:initial; background-origin:initial; background-position:initial; background-repeat:initial; background-size:initial;'>19 bioclimate variables identified by the USGS</span></a><span style='background-attachment:initial; background-clip:initial; background-image:initial; background-origin:initial; background-position:initial; background-repeat:initial; background-size:initial;'>&nbsp;and provides this description:</span><br /><br /><i>\"Bioclimatic variables are derived from the monthly temperature and rainfall values in order to generate more biologically meaningful variables. These are often used in species distribution modeling and related ecological modeling techniques. The bioclimatic variables represent annual trends (e.g., mean annual temperature, annual precipitation) seasonality (e.g., annual range in temperature and precipitation) and extreme or limiting environmental factors (e.g., temperature of the coldest and warmest month, and precipitation of the wet and dry quarters). A quarter is a period of three months (1/4 of the year).\"</i></p><p style='background-attachment:initial; background-clip:initial; background-image:initial; background-origin:initial; background-position:initial; background-repeat:initial; background-size:initial; margin-bottom:0in;'><strong>Time Extent:</strong>&nbsp;averages from 2021-2040, 2041-2060, 2061-2080, 2081-2100<br /><strong>Units:</strong>&nbsp;deg C<br /><strong>Cell Size:</strong> 2.5 minutes (~5 km)<br /><strong>Source Type:</strong> Stretched<br /><strong>Pixel Type:</strong> 32 Bit Float<br /><strong>Data Projection:</strong> GCS WGS84<br /><strong>Mosaic Projection:</strong> GCS WGS84<br /><strong>Extent:</strong> Global<br /><strong>Source:</strong> <a target='_blank' href='https://worldclim.org/data/cmip6/cmip6_clim2.5m.html' rel='nofollow ugc noopener noreferrer'>WorldClim CMIP6 Bioclimate</a></p><p>&nbsp;</p><p><strong>Climate Scenarios</strong></p><p>The CMIP6 climate experiments use&nbsp;<a target='_blank' href='https://www.carbonbrief.org/explainer-how-shared-socioeconomic-pathways-explore-future-climate-change/' rel='nofollow ugc noopener noreferrer'>Shared Socioeconomic Pathways (SSPs)</a>&nbsp;to model future climate scenarios. Each SSP pairs a human/community behavior component with the traditional RCP greenhouse gas forcing from the previous CMIP5. Three SSPs were chosen by Esri to be included in the service based on user requests: SSP2 4.5, SSP3 7.0 and SSP5 8.5.</p><figure><table style='background-color:rgb(248, 249, 250); border-collapse:collapse;' width='850' cellpadding='0' cellspacing='0' border='1'><tbody><tr><td style='background-color:rgb(234, 236, 240); border:1pt solid rgb(162, 169, 177); padding:2.4pt 4.8pt;'><p style='margin:12pt 0in; text-align:center;'><span style='color:rgb(32,33,34); font-family:Arial, sans-serif; font-size:10.5pt;'><strong>SSP</strong></span></p></td><td style='background-color:rgb(234, 236, 240); border-bottom:1pt solid rgb(162, 169, 177); border-image:initial; border-left-style:none; border-right:1pt solid rgb(162, 169, 177); border-top:1pt solid rgb(162, 169, 177); padding:2.4pt 4.8pt;'><p style='margin:12pt 0in; text-align:center;'><span style='color:rgb(32,33,34); font-family:Arial, sans-serif; font-size:10.5pt;'><strong>Scenario</strong></span></p></td><td style='background-color:rgb(234, 236, 240); border-bottom:1pt solid rgb(162, 169, 177); border-image:initial; border-left-style:none; border-right:1pt solid rgb(162, 169, 177); border-top:1pt solid rgb(162, 169, 177); padding:2.4pt 4.8pt;'><p style='margin:12pt 0in; text-align:center;'><span style='color:rgb(32,33,34); font-family:Arial, sans-serif; font-size:10.5pt;'><strong>Estimated warming</strong></span><br /><span style='color:rgb(32,33,34); font-family:Arial, sans-serif; font-size:10.5pt;'><strong>(2041–2060)</strong></span></p></td><td style='background-color:rgb(234, 236, 240); border-bottom:1pt solid rgb(162, 169, 177); border-image:initial; border-left-style:none; border-right:1pt solid rgb(162, 169, 177); border-top:1pt solid rgb(162, 169, 177); padding:2.4pt 4.8pt;'><p style='margin:12pt 0in; text-align:center;'><span style='color:rgb(32,33,34); font-family:Arial, sans-serif; font-size:10.5pt;'><strong>Estimated warming</strong></span><br /><span style='color:rgb(32,33,34); font-family:Arial, sans-serif; font-size:10.5pt;'><strong>(2081–2100)</strong></span></p></td><td style='background-color:rgb(234, 236, 240); border-bottom:1pt solid rgb(162, 169, 177); border-image:initial; border-left-style:none; border-right:1pt solid rgb(162, 169, 177); border-top:1pt solid rgb(162, 169, 177); padding:2.4pt 4.8pt;'><p style='margin:12pt 0in; text-align:center;'><span style='color:rgb(32,33,34); font-family:Arial, sans-serif; font-size:10.5pt;'><strong>Very likely range in °C</strong></span><br /><span style='color:rgb(32,33,34); font-family:Arial, sans-serif; font-size:10.5pt;'><strong>(2081–2100)</strong></span></p></td></tr><tr><td style='border-bottom:1pt solid rgb(162, 169, 177); border-image:initial; border-left:1pt solid rgb(162, 169, 177); border-right:1pt solid rgb(162, 169, 177); border-top-style:none; padding:2.4pt 4.8pt;'><p style='margin:12pt 0in; text-align:center;'><span style='color:rgb(32,33,34); font-family:Arial, sans-serif; font-size:10.5pt;'>SSP2-4.5</span></p></td><td style='border-bottom:1pt solid rgb(162, 169, 177); border-left-style:none; border-right:1pt solid rgb(162, 169, 177); border-top-style:none; padding:2.4pt 4.8pt;'><p style='margin:12pt 0in; text-align:center;'><span style='color:rgb(32,33,34); font-family:Arial, sans-serif; font-size:10.5pt;'>intermediate GHG emissions:</span><br /><span style='color:rgb(32,33,34); font-family:Arial, sans-serif; font-size:10.5pt;'>CO</span><span style='color:rgb(32,33,34); font-family:Arial, sans-serif; font-size:8.5pt;'><sub>2</sub></span><span style='color:rgb(32,33,34); font-family:Arial, sans-serif; font-size:10.5pt;'>&nbsp;emissions around current levels until 2050, then falling but not reaching net zero by 2100</span></p></td><td style='border-bottom:1pt solid rgb(162, 169, 177); border-left-style:none; border-right:1pt solid rgb(162, 169, 177); border-top-style:none; padding:2.4pt 4.8pt;'><p style='margin:12pt 0in; text-align:center;'><span style='color:rgb(32,33,34); font-family:Arial, sans-serif; font-size:10.5pt;'>2.0 °C</span></p></td><td style='border-bottom:1pt solid rgb(162, 169, 177); border-left-style:none; border-right:1pt solid rgb(162, 169, 177); border-top-style:none; padding:2.4pt 4.8pt;'><p style='margin:12pt 0in; text-align:center;'><span style='color:rgb(32,33,34); font-family:Arial, sans-serif; font-size:10.5pt;'>2.7 °C</span></p></td><td style='border-bottom:1pt solid rgb(162, 169, 177); border-left-style:none; border-right:1pt solid rgb(162, 169, 177); border-top-style:none; padding:2.4pt 4.8pt;'><p style='margin:12pt 0in; text-align:center;'><span style='color:rgb(32,33,34); font-family:Arial, sans-serif; font-size:10.5pt;'>2.1 – 3.5</span></p></td></tr><tr><td style='border-bottom:1pt solid rgb(162, 169, 177); border-image:initial; border-left:1pt solid rgb(162, 169, 177); border-right:1pt solid rgb(162, 169, 177); border-top-style:none; padding:2.4pt 4.8pt;'><p style='margin:12pt 0in; text-align:center;'><span style='color:rgb(32,33,34); font-family:Arial, sans-serif; font-size:10.5pt;'>SSP3-7.0</span></p></td><td style='border-bottom:1pt solid rgb(162, 169, 177); border-left-style:none; border-right:1pt solid rgb(162, 169, 177); border-top-style:none; padding:2.4pt 4.8pt;'><p style='margin:12pt 0in; text-align:center;'><span style='color:rgb(32,33,34); font-family:Arial, sans-serif; font-size:10.5pt;'>high GHG emissions:</span><br /><span style='color:rgb(32,33,34); font-family:Arial, sans-serif; font-size:10.5pt;'>CO</span><span style='color:rgb(32,33,34); font-family:Arial, sans-serif; font-size:8.5pt;'><sub>2</sub></span><span style='color:rgb(32,33,34); font-family:Arial, sans-serif; font-size:10.5pt;'>&nbsp;emissions double by 2100</span></p></td><td style='border-bottom:1pt solid rgb(162, 169, 177); border-left-style:none; border-right:1pt solid rgb(162, 169, 177); border-top-style:none; padding:2.4pt 4.8pt;'><p style='margin:12pt 0in; text-align:center;'><span style='color:rgb(32,33,34); font-family:Arial, sans-serif; font-size:10.5pt;'>2.1 °C</span></p></td><td style='border-bottom:1pt solid rgb(162, 169, 177); border-left-style:none; border-right:1pt solid rgb(162, 169, 177); border-top-style:none; padding:2.4pt 4.8pt;'><p style='margin:12pt 0in; text-align:center;'><span style='color:rgb(32,33,34); font-family:Arial, sans-serif; font-size:10.5pt;'>3.6 °C</span></p></td><td style='border-bottom:1pt solid rgb(162, 169, 177); border-left-style:none; border-right:1pt solid rgb(162, 169, 177); border-top-style:none; padding:2.4pt 4.8pt;'><p style='margin:12pt 0in; text-align:center;'><span style='color:rgb(32,33,34); font-family:Arial, sans-serif; font-size:10.5pt;'>2.8 – 4.6</span></p></td></tr><tr><td style='border-bottom:1pt solid rgb(162, 169, 177); border-image:initial; border-left:1pt solid rgb(162, 169, 177); border-right:1pt solid rgb(162, 169, 177); border-top-style:none; padding:2.4pt 4.8pt;'><p style='margin:12pt 0in; text-align:center;'><span style='color:rgb(32,33,34); font-family:Arial, sans-serif; font-size:10.5pt;'>SSP5-8.5</span></p></td><td style='border-bottom:1pt solid rgb(162, 169, 177); border-left-style:none; border-right:1pt solid rgb(162, 169, 177); border-top-style:none; padding:2.4pt 4.8pt;'><p style='margin:12pt 0in; text-align:center;'><span style='color:rgb(32,33,34); font-family:Arial, sans-serif; font-size:10.5pt;'>very high GHG emissions:</span><br /><span style='color:rgb(32,33,34); font-family:Arial, sans-serif; font-size:10.5pt;'>CO</span><span style='color:rgb(32,33,34); font-family:Arial, sans-serif; font-size:8.5pt;'><sub>2</sub></span><span style='color:rgb(32,33,34); font-family:Arial, sans-serif; font-size:10.5pt;'>&nbsp;emissions triple by 2075</span></p></td><td style='border-bottom:1pt solid rgb(162, 169, 177); border-left-style:none; border-right:1pt solid rgb(162, 169, 177); border-top-style:none; padding:2.4pt 4.8pt;'><p style='margin:12pt 0in; text-align:center;'><span style='color:rgb(32,33,34); font-family:Arial, sans-serif; font-size:10.5pt;'>2.4 °C</span></p></td><td style='border-bottom:1pt solid rgb(162, 169, 177); border-left-style:none; border-right:1pt solid rgb(162, 169, 177); border-top-style:none; padding:2.4pt 4.8pt;'><p style='margin:12pt 0in; text-align:center;'><span style='color:rgb(32,33,34); font-family:Arial, sans-serif; font-size:10.5pt;'>4.4 °C</span></p></td><td style='border-bottom:1pt solid rgb(162, 169, 177); border-left-style:none; border-right:1pt solid rgb(162, 169, 177); border-top-style:none; padding:2.4pt 4.8pt;'><p style='margin:12pt 0in; text-align:center;'><span style='color:rgb(32,33,34); font-family:Arial, sans-serif; font-size:10.5pt;'>3.3 – 5.7</span></p></td></tr></tbody></table></figure><p>While the 8.5 scenario is no longer generally considered likely, SSP3 7.0 has been included and is considered the high end of possibilities. SSP5 8.5 has been retained since many organizations report to this threshold. The warming associated with SSP2 4.5 is equivalent to the global targets set at the 2021 United Nations COP26 meetings in Glasgow.&nbsp;</p><p><strong>Processing the Climate Data</strong></p><p>WorldClim provides 20-year averaged outputs for the various SSPs from 24 global climate models. A selection of 13 models were averaged for each variable and time based on&nbsp;<a target='_blank' href='https://rmets.onlinelibrary.wiley.com/doi/full/10.1002/joc.7566' rel='nofollow ugc noopener noreferrer'>Mahony et al 2022</a>. These models included ACCESS-ESM1-5, BCC-CSM2-MR, CanESM5, CNRM-ESM2-1, EC-Earth3-Veg, GFDL-ESM4, GISS-E2-1-G, INM-CM5-0,&nbsp;&nbsp;IPSL-CM6A-LR, MIROC6, MPI-ESM1-2-HR, MRI-ESM2-0, UKESM1-0-LL. GFDL-ESM4 was not available for SSP2 4.5 or SSP5 8.5.&nbsp;</p><p><strong>Accessing the Multidimensional Information</strong></p><p>The time and SSP scenario are built into the layer using a multidimensional raster. Enable the time slider to move across the 20-year average periods. In ArcGIS Online and Pro, use the Multidimensional Filter to select the SSP (SSP2 4.5 is the default).&nbsp;<br /><br /><strong>What can you do with this layer?</strong></p><p>These multidimensional imagery tiles support analysis using ArcGIS Online or Pro. Use the&nbsp;<a target='_blank' href='https://arcgis.com/home/item.html?id=e56c9cb70aa949adb791c4311003d9ae' rel='nofollow ugc noopener noreferrer'>Bioclimate Baseline layer</a>&nbsp;to see the difference in pixels and calculate change from the historic period into the future. Use the&nbsp;<a target='_blank' href='https://pro.arcgis.com/en/pro-app/latest/help/data/imagery/an-overview-of-multidimensional-raster-data.htm' rel='nofollow ugc noopener noreferrer'>Multidimensional&nbsp;</a>tab in ArcGIS Pro to access a variety of useful tools. Each layer or variable can be styled using the Image Display options.&nbsp;</p><p><strong>Known Quality Issues</strong></p><p>Each model is downscaled from ~100km resolution to ~5km resolution by WorldClim. Some artifacts are inevitable, especially at a global scale. Some variables have distinct transitions, especially in Greenland. Also, SSP2 4.5 has missing data for several variables in Antarctica.</p><p><strong>Related Layers</strong></p><p><a target='_blank' href='https://arcgis.com/home/item.html?id=fdaa1b7912e440efb9e29cf5d6156bb0' rel='nofollow ugc noopener noreferrer'>Bioclimate 1&nbsp;&nbsp;Annual Mean Temperature</a><br /><a target='_blank' href='https://arcgis.com/home/item.html?id=8012b34e8c854d6fbcfe4eab437ea397' rel='nofollow ugc noopener noreferrer'>Bioclimate 2&nbsp;&nbsp;Mean Diurnal Range</a><br /><a target='_blank' href='https://arcgis.com/home/item.html?id=ef9f5d6a16ca41ada0c0075a8da46d48' rel='nofollow ugc noopener noreferrer'>Bioclimate 3&nbsp;&nbsp;Isothermality</a><br /><a target='_blank' href='https://arcgis.com/home/item.html?id=64799fea8774463aad909020b6590dc8' rel='nofollow ugc noopener noreferrer'>Bioclimate 4&nbsp;&nbsp;Temperature Seasonality</a><br /><a target='_blank' href='https://arcgis.com/home/item.html?id=8433250e0a4148f5a3889c66e78abdf1' rel='nofollow ugc noopener noreferrer'>Bioclimate 5&nbsp;&nbsp;Max Temperature of Warmest Month</a><br /><a target='_blank' href='https://arcgis.com/home/item.html?id=c531d32ab5d746b88a884b6e54f3216e' rel='nofollow ugc noopener noreferrer'>Bioclimate 6&nbsp;&nbsp;Min Temperature Of Coldest Month</a><br /><a target='_blank' href='https://arcgis.com/home/item.html?id=808cfb3ab1614f8ab7e364de737e9e98' rel='nofollow ugc noopener noreferrer'>Bioclimate 7&nbsp;&nbsp;Temperature Annual Range</a><br /><a target='_blank' href='https://arcgis.com/home/item.html?id=b5990aa16fd94bb691a09449716ed7e5' rel='nofollow ugc noopener noreferrer'>Bioclimate 8&nbsp;&nbsp;Mean Temperature Of Wettest Quarter</a><br /><a target='_blank' href='https://arcgis.com/home/item.html?id=231770161a46467e8de9fdd9fd92dad7' rel='nofollow ugc noopener noreferrer'>Bioclimate 9&nbsp;&nbsp;Mean Temperature Of Driest Quarter</a><br /><a target='_blank' href='https://arcgis.com/home/item.html?id=3b98ddf1c78d4f0c88bd297f85847c68' rel='nofollow ugc noopener noreferrer'>Bioclimate 10&nbsp;&nbsp;Mean Temperature Of Warmest Quarter</a><br /><a target='_blank' href='https://arcgis.com/home/item.html?id=1a96d928c93c4e8fbc6a2391afd1da2f' rel='nofollow ugc noopener noreferrer'>Bioclimate 11&nbsp;&nbsp;Mean Temperature Of Coldest Quarter</a><br /><a target='_blank' href='https://arcgis.com/home/item.html?id=7bc0b8c75b0244b7a8128ae1f398bfc0' rel='nofollow ugc noopener noreferrer'>Bioclimate 12&nbsp;&nbsp;Annual Precipitation</a><br /><a target='_blank' href='https://arcgis.com/home/item.html?id=36fde801c8124f93b46b727b9873c993' rel='nofollow ugc noopener noreferrer'>Bioclimate 13&nbsp;&nbsp;Precipitation Of Wettest Month</a><br /><a target='_blank' href='https://arcgis.com/home/item.html?id=e26b01e4fa0a4aec9c5db991467b31a7' rel='nofollow ugc noopener noreferrer'>Bioclimate 14&nbsp;&nbsp;Precipitation Of Driest Month</a><br /><a target='_blank' href='https://arcgis.com/home/item.html?id=33558b5fef8642338f33918d498f41cf' rel='nofollow ugc noopener noreferrer'>Bioclimate 15&nbsp;&nbsp;Precipitation Seasonality</a><br /><a target='_blank' href='https://arcgis.com/home/item.html?id=1324c4e0c86a40e9b7529e91c6bdf220' rel='nofollow ugc noopener noreferrer'>Bioclimate 16&nbsp;&nbsp;Precipitation Of Wettest Quarter</a><br /><a target='_blank' href='https://arcgis.com/home/item.html?id=86fe2a87fe9144f9a5c330a3b5890df0' rel='nofollow ugc noopener noreferrer'>Bioclimate 17&nbsp;&nbsp;Precipitation Of Driest Quarter</a><br /><a target='_blank' href='https://arcgis.com/home/item.html?id=eb8227050ac24b3bb4a47abb924fbc56' rel='nofollow ugc noopener noreferrer'>Bioclimate 18&nbsp;&nbsp;Precipitation Of Warmest Quarter</a><br /><a target='_blank' href='https://arcgis.com/home/item.html?id=ec067623611d40d086193b21a3a4fce1' rel='nofollow ugc noopener noreferrer'>Bioclimate 19&nbsp;&nbsp;Precipitation Of Coldest Quarter</a><br /><a target='_blank' href='https://arcgis.com/home/item.html?id=e56c9cb70aa949adb791c4311003d9ae' rel='nofollow ugc noopener noreferrer'>Bioclimate Baseline 1970-2000</a></p></div>",
			"keyword": [
				"esri_environment",
				"retiring-2026-12"
			],
			"issued": "2022-05-12T16:00:19.000Z",
			"modified": "2026-05-13T19:41:26.000Z",
			"publisher": {
				"name": "Esri"
			},
			"contactPoint": {
				"@type": "vcard:Contact",
				"fn": "esri_environment",
				"hasEmail": "{{orgContactEmail}}"
			},
			"accessLevel": "public",
			"spatial": "-180.0000,-90.0000,180.0000,90.0000",
			"license": "<p><img src='https://downloads.esri.com/blogs/arcgisonline/esrilogo_new.png' width='113' height='43' /> This work is licensed under the Esri Master License Agreement.&nbsp;</p><p><a target='_blank' href='https://goto.arcgis.com/termsofuse/viewsummary' rel='nofollow ugc noopener noreferrer'>View Summary</a> | <a target='_blank' href='https://goto.arcgis.com/termsofuse/viewtermsofuse' rel='nofollow ugc noopener noreferrer'>View Terms of Use</a></p>",
			"distribution": [
				{
					"@type": "dcat:Distribution",
					"title": "ArcGIS Hub Dataset",
					"format": "Web Page",
					"mediaType": "text/html",
					"accessURL": "https://www.pacificgeoportal.com/content/esri::bioclimate-projections-09-mean-temperature-of-driest-quarter"
				},
				{
					"@type": "dcat:Distribution",
					"title": "ArcGIS GeoService",
					"format": "ArcGIS GeoServices REST API",
					"mediaType": "application/json",
					"accessURL": "https://tiledimageservices.arcgis.com/P3ePLMYs2RVChkJx/arcgis/rest/services/Bioclimate_Projections__Mean_Temperature_of_Driest_Quarter/ImageServer"
				}
			],
			"theme": [
				"geospatial"
			]
		},
		{
			"@type": "dcat:Dataset",
			"identifier": "https://www.arcgis.com/home/item.html?id=fdaa1b7912e440efb9e29cf5d6156bb0",
			"landingPage": "https://www.pacificgeoportal.com/content/esri::bioclimate-projections-01-annual-mean-temperature",
			"title": "Bioclimate Projections: (01) Annual Mean Temperature",
			"description": "<p><span style='color:#dc143c;'><strong>Retirement Notice:</strong></span><strong> This </strong><a target='_blank' href='https://goto.arcgis.com/termsofuse/beta' rel='nofollow ugc noopener noreferrer'><strong>beta</strong></a><strong> item will be retired in December 2026. A</strong><a target='_blank' href='https://www.arcgis.com/home/item.html?id=641294cb107a4d4b8cfaf8e87686b668' rel='nofollow ugc noopener noreferrer'><strong> new version of this item</strong></a><strong>&nbsp;is available for your use. </strong>Esri recommends updating your maps and apps to use the new version.</p><p><span style='background-attachment:initial; background-clip:initial; background-image:initial; background-origin:initial; background-position:initial; background-repeat:initial; background-size:initial;'>This layer represents CMIP6 future projections of mean annual temperature. This layer can be used to compare with recent climate histories to better understand the potential impacts of future climate change.</span></p><p><a target='_blank' href='https://worldclim.org/' rel='nofollow ugc noopener noreferrer'><span style='background-attachment:initial; background-clip:initial; background-image:initial; background-origin:initial; background-position:initial; background-repeat:initial; background-size:initial;'>WorldClim</span></a><span style='background-attachment:initial; background-clip:initial; background-image:initial; background-origin:initial; background-position:initial; background-repeat:initial; background-size:initial;'>&nbsp;produced this projection as part of a series of&nbsp;</span><a target='_blank' href='https://pubs.usgs.gov/ds/691/ds691.pdf' rel='nofollow ugc noopener noreferrer'><span style='background-attachment:initial; background-clip:initial; background-image:initial; background-origin:initial; background-position:initial; background-repeat:initial; background-size:initial;'>19 bioclimate variables identified by the USGS</span></a><span style='background-attachment:initial; background-clip:initial; background-image:initial; background-origin:initial; background-position:initial; background-repeat:initial; background-size:initial;'>&nbsp;and provides this description:</span><br /><br /><i>\"Bioclimatic variables are derived from the monthly temperature and rainfall values in order to generate more biologically meaningful variables. These are often used in species distribution modeling and related ecological modeling techniques. The bioclimatic variables represent annual trends (e.g., mean annual temperature, annual precipitation) seasonality (e.g., annual range in temperature and precipitation) and extreme or limiting environmental factors (e.g., temperature of the coldest and warmest month, and precipitation of the wet and dry quarters). A quarter is a period of three months (1/4 of the year).\"</i></p><p style='background-attachment:initial; background-clip:initial; background-image:initial; background-origin:initial; background-position:initial; background-repeat:initial; background-size:initial; margin-bottom:0in;'><strong>Time Extent:</strong>&nbsp;averages from 2021-2040, 2041-2060, 2061-2080, 2081-2100<br /><strong>Units:</strong>&nbsp;deg C<br /><strong>Cell Size: </strong> 2.5 minutes (~5 km)<br /><strong>Source Type: </strong> Stretched<br /><strong>Pixel Type:</strong>  32 Bit Float<br /><strong>Data Projection:</strong>  GCS WGS84<br /><strong>Mosaic Projection: </strong> GCS WGS84<br /><strong>Extent:</strong>  Global<br /><strong>Source:</strong>  <a target='_blank' href='https://worldclim.org/data/cmip6/cmip6_clim2.5m.html' rel='nofollow ugc noopener noreferrer'>WorldClim CMIP6 Bioclimate</a><br />&nbsp;</p><p><strong>Climate Scenarios</strong></p><p>The CMIP6 climate experiments use&nbsp;<a target='_blank' href='https://www.carbonbrief.org/explainer-how-shared-socioeconomic-pathways-explore-future-climate-change/' rel='nofollow ugc noopener noreferrer'>Shared Socioeconomic Pathways (SSPs)</a>&nbsp;to model future climate scenarios. Each SSP pairs a human/community behavior component with the traditional RCP greenhouse gas forcing from the previous CMIP5. Three SSPs were chosen by Esri to be included in the service based on user requests: SSP2 4.5, SSP3 7.0 and SSP5 8.5.</p><figure><table style='background-color:rgb(248, 249, 250); border-collapse:collapse;' width='850' cellpadding='0' cellspacing='0' border='1'><tbody><tr><td style='background-color:rgb(234, 236, 240); border:1pt solid rgb(162, 169, 177); padding:2.4pt 4.8pt;'><p style='margin:12pt 0in; text-align:center;'><span style='color:rgb(32,33,34); font-family:Arial, sans-serif; font-size:10.5pt;'><strong>SSP</strong></span></p></td><td style='background-color:rgb(234, 236, 240); border-bottom:1pt solid rgb(162, 169, 177); border-image:initial; border-left-style:none; border-right:1pt solid rgb(162, 169, 177); border-top:1pt solid rgb(162, 169, 177); padding:2.4pt 4.8pt;'><p style='margin:12pt 0in; text-align:center;'><span style='color:rgb(32,33,34); font-family:Arial, sans-serif; font-size:10.5pt;'><strong>Scenario</strong></span></p></td><td style='background-color:rgb(234, 236, 240); border-bottom:1pt solid rgb(162, 169, 177); border-image:initial; border-left-style:none; border-right:1pt solid rgb(162, 169, 177); border-top:1pt solid rgb(162, 169, 177); padding:2.4pt 4.8pt;'><p style='margin:12pt 0in; text-align:center;'><span style='color:rgb(32,33,34); font-family:Arial, sans-serif; font-size:10.5pt;'><strong>Estimated warming</strong></span><br /><span style='color:rgb(32,33,34); font-family:Arial, sans-serif; font-size:10.5pt;'><strong>(2041–2060)</strong></span></p></td><td style='background-color:rgb(234, 236, 240); border-bottom:1pt solid rgb(162, 169, 177); border-image:initial; border-left-style:none; border-right:1pt solid rgb(162, 169, 177); border-top:1pt solid rgb(162, 169, 177); padding:2.4pt 4.8pt;'><p style='margin:12pt 0in; text-align:center;'><span style='color:rgb(32,33,34); font-family:Arial, sans-serif; font-size:10.5pt;'><strong>Estimated warming</strong></span><br /><span style='color:rgb(32,33,34); font-family:Arial, sans-serif; font-size:10.5pt;'><strong>(2081–2100)</strong></span></p></td><td style='background-color:rgb(234, 236, 240); border-bottom:1pt solid rgb(162, 169, 177); border-image:initial; border-left-style:none; border-right:1pt solid rgb(162, 169, 177); border-top:1pt solid rgb(162, 169, 177); padding:2.4pt 4.8pt;'><p style='margin:12pt 0in; text-align:center;'><span style='color:rgb(32,33,34); font-family:Arial, sans-serif; font-size:10.5pt;'><strong>Very likely range in °C</strong></span><br /><span style='color:rgb(32,33,34); font-family:Arial, sans-serif; font-size:10.5pt;'><strong>(2081–2100)</strong></span></p></td></tr><tr><td style='border-bottom:1pt solid rgb(162, 169, 177); border-image:initial; border-left:1pt solid rgb(162, 169, 177); border-right:1pt solid rgb(162, 169, 177); border-top-style:none; padding:2.4pt 4.8pt;'><p style='margin:12pt 0in; text-align:center;'><span style='color:rgb(32,33,34); font-family:Arial, sans-serif; font-size:10.5pt;'>SSP2-4.5</span></p></td><td style='border-bottom:1pt solid rgb(162, 169, 177); border-left-style:none; border-right:1pt solid rgb(162, 169, 177); border-top-style:none; padding:2.4pt 4.8pt;'><p style='margin:12pt 0in; text-align:center;'><span style='color:rgb(32,33,34); font-family:Arial, sans-serif; font-size:10.5pt;'>intermediate GHG emissions:</span><br /><span style='color:rgb(32,33,34); font-family:Arial, sans-serif; font-size:10.5pt;'>CO</span><span style='color:rgb(32,33,34); font-family:Arial, sans-serif; font-size:8.5pt;'><sub>2</sub></span><span style='color:rgb(32,33,34); font-family:Arial, sans-serif; font-size:10.5pt;'>&nbsp;emissions around current levels until 2050, then falling but not reaching net zero by 2100</span></p></td><td style='border-bottom:1pt solid rgb(162, 169, 177); border-left-style:none; border-right:1pt solid rgb(162, 169, 177); border-top-style:none; padding:2.4pt 4.8pt;'><p style='margin:12pt 0in; text-align:center;'><span style='color:rgb(32,33,34); font-family:Arial, sans-serif; font-size:10.5pt;'>2.0 °C</span></p></td><td style='border-bottom:1pt solid rgb(162, 169, 177); border-left-style:none; border-right:1pt solid rgb(162, 169, 177); border-top-style:none; padding:2.4pt 4.8pt;'><p style='margin:12pt 0in; text-align:center;'><span style='color:rgb(32,33,34); font-family:Arial, sans-serif; font-size:10.5pt;'>2.7 °C</span></p></td><td style='border-bottom:1pt solid rgb(162, 169, 177); border-left-style:none; border-right:1pt solid rgb(162, 169, 177); border-top-style:none; padding:2.4pt 4.8pt;'><p style='margin:12pt 0in; text-align:center;'><span style='color:rgb(32,33,34); font-family:Arial, sans-serif; font-size:10.5pt;'>2.1 – 3.5</span></p></td></tr><tr><td style='border-bottom:1pt solid rgb(162, 169, 177); border-image:initial; border-left:1pt solid rgb(162, 169, 177); border-right:1pt solid rgb(162, 169, 177); border-top-style:none; padding:2.4pt 4.8pt;'><p style='margin:12pt 0in; text-align:center;'><span style='color:rgb(32,33,34); font-family:Arial, sans-serif; font-size:10.5pt;'>SSP3-7.0</span></p></td><td style='border-bottom:1pt solid rgb(162, 169, 177); border-left-style:none; border-right:1pt solid rgb(162, 169, 177); border-top-style:none; padding:2.4pt 4.8pt;'><p style='margin:12pt 0in; text-align:center;'><span style='color:rgb(32,33,34); font-family:Arial, sans-serif; font-size:10.5pt;'>high GHG emissions:</span><br /><span style='color:rgb(32,33,34); font-family:Arial, sans-serif; font-size:10.5pt;'>CO</span><span style='color:rgb(32,33,34); font-family:Arial, sans-serif; font-size:8.5pt;'><sub>2</sub></span><span style='color:rgb(32,33,34); font-family:Arial, sans-serif; font-size:10.5pt;'>&nbsp;emissions double by 2100</span></p></td><td style='border-bottom:1pt solid rgb(162, 169, 177); border-left-style:none; border-right:1pt solid rgb(162, 169, 177); border-top-style:none; padding:2.4pt 4.8pt;'><p style='margin:12pt 0in; text-align:center;'><span style='color:rgb(32,33,34); font-family:Arial, sans-serif; font-size:10.5pt;'>2.1 °C</span></p></td><td style='border-bottom:1pt solid rgb(162, 169, 177); border-left-style:none; border-right:1pt solid rgb(162, 169, 177); border-top-style:none; padding:2.4pt 4.8pt;'><p style='margin:12pt 0in; text-align:center;'><span style='color:rgb(32,33,34); font-family:Arial, sans-serif; font-size:10.5pt;'>3.6 °C</span></p></td><td style='border-bottom:1pt solid rgb(162, 169, 177); border-left-style:none; border-right:1pt solid rgb(162, 169, 177); border-top-style:none; padding:2.4pt 4.8pt;'><p style='margin:12pt 0in; text-align:center;'><span style='color:rgb(32,33,34); font-family:Arial, sans-serif; font-size:10.5pt;'>2.8 – 4.6</span></p></td></tr><tr><td style='border-bottom:1pt solid rgb(162, 169, 177); border-image:initial; border-left:1pt solid rgb(162, 169, 177); border-right:1pt solid rgb(162, 169, 177); border-top-style:none; padding:2.4pt 4.8pt;'><p style='margin:12pt 0in; text-align:center;'><span style='color:rgb(32,33,34); font-family:Arial, sans-serif; font-size:10.5pt;'>SSP5-8.5</span></p></td><td style='border-bottom:1pt solid rgb(162, 169, 177); border-left-style:none; border-right:1pt solid rgb(162, 169, 177); border-top-style:none; padding:2.4pt 4.8pt;'><p style='margin:12pt 0in; text-align:center;'><span style='color:rgb(32,33,34); font-family:Arial, sans-serif; font-size:10.5pt;'>very high GHG emissions:</span><br /><span style='color:rgb(32,33,34); font-family:Arial, sans-serif; font-size:10.5pt;'>CO</span><span style='color:rgb(32,33,34); font-family:Arial, sans-serif; font-size:8.5pt;'><sub>2</sub></span><span style='color:rgb(32,33,34); font-family:Arial, sans-serif; font-size:10.5pt;'>&nbsp;emissions triple by 2075</span></p></td><td style='border-bottom:1pt solid rgb(162, 169, 177); border-left-style:none; border-right:1pt solid rgb(162, 169, 177); border-top-style:none; padding:2.4pt 4.8pt;'><p style='margin:12pt 0in; text-align:center;'><span style='color:rgb(32,33,34); font-family:Arial, sans-serif; font-size:10.5pt;'>2.4 °C</span></p></td><td style='border-bottom:1pt solid rgb(162, 169, 177); border-left-style:none; border-right:1pt solid rgb(162, 169, 177); border-top-style:none; padding:2.4pt 4.8pt;'><p style='margin:12pt 0in; text-align:center;'><span style='color:rgb(32,33,34); font-family:Arial, sans-serif; font-size:10.5pt;'>4.4 °C</span></p></td><td style='border-bottom:1pt solid rgb(162, 169, 177); border-left-style:none; border-right:1pt solid rgb(162, 169, 177); border-top-style:none; padding:2.4pt 4.8pt;'><p style='margin:12pt 0in; text-align:center;'><span style='color:rgb(32,33,34); font-family:Arial, sans-serif; font-size:10.5pt;'>3.3 – 5.7</span></p></td></tr></tbody></table></figure><p>While the 8.5 scenario is no longer generally considered likely, SSP3 7.0 has been included and is considered the high end of possibilities. SSP5 8.5 has been retained since many organizations report to this threshold. The warming associated with SSP2 4.5 is equivalent to the global targets set at the 2021 United Nations COP26 meetings in Glasgow.&nbsp;</p><p><strong>Processing the Climate Data</strong></p><p>WorldClim provides 20-year averaged outputs for the various SSPs from 24 global climate models. A selection of 13 models were averaged for each variable and time based on&nbsp;<a target='_blank' href='https://rmets.onlinelibrary.wiley.com/doi/full/10.1002/joc.7566' rel='nofollow ugc noopener noreferrer'>Mahony et al 2022</a>. These models included ACCESS-ESM1-5, BCC-CSM2-MR, CanESM5, CNRM-ESM2-1, EC-Earth3-Veg, GFDL-ESM4, GISS-E2-1-G, INM-CM5-0,&nbsp;&nbsp;IPSL-CM6A-LR, MIROC6, MPI-ESM1-2-HR, MRI-ESM2-0, UKESM1-0-LL. GFDL-ESM4 was not available for SSP2 4.5 or SSP5 8.5.&nbsp;</p><p><strong>Accessing the Multidimensional Information</strong></p><p>The time and SSP scenario are built into the layer using a multidimensional raster. Enable the time slider to move across the 20-year average periods. In ArcGIS Online and Pro, use the Multidimensional Filter to select the SSP (SSP2 4.5 is the default).&nbsp;<br /><br /><strong>What can you do with this layer?</strong></p><p>These multidimensional imagery tiles support analysis using ArcGIS Online or Pro. Use the&nbsp;<a target='_blank' href='https://arcgis.com/home/item.html?id=e56c9cb70aa949adb791c4311003d9ae' rel='nofollow ugc noopener noreferrer'>Bioclimate Baseline layer</a>&nbsp;to see the difference in pixels and calculate change from the historic period into the future. Use the&nbsp;<a target='_blank' href='https://pro.arcgis.com/en/pro-app/latest/help/data/imagery/an-overview-of-multidimensional-raster-data.htm' rel='nofollow ugc noopener noreferrer'>Multidimensional&nbsp;</a>tab in ArcGIS Pro to access a variety of useful tools. Each layer or variable can be styled using the Image Display options.&nbsp;</p><p><strong>Known Quality Issues</strong></p><p>Each model is downscaled from ~100km resolution to ~5km resolution by WorldClim. Some artifacts are inevitable, especially at a global scale. Some variables have distinct transitions, especially in Greenland. Also, SSP2 4.5 has missing data for several variables in Antarctica.<br />&nbsp;</p><p><strong>Related Layers</strong></p><p><a target='_blank' href='https://arcgis.com/home/item.html?id=fdaa1b7912e440efb9e29cf5d6156bb0' rel='nofollow ugc noopener noreferrer'>Bioclimate 1&nbsp;&nbsp;Annual Mean Temperature</a><br /><a target='_blank' href='https://arcgis.com/home/item.html?id=8012b34e8c854d6fbcfe4eab437ea397' rel='nofollow ugc noopener noreferrer'>Bioclimate 2&nbsp;&nbsp;Mean Diurnal Range</a><br /><a target='_blank' href='https://arcgis.com/home/item.html?id=ef9f5d6a16ca41ada0c0075a8da46d48' rel='nofollow ugc noopener noreferrer'>Bioclimate 3&nbsp;&nbsp;Isothermality</a><br /><a target='_blank' href='https://arcgis.com/home/item.html?id=64799fea8774463aad909020b6590dc8' rel='nofollow ugc noopener noreferrer'>Bioclimate 4&nbsp;&nbsp;Temperature Seasonality</a><br /><a target='_blank' href='https://arcgis.com/home/item.html?id=8433250e0a4148f5a3889c66e78abdf1' rel='nofollow ugc noopener noreferrer'>Bioclimate 5&nbsp;&nbsp;Max Temperature of Warmest Month</a><br /><a target='_blank' href='https://arcgis.com/home/item.html?id=c531d32ab5d746b88a884b6e54f3216e' rel='nofollow ugc noopener noreferrer'>Bioclimate 6&nbsp;&nbsp;Min Temperature Of Coldest Month</a><br /><a target='_blank' href='https://arcgis.com/home/item.html?id=808cfb3ab1614f8ab7e364de737e9e98' rel='nofollow ugc noopener noreferrer'>Bioclimate 7&nbsp;&nbsp;Temperature Annual Range</a><br /><a target='_blank' href='https://arcgis.com/home/item.html?id=b5990aa16fd94bb691a09449716ed7e5' rel='nofollow ugc noopener noreferrer'>Bioclimate 8&nbsp;&nbsp;Mean Temperature Of Wettest Quarter</a><br /><a target='_blank' href='https://arcgis.com/home/item.html?id=231770161a46467e8de9fdd9fd92dad7' rel='nofollow ugc noopener noreferrer'>Bioclimate 9&nbsp;&nbsp;Mean Temperature Of Driest Quarter</a><br /><a target='_blank' href='https://arcgis.com/home/item.html?id=3b98ddf1c78d4f0c88bd297f85847c68' rel='nofollow ugc noopener noreferrer'>Bioclimate 10&nbsp;&nbsp;Mean Temperature Of Warmest Quarter</a><br /><a target='_blank' href='https://arcgis.com/home/item.html?id=1a96d928c93c4e8fbc6a2391afd1da2f' rel='nofollow ugc noopener noreferrer'>Bioclimate 11&nbsp;&nbsp;Mean Temperature Of Coldest Quarter</a><br /><a target='_blank' href='https://arcgis.com/home/item.html?id=7bc0b8c75b0244b7a8128ae1f398bfc0' rel='nofollow ugc noopener noreferrer'>Bioclimate 12&nbsp;&nbsp;Annual Precipitation</a><br /><a target='_blank' href='https://arcgis.com/home/item.html?id=36fde801c8124f93b46b727b9873c993' rel='nofollow ugc noopener noreferrer'>Bioclimate 13&nbsp;&nbsp;Precipitation Of Wettest Month</a><br /><a target='_blank' href='https://arcgis.com/home/item.html?id=e26b01e4fa0a4aec9c5db991467b31a7' rel='nofollow ugc noopener noreferrer'>Bioclimate 14&nbsp;&nbsp;Precipitation Of Driest Month</a><br /><a target='_blank' href='https://arcgis.com/home/item.html?id=33558b5fef8642338f33918d498f41cf' rel='nofollow ugc noopener noreferrer'>Bioclimate 15&nbsp;&nbsp;Precipitation Seasonality</a><br /><a target='_blank' href='https://arcgis.com/home/item.html?id=1324c4e0c86a40e9b7529e91c6bdf220' rel='nofollow ugc noopener noreferrer'>Bioclimate 16&nbsp;&nbsp;Precipitation Of Wettest Quarter</a><br /><a target='_blank' href='https://arcgis.com/home/item.html?id=86fe2a87fe9144f9a5c330a3b5890df0' rel='nofollow ugc noopener noreferrer'>Bioclimate 17&nbsp;&nbsp;Precipitation Of Driest Quarter</a><br /><a target='_blank' href='https://arcgis.com/home/item.html?id=eb8227050ac24b3bb4a47abb924fbc56' rel='nofollow ugc noopener noreferrer'>Bioclimate 18&nbsp;&nbsp;Precipitation Of Warmest Quarter</a><br /><a target='_blank' href='https://arcgis.com/home/item.html?id=ec067623611d40d086193b21a3a4fce1' rel='nofollow ugc noopener noreferrer'>Bioclimate 19&nbsp;&nbsp;Precipitation Of Coldest Quarter</a><br /><a target='_blank' href='https://arcgis.com/home/item.html?id=e56c9cb70aa949adb791c4311003d9ae' rel='nofollow ugc noopener noreferrer'>Bioclimate Baseline 1970-2000</a></p>",
			"keyword": [
				"esri_environment",
				"retiring-2026-12"
			],
			"issued": "2022-05-12T16:51:18.000Z",
			"modified": "2026-05-13T19:41:09.000Z",
			"publisher": {
				"name": "Esri"
			},
			"contactPoint": {
				"@type": "vcard:Contact",
				"fn": "esri_environment",
				"hasEmail": "{{orgContactEmail}}"
			},
			"accessLevel": "public",
			"spatial": "-180.0000,-90.0000,180.0000,90.0000",
			"license": "<p><img src='https://downloads.esri.com/blogs/arcgisonline/esrilogo_new.png' width='113' height='43' /> This work is licensed under the Esri Master License Agreement.&nbsp;</p><p><a target='_blank' href='https://goto.arcgis.com/termsofuse/viewsummary' rel='nofollow ugc noopener noreferrer'>View Summary</a> | <a target='_blank' href='https://goto.arcgis.com/termsofuse/viewtermsofuse' rel='nofollow ugc noopener noreferrer'>View Terms of Use</a></p>",
			"distribution": [
				{
					"@type": "dcat:Distribution",
					"title": "ArcGIS Hub Dataset",
					"format": "Web Page",
					"mediaType": "text/html",
					"accessURL": "https://www.pacificgeoportal.com/content/esri::bioclimate-projections-01-annual-mean-temperature"
				},
				{
					"@type": "dcat:Distribution",
					"title": "ArcGIS GeoService",
					"format": "ArcGIS GeoServices REST API",
					"mediaType": "application/json",
					"accessURL": "https://tiledimageservices.arcgis.com/P3ePLMYs2RVChkJx/arcgis/rest/services/Bioclimate_Projections__Annual_Mean_Temperature/ImageServer"
				}
			],
			"theme": [
				"geospatial"
			]
		},
		{
			"@type": "dcat:Dataset",
			"identifier": "https://www.arcgis.com/home/item.html?id=b5990aa16fd94bb691a09449716ed7e5",
			"landingPage": "https://www.pacificgeoportal.com/content/esri::bioclimate-projections-08-mean-temperature-of-wettest-quarter",
			"title": "Bioclimate Projections: (08) Mean Temperature of Wettest Quarter",
			"description": "<p><span style='color:#dc143c;'><strong>Retirement Notice:</strong></span><strong>&nbsp;This </strong><a target='_blank' href='https://goto.arcgis.com/termsofuse/beta' rel='nofollow ugc noopener noreferrer'><strong>beta</strong></a><strong> item will be retired in December 2026. A</strong><a target='_blank' href='https://www.arcgis.com/home/item.html?id=987f95765d6b4c20b592e4c64c64805f' rel='nofollow ugc noopener noreferrer'><strong> new version of this item</strong></a><strong>&nbsp;is available for your use. </strong>Esri recommends updating your maps and apps to use the new version.</p><p><span style='background-attachment:initial; background-clip:initial; background-image:initial; background-origin:initial; background-position:initial; background-repeat:initial; background-size:initial;'>This layer represents CMIP6 future projections of mean temperature during the three wettest months of the year. This layer can be used to compare with recent climate histories to better understand the potential impacts of future climate change.</span></p><p><a target='_blank' href='https://worldclim.org/' rel='nofollow ugc noopener noreferrer'><span style='background-attachment:initial; background-clip:initial; background-image:initial; background-origin:initial; background-position:initial; background-repeat:initial; background-size:initial;'>WorldClim</span></a><span style='background-attachment:initial; background-clip:initial; background-image:initial; background-origin:initial; background-position:initial; background-repeat:initial; background-size:initial;'>&nbsp;produced this projection as part of a series of&nbsp;</span><a target='_blank' href='https://pubs.usgs.gov/ds/691/ds691.pdf' rel='nofollow ugc noopener noreferrer'><span style='background-attachment:initial; background-clip:initial; background-image:initial; background-origin:initial; background-position:initial; background-repeat:initial; background-size:initial;'>19 bioclimate variables identified by the USGS</span></a><span style='background-attachment:initial; background-clip:initial; background-image:initial; background-origin:initial; background-position:initial; background-repeat:initial; background-size:initial;'>&nbsp;and provides this description:</span><br /><br /><i>\"Bioclimatic variables are derived from the monthly temperature and rainfall values in order to generate more biologically meaningful variables. These are often used in species distribution modeling and related ecological modeling techniques. The bioclimatic variables represent annual trends (e.g., mean annual temperature, annual precipitation) seasonality (e.g., annual range in temperature and precipitation) and extreme or limiting environmental factors (e.g., temperature of the coldest and warmest month, and precipitation of the wet and dry quarters). A quarter is a period of three months (1/4 of the year).\"</i></p><p style='background-attachment:initial; background-clip:initial; background-image:initial; background-origin:initial; background-position:initial; background-repeat:initial; background-size:initial; margin-bottom:0in;'><strong>Time Extent:</strong>&nbsp;averages from 2021-2040, 2041-2060, 2061-2080, 2081-2100<br /><strong>Units:</strong>&nbsp;deg C<br /><strong>Cell Size:</strong> 2.5 minutes (~5 km)<br /><strong>Source Type:</strong> Stretched<br /><strong>Pixel Type:</strong> 32 Bit Float<br /><strong>Data Projection:</strong> GCS WGS84<br /><strong>Mosaic Projection:</strong> GCS WGS84<br /><strong>Extent:</strong> Global<br /><strong>Source:</strong> <a target='_blank' href='https://worldclim.org/data/cmip6/cmip6_clim2.5m.html' rel='nofollow ugc noopener noreferrer'>WorldClim CMIP6 Bioclimate</a><br />&nbsp;</p><p><strong>Climate Scenarios</strong></p><p>The CMIP6 climate experiments use&nbsp;<a target='_blank' href='https://www.carbonbrief.org/explainer-how-shared-socioeconomic-pathways-explore-future-climate-change/' rel='nofollow ugc noopener noreferrer'>Shared Socioeconomic Pathways (SSPs)</a>&nbsp;to model future climate scenarios. Each SSP pairs a human/community behavior component with the traditional RCP greenhouse gas forcing from the previous CMIP5. Three SSPs were chosen by Esri to be included in the service based on user requests: SSP2 4.5, SSP3 7.0 and SSP5 8.5.</p><figure><table style='background-color:rgb(248, 249, 250); border-collapse:collapse;' width='850' cellpadding='0' cellspacing='0' border='1'><tbody><tr><td style='background-color:rgb(234, 236, 240); border:1pt solid rgb(162, 169, 177); padding:2.4pt 4.8pt;'><p style='margin:12pt 0in; text-align:center;'><span style='color:rgb(32,33,34); font-family:Arial, sans-serif; font-size:10.5pt;'><strong>SSP</strong></span></p></td><td style='background-color:rgb(234, 236, 240); border-bottom:1pt solid rgb(162, 169, 177); border-image:initial; border-left-style:none; border-right:1pt solid rgb(162, 169, 177); border-top:1pt solid rgb(162, 169, 177); padding:2.4pt 4.8pt;'><p style='margin:12pt 0in; text-align:center;'><span style='color:rgb(32,33,34); font-family:Arial, sans-serif; font-size:10.5pt;'><strong>Scenario</strong></span></p></td><td style='background-color:rgb(234, 236, 240); border-bottom:1pt solid rgb(162, 169, 177); border-image:initial; border-left-style:none; border-right:1pt solid rgb(162, 169, 177); border-top:1pt solid rgb(162, 169, 177); padding:2.4pt 4.8pt;'><p style='margin:12pt 0in; text-align:center;'><span style='color:rgb(32,33,34); font-family:Arial, sans-serif; font-size:10.5pt;'><strong>Estimated warming</strong></span><br /><span style='color:rgb(32,33,34); font-family:Arial, sans-serif; font-size:10.5pt;'><strong>(2041–2060)</strong></span></p></td><td style='background-color:rgb(234, 236, 240); border-bottom:1pt solid rgb(162, 169, 177); border-image:initial; border-left-style:none; border-right:1pt solid rgb(162, 169, 177); border-top:1pt solid rgb(162, 169, 177); padding:2.4pt 4.8pt;'><p style='margin:12pt 0in; text-align:center;'><span style='color:rgb(32,33,34); font-family:Arial, sans-serif; font-size:10.5pt;'><strong>Estimated warming</strong></span><br /><span style='color:rgb(32,33,34); font-family:Arial, sans-serif; font-size:10.5pt;'><strong>(2081–2100)</strong></span></p></td><td style='background-color:rgb(234, 236, 240); border-bottom:1pt solid rgb(162, 169, 177); border-image:initial; border-left-style:none; border-right:1pt solid rgb(162, 169, 177); border-top:1pt solid rgb(162, 169, 177); padding:2.4pt 4.8pt;'><p style='margin:12pt 0in; text-align:center;'><span style='color:rgb(32,33,34); font-family:Arial, sans-serif; font-size:10.5pt;'><strong>Very likely range in °C</strong></span><br /><span style='color:rgb(32,33,34); font-family:Arial, sans-serif; font-size:10.5pt;'><strong>(2081–2100)</strong></span></p></td></tr><tr><td style='border-bottom:1pt solid rgb(162, 169, 177); border-image:initial; border-left:1pt solid rgb(162, 169, 177); border-right:1pt solid rgb(162, 169, 177); border-top-style:none; padding:2.4pt 4.8pt;'><p style='margin:12pt 0in; text-align:center;'><span style='color:rgb(32,33,34); font-family:Arial, sans-serif; font-size:10.5pt;'>SSP2-4.5</span></p></td><td style='border-bottom:1pt solid rgb(162, 169, 177); border-left-style:none; border-right:1pt solid rgb(162, 169, 177); border-top-style:none; padding:2.4pt 4.8pt;'><p style='margin:12pt 0in; text-align:center;'><span style='color:rgb(32,33,34); font-family:Arial, sans-serif; font-size:10.5pt;'>intermediate GHG emissions:</span><br /><span style='color:rgb(32,33,34); font-family:Arial, sans-serif; font-size:10.5pt;'>CO</span><span style='color:rgb(32,33,34); font-family:Arial, sans-serif; font-size:8.5pt;'><sub>2</sub></span><span style='color:rgb(32,33,34); font-family:Arial, sans-serif; font-size:10.5pt;'>&nbsp;emissions around current levels until 2050, then falling but not reaching net zero by 2100</span></p></td><td style='border-bottom:1pt solid rgb(162, 169, 177); border-left-style:none; border-right:1pt solid rgb(162, 169, 177); border-top-style:none; padding:2.4pt 4.8pt;'><p style='margin:12pt 0in; text-align:center;'><span style='color:rgb(32,33,34); font-family:Arial, sans-serif; font-size:10.5pt;'>2.0 °C</span></p></td><td style='border-bottom:1pt solid rgb(162, 169, 177); border-left-style:none; border-right:1pt solid rgb(162, 169, 177); border-top-style:none; padding:2.4pt 4.8pt;'><p style='margin:12pt 0in; text-align:center;'><span style='color:rgb(32,33,34); font-family:Arial, sans-serif; font-size:10.5pt;'>2.7 °C</span></p></td><td style='border-bottom:1pt solid rgb(162, 169, 177); border-left-style:none; border-right:1pt solid rgb(162, 169, 177); border-top-style:none; padding:2.4pt 4.8pt;'><p style='margin:12pt 0in; text-align:center;'><span style='color:rgb(32,33,34); font-family:Arial, sans-serif; font-size:10.5pt;'>2.1 – 3.5</span></p></td></tr><tr><td style='border-bottom:1pt solid rgb(162, 169, 177); border-image:initial; border-left:1pt solid rgb(162, 169, 177); border-right:1pt solid rgb(162, 169, 177); border-top-style:none; padding:2.4pt 4.8pt;'><p style='margin:12pt 0in; text-align:center;'><span style='color:rgb(32,33,34); font-family:Arial, sans-serif; font-size:10.5pt;'>SSP3-7.0</span></p></td><td style='border-bottom:1pt solid rgb(162, 169, 177); border-left-style:none; border-right:1pt solid rgb(162, 169, 177); border-top-style:none; padding:2.4pt 4.8pt;'><p style='margin:12pt 0in; text-align:center;'><span style='color:rgb(32,33,34); font-family:Arial, sans-serif; font-size:10.5pt;'>high GHG emissions:</span><br /><span style='color:rgb(32,33,34); font-family:Arial, sans-serif; font-size:10.5pt;'>CO</span><span style='color:rgb(32,33,34); font-family:Arial, sans-serif; font-size:8.5pt;'><sub>2</sub></span><span style='color:rgb(32,33,34); font-family:Arial, sans-serif; font-size:10.5pt;'>&nbsp;emissions double by 2100</span></p></td><td style='border-bottom:1pt solid rgb(162, 169, 177); border-left-style:none; border-right:1pt solid rgb(162, 169, 177); border-top-style:none; padding:2.4pt 4.8pt;'><p style='margin:12pt 0in; text-align:center;'><span style='color:rgb(32,33,34); font-family:Arial, sans-serif; font-size:10.5pt;'>2.1 °C</span></p></td><td style='border-bottom:1pt solid rgb(162, 169, 177); border-left-style:none; border-right:1pt solid rgb(162, 169, 177); border-top-style:none; padding:2.4pt 4.8pt;'><p style='margin:12pt 0in; text-align:center;'><span style='color:rgb(32,33,34); font-family:Arial, sans-serif; font-size:10.5pt;'>3.6 °C</span></p></td><td style='border-bottom:1pt solid rgb(162, 169, 177); border-left-style:none; border-right:1pt solid rgb(162, 169, 177); border-top-style:none; padding:2.4pt 4.8pt;'><p style='margin:12pt 0in; text-align:center;'><span style='color:rgb(32,33,34); font-family:Arial, sans-serif; font-size:10.5pt;'>2.8 – 4.6</span></p></td></tr><tr><td style='border-bottom:1pt solid rgb(162, 169, 177); border-image:initial; border-left:1pt solid rgb(162, 169, 177); border-right:1pt solid rgb(162, 169, 177); border-top-style:none; padding:2.4pt 4.8pt;'><p style='margin:12pt 0in; text-align:center;'><span style='color:rgb(32,33,34); font-family:Arial, sans-serif; font-size:10.5pt;'>SSP5-8.5</span></p></td><td style='border-bottom:1pt solid rgb(162, 169, 177); border-left-style:none; border-right:1pt solid rgb(162, 169, 177); border-top-style:none; padding:2.4pt 4.8pt;'><p style='margin:12pt 0in; text-align:center;'><span style='color:rgb(32,33,34); font-family:Arial, sans-serif; font-size:10.5pt;'>very high GHG emissions:</span><br /><span style='color:rgb(32,33,34); font-family:Arial, sans-serif; font-size:10.5pt;'>CO</span><span style='color:rgb(32,33,34); font-family:Arial, sans-serif; font-size:8.5pt;'><sub>2</sub></span><span style='color:rgb(32,33,34); font-family:Arial, sans-serif; font-size:10.5pt;'>&nbsp;emissions triple by 2075</span></p></td><td style='border-bottom:1pt solid rgb(162, 169, 177); border-left-style:none; border-right:1pt solid rgb(162, 169, 177); border-top-style:none; padding:2.4pt 4.8pt;'><p style='margin:12pt 0in; text-align:center;'><span style='color:rgb(32,33,34); font-family:Arial, sans-serif; font-size:10.5pt;'>2.4 °C</span></p></td><td style='border-bottom:1pt solid rgb(162, 169, 177); border-left-style:none; border-right:1pt solid rgb(162, 169, 177); border-top-style:none; padding:2.4pt 4.8pt;'><p style='margin:12pt 0in; text-align:center;'><span style='color:rgb(32,33,34); font-family:Arial, sans-serif; font-size:10.5pt;'>4.4 °C</span></p></td><td style='border-bottom:1pt solid rgb(162, 169, 177); border-left-style:none; border-right:1pt solid rgb(162, 169, 177); border-top-style:none; padding:2.4pt 4.8pt;'><p style='margin:12pt 0in; text-align:center;'><span style='color:rgb(32,33,34); font-family:Arial, sans-serif; font-size:10.5pt;'>3.3 – 5.7</span></p></td></tr></tbody></table></figure><p>While the 8.5 scenario is no longer generally considered likely, SSP3 7.0 has been included and is considered the high end of possibilities. SSP5 8.5 has been retained since many organizations report to this threshold. The warming associated with SSP2 4.5 is equivalent to the global targets set at the 2021 United Nations COP26 meetings in Glasgow.&nbsp;</p><p><strong>Processing the Climate Data</strong></p><p>WorldClim provides 20-year averaged outputs for the various SSPs from 24 global climate models. A selection of 13 models were averaged for each variable and time based on&nbsp;<a target='_blank' href='https://rmets.onlinelibrary.wiley.com/doi/full/10.1002/joc.7566' rel='nofollow ugc noopener noreferrer'>Mahony et al 2022</a>. These models included ACCESS-ESM1-5, BCC-CSM2-MR, CanESM5, CNRM-ESM2-1, EC-Earth3-Veg, GFDL-ESM4, GISS-E2-1-G, INM-CM5-0,&nbsp;&nbsp;IPSL-CM6A-LR, MIROC6, MPI-ESM1-2-HR, MRI-ESM2-0, UKESM1-0-LL. GFDL-ESM4 was not available for SSP2 4.5 or SSP5 8.5.&nbsp;</p><p><strong>Accessing the Multidimensional Information</strong></p><p>The time and SSP scenario are built into the layer using a multidimensional raster. Enable the time slider to move across the 20-year average periods. In ArcGIS Online and Pro, use the Multidimensional Filter to select the SSP (SSP2 4.5 is the default).&nbsp;<br /><br /><strong>What can you do with this layer?</strong></p><p>These multidimensional imagery tiles support analysis using ArcGIS Online or Pro. Use the&nbsp;<a target='_blank' href='https://arcgis.com/home/item.html?id=e56c9cb70aa949adb791c4311003d9ae' rel='nofollow ugc noopener noreferrer'>Bioclimate Baseline layer</a>&nbsp;to see the difference in pixels and calculate change from the historic period into the future. Use the&nbsp;<a target='_blank' href='https://pro.arcgis.com/en/pro-app/latest/help/data/imagery/an-overview-of-multidimensional-raster-data.htm' rel='nofollow ugc noopener noreferrer'>Multidimensional&nbsp;</a>tab in ArcGIS Pro to access a variety of useful tools. Each layer or variable can be styled using the Image Display options.&nbsp;</p><p><strong>Known Quality Issues</strong></p><p>Each model is downscaled from ~100km resolution to ~5km resolution by WorldClim. Some artifacts are inevitable, especially at a global scale. Some variables have distinct transitions, especially in Greenland. Also, SSP2 4.5 has missing data for several variables in Antarctica.</p><p><strong>Related Layers</strong></p><p><a target='_blank' href='https://arcgis.com/home/item.html?id=fdaa1b7912e440efb9e29cf5d6156bb0' rel='nofollow ugc noopener noreferrer'>Bioclimate 1&nbsp;&nbsp;Annual Mean Temperature</a><br /><a target='_blank' href='https://arcgis.com/home/item.html?id=8012b34e8c854d6fbcfe4eab437ea397' rel='nofollow ugc noopener noreferrer'>Bioclimate 2&nbsp;&nbsp;Mean Diurnal Range</a><br /><a target='_blank' href='https://arcgis.com/home/item.html?id=ef9f5d6a16ca41ada0c0075a8da46d48' rel='nofollow ugc noopener noreferrer'>Bioclimate 3&nbsp;&nbsp;Isothermality</a><br /><a target='_blank' href='https://arcgis.com/home/item.html?id=64799fea8774463aad909020b6590dc8' rel='nofollow ugc noopener noreferrer'>Bioclimate 4&nbsp;&nbsp;Temperature Seasonality</a><br /><a target='_blank' href='https://arcgis.com/home/item.html?id=8433250e0a4148f5a3889c66e78abdf1' rel='nofollow ugc noopener noreferrer'>Bioclimate 5&nbsp;&nbsp;Max Temperature of Warmest Month</a><br /><a target='_blank' href='https://arcgis.com/home/item.html?id=c531d32ab5d746b88a884b6e54f3216e' rel='nofollow ugc noopener noreferrer'>Bioclimate 6&nbsp;&nbsp;Min Temperature Of Coldest Month</a><br /><a target='_blank' href='https://arcgis.com/home/item.html?id=808cfb3ab1614f8ab7e364de737e9e98' rel='nofollow ugc noopener noreferrer'>Bioclimate 7&nbsp;&nbsp;Temperature Annual Range</a><br /><a target='_blank' href='https://arcgis.com/home/item.html?id=b5990aa16fd94bb691a09449716ed7e5' rel='nofollow ugc noopener noreferrer'>Bioclimate 8&nbsp;&nbsp;Mean Temperature Of Wettest Quarter</a><br /><a target='_blank' href='https://arcgis.com/home/item.html?id=231770161a46467e8de9fdd9fd92dad7' rel='nofollow ugc noopener noreferrer'>Bioclimate 9&nbsp;&nbsp;Mean Temperature Of Driest Quarter</a><br /><a target='_blank' href='https://arcgis.com/home/item.html?id=3b98ddf1c78d4f0c88bd297f85847c68' rel='nofollow ugc noopener noreferrer'>Bioclimate 10&nbsp;&nbsp;Mean Temperature Of Warmest Quarter</a><br /><a target='_blank' href='https://arcgis.com/home/item.html?id=1a96d928c93c4e8fbc6a2391afd1da2f' rel='nofollow ugc noopener noreferrer'>Bioclimate 11&nbsp;&nbsp;Mean Temperature Of Coldest Quarter</a><br /><a target='_blank' href='https://arcgis.com/home/item.html?id=7bc0b8c75b0244b7a8128ae1f398bfc0' rel='nofollow ugc noopener noreferrer'>Bioclimate 12&nbsp;&nbsp;Annual Precipitation</a><br /><a target='_blank' href='https://arcgis.com/home/item.html?id=36fde801c8124f93b46b727b9873c993' rel='nofollow ugc noopener noreferrer'>Bioclimate 13&nbsp;&nbsp;Precipitation Of Wettest Month</a><br /><a target='_blank' href='https://arcgis.com/home/item.html?id=e26b01e4fa0a4aec9c5db991467b31a7' rel='nofollow ugc noopener noreferrer'>Bioclimate 14&nbsp;&nbsp;Precipitation Of Driest Month</a><br /><a target='_blank' href='https://arcgis.com/home/item.html?id=33558b5fef8642338f33918d498f41cf' rel='nofollow ugc noopener noreferrer'>Bioclimate 15&nbsp;&nbsp;Precipitation Seasonality</a><br /><a target='_blank' href='https://arcgis.com/home/item.html?id=1324c4e0c86a40e9b7529e91c6bdf220' rel='nofollow ugc noopener noreferrer'>Bioclimate 16&nbsp;&nbsp;Precipitation Of Wettest Quarter</a><br /><a target='_blank' href='https://arcgis.com/home/item.html?id=86fe2a87fe9144f9a5c330a3b5890df0' rel='nofollow ugc noopener noreferrer'>Bioclimate 17&nbsp;&nbsp;Precipitation Of Driest Quarter</a><br /><a target='_blank' href='https://arcgis.com/home/item.html?id=eb8227050ac24b3bb4a47abb924fbc56' rel='nofollow ugc noopener noreferrer'>Bioclimate 18&nbsp;&nbsp;Precipitation Of Warmest Quarter</a><br /><a target='_blank' href='https://arcgis.com/home/item.html?id=ec067623611d40d086193b21a3a4fce1' rel='nofollow ugc noopener noreferrer'>Bioclimate 19&nbsp;&nbsp;Precipitation Of Coldest Quarter</a><br /><a target='_blank' href='https://arcgis.com/home/item.html?id=e56c9cb70aa949adb791c4311003d9ae' rel='nofollow ugc noopener noreferrer'>Bioclimate Baseline 1970-2000</a></p>",
			"keyword": [
				"esri_environment",
				"retiring-2026-12"
			],
			"issued": "2022-05-12T16:05:24.000Z",
			"modified": "2026-05-13T19:40:20.000Z",
			"publisher": {
				"name": "Esri"
			},
			"contactPoint": {
				"@type": "vcard:Contact",
				"fn": "esri_environment",
				"hasEmail": "{{orgContactEmail}}"
			},
			"accessLevel": "public",
			"spatial": "-180.0000,-90.0000,180.0000,90.0000",
			"license": "<p><img src='https://downloads.esri.com/blogs/arcgisonline/esrilogo_new.png' width='113' height='43' /> This work is licensed under the Esri Master License Agreement.&nbsp;</p><p><a target='_blank' href='https://goto.arcgis.com/termsofuse/viewsummary' rel='nofollow ugc noopener noreferrer'>View Summary</a> | <a target='_blank' href='https://goto.arcgis.com/termsofuse/viewtermsofuse' rel='nofollow ugc noopener noreferrer'>View Terms of Use</a></p>",
			"distribution": [
				{
					"@type": "dcat:Distribution",
					"title": "ArcGIS Hub Dataset",
					"format": "Web Page",
					"mediaType": "text/html",
					"accessURL": "https://www.pacificgeoportal.com/content/esri::bioclimate-projections-08-mean-temperature-of-wettest-quarter"
				},
				{
					"@type": "dcat:Distribution",
					"title": "ArcGIS GeoService",
					"format": "ArcGIS GeoServices REST API",
					"mediaType": "application/json",
					"accessURL": "https://tiledimageservices.arcgis.com/P3ePLMYs2RVChkJx/arcgis/rest/services/Bioclimate_Projections__Mean_Temperature_of_Wettest_Quarter/ImageServer"
				}
			],
			"theme": [
				"geospatial"
			]
		},
		{
			"@type": "dcat:Dataset",
			"identifier": "https://www.arcgis.com/home/item.html?id=808cfb3ab1614f8ab7e364de737e9e98",
			"landingPage": "https://www.pacificgeoportal.com/content/esri::bioclimate-projections-07-temperature-annual-range",
			"title": "Bioclimate Projections: (07) Temperature Annual Range",
			"description": "<p><span style='color:#dc143c;'><strong>Retirement Notice:</strong></span><strong>&nbsp; This </strong><a target='_blank' href='https://goto.arcgis.com/termsofuse/beta' rel='nofollow ugc noopener noreferrer'><strong>beta</strong></a><strong> item will be retired in December 2026. A</strong><a target='_blank' href='https://www.arcgis.com/home/item.html?id=b8e22bcf82bd403f81b36dda7b14e38b' rel='nofollow ugc noopener noreferrer'><strong> new version of this item</strong></a><strong>&nbsp;is available for your use. </strong>Esri recommends updating your maps and apps to use the new version.</p><p>This layer represents CMIP6 future projections of temperature variation over an entire year. This layer can be used to compare with recent climate histories to better understand the potential impacts of future climate change.</p><p><a target='_blank' href='https://worldclim.org/' rel='nofollow ugc noopener noreferrer'><span style='background-attachment:initial; background-clip:initial; background-image:initial; background-origin:initial; background-position:initial; background-repeat:initial; background-size:initial;'>WorldClim</span></a><span style='background-attachment:initial; background-clip:initial; background-image:initial; background-origin:initial; background-position:initial; background-repeat:initial; background-size:initial;'>&nbsp;produced this projection as part of a series of&nbsp;</span><a target='_blank' href='https://pubs.usgs.gov/ds/691/ds691.pdf' rel='nofollow ugc noopener noreferrer'><span style='background-attachment:initial; background-clip:initial; background-image:initial; background-origin:initial; background-position:initial; background-repeat:initial; background-size:initial;'>19 bioclimate variables identified by the USGS</span></a><span style='background-attachment:initial; background-clip:initial; background-image:initial; background-origin:initial; background-position:initial; background-repeat:initial; background-size:initial;'>&nbsp;and provides this description:</span><br /><br /><i>\"Bioclimatic variables are derived from the monthly temperature and rainfall values in order to generate more biologically meaningful variables. These are often used in species distribution modeling and related ecological modeling techniques. The bioclimatic variables represent annual trends (e.g., mean annual temperature, annual precipitation) seasonality (e.g., annual range in temperature and precipitation) and extreme or limiting environmental factors (e.g., temperature of the coldest and warmest month, and precipitation of the wet and dry quarters). A quarter is a period of three months (1/4 of the year).\"</i></p><p style='background-attachment:initial; background-clip:initial; background-image:initial; background-origin:initial; background-position:initial; background-repeat:initial; background-size:initial; margin-bottom:0in;'><strong>Time Extent:</strong>&nbsp;averages from 2021-2040, 2041-2060, 2061-2080, 2081-2100<br /><strong>Units:</strong>&nbsp;deg C<br /><strong>Cell Size:</strong> 2.5 minutes (~5 km)<br /><strong>Source Type:</strong> Stretched<br /><strong>Pixel Type:</strong> 32 Bit Float<br /><strong>Data Projection:</strong> GCS WGS84<br /><strong>Mosaic Projection:</strong> GCS WGS84<br /><strong>Extent:</strong> Global<br /><strong>Source:</strong> <a target='_blank' href='https://worldclim.org/data/cmip6/cmip6_clim2.5m.html' rel='nofollow ugc noopener noreferrer'>WorldClim CMIP6 Bioclimate</a><br />&nbsp;</p><p><strong>Climate Scenarios</strong></p><p>The CMIP6 climate experiments use&nbsp;<a target='_blank' href='https://www.carbonbrief.org/explainer-how-shared-socioeconomic-pathways-explore-future-climate-change/' rel='nofollow ugc noopener noreferrer'>Shared Socioeconomic Pathways (SSPs)</a>&nbsp;to model future climate scenarios. Each SSP pairs a human/community behavior component with the traditional RCP greenhouse gas forcing from the previous CMIP5. Three SSPs were chosen by Esri to be included in the service based on user requests: SSP2 4.5, SSP3 7.0 and SSP5 8.5.</p><figure><table style='background-color:rgb(248, 249, 250); border-collapse:collapse;' width='850' cellpadding='0' cellspacing='0' border='1'><tbody><tr><td style='background-color:rgb(234, 236, 240); border:1pt solid rgb(162, 169, 177); padding:2.4pt 4.8pt;'><p style='margin:12pt 0in; text-align:center;'><span style='color:rgb(32,33,34); font-family:Arial, sans-serif; font-size:10.5pt;'><strong>SSP</strong></span></p></td><td style='background-color:rgb(234, 236, 240); border-bottom:1pt solid rgb(162, 169, 177); border-image:initial; border-left-style:none; border-right:1pt solid rgb(162, 169, 177); border-top:1pt solid rgb(162, 169, 177); padding:2.4pt 4.8pt;'><p style='margin:12pt 0in; text-align:center;'><span style='color:rgb(32,33,34); font-family:Arial, sans-serif; font-size:10.5pt;'><strong>Scenario</strong></span></p></td><td style='background-color:rgb(234, 236, 240); border-bottom:1pt solid rgb(162, 169, 177); border-image:initial; border-left-style:none; border-right:1pt solid rgb(162, 169, 177); border-top:1pt solid rgb(162, 169, 177); padding:2.4pt 4.8pt;'><p style='margin:12pt 0in; text-align:center;'><span style='color:rgb(32,33,34); font-family:Arial, sans-serif; font-size:10.5pt;'><strong>Estimated warming</strong></span><br /><span style='color:rgb(32,33,34); font-family:Arial, sans-serif; font-size:10.5pt;'><strong>(2041–2060)</strong></span></p></td><td style='background-color:rgb(234, 236, 240); border-bottom:1pt solid rgb(162, 169, 177); border-image:initial; border-left-style:none; border-right:1pt solid rgb(162, 169, 177); border-top:1pt solid rgb(162, 169, 177); padding:2.4pt 4.8pt;'><p style='margin:12pt 0in; text-align:center;'><span style='color:rgb(32,33,34); font-family:Arial, sans-serif; font-size:10.5pt;'><strong>Estimated warming</strong></span><br /><span style='color:rgb(32,33,34); font-family:Arial, sans-serif; font-size:10.5pt;'><strong>(2081–2100)</strong></span></p></td><td style='background-color:rgb(234, 236, 240); border-bottom:1pt solid rgb(162, 169, 177); border-image:initial; border-left-style:none; border-right:1pt solid rgb(162, 169, 177); border-top:1pt solid rgb(162, 169, 177); padding:2.4pt 4.8pt;'><p style='margin:12pt 0in; text-align:center;'><span style='color:rgb(32,33,34); font-family:Arial, sans-serif; font-size:10.5pt;'><strong>Very likely range in °C</strong></span><br /><span style='color:rgb(32,33,34); font-family:Arial, sans-serif; font-size:10.5pt;'><strong>(2081–2100)</strong></span></p></td></tr><tr><td style='border-bottom:1pt solid rgb(162, 169, 177); border-image:initial; border-left:1pt solid rgb(162, 169, 177); border-right:1pt solid rgb(162, 169, 177); border-top-style:none; padding:2.4pt 4.8pt;'><p style='margin:12pt 0in; text-align:center;'><span style='color:rgb(32,33,34); font-family:Arial, sans-serif; font-size:10.5pt;'>SSP2-4.5</span></p></td><td style='border-bottom:1pt solid rgb(162, 169, 177); border-left-style:none; border-right:1pt solid rgb(162, 169, 177); border-top-style:none; padding:2.4pt 4.8pt;'><p style='margin:12pt 0in; text-align:center;'><span style='color:rgb(32,33,34); font-family:Arial, sans-serif; font-size:10.5pt;'>intermediate GHG emissions:</span><br /><span style='color:rgb(32,33,34); font-family:Arial, sans-serif; font-size:10.5pt;'>CO</span><span style='color:rgb(32,33,34); font-family:Arial, sans-serif; font-size:8.5pt;'><sub>2</sub></span><span style='color:rgb(32,33,34); font-family:Arial, sans-serif; font-size:10.5pt;'>&nbsp;emissions around current levels until 2050, then falling but not reaching net zero by 2100</span></p></td><td style='border-bottom:1pt solid rgb(162, 169, 177); border-left-style:none; border-right:1pt solid rgb(162, 169, 177); border-top-style:none; padding:2.4pt 4.8pt;'><p style='margin:12pt 0in; text-align:center;'><span style='color:rgb(32,33,34); font-family:Arial, sans-serif; font-size:10.5pt;'>2.0 °C</span></p></td><td style='border-bottom:1pt solid rgb(162, 169, 177); border-left-style:none; border-right:1pt solid rgb(162, 169, 177); border-top-style:none; padding:2.4pt 4.8pt;'><p style='margin:12pt 0in; text-align:center;'><span style='color:rgb(32,33,34); font-family:Arial, sans-serif; font-size:10.5pt;'>2.7 °C</span></p></td><td style='border-bottom:1pt solid rgb(162, 169, 177); border-left-style:none; border-right:1pt solid rgb(162, 169, 177); border-top-style:none; padding:2.4pt 4.8pt;'><p style='margin:12pt 0in; text-align:center;'><span style='color:rgb(32,33,34); font-family:Arial, sans-serif; font-size:10.5pt;'>2.1 – 3.5</span></p></td></tr><tr><td style='border-bottom:1pt solid rgb(162, 169, 177); border-image:initial; border-left:1pt solid rgb(162, 169, 177); border-right:1pt solid rgb(162, 169, 177); border-top-style:none; padding:2.4pt 4.8pt;'><p style='margin:12pt 0in; text-align:center;'><span style='color:rgb(32,33,34); font-family:Arial, sans-serif; font-size:10.5pt;'>SSP3-7.0</span></p></td><td style='border-bottom:1pt solid rgb(162, 169, 177); border-left-style:none; border-right:1pt solid rgb(162, 169, 177); border-top-style:none; padding:2.4pt 4.8pt;'><p style='margin:12pt 0in; text-align:center;'><span style='color:rgb(32,33,34); font-family:Arial, sans-serif; font-size:10.5pt;'>high GHG emissions:</span><br /><span style='color:rgb(32,33,34); font-family:Arial, sans-serif; font-size:10.5pt;'>CO</span><span style='color:rgb(32,33,34); font-family:Arial, sans-serif; font-size:8.5pt;'><sub>2</sub></span><span style='color:rgb(32,33,34); font-family:Arial, sans-serif; font-size:10.5pt;'>&nbsp;emissions double by 2100</span></p></td><td style='border-bottom:1pt solid rgb(162, 169, 177); border-left-style:none; border-right:1pt solid rgb(162, 169, 177); border-top-style:none; padding:2.4pt 4.8pt;'><p style='margin:12pt 0in; text-align:center;'><span style='color:rgb(32,33,34); font-family:Arial, sans-serif; font-size:10.5pt;'>2.1 °C</span></p></td><td style='border-bottom:1pt solid rgb(162, 169, 177); border-left-style:none; border-right:1pt solid rgb(162, 169, 177); border-top-style:none; padding:2.4pt 4.8pt;'><p style='margin:12pt 0in; text-align:center;'><span style='color:rgb(32,33,34); font-family:Arial, sans-serif; font-size:10.5pt;'>3.6 °C</span></p></td><td style='border-bottom:1pt solid rgb(162, 169, 177); border-left-style:none; border-right:1pt solid rgb(162, 169, 177); border-top-style:none; padding:2.4pt 4.8pt;'><p style='margin:12pt 0in; text-align:center;'><span style='color:rgb(32,33,34); font-family:Arial, sans-serif; font-size:10.5pt;'>2.8 – 4.6</span></p></td></tr><tr><td style='border-bottom:1pt solid rgb(162, 169, 177); border-image:initial; border-left:1pt solid rgb(162, 169, 177); border-right:1pt solid rgb(162, 169, 177); border-top-style:none; padding:2.4pt 4.8pt;'><p style='margin:12pt 0in; text-align:center;'><span style='color:rgb(32,33,34); font-family:Arial, sans-serif; font-size:10.5pt;'>SSP5-8.5</span></p></td><td style='border-bottom:1pt solid rgb(162, 169, 177); border-left-style:none; border-right:1pt solid rgb(162, 169, 177); border-top-style:none; padding:2.4pt 4.8pt;'><p style='margin:12pt 0in; text-align:center;'><span style='color:rgb(32,33,34); font-family:Arial, sans-serif; font-size:10.5pt;'>very high GHG emissions:</span><br /><span style='color:rgb(32,33,34); font-family:Arial, sans-serif; font-size:10.5pt;'>CO</span><span style='color:rgb(32,33,34); font-family:Arial, sans-serif; font-size:8.5pt;'><sub>2</sub></span><span style='color:rgb(32,33,34); font-family:Arial, sans-serif; font-size:10.5pt;'>&nbsp;emissions triple by 2075</span></p></td><td style='border-bottom:1pt solid rgb(162, 169, 177); border-left-style:none; border-right:1pt solid rgb(162, 169, 177); border-top-style:none; padding:2.4pt 4.8pt;'><p style='margin:12pt 0in; text-align:center;'><span style='color:rgb(32,33,34); font-family:Arial, sans-serif; font-size:10.5pt;'>2.4 °C</span></p></td><td style='border-bottom:1pt solid rgb(162, 169, 177); border-left-style:none; border-right:1pt solid rgb(162, 169, 177); border-top-style:none; padding:2.4pt 4.8pt;'><p style='margin:12pt 0in; text-align:center;'><span style='color:rgb(32,33,34); font-family:Arial, sans-serif; font-size:10.5pt;'>4.4 °C</span></p></td><td style='border-bottom:1pt solid rgb(162, 169, 177); border-left-style:none; border-right:1pt solid rgb(162, 169, 177); border-top-style:none; padding:2.4pt 4.8pt;'><p style='margin:12pt 0in; text-align:center;'><span style='color:rgb(32,33,34); font-family:Arial, sans-serif; font-size:10.5pt;'>3.3 – 5.7</span></p></td></tr></tbody></table></figure><p>While the 8.5 scenario is no longer generally considered likely, SSP3 7.0 has been included and is considered the high end of possibilities. SSP5 8.5 has been retained since many organizations report to this threshold. The warming associated with SSP2 4.5 is equivalent to the global targets set at the 2021 United Nations COP26 meetings in Glasgow.&nbsp;</p><p><strong>Processing the Climate Data</strong></p><p>WorldClim provides 20-year averaged outputs for the various SSPs from 24 global climate models. A selection of 13 models were averaged for each variable and time based on&nbsp;<a target='_blank' href='https://rmets.onlinelibrary.wiley.com/doi/full/10.1002/joc.7566' rel='nofollow ugc noopener noreferrer'>Mahony et al 2022</a>. These models included ACCESS-ESM1-5, BCC-CSM2-MR, CanESM5, CNRM-ESM2-1, EC-Earth3-Veg, GFDL-ESM4, GISS-E2-1-G, INM-CM5-0,&nbsp;&nbsp;IPSL-CM6A-LR, MIROC6, MPI-ESM1-2-HR, MRI-ESM2-0, UKESM1-0-LL. GFDL-ESM4 was not available for SSP2 4.5 or SSP5 8.5.&nbsp;</p><p><strong>Accessing the Multidimensional Information</strong></p><p>The time and SSP scenario are built into the layer using a multidimensional raster. Enable the time slider to move across the 20-year average periods. In ArcGIS Online and Pro, use the Multidimensional Filter to select the SSP (SSP2 4.5 is the default).&nbsp;<br /><br /><strong>What can you do with this layer?</strong></p><p>These multidimensional imagery tiles support analysis using ArcGIS Online or Pro. Use the&nbsp;<a target='_blank' href='https://arcgis.com/home/item.html?id=e56c9cb70aa949adb791c4311003d9ae' rel='nofollow ugc noopener noreferrer'>Bioclimate Baseline layer</a>&nbsp;to see the difference in pixels and calculate change from the historic period into the future. Use the&nbsp;<a target='_blank' href='https://pro.arcgis.com/en/pro-app/latest/help/data/imagery/an-overview-of-multidimensional-raster-data.htm' rel='nofollow ugc noopener noreferrer'>Multidimensional&nbsp;</a>tab in ArcGIS Pro to access a variety of useful tools. Each layer or variable can be styled using the Image Display options.&nbsp;</p><p><strong>Known Quality Issues</strong></p><p>Each model is downscaled from ~100km resolution to ~5km resolution by WorldClim. Some artifacts are inevitable, especially at a global scale. Some variables have distinct transitions, especially in Greenland. Also, SSP2 4.5 has missing data for several variables in Antarctica.</p><p><strong>Related Layers</strong></p><p><a target='_blank' href='https://arcgis.com/home/item.html?id=fdaa1b7912e440efb9e29cf5d6156bb0' rel='nofollow ugc noopener noreferrer'>Bioclimate 1&nbsp;&nbsp;Annual Mean Temperature</a><br /><a target='_blank' href='https://arcgis.com/home/item.html?id=8012b34e8c854d6fbcfe4eab437ea397' rel='nofollow ugc noopener noreferrer'>Bioclimate 2&nbsp;&nbsp;Mean Diurnal Range</a><br /><a target='_blank' href='https://arcgis.com/home/item.html?id=ef9f5d6a16ca41ada0c0075a8da46d48' rel='nofollow ugc noopener noreferrer'>Bioclimate 3&nbsp;&nbsp;Isothermality</a><br /><a target='_blank' href='https://arcgis.com/home/item.html?id=64799fea8774463aad909020b6590dc8' rel='nofollow ugc noopener noreferrer'>Bioclimate 4&nbsp;&nbsp;Temperature Seasonality</a><br /><a target='_blank' href='https://arcgis.com/home/item.html?id=8433250e0a4148f5a3889c66e78abdf1' rel='nofollow ugc noopener noreferrer'>Bioclimate 5&nbsp;&nbsp;Max Temperature of Warmest Month</a><br /><a target='_blank' href='https://arcgis.com/home/item.html?id=c531d32ab5d746b88a884b6e54f3216e' rel='nofollow ugc noopener noreferrer'>Bioclimate 6&nbsp;&nbsp;Min Temperature Of Coldest Month</a><br /><a target='_blank' href='https://arcgis.com/home/item.html?id=808cfb3ab1614f8ab7e364de737e9e98' rel='nofollow ugc noopener noreferrer'>Bioclimate 7&nbsp;&nbsp;Temperature Annual Range</a><br /><a target='_blank' href='https://arcgis.com/home/item.html?id=b5990aa16fd94bb691a09449716ed7e5' rel='nofollow ugc noopener noreferrer'>Bioclimate 8&nbsp;&nbsp;Mean Temperature Of Wettest Quarter</a><br /><a target='_blank' href='https://arcgis.com/home/item.html?id=231770161a46467e8de9fdd9fd92dad7' rel='nofollow ugc noopener noreferrer'>Bioclimate 9&nbsp;&nbsp;Mean Temperature Of Driest Quarter</a><br /><a target='_blank' href='https://arcgis.com/home/item.html?id=3b98ddf1c78d4f0c88bd297f85847c68' rel='nofollow ugc noopener noreferrer'>Bioclimate 10&nbsp;&nbsp;Mean Temperature Of Warmest Quarter</a><br /><a target='_blank' href='https://arcgis.com/home/item.html?id=1a96d928c93c4e8fbc6a2391afd1da2f' rel='nofollow ugc noopener noreferrer'>Bioclimate 11&nbsp;&nbsp;Mean Temperature Of Coldest Quarter</a><br /><a target='_blank' href='https://arcgis.com/home/item.html?id=7bc0b8c75b0244b7a8128ae1f398bfc0' rel='nofollow ugc noopener noreferrer'>Bioclimate 12&nbsp;&nbsp;Annual Precipitation</a><br /><a target='_blank' href='https://arcgis.com/home/item.html?id=36fde801c8124f93b46b727b9873c993' rel='nofollow ugc noopener noreferrer'>Bioclimate 13&nbsp;&nbsp;Precipitation Of Wettest Month</a><br /><a target='_blank' href='https://arcgis.com/home/item.html?id=e26b01e4fa0a4aec9c5db991467b31a7' rel='nofollow ugc noopener noreferrer'>Bioclimate 14&nbsp;&nbsp;Precipitation Of Driest Month</a><br /><a target='_blank' href='https://arcgis.com/home/item.html?id=33558b5fef8642338f33918d498f41cf' rel='nofollow ugc noopener noreferrer'>Bioclimate 15&nbsp;&nbsp;Precipitation Seasonality</a><br /><a target='_blank' href='https://arcgis.com/home/item.html?id=1324c4e0c86a40e9b7529e91c6bdf220' rel='nofollow ugc noopener noreferrer'>Bioclimate 16&nbsp;&nbsp;Precipitation Of Wettest Quarter</a><br /><a target='_blank' href='https://arcgis.com/home/item.html?id=86fe2a87fe9144f9a5c330a3b5890df0' rel='nofollow ugc noopener noreferrer'>Bioclimate 17&nbsp;&nbsp;Precipitation Of Driest Quarter</a><br /><a target='_blank' href='https://arcgis.com/home/item.html?id=eb8227050ac24b3bb4a47abb924fbc56' rel='nofollow ugc noopener noreferrer'>Bioclimate 18&nbsp;&nbsp;Precipitation Of Warmest Quarter</a><br /><a target='_blank' href='https://arcgis.com/home/item.html?id=ec067623611d40d086193b21a3a4fce1' rel='nofollow ugc noopener noreferrer'>Bioclimate 19&nbsp;&nbsp;Precipitation Of Coldest Quarter</a><br /><a target='_blank' href='https://arcgis.com/home/item.html?id=e56c9cb70aa949adb791c4311003d9ae' rel='nofollow ugc noopener noreferrer'>Bioclimate Baseline 1970-2000</a></p>",
			"keyword": [
				"esri_environment",
				"retiring-2026-12"
			],
			"issued": "2022-05-12T16:08:41.000Z",
			"modified": "2026-05-13T19:40:04.000Z",
			"publisher": {
				"name": "Esri"
			},
			"contactPoint": {
				"@type": "vcard:Contact",
				"fn": "esri_environment",
				"hasEmail": "{{orgContactEmail}}"
			},
			"accessLevel": "public",
			"spatial": "-180.0000,-90.0000,180.0000,90.0000",
			"license": "<p><img src='https://downloads.esri.com/blogs/arcgisonline/esrilogo_new.png' width='113' height='43' /> This work is licensed under the Esri Master License Agreement.&nbsp;</p><p><a target='_blank' href='https://goto.arcgis.com/termsofuse/viewsummary' rel='nofollow ugc noopener noreferrer'>View Summary</a> | <a target='_blank' href='https://goto.arcgis.com/termsofuse/viewtermsofuse' rel='nofollow ugc noopener noreferrer'>View Terms of Use</a></p>",
			"distribution": [
				{
					"@type": "dcat:Distribution",
					"title": "ArcGIS Hub Dataset",
					"format": "Web Page",
					"mediaType": "text/html",
					"accessURL": "https://www.pacificgeoportal.com/content/esri::bioclimate-projections-07-temperature-annual-range"
				},
				{
					"@type": "dcat:Distribution",
					"title": "ArcGIS GeoService",
					"format": "ArcGIS GeoServices REST API",
					"mediaType": "application/json",
					"accessURL": "https://tiledimageservices.arcgis.com/P3ePLMYs2RVChkJx/arcgis/rest/services/Bioclimate_Projections__Temperature_Annual_Range/ImageServer"
				}
			],
			"theme": [
				"geospatial"
			]
		},
		{
			"@type": "dcat:Dataset",
			"identifier": "https://www.arcgis.com/home/item.html?id=c531d32ab5d746b88a884b6e54f3216e",
			"landingPage": "https://www.pacificgeoportal.com/content/esri::bioclimate-projections-06-min-temperature-of-coldest-month",
			"title": "Bioclimate Projections: (06) Min Temperature of Coldest Month",
			"description": "<p><span style='color:#dc143c;'><strong>Retirement Notice:</strong></span><strong>&nbsp;This </strong><a target='_blank' href='https://goto.arcgis.com/termsofuse/beta' rel='nofollow ugc noopener noreferrer'><strong>beta</strong></a><strong> item will be retired in December 2026. A</strong><a target='_blank' href='https://www.arcgis.com/home/item.html?id=9d1c8cd826f24d428888db97d13248b4' rel='nofollow ugc noopener noreferrer'><strong> new version of this item</strong></a><strong>&nbsp;is available for your use. </strong>Esri recommends updating your maps and apps to use the new version.</p><div><p><span style='background-attachment:initial; background-clip:initial; background-image:initial; background-origin:initial; background-position:initial; background-repeat:initial; background-size:initial;'>This layer represents CMIP6 future projections of minimum temperature during the coldest month of the year. This layer can be used to compare with recent climate histories to better understand the potential impacts of future climate change.</span></p><p><a target='_blank' href='https://worldclim.org/' rel='nofollow ugc noopener noreferrer'><span style='background-attachment:initial; background-clip:initial; background-image:initial; background-origin:initial; background-position:initial; background-repeat:initial; background-size:initial;'>WorldClim</span></a><span style='background-attachment:initial; background-clip:initial; background-image:initial; background-origin:initial; background-position:initial; background-repeat:initial; background-size:initial;'>&nbsp;produced this projection as part of a series of&nbsp;</span><a target='_blank' href='https://pubs.usgs.gov/ds/691/ds691.pdf' rel='nofollow ugc noopener noreferrer'><span style='background-attachment:initial; background-clip:initial; background-image:initial; background-origin:initial; background-position:initial; background-repeat:initial; background-size:initial;'>19 bioclimate variables identified by the USGS</span></a><span style='background-attachment:initial; background-clip:initial; background-image:initial; background-origin:initial; background-position:initial; background-repeat:initial; background-size:initial;'>&nbsp;and provides this description:</span><br /><br /><i>\"Bioclimatic variables are derived from the monthly temperature and rainfall values in order to generate more biologically meaningful variables. These are often used in species distribution modeling and related ecological modeling techniques. The bioclimatic variables represent annual trends (e.g., mean annual temperature, annual precipitation) seasonality (e.g., annual range in temperature and precipitation) and extreme or limiting environmental factors (e.g., temperature of the coldest and warmest month, and precipitation of the wet and dry quarters). A quarter is a period of three months (1/4 of the year).\"</i></p><p style='background-attachment:initial; background-clip:initial; background-image:initial; background-origin:initial; background-position:initial; background-repeat:initial; background-size:initial; margin-bottom:0in;'><strong>Time Extent:</strong>&nbsp;averages from 2021-2040, 2041-2060, 2061-2080, 2081-2100<br /><strong>Units:</strong>&nbsp;deg C<br /><strong>Cell Size:</strong> 2.5 minutes (~5 km)<br /><strong>Source Type:</strong> Stretched<br /><strong>Pixel Type:</strong> 32 Bit Float<br /><strong>Data Projection:</strong> GCS WGS84<br /><strong>Mosaic Projection:</strong> GCS WGS84<br /><strong>Extent:</strong> Global<br /><strong>Source:</strong> <a target='_blank' href='https://worldclim.org/data/cmip6/cmip6_clim2.5m.html' rel='nofollow ugc noopener noreferrer'>WorldClim CMIP6 Bioclimate</a><br />&nbsp;</p><p><strong>Climate Scenarios</strong></p><p>The CMIP6 climate experiments use&nbsp;<a target='_blank' href='https://www.carbonbrief.org/explainer-how-shared-socioeconomic-pathways-explore-future-climate-change/' rel='nofollow ugc noopener noreferrer'>Shared Socioeconomic Pathways (SSPs)</a>&nbsp;to model future climate scenarios. Each SSP pairs a human/community behavior component with the traditional RCP greenhouse gas forcing from the previous CMIP5. Three SSPs were chosen by Esri to be included in the service based on user requests: SSP2 4.5, SSP3 7.0 and SSP5 8.5.</p><figure><table style='background-color:rgb(248, 249, 250); border-collapse:collapse;' width='850' cellpadding='0' cellspacing='0' border='1'><tbody><tr><td style='background-color:rgb(234, 236, 240); border:1pt solid rgb(162, 169, 177); padding:2.4pt 4.8pt;'><p style='margin:12pt 0in; text-align:center;'><span style='color:rgb(32,33,34); font-family:Arial, sans-serif; font-size:10.5pt;'><strong>SSP</strong></span></p></td><td style='background-color:rgb(234, 236, 240); border-bottom:1pt solid rgb(162, 169, 177); border-image:initial; border-left-style:none; border-right:1pt solid rgb(162, 169, 177); border-top:1pt solid rgb(162, 169, 177); padding:2.4pt 4.8pt;'><p style='margin:12pt 0in; text-align:center;'><span style='color:rgb(32,33,34); font-family:Arial, sans-serif; font-size:10.5pt;'><strong>Scenario</strong></span></p></td><td style='background-color:rgb(234, 236, 240); border-bottom:1pt solid rgb(162, 169, 177); border-image:initial; border-left-style:none; border-right:1pt solid rgb(162, 169, 177); border-top:1pt solid rgb(162, 169, 177); padding:2.4pt 4.8pt;'><p style='margin:12pt 0in; text-align:center;'><span style='color:rgb(32,33,34); font-family:Arial, sans-serif; font-size:10.5pt;'><strong>Estimated warming</strong></span><br /><span style='color:rgb(32,33,34); font-family:Arial, sans-serif; font-size:10.5pt;'><strong>(2041–2060)</strong></span></p></td><td style='background-color:rgb(234, 236, 240); border-bottom:1pt solid rgb(162, 169, 177); border-image:initial; border-left-style:none; border-right:1pt solid rgb(162, 169, 177); border-top:1pt solid rgb(162, 169, 177); padding:2.4pt 4.8pt;'><p style='margin:12pt 0in; text-align:center;'><span style='color:rgb(32,33,34); font-family:Arial, sans-serif; font-size:10.5pt;'><strong>Estimated warming</strong></span><br /><span style='color:rgb(32,33,34); font-family:Arial, sans-serif; font-size:10.5pt;'><strong>(2081–2100)</strong></span></p></td><td style='background-color:rgb(234, 236, 240); border-bottom:1pt solid rgb(162, 169, 177); border-image:initial; border-left-style:none; border-right:1pt solid rgb(162, 169, 177); border-top:1pt solid rgb(162, 169, 177); padding:2.4pt 4.8pt;'><p style='margin:12pt 0in; text-align:center;'><span style='color:rgb(32,33,34); font-family:Arial, sans-serif; font-size:10.5pt;'><strong>Very likely range in °C</strong></span><br /><span style='color:rgb(32,33,34); font-family:Arial, sans-serif; font-size:10.5pt;'><strong>(2081–2100)</strong></span></p></td></tr><tr><td style='border-bottom:1pt solid rgb(162, 169, 177); border-image:initial; border-left:1pt solid rgb(162, 169, 177); border-right:1pt solid rgb(162, 169, 177); border-top-style:none; padding:2.4pt 4.8pt;'><p style='margin:12pt 0in; text-align:center;'><span style='color:rgb(32,33,34); font-family:Arial, sans-serif; font-size:10.5pt;'>SSP2-4.5</span></p></td><td style='border-bottom:1pt solid rgb(162, 169, 177); border-left-style:none; border-right:1pt solid rgb(162, 169, 177); border-top-style:none; padding:2.4pt 4.8pt;'><p style='margin:12pt 0in; text-align:center;'><span style='color:rgb(32,33,34); font-family:Arial, sans-serif; font-size:10.5pt;'>intermediate GHG emissions:</span><br /><span style='color:rgb(32,33,34); font-family:Arial, sans-serif; font-size:10.5pt;'>CO</span><span style='color:rgb(32,33,34); font-family:Arial, sans-serif; font-size:8.5pt;'><sub>2</sub></span><span style='color:rgb(32,33,34); font-family:Arial, sans-serif; font-size:10.5pt;'>&nbsp;emissions around current levels until 2050, then falling but not reaching net zero by 2100</span></p></td><td style='border-bottom:1pt solid rgb(162, 169, 177); border-left-style:none; border-right:1pt solid rgb(162, 169, 177); border-top-style:none; padding:2.4pt 4.8pt;'><p style='margin:12pt 0in; text-align:center;'><span style='color:rgb(32,33,34); font-family:Arial, sans-serif; font-size:10.5pt;'>2.0 °C</span></p></td><td style='border-bottom:1pt solid rgb(162, 169, 177); border-left-style:none; border-right:1pt solid rgb(162, 169, 177); border-top-style:none; padding:2.4pt 4.8pt;'><p style='margin:12pt 0in; text-align:center;'><span style='color:rgb(32,33,34); font-family:Arial, sans-serif; font-size:10.5pt;'>2.7 °C</span></p></td><td style='border-bottom:1pt solid rgb(162, 169, 177); border-left-style:none; border-right:1pt solid rgb(162, 169, 177); border-top-style:none; padding:2.4pt 4.8pt;'><p style='margin:12pt 0in; text-align:center;'><span style='color:rgb(32,33,34); font-family:Arial, sans-serif; font-size:10.5pt;'>2.1 – 3.5</span></p></td></tr><tr><td style='border-bottom:1pt solid rgb(162, 169, 177); border-image:initial; border-left:1pt solid rgb(162, 169, 177); border-right:1pt solid rgb(162, 169, 177); border-top-style:none; padding:2.4pt 4.8pt;'><p style='margin:12pt 0in; text-align:center;'><span style='color:rgb(32,33,34); font-family:Arial, sans-serif; font-size:10.5pt;'>SSP3-7.0</span></p></td><td style='border-bottom:1pt solid rgb(162, 169, 177); border-left-style:none; border-right:1pt solid rgb(162, 169, 177); border-top-style:none; padding:2.4pt 4.8pt;'><p style='margin:12pt 0in; text-align:center;'><span style='color:rgb(32,33,34); font-family:Arial, sans-serif; font-size:10.5pt;'>high GHG emissions:</span><br /><span style='color:rgb(32,33,34); font-family:Arial, sans-serif; font-size:10.5pt;'>CO</span><span style='color:rgb(32,33,34); font-family:Arial, sans-serif; font-size:8.5pt;'><sub>2</sub></span><span style='color:rgb(32,33,34); font-family:Arial, sans-serif; font-size:10.5pt;'>&nbsp;emissions double by 2100</span></p></td><td style='border-bottom:1pt solid rgb(162, 169, 177); border-left-style:none; border-right:1pt solid rgb(162, 169, 177); border-top-style:none; padding:2.4pt 4.8pt;'><p style='margin:12pt 0in; text-align:center;'><span style='color:rgb(32,33,34); font-family:Arial, sans-serif; font-size:10.5pt;'>2.1 °C</span></p></td><td style='border-bottom:1pt solid rgb(162, 169, 177); border-left-style:none; border-right:1pt solid rgb(162, 169, 177); border-top-style:none; padding:2.4pt 4.8pt;'><p style='margin:12pt 0in; text-align:center;'><span style='color:rgb(32,33,34); font-family:Arial, sans-serif; font-size:10.5pt;'>3.6 °C</span></p></td><td style='border-bottom:1pt solid rgb(162, 169, 177); border-left-style:none; border-right:1pt solid rgb(162, 169, 177); border-top-style:none; padding:2.4pt 4.8pt;'><p style='margin:12pt 0in; text-align:center;'><span style='color:rgb(32,33,34); font-family:Arial, sans-serif; font-size:10.5pt;'>2.8 – 4.6</span></p></td></tr><tr><td style='border-bottom:1pt solid rgb(162, 169, 177); border-image:initial; border-left:1pt solid rgb(162, 169, 177); border-right:1pt solid rgb(162, 169, 177); border-top-style:none; padding:2.4pt 4.8pt;'><p style='margin:12pt 0in; text-align:center;'><span style='color:rgb(32,33,34); font-family:Arial, sans-serif; font-size:10.5pt;'>SSP5-8.5</span></p></td><td style='border-bottom:1pt solid rgb(162, 169, 177); border-left-style:none; border-right:1pt solid rgb(162, 169, 177); border-top-style:none; padding:2.4pt 4.8pt;'><p style='margin:12pt 0in; text-align:center;'><span style='color:rgb(32,33,34); font-family:Arial, sans-serif; font-size:10.5pt;'>very high GHG emissions:</span><br /><span style='color:rgb(32,33,34); font-family:Arial, sans-serif; font-size:10.5pt;'>CO</span><span style='color:rgb(32,33,34); font-family:Arial, sans-serif; font-size:8.5pt;'><sub>2</sub></span><span style='color:rgb(32,33,34); font-family:Arial, sans-serif; font-size:10.5pt;'>&nbsp;emissions triple by 2075</span></p></td><td style='border-bottom:1pt solid rgb(162, 169, 177); border-left-style:none; border-right:1pt solid rgb(162, 169, 177); border-top-style:none; padding:2.4pt 4.8pt;'><p style='margin:12pt 0in; text-align:center;'><span style='color:rgb(32,33,34); font-family:Arial, sans-serif; font-size:10.5pt;'>2.4 °C</span></p></td><td style='border-bottom:1pt solid rgb(162, 169, 177); border-left-style:none; border-right:1pt solid rgb(162, 169, 177); border-top-style:none; padding:2.4pt 4.8pt;'><p style='margin:12pt 0in; text-align:center;'><span style='color:rgb(32,33,34); font-family:Arial, sans-serif; font-size:10.5pt;'>4.4 °C</span></p></td><td style='border-bottom:1pt solid rgb(162, 169, 177); border-left-style:none; border-right:1pt solid rgb(162, 169, 177); border-top-style:none; padding:2.4pt 4.8pt;'><p style='margin:12pt 0in; text-align:center;'><span style='color:rgb(32,33,34); font-family:Arial, sans-serif; font-size:10.5pt;'>3.3 – 5.7</span></p></td></tr></tbody></table></figure><p>While the 8.5 scenario is no longer generally considered likely, SSP3 7.0 has been included and is considered the high end of possibilities. SSP5 8.5 has been retained since many organizations report to this threshold. The warming associated with SSP2 4.5 is equivalent to the global targets set at the 2021 United Nations COP26 meetings in Glasgow.&nbsp;</p><p><strong>Processing the Climate Data</strong></p><p>WorldClim provides 20-year averaged outputs for the various SSPs from 24 global climate models. A selection of 13 models were averaged for each variable and time based on&nbsp;<a target='_blank' href='https://rmets.onlinelibrary.wiley.com/doi/full/10.1002/joc.7566' rel='nofollow ugc noopener noreferrer'>Mahony et al 2022</a>. These models included ACCESS-ESM1-5, BCC-CSM2-MR, CanESM5, CNRM-ESM2-1, EC-Earth3-Veg, GFDL-ESM4, GISS-E2-1-G, INM-CM5-0,&nbsp;&nbsp;IPSL-CM6A-LR, MIROC6, MPI-ESM1-2-HR, MRI-ESM2-0, UKESM1-0-LL. GFDL-ESM4 was not available for SSP2 4.5 or SSP5 8.5.&nbsp;</p><p><strong>Accessing the Multidimensional Information</strong></p><p>The time and SSP scenario are built into the layer using a multidimensional raster. Enable the time slider to move across the 20-year average periods. In ArcGIS Online and Pro, use the Multidimensional Filter to select the SSP (SSP2 4.5 is the default).&nbsp;<br /><br /><strong>What can you do with this layer?</strong></p><p>These multidimensional imagery tiles support analysis using ArcGIS Online or Pro. Use the&nbsp;<a target='_blank' href='https://arcgis.com/home/item.html?id=e56c9cb70aa949adb791c4311003d9ae' rel='nofollow ugc noopener noreferrer'>Bioclimate Baseline layer</a>&nbsp;to see the difference in pixels and calculate change from the historic period into the future. Use the&nbsp;<a target='_blank' href='https://pro.arcgis.com/en/pro-app/latest/help/data/imagery/an-overview-of-multidimensional-raster-data.htm' rel='nofollow ugc noopener noreferrer'>Multidimensional&nbsp;</a>tab in ArcGIS Pro to access a variety of useful tools. Each layer or variable can be styled using the Image Display options.&nbsp;</p><p><strong>Known Quality Issues</strong></p><p>Each model is downscaled from ~100km resolution to ~5km resolution by WorldClim. Some artifacts are inevitable, especially at a global scale. Some variables have distinct transitions, especially in Greenland. Also, SSP2 4.5 has missing data for several variables in Antarctica.</p><p><strong>Related Layers</strong></p><p><a target='_blank' href='https://arcgis.com/home/item.html?id=fdaa1b7912e440efb9e29cf5d6156bb0' rel='nofollow ugc noopener noreferrer'>Bioclimate 1&nbsp;&nbsp;Annual Mean Temperature</a><br /><a target='_blank' href='https://arcgis.com/home/item.html?id=8012b34e8c854d6fbcfe4eab437ea397' rel='nofollow ugc noopener noreferrer'>Bioclimate 2&nbsp;&nbsp;Mean Diurnal Range</a><br /><a target='_blank' href='https://arcgis.com/home/item.html?id=ef9f5d6a16ca41ada0c0075a8da46d48' rel='nofollow ugc noopener noreferrer'>Bioclimate 3&nbsp;&nbsp;Isothermality</a><br /><a target='_blank' href='https://arcgis.com/home/item.html?id=64799fea8774463aad909020b6590dc8' rel='nofollow ugc noopener noreferrer'>Bioclimate 4&nbsp;&nbsp;Temperature Seasonality</a><br /><a target='_blank' href='https://arcgis.com/home/item.html?id=8433250e0a4148f5a3889c66e78abdf1' rel='nofollow ugc noopener noreferrer'>Bioclimate 5&nbsp;&nbsp;Max Temperature of Warmest Month</a><br /><a target='_blank' href='https://arcgis.com/home/item.html?id=c531d32ab5d746b88a884b6e54f3216e' rel='nofollow ugc noopener noreferrer'>Bioclimate 6&nbsp;&nbsp;Min Temperature Of Coldest Month</a><br /><a target='_blank' href='https://arcgis.com/home/item.html?id=808cfb3ab1614f8ab7e364de737e9e98' rel='nofollow ugc noopener noreferrer'>Bioclimate 7&nbsp;&nbsp;Temperature Annual Range</a><br /><a target='_blank' href='https://arcgis.com/home/item.html?id=b5990aa16fd94bb691a09449716ed7e5' rel='nofollow ugc noopener noreferrer'>Bioclimate 8&nbsp;&nbsp;Mean Temperature Of Wettest Quarter</a><br /><a target='_blank' href='https://arcgis.com/home/item.html?id=231770161a46467e8de9fdd9fd92dad7' rel='nofollow ugc noopener noreferrer'>Bioclimate 9&nbsp;&nbsp;Mean Temperature Of Driest Quarter</a><br /><a target='_blank' href='https://arcgis.com/home/item.html?id=3b98ddf1c78d4f0c88bd297f85847c68' rel='nofollow ugc noopener noreferrer'>Bioclimate 10&nbsp;&nbsp;Mean Temperature Of Warmest Quarter</a><br /><a target='_blank' href='https://arcgis.com/home/item.html?id=1a96d928c93c4e8fbc6a2391afd1da2f' rel='nofollow ugc noopener noreferrer'>Bioclimate 11&nbsp;&nbsp;Mean Temperature Of Coldest Quarter</a><br /><a target='_blank' href='https://arcgis.com/home/item.html?id=7bc0b8c75b0244b7a8128ae1f398bfc0' rel='nofollow ugc noopener noreferrer'>Bioclimate 12&nbsp;&nbsp;Annual Precipitation</a><br /><a target='_blank' href='https://arcgis.com/home/item.html?id=36fde801c8124f93b46b727b9873c993' rel='nofollow ugc noopener noreferrer'>Bioclimate 13&nbsp;&nbsp;Precipitation Of Wettest Month</a><br /><a target='_blank' href='https://arcgis.com/home/item.html?id=e26b01e4fa0a4aec9c5db991467b31a7' rel='nofollow ugc noopener noreferrer'>Bioclimate 14&nbsp;&nbsp;Precipitation Of Driest Month</a><br /><a target='_blank' href='https://arcgis.com/home/item.html?id=33558b5fef8642338f33918d498f41cf' rel='nofollow ugc noopener noreferrer'>Bioclimate 15&nbsp;&nbsp;Precipitation Seasonality</a><br /><a target='_blank' href='https://arcgis.com/home/item.html?id=1324c4e0c86a40e9b7529e91c6bdf220' rel='nofollow ugc noopener noreferrer'>Bioclimate 16&nbsp;&nbsp;Precipitation Of Wettest Quarter</a><br /><a target='_blank' href='https://arcgis.com/home/item.html?id=86fe2a87fe9144f9a5c330a3b5890df0' rel='nofollow ugc noopener noreferrer'>Bioclimate 17&nbsp;&nbsp;Precipitation Of Driest Quarter</a><br /><a target='_blank' href='https://arcgis.com/home/item.html?id=eb8227050ac24b3bb4a47abb924fbc56' rel='nofollow ugc noopener noreferrer'>Bioclimate 18&nbsp;&nbsp;Precipitation Of Warmest Quarter</a><br /><a target='_blank' href='https://arcgis.com/home/item.html?id=ec067623611d40d086193b21a3a4fce1' rel='nofollow ugc noopener noreferrer'>Bioclimate 19&nbsp;&nbsp;Precipitation Of Coldest Quarter</a><br /><a target='_blank' href='https://arcgis.com/home/item.html?id=e56c9cb70aa949adb791c4311003d9ae' rel='nofollow ugc noopener noreferrer'>Bioclimate Baseline 1970-2000</a></p></div>",
			"keyword": [
				"esri_environment",
				"retiring-2026-12"
			],
			"issued": "2022-05-12T16:13:18.000Z",
			"modified": "2026-05-13T19:39:53.000Z",
			"publisher": {
				"name": "Esri"
			},
			"contactPoint": {
				"@type": "vcard:Contact",
				"fn": "esri_environment",
				"hasEmail": "{{orgContactEmail}}"
			},
			"accessLevel": "public",
			"spatial": "-180.0000,-90.0000,180.0000,90.0000",
			"license": "<p><img src='https://downloads.esri.com/blogs/arcgisonline/esrilogo_new.png' width='113' height='43' /> This work is licensed under the Esri Master License Agreement.&nbsp;</p><p><a target='_blank' href='https://goto.arcgis.com/termsofuse/viewsummary' rel='nofollow ugc noopener noreferrer'>View Summary</a> | <a target='_blank' href='https://goto.arcgis.com/termsofuse/viewtermsofuse' rel='nofollow ugc noopener noreferrer'>View Terms of Use</a></p>",
			"distribution": [
				{
					"@type": "dcat:Distribution",
					"title": "ArcGIS Hub Dataset",
					"format": "Web Page",
					"mediaType": "text/html",
					"accessURL": "https://www.pacificgeoportal.com/content/esri::bioclimate-projections-06-min-temperature-of-coldest-month"
				},
				{
					"@type": "dcat:Distribution",
					"title": "ArcGIS GeoService",
					"format": "ArcGIS GeoServices REST API",
					"mediaType": "application/json",
					"accessURL": "https://tiledimageservices.arcgis.com/P3ePLMYs2RVChkJx/arcgis/rest/services/Bioclimate_Projections__Min_Temperature_of_Coldest_Month/ImageServer"
				}
			],
			"theme": [
				"geospatial"
			]
		},
		{
			"@type": "dcat:Dataset",
			"identifier": "https://www.arcgis.com/home/item.html?id=8433250e0a4148f5a3889c66e78abdf1",
			"landingPage": "https://www.pacificgeoportal.com/content/esri::bioclimate-projections-05-max-temperature-of-warmest-month",
			"title": "Bioclimate Projections: (05) Max Temperature of Warmest Month",
			"description": "<p><span style='color:#dc143c;'><strong>Retirement Notice:</strong></span><strong>&nbsp;This </strong><a target='_blank' href='https://goto.arcgis.com/termsofuse/beta' rel='nofollow ugc noopener noreferrer'><strong>beta</strong></a><strong> item will be retired in December 2026. A</strong><a target='_blank' href='https://www.arcgis.com/home/item.html?id=8e8a1ec6acd745d7bd99d421065d2c30' rel='nofollow ugc noopener noreferrer'><strong> new version of this item</strong></a><strong>&nbsp;is available for your use. </strong>Esri recommends updating your maps and apps to use the new version.</p><p><span style='background-attachment:initial; background-clip:initial; background-image:initial; background-origin:initial; background-position:initial; background-repeat:initial; background-size:initial;'>This layer represents CMIP6 future projections of maximum temperature during the warmest month of the year. This layer can be used to compare with recent climate histories to better understand the potential impacts of future climate change.</span></p><p><a target='_blank' href='https://worldclim.org/' rel='nofollow ugc noopener noreferrer'><span style='background-attachment:initial; background-clip:initial; background-image:initial; background-origin:initial; background-position:initial; background-repeat:initial; background-size:initial;'>WorldClim</span></a><span style='background-attachment:initial; background-clip:initial; background-image:initial; background-origin:initial; background-position:initial; background-repeat:initial; background-size:initial;'>&nbsp;produced this projection as part of a series of&nbsp;</span><a target='_blank' href='https://pubs.usgs.gov/ds/691/ds691.pdf' rel='nofollow ugc noopener noreferrer'><span style='background-attachment:initial; background-clip:initial; background-image:initial; background-origin:initial; background-position:initial; background-repeat:initial; background-size:initial;'>19 bioclimate variables identified by the USGS</span></a><span style='background-attachment:initial; background-clip:initial; background-image:initial; background-origin:initial; background-position:initial; background-repeat:initial; background-size:initial;'>&nbsp;and provides this description:</span><br /><br /><i>\"Bioclimatic variables are derived from the monthly temperature and rainfall values in order to generate more biologically meaningful variables. These are often used in species distribution modeling and related ecological modeling techniques. The bioclimatic variables represent annual trends (e.g., mean annual temperature, annual precipitation) seasonality (e.g., annual range in temperature and precipitation) and extreme or limiting environmental factors (e.g., temperature of the coldest and warmest month, and precipitation of the wet and dry quarters). A quarter is a period of three months (1/4 of the year).\"</i></p><p style='background-attachment:initial; background-clip:initial; background-image:initial; background-origin:initial; background-position:initial; background-repeat:initial; background-size:initial; margin-bottom:0in;'><strong>Time Extent:</strong>&nbsp;averages from 2021-2040, 2041-2060, 2061-2080, 2081-2100<br /><strong>Units:</strong>&nbsp;deg C<br /><strong>Cell Size:</strong> 2.5 minutes (~5 km)<br /><strong>Source Type:</strong> Stretched<br /><strong>Pixel Type:</strong> 32 Bit Float<br /><strong>Data Projection:</strong> GCS WGS84<br /><strong>Mosaic Projection:</strong> GCS WGS84<br /><strong>Extent:</strong> Global<br /><strong>Source:</strong> <a target='_blank' href='https://worldclim.org/data/cmip6/cmip6_clim2.5m.html' rel='nofollow ugc noopener noreferrer'>WorldClim CMIP6 Bioclimate</a><br />&nbsp;</p><p><strong>Climate Scenarios</strong></p><p>The CMIP6 climate experiments use&nbsp;<a target='_blank' href='https://www.carbonbrief.org/explainer-how-shared-socioeconomic-pathways-explore-future-climate-change/' rel='nofollow ugc noopener noreferrer'>Shared Socioeconomic Pathways (SSPs)</a>&nbsp;to model future climate scenarios. Each SSP pairs a human/community behavior component with the traditional RCP greenhouse gas forcing from the previous CMIP5. Three SSPs were chosen by Esri to be included in the service based on user requests: SSP2 4.5, SSP3 7.0 and SSP5 8.5.</p><figure><table style='background-color:rgb(248, 249, 250); border-collapse:collapse;' width='850' cellpadding='0' cellspacing='0' border='1'><tbody><tr><td style='background-color:rgb(234, 236, 240); border:1pt solid rgb(162, 169, 177); padding:2.4pt 4.8pt;'><p style='margin:12pt 0in; text-align:center;'><span style='color:rgb(32,33,34); font-family:Arial, sans-serif; font-size:10.5pt;'><strong>SSP</strong></span></p></td><td style='background-color:rgb(234, 236, 240); border-bottom:1pt solid rgb(162, 169, 177); border-image:initial; border-left-style:none; border-right:1pt solid rgb(162, 169, 177); border-top:1pt solid rgb(162, 169, 177); padding:2.4pt 4.8pt;'><p style='margin:12pt 0in; text-align:center;'><span style='color:rgb(32,33,34); font-family:Arial, sans-serif; font-size:10.5pt;'><strong>Scenario</strong></span></p></td><td style='background-color:rgb(234, 236, 240); border-bottom:1pt solid rgb(162, 169, 177); border-image:initial; border-left-style:none; border-right:1pt solid rgb(162, 169, 177); border-top:1pt solid rgb(162, 169, 177); padding:2.4pt 4.8pt;'><p style='margin:12pt 0in; text-align:center;'><span style='color:rgb(32,33,34); font-family:Arial, sans-serif; font-size:10.5pt;'><strong>Estimated warming</strong></span><br /><span style='color:rgb(32,33,34); font-family:Arial, sans-serif; font-size:10.5pt;'><strong>(2041–2060)</strong></span></p></td><td style='background-color:rgb(234, 236, 240); border-bottom:1pt solid rgb(162, 169, 177); border-image:initial; border-left-style:none; border-right:1pt solid rgb(162, 169, 177); border-top:1pt solid rgb(162, 169, 177); padding:2.4pt 4.8pt;'><p style='margin:12pt 0in; text-align:center;'><span style='color:rgb(32,33,34); font-family:Arial, sans-serif; font-size:10.5pt;'><strong>Estimated warming</strong></span><br /><span style='color:rgb(32,33,34); font-family:Arial, sans-serif; font-size:10.5pt;'><strong>(2081–2100)</strong></span></p></td><td style='background-color:rgb(234, 236, 240); border-bottom:1pt solid rgb(162, 169, 177); border-image:initial; border-left-style:none; border-right:1pt solid rgb(162, 169, 177); border-top:1pt solid rgb(162, 169, 177); padding:2.4pt 4.8pt;'><p style='margin:12pt 0in; text-align:center;'><span style='color:rgb(32,33,34); font-family:Arial, sans-serif; font-size:10.5pt;'><strong>Very likely range in °C</strong></span><br /><span style='color:rgb(32,33,34); font-family:Arial, sans-serif; font-size:10.5pt;'><strong>(2081–2100)</strong></span></p></td></tr><tr><td style='border-bottom:1pt solid rgb(162, 169, 177); border-image:initial; border-left:1pt solid rgb(162, 169, 177); border-right:1pt solid rgb(162, 169, 177); border-top-style:none; padding:2.4pt 4.8pt;'><p style='margin:12pt 0in; text-align:center;'><span style='color:rgb(32,33,34); font-family:Arial, sans-serif; font-size:10.5pt;'>SSP2-4.5</span></p></td><td style='border-bottom:1pt solid rgb(162, 169, 177); border-left-style:none; border-right:1pt solid rgb(162, 169, 177); border-top-style:none; padding:2.4pt 4.8pt;'><p style='margin:12pt 0in; text-align:center;'><span style='color:rgb(32,33,34); font-family:Arial, sans-serif; font-size:10.5pt;'>intermediate GHG emissions:</span><br /><span style='color:rgb(32,33,34); font-family:Arial, sans-serif; font-size:10.5pt;'>CO</span><span style='color:rgb(32,33,34); font-family:Arial, sans-serif; font-size:8.5pt;'><sub>2</sub></span><span style='color:rgb(32,33,34); font-family:Arial, sans-serif; font-size:10.5pt;'>&nbsp;emissions around current levels until 2050, then falling but not reaching net zero by 2100</span></p></td><td style='border-bottom:1pt solid rgb(162, 169, 177); border-left-style:none; border-right:1pt solid rgb(162, 169, 177); border-top-style:none; padding:2.4pt 4.8pt;'><p style='margin:12pt 0in; text-align:center;'><span style='color:rgb(32,33,34); font-family:Arial, sans-serif; font-size:10.5pt;'>2.0 °C</span></p></td><td style='border-bottom:1pt solid rgb(162, 169, 177); border-left-style:none; border-right:1pt solid rgb(162, 169, 177); border-top-style:none; padding:2.4pt 4.8pt;'><p style='margin:12pt 0in; text-align:center;'><span style='color:rgb(32,33,34); font-family:Arial, sans-serif; font-size:10.5pt;'>2.7 °C</span></p></td><td style='border-bottom:1pt solid rgb(162, 169, 177); border-left-style:none; border-right:1pt solid rgb(162, 169, 177); border-top-style:none; padding:2.4pt 4.8pt;'><p style='margin:12pt 0in; text-align:center;'><span style='color:rgb(32,33,34); font-family:Arial, sans-serif; font-size:10.5pt;'>2.1 – 3.5</span></p></td></tr><tr><td style='border-bottom:1pt solid rgb(162, 169, 177); border-image:initial; border-left:1pt solid rgb(162, 169, 177); border-right:1pt solid rgb(162, 169, 177); border-top-style:none; padding:2.4pt 4.8pt;'><p style='margin:12pt 0in; text-align:center;'><span style='color:rgb(32,33,34); font-family:Arial, sans-serif; font-size:10.5pt;'>SSP3-7.0</span></p></td><td style='border-bottom:1pt solid rgb(162, 169, 177); border-left-style:none; border-right:1pt solid rgb(162, 169, 177); border-top-style:none; padding:2.4pt 4.8pt;'><p style='margin:12pt 0in; text-align:center;'><span style='color:rgb(32,33,34); font-family:Arial, sans-serif; font-size:10.5pt;'>high GHG emissions:</span><br /><span style='color:rgb(32,33,34); font-family:Arial, sans-serif; font-size:10.5pt;'>CO</span><span style='color:rgb(32,33,34); font-family:Arial, sans-serif; font-size:8.5pt;'><sub>2</sub></span><span style='color:rgb(32,33,34); font-family:Arial, sans-serif; font-size:10.5pt;'>&nbsp;emissions double by 2100</span></p></td><td style='border-bottom:1pt solid rgb(162, 169, 177); border-left-style:none; border-right:1pt solid rgb(162, 169, 177); border-top-style:none; padding:2.4pt 4.8pt;'><p style='margin:12pt 0in; text-align:center;'><span style='color:rgb(32,33,34); font-family:Arial, sans-serif; font-size:10.5pt;'>2.1 °C</span></p></td><td style='border-bottom:1pt solid rgb(162, 169, 177); border-left-style:none; border-right:1pt solid rgb(162, 169, 177); border-top-style:none; padding:2.4pt 4.8pt;'><p style='margin:12pt 0in; text-align:center;'><span style='color:rgb(32,33,34); font-family:Arial, sans-serif; font-size:10.5pt;'>3.6 °C</span></p></td><td style='border-bottom:1pt solid rgb(162, 169, 177); border-left-style:none; border-right:1pt solid rgb(162, 169, 177); border-top-style:none; padding:2.4pt 4.8pt;'><p style='margin:12pt 0in; text-align:center;'><span style='color:rgb(32,33,34); font-family:Arial, sans-serif; font-size:10.5pt;'>2.8 – 4.6</span></p></td></tr><tr><td style='border-bottom:1pt solid rgb(162, 169, 177); border-image:initial; border-left:1pt solid rgb(162, 169, 177); border-right:1pt solid rgb(162, 169, 177); border-top-style:none; padding:2.4pt 4.8pt;'><p style='margin:12pt 0in; text-align:center;'><span style='color:rgb(32,33,34); font-family:Arial, sans-serif; font-size:10.5pt;'>SSP5-8.5</span></p></td><td style='border-bottom:1pt solid rgb(162, 169, 177); border-left-style:none; border-right:1pt solid rgb(162, 169, 177); border-top-style:none; padding:2.4pt 4.8pt;'><p style='margin:12pt 0in; text-align:center;'><span style='color:rgb(32,33,34); font-family:Arial, sans-serif; font-size:10.5pt;'>very high GHG emissions:</span><br /><span style='color:rgb(32,33,34); font-family:Arial, sans-serif; font-size:10.5pt;'>CO</span><span style='color:rgb(32,33,34); font-family:Arial, sans-serif; font-size:8.5pt;'><sub>2</sub></span><span style='color:rgb(32,33,34); font-family:Arial, sans-serif; font-size:10.5pt;'>&nbsp;emissions triple by 2075</span></p></td><td style='border-bottom:1pt solid rgb(162, 169, 177); border-left-style:none; border-right:1pt solid rgb(162, 169, 177); border-top-style:none; padding:2.4pt 4.8pt;'><p style='margin:12pt 0in; text-align:center;'><span style='color:rgb(32,33,34); font-family:Arial, sans-serif; font-size:10.5pt;'>2.4 °C</span></p></td><td style='border-bottom:1pt solid rgb(162, 169, 177); border-left-style:none; border-right:1pt solid rgb(162, 169, 177); border-top-style:none; padding:2.4pt 4.8pt;'><p style='margin:12pt 0in; text-align:center;'><span style='color:rgb(32,33,34); font-family:Arial, sans-serif; font-size:10.5pt;'>4.4 °C</span></p></td><td style='border-bottom:1pt solid rgb(162, 169, 177); border-left-style:none; border-right:1pt solid rgb(162, 169, 177); border-top-style:none; padding:2.4pt 4.8pt;'><p style='margin:12pt 0in; text-align:center;'><span style='color:rgb(32,33,34); font-family:Arial, sans-serif; font-size:10.5pt;'>3.3 – 5.7</span></p></td></tr></tbody></table></figure><p>While the 8.5 scenario is no longer generally considered likely, SSP3 7.0 has been included and is considered the high end of possibilities. SSP5 8.5 has been retained since many organizations report to this threshold. The warming associated with SSP2 4.5 is equivalent to the global targets set at the 2021 United Nations COP26 meetings in Glasgow.&nbsp;</p><p><strong>Processing the Climate Data</strong></p><p>WorldClim provides 20-year averaged outputs for the various SSPs from 24 global climate models. A selection of 13 models were averaged for each variable and time based on&nbsp;<a target='_blank' href='https://rmets.onlinelibrary.wiley.com/doi/full/10.1002/joc.7566' rel='nofollow ugc noopener noreferrer'>Mahony et al 2022</a>. These models included ACCESS-ESM1-5, BCC-CSM2-MR, CanESM5, CNRM-ESM2-1, EC-Earth3-Veg, GFDL-ESM4, GISS-E2-1-G, INM-CM5-0,&nbsp;&nbsp;IPSL-CM6A-LR, MIROC6, MPI-ESM1-2-HR, MRI-ESM2-0, UKESM1-0-LL. GFDL-ESM4 was not available for SSP2 4.5 or SSP5 8.5.&nbsp;</p><p><strong>Accessing the Multidimensional Information</strong></p><p>The time and SSP scenario are built into the layer using a multidimensional raster. Enable the time slider to move across the 20-year average periods. In ArcGIS Online and Pro, use the Multidimensional Filter to select the SSP (SSP2 4.5 is the default).&nbsp;<br /><br /><strong>What can you do with this layer?</strong></p><p>These multidimensional imagery tiles support analysis using ArcGIS Online or Pro. Use the&nbsp;<a target='_blank' href='https://arcgis.com/home/item.html?id=e56c9cb70aa949adb791c4311003d9ae' rel='nofollow ugc noopener noreferrer'>Bioclimate Baseline layer</a>&nbsp;to see the difference in pixels and calculate change from the historic period into the future. Use the&nbsp;<a target='_blank' href='https://pro.arcgis.com/en/pro-app/latest/help/data/imagery/an-overview-of-multidimensional-raster-data.htm' rel='nofollow ugc noopener noreferrer'>Multidimensional&nbsp;</a>tab in ArcGIS Pro to access a variety of useful tools. Each layer or variable can be styled using the Image Display options.&nbsp;</p><p><strong>Known Quality Issues</strong></p><p>Each model is downscaled from ~100km resolution to ~5km resolution by WorldClim. Some artifacts are inevitable, especially at a global scale. Some variables have distinct transitions, especially in Greenland. Also, SSP2 4.5 has missing data for several variables in Antarctica.</p><p><strong>Related Layers</strong></p><p><a target='_blank' href='https://arcgis.com/home/item.html?id=fdaa1b7912e440efb9e29cf5d6156bb0' rel='nofollow ugc noopener noreferrer'>Bioclimate 1&nbsp;&nbsp;Annual Mean Temperature</a><br /><a target='_blank' href='https://arcgis.com/home/item.html?id=8012b34e8c854d6fbcfe4eab437ea397' rel='nofollow ugc noopener noreferrer'>Bioclimate 2&nbsp;&nbsp;Mean Diurnal Range</a><br /><a target='_blank' href='https://arcgis.com/home/item.html?id=ef9f5d6a16ca41ada0c0075a8da46d48' rel='nofollow ugc noopener noreferrer'>Bioclimate 3&nbsp;&nbsp;Isothermality</a><br /><a target='_blank' href='https://arcgis.com/home/item.html?id=64799fea8774463aad909020b6590dc8' rel='nofollow ugc noopener noreferrer'>Bioclimate 4&nbsp;&nbsp;Temperature Seasonality</a><br /><a target='_blank' href='https://arcgis.com/home/item.html?id=8433250e0a4148f5a3889c66e78abdf1' rel='nofollow ugc noopener noreferrer'>Bioclimate 5&nbsp;&nbsp;Max Temperature of Warmest Month</a><br /><a target='_blank' href='https://arcgis.com/home/item.html?id=c531d32ab5d746b88a884b6e54f3216e' rel='nofollow ugc noopener noreferrer'>Bioclimate 6&nbsp;&nbsp;Min Temperature Of Coldest Month</a><br /><a target='_blank' href='https://arcgis.com/home/item.html?id=808cfb3ab1614f8ab7e364de737e9e98' rel='nofollow ugc noopener noreferrer'>Bioclimate 7&nbsp;&nbsp;Temperature Annual Range</a><br /><a target='_blank' href='https://arcgis.com/home/item.html?id=b5990aa16fd94bb691a09449716ed7e5' rel='nofollow ugc noopener noreferrer'>Bioclimate 8&nbsp;&nbsp;Mean Temperature Of Wettest Quarter</a><br /><a target='_blank' href='https://arcgis.com/home/item.html?id=231770161a46467e8de9fdd9fd92dad7' rel='nofollow ugc noopener noreferrer'>Bioclimate 9&nbsp;&nbsp;Mean Temperature Of Driest Quarter</a><br /><a target='_blank' href='https://arcgis.com/home/item.html?id=3b98ddf1c78d4f0c88bd297f85847c68' rel='nofollow ugc noopener noreferrer'>Bioclimate 10&nbsp;&nbsp;Mean Temperature Of Warmest Quarter</a><br /><a target='_blank' href='https://arcgis.com/home/item.html?id=1a96d928c93c4e8fbc6a2391afd1da2f' rel='nofollow ugc noopener noreferrer'>Bioclimate 11&nbsp;&nbsp;Mean Temperature Of Coldest Quarter</a><br /><a target='_blank' href='https://arcgis.com/home/item.html?id=7bc0b8c75b0244b7a8128ae1f398bfc0' rel='nofollow ugc noopener noreferrer'>Bioclimate 12&nbsp;&nbsp;Annual Precipitation</a><br /><a target='_blank' href='https://arcgis.com/home/item.html?id=36fde801c8124f93b46b727b9873c993' rel='nofollow ugc noopener noreferrer'>Bioclimate 13&nbsp;&nbsp;Precipitation Of Wettest Month</a><br /><a target='_blank' href='https://arcgis.com/home/item.html?id=e26b01e4fa0a4aec9c5db991467b31a7' rel='nofollow ugc noopener noreferrer'>Bioclimate 14&nbsp;&nbsp;Precipitation Of Driest Month</a><br /><a target='_blank' href='https://arcgis.com/home/item.html?id=33558b5fef8642338f33918d498f41cf' rel='nofollow ugc noopener noreferrer'>Bioclimate 15&nbsp;&nbsp;Precipitation Seasonality</a><br /><a target='_blank' href='https://arcgis.com/home/item.html?id=1324c4e0c86a40e9b7529e91c6bdf220' rel='nofollow ugc noopener noreferrer'>Bioclimate 16&nbsp;&nbsp;Precipitation Of Wettest Quarter</a><br /><a target='_blank' href='https://arcgis.com/home/item.html?id=86fe2a87fe9144f9a5c330a3b5890df0' rel='nofollow ugc noopener noreferrer'>Bioclimate 17&nbsp;&nbsp;Precipitation Of Driest Quarter</a><br /><a target='_blank' href='https://arcgis.com/home/item.html?id=eb8227050ac24b3bb4a47abb924fbc56' rel='nofollow ugc noopener noreferrer'>Bioclimate 18&nbsp;&nbsp;Precipitation Of Warmest Quarter</a><br /><a target='_blank' href='https://arcgis.com/home/item.html?id=ec067623611d40d086193b21a3a4fce1' rel='nofollow ugc noopener noreferrer'>Bioclimate 19&nbsp;&nbsp;Precipitation Of Coldest Quarter</a><br /><a target='_blank' href='https://arcgis.com/home/item.html?id=e56c9cb70aa949adb791c4311003d9ae' rel='nofollow ugc noopener noreferrer'>Bioclimate Baseline 1970-2000</a></p>",
			"keyword": [
				"esri_environment",
				"retiring-2026-12"
			],
			"issued": "2022-05-12T16:21:15.000Z",
			"modified": "2026-05-13T19:38:09.000Z",
			"publisher": {
				"name": "Esri"
			},
			"contactPoint": {
				"@type": "vcard:Contact",
				"fn": "esri_environment",
				"hasEmail": "{{orgContactEmail}}"
			},
			"accessLevel": "public",
			"spatial": "-180.0000,-90.0000,180.0000,90.0000",
			"license": "<p><img src='https://downloads.esri.com/blogs/arcgisonline/esrilogo_new.png' width='113' height='43' /> This work is licensed under the Esri Master License Agreement.&nbsp;</p><p><a target='_blank' href='https://goto.arcgis.com/termsofuse/viewsummary' rel='nofollow ugc noopener noreferrer'>View Summary</a> | <a target='_blank' href='https://goto.arcgis.com/termsofuse/viewtermsofuse' rel='nofollow ugc noopener noreferrer'>View Terms of Use</a></p>",
			"distribution": [
				{
					"@type": "dcat:Distribution",
					"title": "ArcGIS Hub Dataset",
					"format": "Web Page",
					"mediaType": "text/html",
					"accessURL": "https://www.pacificgeoportal.com/content/esri::bioclimate-projections-05-max-temperature-of-warmest-month"
				},
				{
					"@type": "dcat:Distribution",
					"title": "ArcGIS GeoService",
					"format": "ArcGIS GeoServices REST API",
					"mediaType": "application/json",
					"accessURL": "https://tiledimageservices.arcgis.com/P3ePLMYs2RVChkJx/arcgis/rest/services/Bioclimate_Projections__Max_Temperature_of_Warmest_Month/ImageServer"
				}
			],
			"theme": [
				"geospatial"
			]
		},
		{
			"@type": "dcat:Dataset",
			"identifier": "https://www.arcgis.com/home/item.html?id=64799fea8774463aad909020b6590dc8",
			"landingPage": "https://www.pacificgeoportal.com/content/esri::bioclimate-projections-04-temperature-seasonality",
			"title": "Bioclimate Projections: (04) Temperature Seasonality",
			"description": "<p><span style='color:#dc143c;'><strong>Retirement Notice:</strong></span><strong>&nbsp;This </strong><a target='_blank' href='https://goto.arcgis.com/termsofuse/beta' rel='nofollow ugc noopener noreferrer'><strong>beta</strong></a><strong> item will be retired in December 2026. A</strong><a target='_blank' href='https://www.arcgis.com/home/item.html?id=c75910d1fb2f443c974beb32b2b4b9a5' rel='nofollow ugc noopener noreferrer'><strong> new version of this item</strong></a><strong>&nbsp;is available for your use. </strong>Esri recommends updating your maps and apps to use the new version.</p><p>This layer represents CMIP6 future projections of temperature change over the course of the year. The larger the value, the greater the variability of temperature. This layer can be used to compare with recent climate histories to better understand the potential impacts of future climate change.</p><p><a target='_blank' href='https://worldclim.org/' rel='nofollow ugc noopener noreferrer'><span style='background-attachment:initial; background-clip:initial; background-image:initial; background-origin:initial; background-position:initial; background-repeat:initial; background-size:initial;'>WorldClim</span></a><span style='background-attachment:initial; background-clip:initial; background-image:initial; background-origin:initial; background-position:initial; background-repeat:initial; background-size:initial;'>&nbsp;produced this projection as part of a series of&nbsp;</span><a target='_blank' href='https://pubs.usgs.gov/ds/691/ds691.pdf' rel='nofollow ugc noopener noreferrer'><span style='background-attachment:initial; background-clip:initial; background-image:initial; background-origin:initial; background-position:initial; background-repeat:initial; background-size:initial;'>19 bioclimate variables identified by the USGS</span></a><span style='background-attachment:initial; background-clip:initial; background-image:initial; background-origin:initial; background-position:initial; background-repeat:initial; background-size:initial;'>&nbsp;and provides this description:</span><br /><br /><i>\"Bioclimatic variables are derived from the monthly temperature and rainfall values in order to generate more biologically meaningful variables. These are often used in species distribution modeling and related ecological modeling techniques. The bioclimatic variables represent annual trends (e.g., mean annual temperature, annual precipitation) seasonality (e.g., annual range in temperature and precipitation) and extreme or limiting environmental factors (e.g., temperature of the coldest and warmest month, and precipitation of the wet and dry quarters). A quarter is a period of three months (1/4 of the year).\"</i></p><p style='background-attachment:initial; background-clip:initial; background-image:initial; background-origin:initial; background-position:initial; background-repeat:initial; background-size:initial; margin-bottom:0in;'><strong>Time Extent:</strong>&nbsp;averages from 2021-2040, 2041-2060, 2061-2080, 2081-2100<br /><strong>Units:</strong>&nbsp;%<br /><strong>Cell Size:</strong> 2.5 minutes (~5 km)<br /><strong>Source Type:</strong> Stretched<br /><strong>Pixel Type:</strong> 32 Bit Float<br /><strong>Data Projection:</strong> GCS WGS84<br /><strong>Mosaic Projection:</strong> GCS WGS84<br /><strong>Extent:</strong> Global<br /><strong>Source:</strong> <a target='_blank' href='https://worldclim.org/data/cmip6/cmip6_clim2.5m.html' rel='nofollow ugc noopener noreferrer'>WorldClim CMIP6 Bioclimate</a><br />&nbsp;</p><p><strong>Climate Scenarios</strong></p><p>The CMIP6 climate experiments use&nbsp;<a target='_blank' href='https://www.carbonbrief.org/explainer-how-shared-socioeconomic-pathways-explore-future-climate-change/' rel='nofollow ugc noopener noreferrer'>Shared Socioeconomic Pathways (SSPs)</a>&nbsp;to model future climate scenarios. Each SSP pairs a human/community behavior component with the traditional RCP greenhouse gas forcing from the previous CMIP5. Three SSPs were chosen by Esri to be included in the service based on user requests: SSP2 4.5, SSP3 7.0 and SSP5 8.5.</p><figure><table style='background-color:rgb(248, 249, 250); border-collapse:collapse;' width='850' cellpadding='0' cellspacing='0' border='1'><tbody><tr><td style='background-color:rgb(234, 236, 240); border:1pt solid rgb(162, 169, 177); padding:2.4pt 4.8pt;'><p style='margin:12pt 0in; text-align:center;'><span style='color:rgb(32,33,34); font-family:Arial, sans-serif; font-size:10.5pt;'><strong>SSP</strong></span></p></td><td style='background-color:rgb(234, 236, 240); border-bottom:1pt solid rgb(162, 169, 177); border-image:initial; border-left-style:none; border-right:1pt solid rgb(162, 169, 177); border-top:1pt solid rgb(162, 169, 177); padding:2.4pt 4.8pt;'><p style='margin:12pt 0in; text-align:center;'><span style='color:rgb(32,33,34); font-family:Arial, sans-serif; font-size:10.5pt;'><strong>Scenario</strong></span></p></td><td style='background-color:rgb(234, 236, 240); border-bottom:1pt solid rgb(162, 169, 177); border-image:initial; border-left-style:none; border-right:1pt solid rgb(162, 169, 177); border-top:1pt solid rgb(162, 169, 177); padding:2.4pt 4.8pt;'><p style='margin:12pt 0in; text-align:center;'><span style='color:rgb(32,33,34); font-family:Arial, sans-serif; font-size:10.5pt;'><strong>Estimated warming</strong></span><br /><span style='color:rgb(32,33,34); font-family:Arial, sans-serif; font-size:10.5pt;'><strong>(2041–2060)</strong></span></p></td><td style='background-color:rgb(234, 236, 240); border-bottom:1pt solid rgb(162, 169, 177); border-image:initial; border-left-style:none; border-right:1pt solid rgb(162, 169, 177); border-top:1pt solid rgb(162, 169, 177); padding:2.4pt 4.8pt;'><p style='margin:12pt 0in; text-align:center;'><span style='color:rgb(32,33,34); font-family:Arial, sans-serif; font-size:10.5pt;'><strong>Estimated warming</strong></span><br /><span style='color:rgb(32,33,34); font-family:Arial, sans-serif; font-size:10.5pt;'><strong>(2081–2100)</strong></span></p></td><td style='background-color:rgb(234, 236, 240); border-bottom:1pt solid rgb(162, 169, 177); border-image:initial; border-left-style:none; border-right:1pt solid rgb(162, 169, 177); border-top:1pt solid rgb(162, 169, 177); padding:2.4pt 4.8pt;'><p style='margin:12pt 0in; text-align:center;'><span style='color:rgb(32,33,34); font-family:Arial, sans-serif; font-size:10.5pt;'><strong>Very likely range in °C</strong></span><br /><span style='color:rgb(32,33,34); font-family:Arial, sans-serif; font-size:10.5pt;'><strong>(2081–2100)</strong></span></p></td></tr><tr><td style='border-bottom:1pt solid rgb(162, 169, 177); border-image:initial; border-left:1pt solid rgb(162, 169, 177); border-right:1pt solid rgb(162, 169, 177); border-top-style:none; padding:2.4pt 4.8pt;'><p style='margin:12pt 0in; text-align:center;'><span style='color:rgb(32,33,34); font-family:Arial, sans-serif; font-size:10.5pt;'>SSP2-4.5</span></p></td><td style='border-bottom:1pt solid rgb(162, 169, 177); border-left-style:none; border-right:1pt solid rgb(162, 169, 177); border-top-style:none; padding:2.4pt 4.8pt;'><p style='margin:12pt 0in; text-align:center;'><span style='color:rgb(32,33,34); font-family:Arial, sans-serif; font-size:10.5pt;'>intermediate GHG emissions:</span><br /><span style='color:rgb(32,33,34); font-family:Arial, sans-serif; font-size:10.5pt;'>CO</span><span style='color:rgb(32,33,34); font-family:Arial, sans-serif; font-size:8.5pt;'><sub>2</sub></span><span style='color:rgb(32,33,34); font-family:Arial, sans-serif; font-size:10.5pt;'>&nbsp;emissions around current levels until 2050, then falling but not reaching net zero by 2100</span></p></td><td style='border-bottom:1pt solid rgb(162, 169, 177); border-left-style:none; border-right:1pt solid rgb(162, 169, 177); border-top-style:none; padding:2.4pt 4.8pt;'><p style='margin:12pt 0in; text-align:center;'><span style='color:rgb(32,33,34); font-family:Arial, sans-serif; font-size:10.5pt;'>2.0 °C</span></p></td><td style='border-bottom:1pt solid rgb(162, 169, 177); border-left-style:none; border-right:1pt solid rgb(162, 169, 177); border-top-style:none; padding:2.4pt 4.8pt;'><p style='margin:12pt 0in; text-align:center;'><span style='color:rgb(32,33,34); font-family:Arial, sans-serif; font-size:10.5pt;'>2.7 °C</span></p></td><td style='border-bottom:1pt solid rgb(162, 169, 177); border-left-style:none; border-right:1pt solid rgb(162, 169, 177); border-top-style:none; padding:2.4pt 4.8pt;'><p style='margin:12pt 0in; text-align:center;'><span style='color:rgb(32,33,34); font-family:Arial, sans-serif; font-size:10.5pt;'>2.1 – 3.5</span></p></td></tr><tr><td style='border-bottom:1pt solid rgb(162, 169, 177); border-image:initial; border-left:1pt solid rgb(162, 169, 177); border-right:1pt solid rgb(162, 169, 177); border-top-style:none; padding:2.4pt 4.8pt;'><p style='margin:12pt 0in; text-align:center;'><span style='color:rgb(32,33,34); font-family:Arial, sans-serif; font-size:10.5pt;'>SSP3-7.0</span></p></td><td style='border-bottom:1pt solid rgb(162, 169, 177); border-left-style:none; border-right:1pt solid rgb(162, 169, 177); border-top-style:none; padding:2.4pt 4.8pt;'><p style='margin:12pt 0in; text-align:center;'><span style='color:rgb(32,33,34); font-family:Arial, sans-serif; font-size:10.5pt;'>high GHG emissions:</span><br /><span style='color:rgb(32,33,34); font-family:Arial, sans-serif; font-size:10.5pt;'>CO</span><span style='color:rgb(32,33,34); font-family:Arial, sans-serif; font-size:8.5pt;'><sub>2</sub></span><span style='color:rgb(32,33,34); font-family:Arial, sans-serif; font-size:10.5pt;'>&nbsp;emissions double by 2100</span></p></td><td style='border-bottom:1pt solid rgb(162, 169, 177); border-left-style:none; border-right:1pt solid rgb(162, 169, 177); border-top-style:none; padding:2.4pt 4.8pt;'><p style='margin:12pt 0in; text-align:center;'><span style='color:rgb(32,33,34); font-family:Arial, sans-serif; font-size:10.5pt;'>2.1 °C</span></p></td><td style='border-bottom:1pt solid rgb(162, 169, 177); border-left-style:none; border-right:1pt solid rgb(162, 169, 177); border-top-style:none; padding:2.4pt 4.8pt;'><p style='margin:12pt 0in; text-align:center;'><span style='color:rgb(32,33,34); font-family:Arial, sans-serif; font-size:10.5pt;'>3.6 °C</span></p></td><td style='border-bottom:1pt solid rgb(162, 169, 177); border-left-style:none; border-right:1pt solid rgb(162, 169, 177); border-top-style:none; padding:2.4pt 4.8pt;'><p style='margin:12pt 0in; text-align:center;'><span style='color:rgb(32,33,34); font-family:Arial, sans-serif; font-size:10.5pt;'>2.8 – 4.6</span></p></td></tr><tr><td style='border-bottom:1pt solid rgb(162, 169, 177); border-image:initial; border-left:1pt solid rgb(162, 169, 177); border-right:1pt solid rgb(162, 169, 177); border-top-style:none; padding:2.4pt 4.8pt;'><p style='margin:12pt 0in; text-align:center;'><span style='color:rgb(32,33,34); font-family:Arial, sans-serif; font-size:10.5pt;'>SSP5-8.5</span></p></td><td style='border-bottom:1pt solid rgb(162, 169, 177); border-left-style:none; border-right:1pt solid rgb(162, 169, 177); border-top-style:none; padding:2.4pt 4.8pt;'><p style='margin:12pt 0in; text-align:center;'><span style='color:rgb(32,33,34); font-family:Arial, sans-serif; font-size:10.5pt;'>very high GHG emissions:</span><br /><span style='color:rgb(32,33,34); font-family:Arial, sans-serif; font-size:10.5pt;'>CO</span><span style='color:rgb(32,33,34); font-family:Arial, sans-serif; font-size:8.5pt;'><sub>2</sub></span><span style='color:rgb(32,33,34); font-family:Arial, sans-serif; font-size:10.5pt;'>&nbsp;emissions triple by 2075</span></p></td><td style='border-bottom:1pt solid rgb(162, 169, 177); border-left-style:none; border-right:1pt solid rgb(162, 169, 177); border-top-style:none; padding:2.4pt 4.8pt;'><p style='margin:12pt 0in; text-align:center;'><span style='color:rgb(32,33,34); font-family:Arial, sans-serif; font-size:10.5pt;'>2.4 °C</span></p></td><td style='border-bottom:1pt solid rgb(162, 169, 177); border-left-style:none; border-right:1pt solid rgb(162, 169, 177); border-top-style:none; padding:2.4pt 4.8pt;'><p style='margin:12pt 0in; text-align:center;'><span style='color:rgb(32,33,34); font-family:Arial, sans-serif; font-size:10.5pt;'>4.4 °C</span></p></td><td style='border-bottom:1pt solid rgb(162, 169, 177); border-left-style:none; border-right:1pt solid rgb(162, 169, 177); border-top-style:none; padding:2.4pt 4.8pt;'><p style='margin:12pt 0in; text-align:center;'><span style='color:rgb(32,33,34); font-family:Arial, sans-serif; font-size:10.5pt;'>3.3 – 5.7</span></p></td></tr></tbody></table></figure><p>While the 8.5 scenario is no longer generally considered likely, SSP3 7.0 has been included and is considered the high end of possibilities. SSP5 8.5 has been retained since many organizations report to this threshold. The warming associated with SSP2 4.5 is equivalent to the global targets set at the 2021 United Nations COP26 meetings in Glasgow.&nbsp;<br />&nbsp;</p><p><strong>Processing the Climate Data</strong></p><p>WorldClim provides 20-year averaged outputs for the various SSPs from 24 global climate models. A selection of 13 models were averaged for each variable and time based on&nbsp;<a target='_blank' href='https://rmets.onlinelibrary.wiley.com/doi/full/10.1002/joc.7566' rel='nofollow ugc noopener noreferrer'>Mahony et al 2022</a>. These models included ACCESS-ESM1-5, BCC-CSM2-MR, CanESM5, CNRM-ESM2-1, EC-Earth3-Veg, GFDL-ESM4, GISS-E2-1-G, INM-CM5-0,&nbsp;&nbsp;IPSL-CM6A-LR, MIROC6, MPI-ESM1-2-HR, MRI-ESM2-0, UKESM1-0-LL. GFDL-ESM4 was not available for SSP2 4.5 or SSP5 8.5.&nbsp;</p><p><strong>Accessing the Multidimensional Information</strong></p><p>The time and SSP scenario are built into the layer using a multidimensional raster. Enable the time slider to move across the 20-year average periods. In ArcGIS Online and Pro, use the Multidimensional Filter to select the SSP (SSP2 4.5 is the default).&nbsp;<br /><br /><strong>What can you do with this layer?</strong></p><p>These multidimensional imagery tiles support analysis using ArcGIS Online or Pro. Use the&nbsp;<a target='_blank' href='https://arcgis.com/home/item.html?id=e56c9cb70aa949adb791c4311003d9ae' rel='nofollow ugc noopener noreferrer'>Bioclimate Baseline layer</a>&nbsp;to see the difference in pixels and calculate change from the historic period into the future. Use the&nbsp;<a target='_blank' href='https://pro.arcgis.com/en/pro-app/latest/help/data/imagery/an-overview-of-multidimensional-raster-data.htm' rel='nofollow ugc noopener noreferrer'>Multidimensional&nbsp;</a>tab in ArcGIS Pro to access a variety of useful tools. Each layer or variable can be styled using the Image Display options.&nbsp;</p><p><strong>Known Quality Issues</strong></p><p>Each model is downscaled from ~100km resolution to ~5km resolution by WorldClim. Some artifacts are inevitable, especially at a global scale. Some variables have distinct transitions, especially in Greenland. Also, SSP2 4.5 has missing data for several variables in Antarctica.</p><p><strong>Related Layers</strong></p><p><a target='_blank' href='https://arcgis.com/home/item.html?id=fdaa1b7912e440efb9e29cf5d6156bb0' rel='nofollow ugc noopener noreferrer'>Bioclimate 1&nbsp;&nbsp;Annual Mean Temperature</a><br /><a target='_blank' href='https://arcgis.com/home/item.html?id=8012b34e8c854d6fbcfe4eab437ea397' rel='nofollow ugc noopener noreferrer'>Bioclimate 2&nbsp;&nbsp;Mean Diurnal Range</a><br /><a target='_blank' href='https://arcgis.com/home/item.html?id=ef9f5d6a16ca41ada0c0075a8da46d48' rel='nofollow ugc noopener noreferrer'>Bioclimate 3&nbsp;&nbsp;Isothermality</a><br /><a target='_blank' href='https://arcgis.com/home/item.html?id=64799fea8774463aad909020b6590dc8' rel='nofollow ugc noopener noreferrer'>Bioclimate 4&nbsp;&nbsp;Temperature Seasonality</a><br /><a target='_blank' href='https://arcgis.com/home/item.html?id=8433250e0a4148f5a3889c66e78abdf1' rel='nofollow ugc noopener noreferrer'>Bioclimate 5&nbsp;&nbsp;Max Temperature of Warmest Month</a><br /><a target='_blank' href='https://arcgis.com/home/item.html?id=c531d32ab5d746b88a884b6e54f3216e' rel='nofollow ugc noopener noreferrer'>Bioclimate 6&nbsp;&nbsp;Min Temperature Of Coldest Month</a><br /><a target='_blank' href='https://arcgis.com/home/item.html?id=808cfb3ab1614f8ab7e364de737e9e98' rel='nofollow ugc noopener noreferrer'>Bioclimate 7&nbsp;&nbsp;Temperature Annual Range</a><br /><a target='_blank' href='https://arcgis.com/home/item.html?id=b5990aa16fd94bb691a09449716ed7e5' rel='nofollow ugc noopener noreferrer'>Bioclimate 8&nbsp;&nbsp;Mean Temperature Of Wettest Quarter</a><br /><a target='_blank' href='https://arcgis.com/home/item.html?id=231770161a46467e8de9fdd9fd92dad7' rel='nofollow ugc noopener noreferrer'>Bioclimate 9&nbsp;&nbsp;Mean Temperature Of Driest Quarter</a><br /><a target='_blank' href='https://arcgis.com/home/item.html?id=3b98ddf1c78d4f0c88bd297f85847c68' rel='nofollow ugc noopener noreferrer'>Bioclimate 10&nbsp;&nbsp;Mean Temperature Of Warmest Quarter</a><br /><a target='_blank' href='https://arcgis.com/home/item.html?id=1a96d928c93c4e8fbc6a2391afd1da2f' rel='nofollow ugc noopener noreferrer'>Bioclimate 11&nbsp;&nbsp;Mean Temperature Of Coldest Quarter</a><br /><a target='_blank' href='https://arcgis.com/home/item.html?id=7bc0b8c75b0244b7a8128ae1f398bfc0' rel='nofollow ugc noopener noreferrer'>Bioclimate 12&nbsp;&nbsp;Annual Precipitation</a><br /><a target='_blank' href='https://arcgis.com/home/item.html?id=36fde801c8124f93b46b727b9873c993' rel='nofollow ugc noopener noreferrer'>Bioclimate 13&nbsp;&nbsp;Precipitation Of Wettest Month</a><br /><a target='_blank' href='https://arcgis.com/home/item.html?id=e26b01e4fa0a4aec9c5db991467b31a7' rel='nofollow ugc noopener noreferrer'>Bioclimate 14&nbsp;&nbsp;Precipitation Of Driest Month</a><br /><a target='_blank' href='https://arcgis.com/home/item.html?id=33558b5fef8642338f33918d498f41cf' rel='nofollow ugc noopener noreferrer'>Bioclimate 15&nbsp;&nbsp;Precipitation Seasonality</a><br /><a target='_blank' href='https://arcgis.com/home/item.html?id=1324c4e0c86a40e9b7529e91c6bdf220' rel='nofollow ugc noopener noreferrer'>Bioclimate 16&nbsp;&nbsp;Precipitation Of Wettest Quarter</a><br /><a target='_blank' href='https://arcgis.com/home/item.html?id=86fe2a87fe9144f9a5c330a3b5890df0' rel='nofollow ugc noopener noreferrer'>Bioclimate 17&nbsp;&nbsp;Precipitation Of Driest Quarter</a><br /><a target='_blank' href='https://arcgis.com/home/item.html?id=eb8227050ac24b3bb4a47abb924fbc56' rel='nofollow ugc noopener noreferrer'>Bioclimate 18&nbsp;&nbsp;Precipitation Of Warmest Quarter</a><br /><a target='_blank' href='https://arcgis.com/home/item.html?id=ec067623611d40d086193b21a3a4fce1' rel='nofollow ugc noopener noreferrer'>Bioclimate 19&nbsp;&nbsp;Precipitation Of Coldest Quarter</a><br /><a target='_blank' href='https://arcgis.com/home/item.html?id=e56c9cb70aa949adb791c4311003d9ae' rel='nofollow ugc noopener noreferrer'>Bioclimate Baseline 1970-2000</a></p>",
			"keyword": [
				"esri_environment",
				"retiring-2026-12"
			],
			"issued": "2022-05-12T16:25:36.000Z",
			"modified": "2026-05-13T19:37:43.000Z",
			"publisher": {
				"name": "Esri"
			},
			"contactPoint": {
				"@type": "vcard:Contact",
				"fn": "esri_environment",
				"hasEmail": "{{orgContactEmail}}"
			},
			"accessLevel": "public",
			"spatial": "-180.0000,-90.0000,180.0000,90.0000",
			"license": "<p><img src='https://downloads.esri.com/blogs/arcgisonline/esrilogo_new.png' width='113' height='43' /> This work is licensed under the Esri Master License Agreement.&nbsp;</p><p><a target='_blank' href='https://goto.arcgis.com/termsofuse/viewsummary' rel='nofollow ugc noopener noreferrer'>View Summary</a> | <a target='_blank' href='https://goto.arcgis.com/termsofuse/viewtermsofuse' rel='nofollow ugc noopener noreferrer'>View Terms of Use</a></p>",
			"distribution": [
				{
					"@type": "dcat:Distribution",
					"title": "ArcGIS Hub Dataset",
					"format": "Web Page",
					"mediaType": "text/html",
					"accessURL": "https://www.pacificgeoportal.com/content/esri::bioclimate-projections-04-temperature-seasonality"
				},
				{
					"@type": "dcat:Distribution",
					"title": "ArcGIS GeoService",
					"format": "ArcGIS GeoServices REST API",
					"mediaType": "application/json",
					"accessURL": "https://tiledimageservices.arcgis.com/P3ePLMYs2RVChkJx/arcgis/rest/services/Bioclimate_Projections__Temperature_Seasonality/ImageServer"
				}
			],
			"theme": [
				"geospatial"
			]
		},
		{
			"@type": "dcat:Dataset",
			"identifier": "https://www.arcgis.com/home/item.html?id=ef9f5d6a16ca41ada0c0075a8da46d48",
			"landingPage": "https://www.pacificgeoportal.com/content/esri::bioclimate-projections-03-isothermality",
			"title": "Bioclimate Projections: (03) Isothermality",
			"description": "<p><span style='color:#dc143c;'><strong>Retirement Notice:</strong></span><strong> This </strong><a target='_blank' href='https://goto.arcgis.com/termsofuse/beta' rel='nofollow ugc noopener noreferrer'><strong>beta</strong></a><strong> item will be retired in December 2026. A</strong><a target='_blank' href='https://www.arcgis.com/home/item.html?id=2813adc103804901b4bd7eb974832371' rel='nofollow ugc noopener noreferrer'><strong> new version of this item</strong></a><strong>&nbsp;is available for your use.</strong> Esri recommends updating your maps and apps to use the new version.</p><p>This layer represents CMIP6 future projections of how large the day-to-night temperatures oscillate relative to the summer-to-winter (annual) oscillations. Isothermality is derived by calculating the ratio of the mean diurnal range (Bio 2) to the annual temperature range (Bio 7), and then multiplying by 100.&nbsp; An isothermal value of 100 indicates the diurnal temperature range is equivalent to the annual temperature range, while anything less than 100 indicates a smaller level of temperature variability within an average month relative to the year. A species distribution may be influenced by larger or smaller temperature fluctuations within a month relative to the year and this predictor is useful for ascertaining such information. This layer can be used to compare with recent climate histories to better understand the potential impacts of future climate change.</p><p><a target='_blank' href='https://worldclim.org/' rel='nofollow ugc noopener noreferrer'>WorldClim</a>&nbsp;produced this projection as part of a series of&nbsp;<a target='_blank' href='https://pubs.usgs.gov/ds/691/ds691.pdf' rel='nofollow ugc noopener noreferrer'>19 bioclimate variables identified by the USGS</a>&nbsp;and provides this description:</p><p><i>\"Bioclimatic variables are derived from the monthly temperature and rainfall values in order to generate more biologically meaningful variables. These are often used in species distribution modeling and related ecological modeling techniques. The bioclimatic variables represent annual trends (e.g., mean annual temperature, annual precipitation) seasonality (e.g., annual range in temperature and precipitation) and extreme or limiting environmental factors (e.g., temperature of the coldest and warmest month, and precipitation of the wet and dry quarters). A quarter is a period of three months (1/4 of the year).\"</i></p><p style='background-attachment:initial; background-clip:initial; background-image:initial; background-origin:initial; background-position:initial; background-repeat:initial; background-size:initial; margin-bottom:0in;'><strong>Time Extent:</strong>&nbsp;averages from 2021-2040, 2041-2060, 2061-2080, 2081-2100<br /><strong>Units:</strong>&nbsp;%<br /><strong>Cell Size:</strong> 2.5 minutes (~5 km)<br /><strong>Source Type:</strong> Stretched<br /><strong>Pixel Type:</strong> 32 Bit Float<br /><strong>Data Projection:</strong> GCS WGS84<br /><strong>Mosaic Projection:</strong> GCS WGS84<br /><strong>Extent:</strong> Global<br /><strong>Source:</strong> <a target='_blank' href='https://worldclim.org/data/cmip6/cmip6_clim2.5m.html' rel='nofollow ugc noopener noreferrer'>WorldClim CMIP6 Bioclimate</a><br />&nbsp;</p><p><strong>Climate Scenarios</strong></p><p>The CMIP6 climate experiments use&nbsp;<a target='_blank' href='https://www.carbonbrief.org/explainer-how-shared-socioeconomic-pathways-explore-future-climate-change/' rel='nofollow ugc noopener noreferrer'>Shared Socioeconomic Pathways (SSPs)</a>&nbsp;to model future climate scenarios. Each SSP pairs a human/community behavior component with the traditional RCP greenhouse gas forcing from the previous CMIP5. Three SSPs were chosen by Esri to be included in the service based on user requests: SSP2 4.5, SSP3 7.0 and SSP5 8.5.</p><figure><table style='background-color:rgb(248, 249, 250); border-collapse:collapse;' width='850' cellpadding='0' cellspacing='0' border='1'><tbody><tr><td style='background-color:rgb(234, 236, 240); border:1pt solid rgb(162, 169, 177); padding:2.4pt 4.8pt;'><p style='margin:12pt 0in; text-align:center;'><span style='color:rgb(32,33,34); font-family:Arial, sans-serif; font-size:10.5pt;'><strong>SSP</strong></span></p></td><td style='background-color:rgb(234, 236, 240); border-bottom:1pt solid rgb(162, 169, 177); border-image:initial; border-left-style:none; border-right:1pt solid rgb(162, 169, 177); border-top:1pt solid rgb(162, 169, 177); padding:2.4pt 4.8pt;'><p style='margin:12pt 0in; text-align:center;'><span style='color:rgb(32,33,34); font-family:Arial, sans-serif; font-size:10.5pt;'><strong>Scenario</strong></span></p></td><td style='background-color:rgb(234, 236, 240); border-bottom:1pt solid rgb(162, 169, 177); border-image:initial; border-left-style:none; border-right:1pt solid rgb(162, 169, 177); border-top:1pt solid rgb(162, 169, 177); padding:2.4pt 4.8pt;'><p style='margin:12pt 0in; text-align:center;'><span style='color:rgb(32,33,34); font-family:Arial, sans-serif; font-size:10.5pt;'><strong>Estimated warming</strong></span><br /><span style='color:rgb(32,33,34); font-family:Arial, sans-serif; font-size:10.5pt;'><strong>(2041–2060)</strong></span></p></td><td style='background-color:rgb(234, 236, 240); border-bottom:1pt solid rgb(162, 169, 177); border-image:initial; border-left-style:none; border-right:1pt solid rgb(162, 169, 177); border-top:1pt solid rgb(162, 169, 177); padding:2.4pt 4.8pt;'><p style='margin:12pt 0in; text-align:center;'><span style='color:rgb(32,33,34); font-family:Arial, sans-serif; font-size:10.5pt;'><strong>Estimated warming</strong></span><br /><span style='color:rgb(32,33,34); font-family:Arial, sans-serif; font-size:10.5pt;'><strong>(2081–2100)</strong></span></p></td><td style='background-color:rgb(234, 236, 240); border-bottom:1pt solid rgb(162, 169, 177); border-image:initial; border-left-style:none; border-right:1pt solid rgb(162, 169, 177); border-top:1pt solid rgb(162, 169, 177); padding:2.4pt 4.8pt;'><p style='margin:12pt 0in; text-align:center;'><span style='color:rgb(32,33,34); font-family:Arial, sans-serif; font-size:10.5pt;'><strong>Very likely range in °C</strong></span><br /><span style='color:rgb(32,33,34); font-family:Arial, sans-serif; font-size:10.5pt;'><strong>(2081–2100)</strong></span></p></td></tr><tr><td style='border-bottom:1pt solid rgb(162, 169, 177); border-image:initial; border-left:1pt solid rgb(162, 169, 177); border-right:1pt solid rgb(162, 169, 177); border-top-style:none; padding:2.4pt 4.8pt;'><p style='margin:12pt 0in; text-align:center;'><span style='color:rgb(32,33,34); font-family:Arial, sans-serif; font-size:10.5pt;'>SSP2-4.5</span></p></td><td style='border-bottom:1pt solid rgb(162, 169, 177); border-left-style:none; border-right:1pt solid rgb(162, 169, 177); border-top-style:none; padding:2.4pt 4.8pt;'><p style='margin:12pt 0in; text-align:center;'><span style='color:rgb(32,33,34); font-family:Arial, sans-serif; font-size:10.5pt;'>intermediate GHG emissions:</span><br /><span style='color:rgb(32,33,34); font-family:Arial, sans-serif; font-size:10.5pt;'>CO</span><span style='color:rgb(32,33,34); font-family:Arial, sans-serif; font-size:8.5pt;'><sub>2</sub></span><span style='color:rgb(32,33,34); font-family:Arial, sans-serif; font-size:10.5pt;'>&nbsp;emissions around current levels until 2050, then falling but not reaching net zero by 2100</span></p></td><td style='border-bottom:1pt solid rgb(162, 169, 177); border-left-style:none; border-right:1pt solid rgb(162, 169, 177); border-top-style:none; padding:2.4pt 4.8pt;'><p style='margin:12pt 0in; text-align:center;'><span style='color:rgb(32,33,34); font-family:Arial, sans-serif; font-size:10.5pt;'>2.0 °C</span></p></td><td style='border-bottom:1pt solid rgb(162, 169, 177); border-left-style:none; border-right:1pt solid rgb(162, 169, 177); border-top-style:none; padding:2.4pt 4.8pt;'><p style='margin:12pt 0in; text-align:center;'><span style='color:rgb(32,33,34); font-family:Arial, sans-serif; font-size:10.5pt;'>2.7 °C</span></p></td><td style='border-bottom:1pt solid rgb(162, 169, 177); border-left-style:none; border-right:1pt solid rgb(162, 169, 177); border-top-style:none; padding:2.4pt 4.8pt;'><p style='margin:12pt 0in; text-align:center;'><span style='color:rgb(32,33,34); font-family:Arial, sans-serif; font-size:10.5pt;'>2.1 – 3.5</span></p></td></tr><tr><td style='border-bottom:1pt solid rgb(162, 169, 177); border-image:initial; border-left:1pt solid rgb(162, 169, 177); border-right:1pt solid rgb(162, 169, 177); border-top-style:none; padding:2.4pt 4.8pt;'><p style='margin:12pt 0in; text-align:center;'><span style='color:rgb(32,33,34); font-family:Arial, sans-serif; font-size:10.5pt;'>SSP3-7.0</span></p></td><td style='border-bottom:1pt solid rgb(162, 169, 177); border-left-style:none; border-right:1pt solid rgb(162, 169, 177); border-top-style:none; padding:2.4pt 4.8pt;'><p style='margin:12pt 0in; text-align:center;'><span style='color:rgb(32,33,34); font-family:Arial, sans-serif; font-size:10.5pt;'>high GHG emissions:</span><br /><span style='color:rgb(32,33,34); font-family:Arial, sans-serif; font-size:10.5pt;'>CO</span><span style='color:rgb(32,33,34); font-family:Arial, sans-serif; font-size:8.5pt;'><sub>2</sub></span><span style='color:rgb(32,33,34); font-family:Arial, sans-serif; font-size:10.5pt;'>&nbsp;emissions double by 2100</span></p></td><td style='border-bottom:1pt solid rgb(162, 169, 177); border-left-style:none; border-right:1pt solid rgb(162, 169, 177); border-top-style:none; padding:2.4pt 4.8pt;'><p style='margin:12pt 0in; text-align:center;'><span style='color:rgb(32,33,34); font-family:Arial, sans-serif; font-size:10.5pt;'>2.1 °C</span></p></td><td style='border-bottom:1pt solid rgb(162, 169, 177); border-left-style:none; border-right:1pt solid rgb(162, 169, 177); border-top-style:none; padding:2.4pt 4.8pt;'><p style='margin:12pt 0in; text-align:center;'><span style='color:rgb(32,33,34); font-family:Arial, sans-serif; font-size:10.5pt;'>3.6 °C</span></p></td><td style='border-bottom:1pt solid rgb(162, 169, 177); border-left-style:none; border-right:1pt solid rgb(162, 169, 177); border-top-style:none; padding:2.4pt 4.8pt;'><p style='margin:12pt 0in; text-align:center;'><span style='color:rgb(32,33,34); font-family:Arial, sans-serif; font-size:10.5pt;'>2.8 – 4.6</span></p></td></tr><tr><td style='border-bottom:1pt solid rgb(162, 169, 177); border-image:initial; border-left:1pt solid rgb(162, 169, 177); border-right:1pt solid rgb(162, 169, 177); border-top-style:none; padding:2.4pt 4.8pt;'><p style='margin:12pt 0in; text-align:center;'><span style='color:rgb(32,33,34); font-family:Arial, sans-serif; font-size:10.5pt;'>SSP5-8.5</span></p></td><td style='border-bottom:1pt solid rgb(162, 169, 177); border-left-style:none; border-right:1pt solid rgb(162, 169, 177); border-top-style:none; padding:2.4pt 4.8pt;'><p style='margin:12pt 0in; text-align:center;'><span style='color:rgb(32,33,34); font-family:Arial, sans-serif; font-size:10.5pt;'>very high GHG emissions:</span><br /><span style='color:rgb(32,33,34); font-family:Arial, sans-serif; font-size:10.5pt;'>CO</span><span style='color:rgb(32,33,34); font-family:Arial, sans-serif; font-size:8.5pt;'><sub>2</sub></span><span style='color:rgb(32,33,34); font-family:Arial, sans-serif; font-size:10.5pt;'>&nbsp;emissions triple by 2075</span></p></td><td style='border-bottom:1pt solid rgb(162, 169, 177); border-left-style:none; border-right:1pt solid rgb(162, 169, 177); border-top-style:none; padding:2.4pt 4.8pt;'><p style='margin:12pt 0in; text-align:center;'><span style='color:rgb(32,33,34); font-family:Arial, sans-serif; font-size:10.5pt;'>2.4 °C</span></p></td><td style='border-bottom:1pt solid rgb(162, 169, 177); border-left-style:none; border-right:1pt solid rgb(162, 169, 177); border-top-style:none; padding:2.4pt 4.8pt;'><p style='margin:12pt 0in; text-align:center;'><span style='color:rgb(32,33,34); font-family:Arial, sans-serif; font-size:10.5pt;'>4.4 °C</span></p></td><td style='border-bottom:1pt solid rgb(162, 169, 177); border-left-style:none; border-right:1pt solid rgb(162, 169, 177); border-top-style:none; padding:2.4pt 4.8pt;'><p style='margin:12pt 0in; text-align:center;'><span style='color:rgb(32,33,34); font-family:Arial, sans-serif; font-size:10.5pt;'>3.3 – 5.7</span></p></td></tr></tbody></table></figure><p>While the 8.5 scenario is no longer generally considered likely, SSP3 7.0 has been included and is considered the high end of possibilities. SSP5 8.5 has been retained since many organizations report to this threshold. The warming associated with SSP2 4.5 is equivalent to the global targets set at the 2021 United Nations COP26 meetings in Glasgow.&nbsp;</p><p><strong>Processing the Climate Data</strong></p><p>WorldClim provides 20-year averaged outputs for the various SSPs from 24 global climate models. A selection of 13 models were averaged for each variable and time based on&nbsp;<a target='_blank' href='https://rmets.onlinelibrary.wiley.com/doi/full/10.1002/joc.7566' rel='nofollow ugc noopener noreferrer'>Mahony et al 2022</a>. These models included ACCESS-ESM1-5, BCC-CSM2-MR, CanESM5, CNRM-ESM2-1, EC-Earth3-Veg, GFDL-ESM4, GISS-E2-1-G, INM-CM5-0,&nbsp;&nbsp;IPSL-CM6A-LR, MIROC6, MPI-ESM1-2-HR, MRI-ESM2-0, UKESM1-0-LL. GFDL-ESM4 was not available for SSP2 4.5 or SSP5 8.5.&nbsp;</p><p><strong>Accessing the Multidimensional Information</strong></p><p>The time and SSP scenario are built into the layer using a multidimensional raster. Enable the time slider to move across the 20-year average periods. In ArcGIS Online and Pro, use the Multidimensional Filter to select the SSP (SSP2 4.5 is the default).&nbsp;<br /><br /><strong>What can you do with this layer?</strong></p><p>These multidimensional imagery tiles support analysis using ArcGIS Online or Pro. Use the&nbsp;<a target='_blank' href='https://arcgis.com/home/item.html?id=e56c9cb70aa949adb791c4311003d9ae' rel='nofollow ugc noopener noreferrer'>Bioclimate Baseline layer</a>&nbsp;to see the difference in pixels and calculate change from the historic period into the future. Use the&nbsp;<a target='_blank' href='https://pro.arcgis.com/en/pro-app/latest/help/data/imagery/an-overview-of-multidimensional-raster-data.htm' rel='nofollow ugc noopener noreferrer'>Multidimensional&nbsp;</a>tab in ArcGIS Pro to access a variety of useful tools. Each layer or variable can be styled using the Image Display options.&nbsp;</p><p><strong>Known Quality Issues</strong>&nbsp;</p><p>Each model is downscaled from ~100km resolution to ~5km resolution by WorldClim. Some artifacts are inevitable, especially at a global scale. Some variables have distinct transitions, especially in Greenland. Also, SSP2 4.5 has missing data for several variables in Antarctica.</p><p><strong>Related Layers</strong></p><p><a target='_blank' href='https://arcgis.com/home/item.html?id=fdaa1b7912e440efb9e29cf5d6156bb0' rel='nofollow ugc noopener noreferrer'>Bioclimate 1&nbsp;&nbsp;Annual Mean Temperature</a><br /><a target='_blank' href='https://arcgis.com/home/item.html?id=8012b34e8c854d6fbcfe4eab437ea397' rel='nofollow ugc noopener noreferrer'>Bioclimate 2&nbsp;&nbsp;Mean Diurnal Range</a><br /><a target='_blank' href='https://arcgis.com/home/item.html?id=ef9f5d6a16ca41ada0c0075a8da46d48' rel='nofollow ugc noopener noreferrer'>Bioclimate 3&nbsp;&nbsp;Isothermality</a><br /><a target='_blank' href='https://arcgis.com/home/item.html?id=64799fea8774463aad909020b6590dc8' rel='nofollow ugc noopener noreferrer'>Bioclimate 4&nbsp;&nbsp;Temperature Seasonality</a><br /><a target='_blank' href='https://arcgis.com/home/item.html?id=8433250e0a4148f5a3889c66e78abdf1' rel='nofollow ugc noopener noreferrer'>Bioclimate 5&nbsp;&nbsp;Max Temperature of Warmest Month</a><br /><a target='_blank' href='https://arcgis.com/home/item.html?id=c531d32ab5d746b88a884b6e54f3216e' rel='nofollow ugc noopener noreferrer'>Bioclimate 6&nbsp;&nbsp;Min Temperature Of Coldest Month</a><br /><a target='_blank' href='https://arcgis.com/home/item.html?id=808cfb3ab1614f8ab7e364de737e9e98' rel='nofollow ugc noopener noreferrer'>Bioclimate 7&nbsp;&nbsp;Temperature Annual Range</a><br /><a target='_blank' href='https://arcgis.com/home/item.html?id=b5990aa16fd94bb691a09449716ed7e5' rel='nofollow ugc noopener noreferrer'>Bioclimate 8&nbsp;&nbsp;Mean Temperature Of Wettest Quarter</a><br /><a target='_blank' href='https://arcgis.com/home/item.html?id=231770161a46467e8de9fdd9fd92dad7' rel='nofollow ugc noopener noreferrer'>Bioclimate 9&nbsp;&nbsp;Mean Temperature Of Driest Quarter</a><br /><a target='_blank' href='https://arcgis.com/home/item.html?id=3b98ddf1c78d4f0c88bd297f85847c68' rel='nofollow ugc noopener noreferrer'>Bioclimate 10&nbsp;&nbsp;Mean Temperature Of Warmest Quarter</a><br /><a target='_blank' href='https://arcgis.com/home/item.html?id=1a96d928c93c4e8fbc6a2391afd1da2f' rel='nofollow ugc noopener noreferrer'>Bioclimate 11&nbsp;&nbsp;Mean Temperature Of Coldest Quarter</a><br /><a target='_blank' href='https://arcgis.com/home/item.html?id=7bc0b8c75b0244b7a8128ae1f398bfc0' rel='nofollow ugc noopener noreferrer'>Bioclimate 12&nbsp;&nbsp;Annual Precipitation</a><br /><a target='_blank' href='https://arcgis.com/home/item.html?id=36fde801c8124f93b46b727b9873c993' rel='nofollow ugc noopener noreferrer'>Bioclimate 13&nbsp;&nbsp;Precipitation Of Wettest Month</a><br /><a target='_blank' href='https://arcgis.com/home/item.html?id=e26b01e4fa0a4aec9c5db991467b31a7' rel='nofollow ugc noopener noreferrer'>Bioclimate 14&nbsp;&nbsp;Precipitation Of Driest Month</a><br /><a target='_blank' href='https://arcgis.com/home/item.html?id=33558b5fef8642338f33918d498f41cf' rel='nofollow ugc noopener noreferrer'>Bioclimate 15&nbsp;&nbsp;Precipitation Seasonality</a><br /><a target='_blank' href='https://arcgis.com/home/item.html?id=1324c4e0c86a40e9b7529e91c6bdf220' rel='nofollow ugc noopener noreferrer'>Bioclimate 16&nbsp;&nbsp;Precipitation Of Wettest Quarter</a><br /><a target='_blank' href='https://arcgis.com/home/item.html?id=86fe2a87fe9144f9a5c330a3b5890df0' rel='nofollow ugc noopener noreferrer'>Bioclimate 17&nbsp;&nbsp;Precipitation Of Driest Quarter</a><br /><a target='_blank' href='https://arcgis.com/home/item.html?id=eb8227050ac24b3bb4a47abb924fbc56' rel='nofollow ugc noopener noreferrer'>Bioclimate 18&nbsp;&nbsp;Precipitation Of Warmest Quarter</a><br /><a target='_blank' href='https://arcgis.com/home/item.html?id=ec067623611d40d086193b21a3a4fce1' rel='nofollow ugc noopener noreferrer'>Bioclimate 19&nbsp;&nbsp;Precipitation Of Coldest Quarter</a><br /><a target='_blank' href='https://arcgis.com/home/item.html?id=e56c9cb70aa949adb791c4311003d9ae' rel='nofollow ugc noopener noreferrer'>Bioclimate Baseline 1970-2000</a></p>",
			"keyword": [
				"esri_environment",
				"retiring-2026-12"
			],
			"issued": "2022-05-12T16:36:07.000Z",
			"modified": "2026-05-13T19:37:21.000Z",
			"publisher": {
				"name": "Esri"
			},
			"contactPoint": {
				"@type": "vcard:Contact",
				"fn": "esri_environment",
				"hasEmail": "{{orgContactEmail}}"
			},
			"accessLevel": "public",
			"spatial": "-180.0000,-90.0000,180.0000,90.0000",
			"license": "<p><img src='https://downloads.esri.com/blogs/arcgisonline/esrilogo_new.png' width='113' height='43' /> This work is licensed under the Esri Master License Agreement.&nbsp;</p><p><a target='_blank' href='https://goto.arcgis.com/termsofuse/viewsummary' rel='nofollow ugc noopener noreferrer'>View Summary</a> | <a target='_blank' href='https://goto.arcgis.com/termsofuse/viewtermsofuse' rel='nofollow ugc noopener noreferrer'>View Terms of Use</a></p>",
			"distribution": [
				{
					"@type": "dcat:Distribution",
					"title": "ArcGIS Hub Dataset",
					"format": "Web Page",
					"mediaType": "text/html",
					"accessURL": "https://www.pacificgeoportal.com/content/esri::bioclimate-projections-03-isothermality"
				},
				{
					"@type": "dcat:Distribution",
					"title": "ArcGIS GeoService",
					"format": "ArcGIS GeoServices REST API",
					"mediaType": "application/json",
					"accessURL": "https://tiledimageservices.arcgis.com/P3ePLMYs2RVChkJx/arcgis/rest/services/Bioclimate_Projections__Isothermality/ImageServer"
				}
			],
			"theme": [
				"geospatial"
			]
		},
		{
			"@type": "dcat:Dataset",
			"identifier": "https://www.arcgis.com/home/item.html?id=8012b34e8c854d6fbcfe4eab437ea397",
			"landingPage": "https://www.pacificgeoportal.com/content/esri::bioclimate-projections-02-mean-diurnal-range",
			"title": "Bioclimate Projections: (02) Mean Diurnal Range",
			"description": "<p><span style='color:#dc143c;'><strong>Retirement Notice:</strong></span><strong>&nbsp;This </strong><a target='_blank' href='https://goto.arcgis.com/termsofuse/beta' rel='nofollow ugc noopener noreferrer'><strong>beta</strong></a><strong> item will be retired in December 2026. A</strong><a target='_blank' href='https://www.arcgis.com/home/item.html?id=316df8611cbc45578233c053100325b8' rel='nofollow ugc noopener noreferrer'><strong> new version of this item</strong></a><strong>&nbsp;is available for your use.</strong> Esri recommends updating your maps and apps to use the new version.</p><p>This layer represents CMIP6 future projections of mean diurnal range. Diurnal range is a measure of daily daytime to nighttime temperature range. However, this layer provides the mean of the monthly temperature ranges (monthly maximum minus monthly minimum). Since the climate data inputs are monthly or averaged months across multiple years, this calculation uses recorded temperature fluctuation within a month to capture diurnal temperature range. Using monthly averages in this manner is mathematically equivalent to calculating the temperature range for each day in a month, and averaging these values for the month.</p><p><a target='_blank' href='https://worldclim.org/' rel='nofollow ugc noopener noreferrer'><span style='background-attachment:initial; background-clip:initial; background-image:initial; background-origin:initial; background-position:initial; background-repeat:initial; background-size:initial;'>WorldClim</span></a><span style='background-attachment:initial; background-clip:initial; background-image:initial; background-origin:initial; background-position:initial; background-repeat:initial; background-size:initial;'>&nbsp;produced this projection as part of a series of&nbsp;</span><a target='_blank' href='https://pubs.usgs.gov/ds/691/ds691.pdf' rel='nofollow ugc noopener noreferrer'><span style='background-attachment:initial; background-clip:initial; background-image:initial; background-origin:initial; background-position:initial; background-repeat:initial; background-size:initial;'>19 bioclimate variables identified by the USGS</span></a><span style='background-attachment:initial; background-clip:initial; background-image:initial; background-origin:initial; background-position:initial; background-repeat:initial; background-size:initial;'>&nbsp;and provides this description:</span><br /><br /><i>\"Bioclimatic variables are derived from the monthly temperature and rainfall values in order to generate more biologically meaningful variables. These are often used in species distribution modeling and related ecological modeling techniques. The bioclimatic variables represent annual trends (e.g., mean annual temperature, annual precipitation) seasonality (e.g., annual range in temperature and precipitation) and extreme or limiting environmental factors (e.g., temperature of the coldest and warmest month, and precipitation of the wet and dry quarters). A quarter is a period of three months (1/4 of the year).\"</i></p><p style='background-attachment:initial; background-clip:initial; background-image:initial; background-origin:initial; background-position:initial; background-repeat:initial; background-size:initial; margin-bottom:0in;'><strong>Time Extent:</strong>&nbsp;averages from 2021-2040, 2041-2060, 2061-2080, 2081-2100<br /><strong>Units:</strong>&nbsp;deg C<br /><strong>Cell Size:</strong> 2.5 minutes (~5 km)<br /><strong>Source Type:</strong> Stretched<br /><strong>Pixel Type:</strong> 32 Bit Float<br /><strong>Data Projection:</strong> GCS WGS84<br /><strong>Mosaic Projection:</strong> GCS WGS84<br /><strong>Extent:</strong> Global<br /><strong>Source:</strong> <a target='_blank' href='https://worldclim.org/data/cmip6/cmip6_clim2.5m.html' rel='nofollow ugc noopener noreferrer'>WorldClim CMIP6 Bioclimate</a></p><p>&nbsp;</p><p><strong>Climate Scenarios</strong></p><p>The CMIP6 climate experiments use&nbsp;<a target='_blank' href='https://www.carbonbrief.org/explainer-how-shared-socioeconomic-pathways-explore-future-climate-change/' rel='nofollow ugc noopener noreferrer'>Shared Socioeconomic Pathways (SSPs)</a>&nbsp;to model future climate scenarios. Each SSP pairs a human/community behavior component with the traditional RCP greenhouse gas forcing from the previous CMIP5. Three SSPs were chosen by Esri to be included in the service based on user requests: SSP2 4.5, SSP3 7.0 and SSP5 8.5.</p><figure><table style='background-color:rgb(248, 249, 250); border-collapse:collapse;' width='850' cellpadding='0' cellspacing='0' border='1'><tbody><tr><td style='background-color:rgb(234, 236, 240); border:1pt solid rgb(162, 169, 177); padding:2.4pt 4.8pt;'><p style='margin:12pt 0in; text-align:center;'><span style='color:rgb(32,33,34); font-family:Arial, sans-serif; font-size:10.5pt;'><strong>SSP</strong></span></p></td><td style='background-color:rgb(234, 236, 240); border-bottom:1pt solid rgb(162, 169, 177); border-image:initial; border-left-style:none; border-right:1pt solid rgb(162, 169, 177); border-top:1pt solid rgb(162, 169, 177); padding:2.4pt 4.8pt;'><p style='margin:12pt 0in; text-align:center;'><span style='color:rgb(32,33,34); font-family:Arial, sans-serif; font-size:10.5pt;'><strong>Scenario</strong></span></p></td><td style='background-color:rgb(234, 236, 240); border-bottom:1pt solid rgb(162, 169, 177); border-image:initial; border-left-style:none; border-right:1pt solid rgb(162, 169, 177); border-top:1pt solid rgb(162, 169, 177); padding:2.4pt 4.8pt;'><p style='margin:12pt 0in; text-align:center;'><span style='color:rgb(32,33,34); font-family:Arial, sans-serif; font-size:10.5pt;'><strong>Estimated warming</strong></span><br /><span style='color:rgb(32,33,34); font-family:Arial, sans-serif; font-size:10.5pt;'><strong>(2041–2060)</strong></span></p></td><td style='background-color:rgb(234, 236, 240); border-bottom:1pt solid rgb(162, 169, 177); border-image:initial; border-left-style:none; border-right:1pt solid rgb(162, 169, 177); border-top:1pt solid rgb(162, 169, 177); padding:2.4pt 4.8pt;'><p style='margin:12pt 0in; text-align:center;'><span style='color:rgb(32,33,34); font-family:Arial, sans-serif; font-size:10.5pt;'><strong>Estimated warming</strong></span><br /><span style='color:rgb(32,33,34); font-family:Arial, sans-serif; font-size:10.5pt;'><strong>(2081–2100)</strong></span></p></td><td style='background-color:rgb(234, 236, 240); border-bottom:1pt solid rgb(162, 169, 177); border-image:initial; border-left-style:none; border-right:1pt solid rgb(162, 169, 177); border-top:1pt solid rgb(162, 169, 177); padding:2.4pt 4.8pt;'><p style='margin:12pt 0in; text-align:center;'><span style='color:rgb(32,33,34); font-family:Arial, sans-serif; font-size:10.5pt;'><strong>Very likely range in °C</strong></span><br /><span style='color:rgb(32,33,34); font-family:Arial, sans-serif; font-size:10.5pt;'><strong>(2081–2100)</strong></span></p></td></tr><tr><td style='border-bottom:1pt solid rgb(162, 169, 177); border-image:initial; border-left:1pt solid rgb(162, 169, 177); border-right:1pt solid rgb(162, 169, 177); border-top-style:none; padding:2.4pt 4.8pt;'><p style='margin:12pt 0in; text-align:center;'><span style='color:rgb(32,33,34); font-family:Arial, sans-serif; font-size:10.5pt;'>SSP2-4.5</span></p></td><td style='border-bottom:1pt solid rgb(162, 169, 177); border-left-style:none; border-right:1pt solid rgb(162, 169, 177); border-top-style:none; padding:2.4pt 4.8pt;'><p style='margin:12pt 0in; text-align:center;'><span style='color:rgb(32,33,34); font-family:Arial, sans-serif; font-size:10.5pt;'>intermediate GHG emissions:</span><br /><span style='color:rgb(32,33,34); font-family:Arial, sans-serif; font-size:10.5pt;'>CO</span><span style='color:rgb(32,33,34); font-family:Arial, sans-serif; font-size:8.5pt;'><sub>2</sub></span><span style='color:rgb(32,33,34); font-family:Arial, sans-serif; font-size:10.5pt;'>&nbsp;emissions around current levels until 2050, then falling but not reaching net zero by 2100</span></p></td><td style='border-bottom:1pt solid rgb(162, 169, 177); border-left-style:none; border-right:1pt solid rgb(162, 169, 177); border-top-style:none; padding:2.4pt 4.8pt;'><p style='margin:12pt 0in; text-align:center;'><span style='color:rgb(32,33,34); font-family:Arial, sans-serif; font-size:10.5pt;'>2.0 °C</span></p></td><td style='border-bottom:1pt solid rgb(162, 169, 177); border-left-style:none; border-right:1pt solid rgb(162, 169, 177); border-top-style:none; padding:2.4pt 4.8pt;'><p style='margin:12pt 0in; text-align:center;'><span style='color:rgb(32,33,34); font-family:Arial, sans-serif; font-size:10.5pt;'>2.7 °C</span></p></td><td style='border-bottom:1pt solid rgb(162, 169, 177); border-left-style:none; border-right:1pt solid rgb(162, 169, 177); border-top-style:none; padding:2.4pt 4.8pt;'><p style='margin:12pt 0in; text-align:center;'><span style='color:rgb(32,33,34); font-family:Arial, sans-serif; font-size:10.5pt;'>2.1 – 3.5</span></p></td></tr><tr><td style='border-bottom:1pt solid rgb(162, 169, 177); border-image:initial; border-left:1pt solid rgb(162, 169, 177); border-right:1pt solid rgb(162, 169, 177); border-top-style:none; padding:2.4pt 4.8pt;'><p style='margin:12pt 0in; text-align:center;'><span style='color:rgb(32,33,34); font-family:Arial, sans-serif; font-size:10.5pt;'>SSP3-7.0</span></p></td><td style='border-bottom:1pt solid rgb(162, 169, 177); border-left-style:none; border-right:1pt solid rgb(162, 169, 177); border-top-style:none; padding:2.4pt 4.8pt;'><p style='margin:12pt 0in; text-align:center;'><span style='color:rgb(32,33,34); font-family:Arial, sans-serif; font-size:10.5pt;'>high GHG emissions:</span><br /><span style='color:rgb(32,33,34); font-family:Arial, sans-serif; font-size:10.5pt;'>CO</span><span style='color:rgb(32,33,34); font-family:Arial, sans-serif; font-size:8.5pt;'><sub>2</sub></span><span style='color:rgb(32,33,34); font-family:Arial, sans-serif; font-size:10.5pt;'>&nbsp;emissions double by 2100</span></p></td><td style='border-bottom:1pt solid rgb(162, 169, 177); border-left-style:none; border-right:1pt solid rgb(162, 169, 177); border-top-style:none; padding:2.4pt 4.8pt;'><p style='margin:12pt 0in; text-align:center;'><span style='color:rgb(32,33,34); font-family:Arial, sans-serif; font-size:10.5pt;'>2.1 °C</span></p></td><td style='border-bottom:1pt solid rgb(162, 169, 177); border-left-style:none; border-right:1pt solid rgb(162, 169, 177); border-top-style:none; padding:2.4pt 4.8pt;'><p style='margin:12pt 0in; text-align:center;'><span style='color:rgb(32,33,34); font-family:Arial, sans-serif; font-size:10.5pt;'>3.6 °C</span></p></td><td style='border-bottom:1pt solid rgb(162, 169, 177); border-left-style:none; border-right:1pt solid rgb(162, 169, 177); border-top-style:none; padding:2.4pt 4.8pt;'><p style='margin:12pt 0in; text-align:center;'><span style='color:rgb(32,33,34); font-family:Arial, sans-serif; font-size:10.5pt;'>2.8 – 4.6</span></p></td></tr><tr><td style='border-bottom:1pt solid rgb(162, 169, 177); border-image:initial; border-left:1pt solid rgb(162, 169, 177); border-right:1pt solid rgb(162, 169, 177); border-top-style:none; padding:2.4pt 4.8pt;'><p style='margin:12pt 0in; text-align:center;'><span style='color:rgb(32,33,34); font-family:Arial, sans-serif; font-size:10.5pt;'>SSP5-8.5</span></p></td><td style='border-bottom:1pt solid rgb(162, 169, 177); border-left-style:none; border-right:1pt solid rgb(162, 169, 177); border-top-style:none; padding:2.4pt 4.8pt;'><p style='margin:12pt 0in; text-align:center;'><span style='color:rgb(32,33,34); font-family:Arial, sans-serif; font-size:10.5pt;'>very high GHG emissions:</span><br /><span style='color:rgb(32,33,34); font-family:Arial, sans-serif; font-size:10.5pt;'>CO</span><span style='color:rgb(32,33,34); font-family:Arial, sans-serif; font-size:8.5pt;'><sub>2</sub></span><span style='color:rgb(32,33,34); font-family:Arial, sans-serif; font-size:10.5pt;'>&nbsp;emissions triple by 2075</span></p></td><td style='border-bottom:1pt solid rgb(162, 169, 177); border-left-style:none; border-right:1pt solid rgb(162, 169, 177); border-top-style:none; padding:2.4pt 4.8pt;'><p style='margin:12pt 0in; text-align:center;'><span style='color:rgb(32,33,34); font-family:Arial, sans-serif; font-size:10.5pt;'>2.4 °C</span></p></td><td style='border-bottom:1pt solid rgb(162, 169, 177); border-left-style:none; border-right:1pt solid rgb(162, 169, 177); border-top-style:none; padding:2.4pt 4.8pt;'><p style='margin:12pt 0in; text-align:center;'><span style='color:rgb(32,33,34); font-family:Arial, sans-serif; font-size:10.5pt;'>4.4 °C</span></p></td><td style='border-bottom:1pt solid rgb(162, 169, 177); border-left-style:none; border-right:1pt solid rgb(162, 169, 177); border-top-style:none; padding:2.4pt 4.8pt;'><p style='margin:12pt 0in; text-align:center;'><span style='color:rgb(32,33,34); font-family:Arial, sans-serif; font-size:10.5pt;'>3.3 – 5.7</span></p></td></tr></tbody></table></figure><p>While the 8.5 scenario is no longer generally considered likely, SSP3 7.0 has been included and is considered the high end of possibilities. SSP5 8.5 has been retained since many organizations report to this threshold. The warming associated with SSP2 4.5 is equivalent to the global targets set at the 2021 United Nations COP26 meetings in Glasgow.&nbsp;</p><p><strong>Processing the Climate Data</strong></p><p>WorldClim provides 20-year averaged outputs for the various SSPs from 24 global climate models. A selection of 13 models were averaged for each variable and time based on&nbsp;<a target='_blank' href='https://rmets.onlinelibrary.wiley.com/doi/full/10.1002/joc.7566' rel='nofollow ugc noopener noreferrer'>Mahony et al 2022</a>. These models included ACCESS-ESM1-5, BCC-CSM2-MR, CanESM5, CNRM-ESM2-1, EC-Earth3-Veg, GFDL-ESM4, GISS-E2-1-G, INM-CM5-0,&nbsp;&nbsp;IPSL-CM6A-LR, MIROC6, MPI-ESM1-2-HR, MRI-ESM2-0, UKESM1-0-LL. GFDL-ESM4 was not available for SSP2 4.5 or SSP5 8.5.&nbsp;</p><p><strong>Accessing the Multidimensional Information</strong></p><p>The time and SSP scenario are built into the layer using a multidimensional raster. Enable the time slider to move across the 20-year average periods. In ArcGIS Online and Pro, use the Multidimensional Filter to select the SSP (SSP2 4.5 is the default).&nbsp;<br /><br /><strong>What can you do with this layer?</strong></p><p>These multidimensional imagery tiles support analysis using ArcGIS Online or Pro. Use the&nbsp;<a target='_blank' href='https://arcgis.com/home/item.html?id=e56c9cb70aa949adb791c4311003d9ae' rel='nofollow ugc noopener noreferrer'>Bioclimate Baseline layer</a>&nbsp;to see the difference in pixels and calculate change from the historic period into the future. Use the&nbsp;<a target='_blank' href='https://pro.arcgis.com/en/pro-app/latest/help/data/imagery/an-overview-of-multidimensional-raster-data.htm' rel='nofollow ugc noopener noreferrer'>Multidimensional&nbsp;</a>tab in ArcGIS Pro to access a variety of useful tools. Each layer or variable can be styled using the Image Display options.&nbsp;</p><p><strong>Known Quality Issues</strong></p><p>Each model is downscaled from ~100km resolution to ~5km resolution by WorldClim. Some artifacts are inevitable, especially at a global scale. Some variables have distinct transitions, especially in Greenland. Also, SSP2 4.5 has missing data for several variables in Antarctica.</p><p><strong>Related Layers</strong></p><p><a target='_blank' href='https://arcgis.com/home/item.html?id=fdaa1b7912e440efb9e29cf5d6156bb0' rel='nofollow ugc noopener noreferrer'>Bioclimate 1&nbsp;&nbsp;Annual Mean Temperature</a><br /><a target='_blank' href='https://arcgis.com/home/item.html?id=8012b34e8c854d6fbcfe4eab437ea397' rel='nofollow ugc noopener noreferrer'>Bioclimate 2&nbsp;&nbsp;Mean Diurnal Range</a><br /><a target='_blank' href='https://arcgis.com/home/item.html?id=ef9f5d6a16ca41ada0c0075a8da46d48' rel='nofollow ugc noopener noreferrer'>Bioclimate 3&nbsp;&nbsp;Isothermality</a><br /><a target='_blank' href='https://arcgis.com/home/item.html?id=64799fea8774463aad909020b6590dc8' rel='nofollow ugc noopener noreferrer'>Bioclimate 4&nbsp;&nbsp;Temperature Seasonality</a><br /><a target='_blank' href='https://arcgis.com/home/item.html?id=8433250e0a4148f5a3889c66e78abdf1' rel='nofollow ugc noopener noreferrer'>Bioclimate 5&nbsp;&nbsp;Max Temperature of Warmest Month</a><br /><a target='_blank' href='https://arcgis.com/home/item.html?id=c531d32ab5d746b88a884b6e54f3216e' rel='nofollow ugc noopener noreferrer'>Bioclimate 6&nbsp;&nbsp;Min Temperature Of Coldest Month</a><br /><a target='_blank' href='https://arcgis.com/home/item.html?id=808cfb3ab1614f8ab7e364de737e9e98' rel='nofollow ugc noopener noreferrer'>Bioclimate 7&nbsp;&nbsp;Temperature Annual Range</a><br /><a target='_blank' href='https://arcgis.com/home/item.html?id=b5990aa16fd94bb691a09449716ed7e5' rel='nofollow ugc noopener noreferrer'>Bioclimate 8&nbsp;&nbsp;Mean Temperature Of Wettest Quarter</a><br /><a target='_blank' href='https://arcgis.com/home/item.html?id=231770161a46467e8de9fdd9fd92dad7' rel='nofollow ugc noopener noreferrer'>Bioclimate 9&nbsp;&nbsp;Mean Temperature Of Driest Quarter</a><br /><a target='_blank' href='https://arcgis.com/home/item.html?id=3b98ddf1c78d4f0c88bd297f85847c68' rel='nofollow ugc noopener noreferrer'>Bioclimate 10&nbsp;&nbsp;Mean Temperature Of Warmest Quarter</a><br /><a target='_blank' href='https://arcgis.com/home/item.html?id=1a96d928c93c4e8fbc6a2391afd1da2f' rel='nofollow ugc noopener noreferrer'>Bioclimate 11&nbsp;&nbsp;Mean Temperature Of Coldest Quarter</a><br /><a target='_blank' href='https://arcgis.com/home/item.html?id=7bc0b8c75b0244b7a8128ae1f398bfc0' rel='nofollow ugc noopener noreferrer'>Bioclimate 12&nbsp;&nbsp;Annual Precipitation</a><br /><a target='_blank' href='https://arcgis.com/home/item.html?id=36fde801c8124f93b46b727b9873c993' rel='nofollow ugc noopener noreferrer'>Bioclimate 13&nbsp;&nbsp;Precipitation Of Wettest Month</a><br /><a target='_blank' href='https://arcgis.com/home/item.html?id=e26b01e4fa0a4aec9c5db991467b31a7' rel='nofollow ugc noopener noreferrer'>Bioclimate 14&nbsp;&nbsp;Precipitation Of Driest Month</a><br /><a target='_blank' href='https://arcgis.com/home/item.html?id=33558b5fef8642338f33918d498f41cf' rel='nofollow ugc noopener noreferrer'>Bioclimate 15&nbsp;&nbsp;Precipitation Seasonality</a><br /><a target='_blank' href='https://arcgis.com/home/item.html?id=1324c4e0c86a40e9b7529e91c6bdf220' rel='nofollow ugc noopener noreferrer'>Bioclimate 16&nbsp;&nbsp;Precipitation Of Wettest Quarter</a><br /><a target='_blank' href='https://arcgis.com/home/item.html?id=86fe2a87fe9144f9a5c330a3b5890df0' rel='nofollow ugc noopener noreferrer'>Bioclimate 17&nbsp;&nbsp;Precipitation Of Driest Quarter</a><br /><a target='_blank' href='https://arcgis.com/home/item.html?id=eb8227050ac24b3bb4a47abb924fbc56' rel='nofollow ugc noopener noreferrer'>Bioclimate 18&nbsp;&nbsp;Precipitation Of Warmest Quarter</a><br /><a target='_blank' href='https://arcgis.com/home/item.html?id=ec067623611d40d086193b21a3a4fce1' rel='nofollow ugc noopener noreferrer'>Bioclimate 19&nbsp;&nbsp;Precipitation Of Coldest Quarter</a><br /><a target='_blank' href='https://arcgis.com/home/item.html?id=e56c9cb70aa949adb791c4311003d9ae' rel='nofollow ugc noopener noreferrer'>Bioclimate Baseline 1970-2000</a></p>",
			"keyword": [
				"esri_environment",
				"retiring-2026-12"
			],
			"issued": "2022-05-12T16:40:21.000Z",
			"modified": "2026-05-13T19:37:03.000Z",
			"publisher": {
				"name": "Esri"
			},
			"contactPoint": {
				"@type": "vcard:Contact",
				"fn": "esri_environment",
				"hasEmail": "{{orgContactEmail}}"
			},
			"accessLevel": "public",
			"spatial": "-180.0000,-90.0000,180.0000,90.0000",
			"license": "<p><img src='https://downloads.esri.com/blogs/arcgisonline/esrilogo_new.png' width='113' height='43' /> This work is licensed under the Esri Master License Agreement.&nbsp;</p><p><a target='_blank' href='https://goto.arcgis.com/termsofuse/viewsummary' rel='nofollow ugc noopener noreferrer'>View Summary</a> | <a target='_blank' href='https://goto.arcgis.com/termsofuse/viewtermsofuse' rel='nofollow ugc noopener noreferrer'>View Terms of Use</a></p>",
			"distribution": [
				{
					"@type": "dcat:Distribution",
					"title": "ArcGIS Hub Dataset",
					"format": "Web Page",
					"mediaType": "text/html",
					"accessURL": "https://www.pacificgeoportal.com/content/esri::bioclimate-projections-02-mean-diurnal-range"
				},
				{
					"@type": "dcat:Distribution",
					"title": "ArcGIS GeoService",
					"format": "ArcGIS GeoServices REST API",
					"mediaType": "application/json",
					"accessURL": "https://tiledimageservices.arcgis.com/P3ePLMYs2RVChkJx/arcgis/rest/services/Bioclimate_Projections__Mean_Diurnal_Range/ImageServer"
				}
			],
			"theme": [
				"geospatial"
			]
		},
		{
			"@type": "dcat:Dataset",
			"identifier": "https://www.arcgis.com/home/item.html?id=36fde801c8124f93b46b727b9873c993",
			"landingPage": "https://www.pacificgeoportal.com/content/esri::bioclimate-projections-13-precipitation-of-wettest-month",
			"title": "Bioclimate Projections: (13) Precipitation of Wettest Month",
			"description": "<p><span style='color:#dc143c;'><strong>Retirement Notice:</strong></span><strong>&nbsp;This </strong><a target='_blank' href='https://goto.arcgis.com/termsofuse/beta' rel='nofollow ugc noopener noreferrer'><strong>beta</strong></a><strong> will be retired in December 2026. A</strong><a target='_blank' href='https://www.arcgis.com/home/item.html?id=26f4859e6091437697aae42069d04edf' rel='nofollow ugc noopener noreferrer'><strong> new version of this item</strong></a><strong>&nbsp;is available for your use. </strong>Esri recommends updating your maps and apps to use the new version.</p><div><p><span style='background-attachment:initial; background-clip:initial; background-image:initial; background-origin:initial; background-position:initial; background-repeat:initial; background-size:initial;'>This layer represents CMIP6 future projections of total precipitation during the wettest month of the year. This layer can be used to compare with recent climate histories to better understand the potential impacts of future climate change.</span></p><p><a target='_blank' href='https://worldclim.org/' rel='nofollow ugc noopener noreferrer'><span style='background-attachment:initial; background-clip:initial; background-image:initial; background-origin:initial; background-position:initial; background-repeat:initial; background-size:initial;'>WorldClim</span></a><span style='background-attachment:initial; background-clip:initial; background-image:initial; background-origin:initial; background-position:initial; background-repeat:initial; background-size:initial;'>&nbsp;produced this projection as part of a series of&nbsp;</span><a target='_blank' href='https://pubs.usgs.gov/ds/691/ds691.pdf' rel='nofollow ugc noopener noreferrer'><span style='background-attachment:initial; background-clip:initial; background-image:initial; background-origin:initial; background-position:initial; background-repeat:initial; background-size:initial;'>19 bioclimate variables identified by the USGS</span></a><span style='background-attachment:initial; background-clip:initial; background-image:initial; background-origin:initial; background-position:initial; background-repeat:initial; background-size:initial;'>&nbsp;and provides this description:</span><br /><br /><i>\"Bioclimatic variables are derived from the monthly temperature and rainfall values in order to generate more biologically meaningful variables. These are often used in species distribution modeling and related ecological modeling techniques. The bioclimatic variables represent annual trends (e.g., mean annual temperature, annual precipitation) seasonality (e.g., annual range in temperature and precipitation) and extreme or limiting environmental factors (e.g., temperature of the coldest and warmest month, and precipitation of the wet and dry quarters). A quarter is a period of three months (1/4 of the year).\"</i></p><p style='background-attachment:initial; background-clip:initial; background-image:initial; background-origin:initial; background-position:initial; background-repeat:initial; background-size:initial; margin-bottom:0in;'><strong>Time Extent:</strong>&nbsp;averages from 2021-2040, 2041-2060, 2061-2080, 2081-2100<br /><strong>Units:</strong>&nbsp;mm<br /><strong>Cell Size:</strong> 2.5 minutes (~5 km)<br /><strong>Source Type:</strong> Stretched<br /><strong>Pixel Type:</strong> 32 Bit Float<br /><strong>Data Projection:</strong> GCS WGS84<br /><strong>Mosaic Projection:</strong> GCS WGS84<br /><strong>Extent:</strong> Global<br /><strong>Source:</strong> <a target='_blank' href='https://worldclim.org/data/cmip6/cmip6_clim2.5m.html' rel='nofollow ugc noopener noreferrer'>WorldClim CMIP6 Bioclimate</a></p><p>&nbsp;</p><p><strong>Climate Scenarios</strong></p><p>The CMIP6 climate experiments use&nbsp;<a target='_blank' href='https://www.carbonbrief.org/explainer-how-shared-socioeconomic-pathways-explore-future-climate-change/' rel='nofollow ugc noopener noreferrer'>Shared Socioeconomic Pathways (SSPs)</a>&nbsp;to model future climate scenarios. Each SSP pairs a human/community behavior component with the traditional RCP greenhouse gas forcing from the previous CMIP5. Three SSPs were chosen by Esri to be included in the service based on user requests: SSP2 4.5, SSP3 7.0 and SSP5 8.5.</p><figure><table style='background-color:rgb(248, 249, 250); border-collapse:collapse;' width='850' cellpadding='0' cellspacing='0' border='1'><tbody><tr><td style='background-color:rgb(234, 236, 240); border:1pt solid rgb(162, 169, 177); padding:2.4pt 4.8pt;'><p style='margin:12pt 0in; text-align:center;'><span style='color:rgb(32,33,34); font-family:Arial, sans-serif; font-size:10.5pt;'><strong>SSP</strong></span></p></td><td style='background-color:rgb(234, 236, 240); border-bottom:1pt solid rgb(162, 169, 177); border-image:initial; border-left-style:none; border-right:1pt solid rgb(162, 169, 177); border-top:1pt solid rgb(162, 169, 177); padding:2.4pt 4.8pt;'><p style='margin:12pt 0in; text-align:center;'><span style='color:rgb(32,33,34); font-family:Arial, sans-serif; font-size:10.5pt;'><strong>Scenario</strong></span></p></td><td style='background-color:rgb(234, 236, 240); border-bottom:1pt solid rgb(162, 169, 177); border-image:initial; border-left-style:none; border-right:1pt solid rgb(162, 169, 177); border-top:1pt solid rgb(162, 169, 177); padding:2.4pt 4.8pt;'><p style='margin:12pt 0in; text-align:center;'><span style='color:rgb(32,33,34); font-family:Arial, sans-serif; font-size:10.5pt;'><strong>Estimated warming</strong></span><br /><span style='color:rgb(32,33,34); font-family:Arial, sans-serif; font-size:10.5pt;'><strong>(2041–2060)</strong></span></p></td><td style='background-color:rgb(234, 236, 240); border-bottom:1pt solid rgb(162, 169, 177); border-image:initial; border-left-style:none; border-right:1pt solid rgb(162, 169, 177); border-top:1pt solid rgb(162, 169, 177); padding:2.4pt 4.8pt;'><p style='margin:12pt 0in; text-align:center;'><span style='color:rgb(32,33,34); font-family:Arial, sans-serif; font-size:10.5pt;'><strong>Estimated warming</strong></span><br /><span style='color:rgb(32,33,34); font-family:Arial, sans-serif; font-size:10.5pt;'><strong>(2081–2100)</strong></span></p></td><td style='background-color:rgb(234, 236, 240); border-bottom:1pt solid rgb(162, 169, 177); border-image:initial; border-left-style:none; border-right:1pt solid rgb(162, 169, 177); border-top:1pt solid rgb(162, 169, 177); padding:2.4pt 4.8pt;'><p style='margin:12pt 0in; text-align:center;'><span style='color:rgb(32,33,34); font-family:Arial, sans-serif; font-size:10.5pt;'><strong>Very likely range in °C</strong></span><br /><span style='color:rgb(32,33,34); font-family:Arial, sans-serif; font-size:10.5pt;'><strong>(2081–2100)</strong></span></p></td></tr><tr><td style='border-bottom:1pt solid rgb(162, 169, 177); border-image:initial; border-left:1pt solid rgb(162, 169, 177); border-right:1pt solid rgb(162, 169, 177); border-top-style:none; padding:2.4pt 4.8pt;'><p style='margin:12pt 0in; text-align:center;'><span style='color:rgb(32,33,34); font-family:Arial, sans-serif; font-size:10.5pt;'>SSP2-4.5</span></p></td><td style='border-bottom:1pt solid rgb(162, 169, 177); border-left-style:none; border-right:1pt solid rgb(162, 169, 177); border-top-style:none; padding:2.4pt 4.8pt;'><p style='margin:12pt 0in; text-align:center;'><span style='color:rgb(32,33,34); font-family:Arial, sans-serif; font-size:10.5pt;'>intermediate GHG emissions:</span><br /><span style='color:rgb(32,33,34); font-family:Arial, sans-serif; font-size:10.5pt;'>CO</span><span style='color:rgb(32,33,34); font-family:Arial, sans-serif; font-size:8.5pt;'><sub>2</sub></span><span style='color:rgb(32,33,34); font-family:Arial, sans-serif; font-size:10.5pt;'>&nbsp;emissions around current levels until 2050, then falling but not reaching net zero by 2100</span></p></td><td style='border-bottom:1pt solid rgb(162, 169, 177); border-left-style:none; border-right:1pt solid rgb(162, 169, 177); border-top-style:none; padding:2.4pt 4.8pt;'><p style='margin:12pt 0in; text-align:center;'><span style='color:rgb(32,33,34); font-family:Arial, sans-serif; font-size:10.5pt;'>2.0 °C</span></p></td><td style='border-bottom:1pt solid rgb(162, 169, 177); border-left-style:none; border-right:1pt solid rgb(162, 169, 177); border-top-style:none; padding:2.4pt 4.8pt;'><p style='margin:12pt 0in; text-align:center;'><span style='color:rgb(32,33,34); font-family:Arial, sans-serif; font-size:10.5pt;'>2.7 °C</span></p></td><td style='border-bottom:1pt solid rgb(162, 169, 177); border-left-style:none; border-right:1pt solid rgb(162, 169, 177); border-top-style:none; padding:2.4pt 4.8pt;'><p style='margin:12pt 0in; text-align:center;'><span style='color:rgb(32,33,34); font-family:Arial, sans-serif; font-size:10.5pt;'>2.1 – 3.5</span></p></td></tr><tr><td style='border-bottom:1pt solid rgb(162, 169, 177); border-image:initial; border-left:1pt solid rgb(162, 169, 177); border-right:1pt solid rgb(162, 169, 177); border-top-style:none; padding:2.4pt 4.8pt;'><p style='margin:12pt 0in; text-align:center;'><span style='color:rgb(32,33,34); font-family:Arial, sans-serif; font-size:10.5pt;'>SSP3-7.0</span></p></td><td style='border-bottom:1pt solid rgb(162, 169, 177); border-left-style:none; border-right:1pt solid rgb(162, 169, 177); border-top-style:none; padding:2.4pt 4.8pt;'><p style='margin:12pt 0in; text-align:center;'><span style='color:rgb(32,33,34); font-family:Arial, sans-serif; font-size:10.5pt;'>high GHG emissions:</span><br /><span style='color:rgb(32,33,34); font-family:Arial, sans-serif; font-size:10.5pt;'>CO</span><span style='color:rgb(32,33,34); font-family:Arial, sans-serif; font-size:8.5pt;'><sub>2</sub></span><span style='color:rgb(32,33,34); font-family:Arial, sans-serif; font-size:10.5pt;'>&nbsp;emissions double by 2100</span></p></td><td style='border-bottom:1pt solid rgb(162, 169, 177); border-left-style:none; border-right:1pt solid rgb(162, 169, 177); border-top-style:none; padding:2.4pt 4.8pt;'><p style='margin:12pt 0in; text-align:center;'><span style='color:rgb(32,33,34); font-family:Arial, sans-serif; font-size:10.5pt;'>2.1 °C</span></p></td><td style='border-bottom:1pt solid rgb(162, 169, 177); border-left-style:none; border-right:1pt solid rgb(162, 169, 177); border-top-style:none; padding:2.4pt 4.8pt;'><p style='margin:12pt 0in; text-align:center;'><span style='color:rgb(32,33,34); font-family:Arial, sans-serif; font-size:10.5pt;'>3.6 °C</span></p></td><td style='border-bottom:1pt solid rgb(162, 169, 177); border-left-style:none; border-right:1pt solid rgb(162, 169, 177); border-top-style:none; padding:2.4pt 4.8pt;'><p style='margin:12pt 0in; text-align:center;'><span style='color:rgb(32,33,34); font-family:Arial, sans-serif; font-size:10.5pt;'>2.8 – 4.6</span></p></td></tr><tr><td style='border-bottom:1pt solid rgb(162, 169, 177); border-image:initial; border-left:1pt solid rgb(162, 169, 177); border-right:1pt solid rgb(162, 169, 177); border-top-style:none; padding:2.4pt 4.8pt;'><p style='margin:12pt 0in; text-align:center;'><span style='color:rgb(32,33,34); font-family:Arial, sans-serif; font-size:10.5pt;'>SSP5-8.5</span></p></td><td style='border-bottom:1pt solid rgb(162, 169, 177); border-left-style:none; border-right:1pt solid rgb(162, 169, 177); border-top-style:none; padding:2.4pt 4.8pt;'><p style='margin:12pt 0in; text-align:center;'><span style='color:rgb(32,33,34); font-family:Arial, sans-serif; font-size:10.5pt;'>very high GHG emissions:</span><br /><span style='color:rgb(32,33,34); font-family:Arial, sans-serif; font-size:10.5pt;'>CO</span><span style='color:rgb(32,33,34); font-family:Arial, sans-serif; font-size:8.5pt;'><sub>2</sub></span><span style='color:rgb(32,33,34); font-family:Arial, sans-serif; font-size:10.5pt;'>&nbsp;emissions triple by 2075</span></p></td><td style='border-bottom:1pt solid rgb(162, 169, 177); border-left-style:none; border-right:1pt solid rgb(162, 169, 177); border-top-style:none; padding:2.4pt 4.8pt;'><p style='margin:12pt 0in; text-align:center;'><span style='color:rgb(32,33,34); font-family:Arial, sans-serif; font-size:10.5pt;'>2.4 °C</span></p></td><td style='border-bottom:1pt solid rgb(162, 169, 177); border-left-style:none; border-right:1pt solid rgb(162, 169, 177); border-top-style:none; padding:2.4pt 4.8pt;'><p style='margin:12pt 0in; text-align:center;'><span style='color:rgb(32,33,34); font-family:Arial, sans-serif; font-size:10.5pt;'>4.4 °C</span></p></td><td style='border-bottom:1pt solid rgb(162, 169, 177); border-left-style:none; border-right:1pt solid rgb(162, 169, 177); border-top-style:none; padding:2.4pt 4.8pt;'><p style='margin:12pt 0in; text-align:center;'><span style='color:rgb(32,33,34); font-family:Arial, sans-serif; font-size:10.5pt;'>3.3 – 5.7</span></p></td></tr></tbody></table></figure><p>While the 8.5 scenario is no longer generally considered likely, SSP3 7.0 has been included and is considered the high end of possibilities. SSP5 8.5 has been retained since many organizations report to this threshold. The warming associated with SSP2 4.5 is equivalent to the global targets set at the 2021 United Nations COP26 meetings in Glasgow.&nbsp;<br />&nbsp;</p><p><strong>Processing the Climate Data</strong></p><p>WorldClim provides 20-year averaged outputs for the various SSPs from 24 global climate models. A selection of 13 models were averaged for each variable and time based on&nbsp;<a target='_blank' href='https://rmets.onlinelibrary.wiley.com/doi/full/10.1002/joc.7566' rel='nofollow ugc noopener noreferrer'>Mahony et al 2022</a>. These models included ACCESS-ESM1-5, BCC-CSM2-MR, CanESM5, CNRM-ESM2-1, EC-Earth3-Veg, GFDL-ESM4, GISS-E2-1-G, INM-CM5-0,&nbsp;&nbsp;IPSL-CM6A-LR, MIROC6, MPI-ESM1-2-HR, MRI-ESM2-0, UKESM1-0-LL. GFDL-ESM4 was not available for SSP2 4.5 or SSP5 8.5.&nbsp;</p><p><strong>Accessing the Multidimensional Information</strong></p><p>The time and SSP scenario are built into the layer using a multidimensional raster. Enable the time slider to move across the 20-year average periods. In ArcGIS Online and Pro, use the Multidimensional Filter to select the SSP (SSP2 4.5 is the default).&nbsp;<br /><br /><strong>What can you do with this layer?</strong></p><p>These multidimensional imagery tiles support analysis using ArcGIS Online or Pro. Use the&nbsp;<a target='_blank' href='https://arcgis.com/home/item.html?id=e56c9cb70aa949adb791c4311003d9ae' rel='nofollow ugc noopener noreferrer'>Bioclimate Baseline layer</a>&nbsp;to see the difference in pixels and calculate change from the historic period into the future. Use the&nbsp;<a target='_blank' href='https://pro.arcgis.com/en/pro-app/latest/help/data/imagery/an-overview-of-multidimensional-raster-data.htm' rel='nofollow ugc noopener noreferrer'>Multidimensional&nbsp;</a>tab in ArcGIS Pro to access a variety of useful tools. Each layer or variable can be styled using the Image Display options.&nbsp;</p><p><strong>Known Quality Issues</strong></p><p>Each model is downscaled from ~100km resolution to ~5km resolution by WorldClim. Some artifacts are inevitable, especially at a global scale. Some variables have distinct transitions, especially in Greenland. Also, SSP2 4.5 has missing data for several variables in Antarctica.<br />&nbsp;</p><p><strong>Related Layers</strong></p><p><a target='_blank' href='https://arcgis.com/home/item.html?id=fdaa1b7912e440efb9e29cf5d6156bb0' rel='nofollow ugc noopener noreferrer'>Bioclimate 1&nbsp;&nbsp;Annual Mean Temperature</a><br /><a target='_blank' href='https://arcgis.com/home/item.html?id=8012b34e8c854d6fbcfe4eab437ea397' rel='nofollow ugc noopener noreferrer'>Bioclimate 2&nbsp;&nbsp;Mean Diurnal Range</a><br /><a target='_blank' href='https://arcgis.com/home/item.html?id=ef9f5d6a16ca41ada0c0075a8da46d48' rel='nofollow ugc noopener noreferrer'>Bioclimate 3&nbsp;&nbsp;Isothermality</a><br /><a target='_blank' href='https://arcgis.com/home/item.html?id=64799fea8774463aad909020b6590dc8' rel='nofollow ugc noopener noreferrer'>Bioclimate 4&nbsp;&nbsp;Temperature Seasonality</a><br /><a target='_blank' href='https://arcgis.com/home/item.html?id=8433250e0a4148f5a3889c66e78abdf1' rel='nofollow ugc noopener noreferrer'>Bioclimate 5&nbsp;&nbsp;Max Temperature of Warmest Month</a><br /><a target='_blank' href='https://arcgis.com/home/item.html?id=c531d32ab5d746b88a884b6e54f3216e' rel='nofollow ugc noopener noreferrer'>Bioclimate 6&nbsp;&nbsp;Min Temperature Of Coldest Month</a><br /><a target='_blank' href='https://arcgis.com/home/item.html?id=808cfb3ab1614f8ab7e364de737e9e98' rel='nofollow ugc noopener noreferrer'>Bioclimate 7&nbsp;&nbsp;Temperature Annual Range</a><br /><a target='_blank' href='https://arcgis.com/home/item.html?id=b5990aa16fd94bb691a09449716ed7e5' rel='nofollow ugc noopener noreferrer'>Bioclimate 8&nbsp;&nbsp;Mean Temperature Of Wettest Quarter</a><br /><a target='_blank' href='https://arcgis.com/home/item.html?id=231770161a46467e8de9fdd9fd92dad7' rel='nofollow ugc noopener noreferrer'>Bioclimate 9&nbsp;&nbsp;Mean Temperature Of Driest Quarter</a><br /><a target='_blank' href='https://arcgis.com/home/item.html?id=3b98ddf1c78d4f0c88bd297f85847c68' rel='nofollow ugc noopener noreferrer'>Bioclimate 10&nbsp;&nbsp;Mean Temperature Of Warmest Quarter</a><br /><a target='_blank' href='https://arcgis.com/home/item.html?id=1a96d928c93c4e8fbc6a2391afd1da2f' rel='nofollow ugc noopener noreferrer'>Bioclimate 11&nbsp;&nbsp;Mean Temperature Of Coldest Quarter</a><br /><a target='_blank' href='https://arcgis.com/home/item.html?id=7bc0b8c75b0244b7a8128ae1f398bfc0' rel='nofollow ugc noopener noreferrer'>Bioclimate 12&nbsp;&nbsp;Annual Precipitation</a><br /><a target='_blank' href='https://arcgis.com/home/item.html?id=36fde801c8124f93b46b727b9873c993' rel='nofollow ugc noopener noreferrer'>Bioclimate 13&nbsp;&nbsp;Precipitation Of Wettest Month</a><br /><a target='_blank' href='https://arcgis.com/home/item.html?id=e26b01e4fa0a4aec9c5db991467b31a7' rel='nofollow ugc noopener noreferrer'>Bioclimate 14&nbsp;&nbsp;Precipitation Of Driest Month</a><br /><a target='_blank' href='https://arcgis.com/home/item.html?id=33558b5fef8642338f33918d498f41cf' rel='nofollow ugc noopener noreferrer'>Bioclimate 15&nbsp;&nbsp;Precipitation Seasonality</a><br /><a target='_blank' href='https://arcgis.com/home/item.html?id=1324c4e0c86a40e9b7529e91c6bdf220' rel='nofollow ugc noopener noreferrer'>Bioclimate 16&nbsp;&nbsp;Precipitation Of Wettest Quarter</a><br /><a target='_blank' href='https://arcgis.com/home/item.html?id=86fe2a87fe9144f9a5c330a3b5890df0' rel='nofollow ugc noopener noreferrer'>Bioclimate 17&nbsp;&nbsp;Precipitation Of Driest Quarter</a><br /><a target='_blank' href='https://arcgis.com/home/item.html?id=eb8227050ac24b3bb4a47abb924fbc56' rel='nofollow ugc noopener noreferrer'>Bioclimate 18&nbsp;&nbsp;Precipitation Of Warmest Quarter</a><br /><a target='_blank' href='https://arcgis.com/home/item.html?id=ec067623611d40d086193b21a3a4fce1' rel='nofollow ugc noopener noreferrer'>Bioclimate 19&nbsp;&nbsp;Precipitation Of Coldest Quarter</a><br /><a target='_blank' href='https://arcgis.com/home/item.html?id=e56c9cb70aa949adb791c4311003d9ae' rel='nofollow ugc noopener noreferrer'>Bioclimate Baseline 1970-2000</a></p></div>",
			"keyword": [
				"esri_environment",
				"retiring-2026-12"
			],
			"issued": "2022-05-12T15:40:34.000Z",
			"modified": "2026-05-06T15:27:24.000Z",
			"publisher": {
				"name": "Esri"
			},
			"contactPoint": {
				"@type": "vcard:Contact",
				"fn": "esri_environment",
				"hasEmail": "{{orgContactEmail}}"
			},
			"accessLevel": "public",
			"spatial": "-180.0000,-90.0000,180.0000,90.0000",
			"license": "<p><img src='https://downloads.esri.com/blogs/arcgisonline/esrilogo_new.png' width='113' height='43' /> This work is licensed under the Esri Master License Agreement.&nbsp;</p><p><a target='_blank' href='https://goto.arcgis.com/termsofuse/viewsummary' rel='nofollow ugc noopener noreferrer'>View Summary</a> | <a target='_blank' href='https://goto.arcgis.com/termsofuse/viewtermsofuse' rel='nofollow ugc noopener noreferrer'>View Terms of Use</a></p>",
			"distribution": [
				{
					"@type": "dcat:Distribution",
					"title": "ArcGIS Hub Dataset",
					"format": "Web Page",
					"mediaType": "text/html",
					"accessURL": "https://www.pacificgeoportal.com/content/esri::bioclimate-projections-13-precipitation-of-wettest-month"
				},
				{
					"@type": "dcat:Distribution",
					"title": "ArcGIS GeoService",
					"format": "ArcGIS GeoServices REST API",
					"mediaType": "application/json",
					"accessURL": "https://tiledimageservices.arcgis.com/P3ePLMYs2RVChkJx/arcgis/rest/services/Bioclimate_Projections__Precipitation_of_Wettest_Month/ImageServer"
				}
			],
			"theme": [
				"geospatial"
			]
		},
		{
			"@type": "dcat:Dataset",
			"identifier": "https://www.arcgis.com/home/item.html?id=3b98ddf1c78d4f0c88bd297f85847c68",
			"landingPage": "https://www.pacificgeoportal.com/content/esri::bioclimate-projections-10-mean-temperature-of-warmest-quarter",
			"title": "Bioclimate Projections: (10) Mean Temperature of Warmest Quarter",
			"description": "<p><span style='color:#dc143c;'><strong>Retirement Notice:</strong></span><strong>&nbsp;This </strong><a target='_blank' href='https://goto.arcgis.com/termsofuse/beta' rel='nofollow ugc noopener noreferrer'><strong>beta</strong></a><strong> item will be retired in December 2026. A</strong><a target='_blank' href='https://www.arcgis.com/home/item.html?id=d1e95d3479704042b7a5d68c505eb1c7' rel='nofollow ugc noopener noreferrer'><strong> new version of this item</strong></a><strong>&nbsp;is available for your use. </strong>Esri recommends updating your maps and apps to use the new version.</p><p><span style='background-attachment:initial; background-clip:initial; background-image:initial; background-origin:initial; background-position:initial; background-repeat:initial; background-size:initial;'>This layer represents CMIP6 future projections of mean temperature during the three warmest months of the year. This layer can be used to compare with recent climate histories to better understand the potential impacts of future climate change.</span></p><p><a target='_blank' href='https://worldclim.org/' rel='nofollow ugc noopener noreferrer'><span style='background-attachment:initial; background-clip:initial; background-image:initial; background-origin:initial; background-position:initial; background-repeat:initial; background-size:initial;'>WorldClim</span></a><span style='background-attachment:initial; background-clip:initial; background-image:initial; background-origin:initial; background-position:initial; background-repeat:initial; background-size:initial;'>&nbsp;produced this projection as part of a series of&nbsp;</span><a target='_blank' href='https://pubs.usgs.gov/ds/691/ds691.pdf' rel='nofollow ugc noopener noreferrer'><span style='background-attachment:initial; background-clip:initial; background-image:initial; background-origin:initial; background-position:initial; background-repeat:initial; background-size:initial;'>19 bioclimate variables identified by the USGS</span></a><span style='background-attachment:initial; background-clip:initial; background-image:initial; background-origin:initial; background-position:initial; background-repeat:initial; background-size:initial;'>&nbsp;and provides this description:</span><br /><br /><i>\"Bioclimatic variables are derived from the monthly temperature and rainfall values in order to generate more biologically meaningful variables. These are often used in species distribution modeling and related ecological modeling techniques. The bioclimatic variables represent annual trends (e.g., mean annual temperature, annual precipitation) seasonality (e.g., annual range in temperature and precipitation) and extreme or limiting environmental factors (e.g., temperature of the coldest and warmest month, and precipitation of the wet and dry quarters). A quarter is a period of three months (1/4 of the year).\"</i></p><p style='background-attachment:initial; background-clip:initial; background-image:initial; background-origin:initial; background-position:initial; background-repeat:initial; background-size:initial; margin-bottom:0in;'><strong>Time Extent:</strong>&nbsp;averages from 2021-2040, 2041-2060, 2061-2080, 2081-2100<br /><strong>Units:</strong>&nbsp;deg C<br /><strong>Cell Size:</strong> 2.5 minutes (~5 km)<br /><strong>Source Type:</strong> Stretched<br /><strong>Pixel Type:</strong> 32 Bit Float<br /><strong>Data Projection:</strong> GCS WGS84<br /><strong>Mosaic Projection:</strong> GCS WGS84<br /><strong>Extent:</strong> Global<br /><strong>Source:</strong> <a target='_blank' href='https://worldclim.org/data/cmip6/cmip6_clim2.5m.html' rel='nofollow ugc noopener noreferrer'>WorldClim CMIP6 Bioclimate</a></p><p>&nbsp;</p><p><strong>Climate Scenarios</strong></p><p>The CMIP6 climate experiments use&nbsp;<a target='_blank' href='https://www.carbonbrief.org/explainer-how-shared-socioeconomic-pathways-explore-future-climate-change/' rel='nofollow ugc noopener noreferrer'>Shared Socioeconomic Pathways (SSPs)</a>&nbsp;to model future climate scenarios. Each SSP pairs a human/community behavior component with the traditional RCP greenhouse gas forcing from the previous CMIP5. Three SSPs were chosen by Esri to be included in the service based on user requests: SSP2 4.5, SSP3 7.0 and SSP5 8.5.</p><figure><table style='background-color:rgb(248, 249, 250); border-collapse:collapse;' width='850' cellpadding='0' cellspacing='0' border='1'><tbody><tr><td style='background-color:rgb(234, 236, 240); border:1pt solid rgb(162, 169, 177); padding:2.4pt 4.8pt;'><p style='margin:12pt 0in; text-align:center;'><span style='color:rgb(32,33,34); font-family:Arial, sans-serif; font-size:10.5pt;'><strong>SSP</strong></span></p></td><td style='background-color:rgb(234, 236, 240); border-bottom:1pt solid rgb(162, 169, 177); border-image:initial; border-left-style:none; border-right:1pt solid rgb(162, 169, 177); border-top:1pt solid rgb(162, 169, 177); padding:2.4pt 4.8pt;'><p style='margin:12pt 0in; text-align:center;'><span style='color:rgb(32,33,34); font-family:Arial, sans-serif; font-size:10.5pt;'><strong>Scenario</strong></span></p></td><td style='background-color:rgb(234, 236, 240); border-bottom:1pt solid rgb(162, 169, 177); border-image:initial; border-left-style:none; border-right:1pt solid rgb(162, 169, 177); border-top:1pt solid rgb(162, 169, 177); padding:2.4pt 4.8pt;'><p style='margin:12pt 0in; text-align:center;'><span style='color:rgb(32,33,34); font-family:Arial, sans-serif; font-size:10.5pt;'><strong>Estimated warming</strong></span><br /><span style='color:rgb(32,33,34); font-family:Arial, sans-serif; font-size:10.5pt;'><strong>(2041–2060)</strong></span></p></td><td style='background-color:rgb(234, 236, 240); border-bottom:1pt solid rgb(162, 169, 177); border-image:initial; border-left-style:none; border-right:1pt solid rgb(162, 169, 177); border-top:1pt solid rgb(162, 169, 177); padding:2.4pt 4.8pt;'><p style='margin:12pt 0in; text-align:center;'><span style='color:rgb(32,33,34); font-family:Arial, sans-serif; font-size:10.5pt;'><strong>Estimated warming</strong></span><br /><span style='color:rgb(32,33,34); font-family:Arial, sans-serif; font-size:10.5pt;'><strong>(2081–2100)</strong></span></p></td><td style='background-color:rgb(234, 236, 240); border-bottom:1pt solid rgb(162, 169, 177); border-image:initial; border-left-style:none; border-right:1pt solid rgb(162, 169, 177); border-top:1pt solid rgb(162, 169, 177); padding:2.4pt 4.8pt;'><p style='margin:12pt 0in; text-align:center;'><span style='color:rgb(32,33,34); font-family:Arial, sans-serif; font-size:10.5pt;'><strong>Very likely range in °C</strong></span><br /><span style='color:rgb(32,33,34); font-family:Arial, sans-serif; font-size:10.5pt;'><strong>(2081–2100)</strong></span></p></td></tr><tr><td style='border-bottom:1pt solid rgb(162, 169, 177); border-image:initial; border-left:1pt solid rgb(162, 169, 177); border-right:1pt solid rgb(162, 169, 177); border-top-style:none; padding:2.4pt 4.8pt;'><p style='margin:12pt 0in; text-align:center;'><span style='color:rgb(32,33,34); font-family:Arial, sans-serif; font-size:10.5pt;'>SSP2-4.5</span></p></td><td style='border-bottom:1pt solid rgb(162, 169, 177); border-left-style:none; border-right:1pt solid rgb(162, 169, 177); border-top-style:none; padding:2.4pt 4.8pt;'><p style='margin:12pt 0in; text-align:center;'><span style='color:rgb(32,33,34); font-family:Arial, sans-serif; font-size:10.5pt;'>intermediate GHG emissions:</span><br /><span style='color:rgb(32,33,34); font-family:Arial, sans-serif; font-size:10.5pt;'>CO</span><span style='color:rgb(32,33,34); font-family:Arial, sans-serif; font-size:8.5pt;'><sub>2</sub></span><span style='color:rgb(32,33,34); font-family:Arial, sans-serif; font-size:10.5pt;'>&nbsp;emissions around current levels until 2050, then falling but not reaching net zero by 2100</span></p></td><td style='border-bottom:1pt solid rgb(162, 169, 177); border-left-style:none; border-right:1pt solid rgb(162, 169, 177); border-top-style:none; padding:2.4pt 4.8pt;'><p style='margin:12pt 0in; text-align:center;'><span style='color:rgb(32,33,34); font-family:Arial, sans-serif; font-size:10.5pt;'>2.0 °C</span></p></td><td style='border-bottom:1pt solid rgb(162, 169, 177); border-left-style:none; border-right:1pt solid rgb(162, 169, 177); border-top-style:none; padding:2.4pt 4.8pt;'><p style='margin:12pt 0in; text-align:center;'><span style='color:rgb(32,33,34); font-family:Arial, sans-serif; font-size:10.5pt;'>2.7 °C</span></p></td><td style='border-bottom:1pt solid rgb(162, 169, 177); border-left-style:none; border-right:1pt solid rgb(162, 169, 177); border-top-style:none; padding:2.4pt 4.8pt;'><p style='margin:12pt 0in; text-align:center;'><span style='color:rgb(32,33,34); font-family:Arial, sans-serif; font-size:10.5pt;'>2.1 – 3.5</span></p></td></tr><tr><td style='border-bottom:1pt solid rgb(162, 169, 177); border-image:initial; border-left:1pt solid rgb(162, 169, 177); border-right:1pt solid rgb(162, 169, 177); border-top-style:none; padding:2.4pt 4.8pt;'><p style='margin:12pt 0in; text-align:center;'><span style='color:rgb(32,33,34); font-family:Arial, sans-serif; font-size:10.5pt;'>SSP3-7.0</span></p></td><td style='border-bottom:1pt solid rgb(162, 169, 177); border-left-style:none; border-right:1pt solid rgb(162, 169, 177); border-top-style:none; padding:2.4pt 4.8pt;'><p style='margin:12pt 0in; text-align:center;'><span style='color:rgb(32,33,34); font-family:Arial, sans-serif; font-size:10.5pt;'>high GHG emissions:</span><br /><span style='color:rgb(32,33,34); font-family:Arial, sans-serif; font-size:10.5pt;'>CO</span><span style='color:rgb(32,33,34); font-family:Arial, sans-serif; font-size:8.5pt;'><sub>2</sub></span><span style='color:rgb(32,33,34); font-family:Arial, sans-serif; font-size:10.5pt;'>&nbsp;emissions double by 2100</span></p></td><td style='border-bottom:1pt solid rgb(162, 169, 177); border-left-style:none; border-right:1pt solid rgb(162, 169, 177); border-top-style:none; padding:2.4pt 4.8pt;'><p style='margin:12pt 0in; text-align:center;'><span style='color:rgb(32,33,34); font-family:Arial, sans-serif; font-size:10.5pt;'>2.1 °C</span></p></td><td style='border-bottom:1pt solid rgb(162, 169, 177); border-left-style:none; border-right:1pt solid rgb(162, 169, 177); border-top-style:none; padding:2.4pt 4.8pt;'><p style='margin:12pt 0in; text-align:center;'><span style='color:rgb(32,33,34); font-family:Arial, sans-serif; font-size:10.5pt;'>3.6 °C</span></p></td><td style='border-bottom:1pt solid rgb(162, 169, 177); border-left-style:none; border-right:1pt solid rgb(162, 169, 177); border-top-style:none; padding:2.4pt 4.8pt;'><p style='margin:12pt 0in; text-align:center;'><span style='color:rgb(32,33,34); font-family:Arial, sans-serif; font-size:10.5pt;'>2.8 – 4.6</span></p></td></tr><tr><td style='border-bottom:1pt solid rgb(162, 169, 177); border-image:initial; border-left:1pt solid rgb(162, 169, 177); border-right:1pt solid rgb(162, 169, 177); border-top-style:none; padding:2.4pt 4.8pt;'><p style='margin:12pt 0in; text-align:center;'><span style='color:rgb(32,33,34); font-family:Arial, sans-serif; font-size:10.5pt;'>SSP5-8.5</span></p></td><td style='border-bottom:1pt solid rgb(162, 169, 177); border-left-style:none; border-right:1pt solid rgb(162, 169, 177); border-top-style:none; padding:2.4pt 4.8pt;'><p style='margin:12pt 0in; text-align:center;'><span style='color:rgb(32,33,34); font-family:Arial, sans-serif; font-size:10.5pt;'>very high GHG emissions:</span><br /><span style='color:rgb(32,33,34); font-family:Arial, sans-serif; font-size:10.5pt;'>CO</span><span style='color:rgb(32,33,34); font-family:Arial, sans-serif; font-size:8.5pt;'><sub>2</sub></span><span style='color:rgb(32,33,34); font-family:Arial, sans-serif; font-size:10.5pt;'>&nbsp;emissions triple by 2075</span></p></td><td style='border-bottom:1pt solid rgb(162, 169, 177); border-left-style:none; border-right:1pt solid rgb(162, 169, 177); border-top-style:none; padding:2.4pt 4.8pt;'><p style='margin:12pt 0in; text-align:center;'><span style='color:rgb(32,33,34); font-family:Arial, sans-serif; font-size:10.5pt;'>2.4 °C</span></p></td><td style='border-bottom:1pt solid rgb(162, 169, 177); border-left-style:none; border-right:1pt solid rgb(162, 169, 177); border-top-style:none; padding:2.4pt 4.8pt;'><p style='margin:12pt 0in; text-align:center;'><span style='color:rgb(32,33,34); font-family:Arial, sans-serif; font-size:10.5pt;'>4.4 °C</span></p></td><td style='border-bottom:1pt solid rgb(162, 169, 177); border-left-style:none; border-right:1pt solid rgb(162, 169, 177); border-top-style:none; padding:2.4pt 4.8pt;'><p style='margin:12pt 0in; text-align:center;'><span style='color:rgb(32,33,34); font-family:Arial, sans-serif; font-size:10.5pt;'>3.3 – 5.7</span></p></td></tr></tbody></table></figure><p>While the 8.5 scenario is no longer generally considered likely, SSP3 7.0 has been included and is considered the high end of possibilities. SSP5 8.5 has been retained since many organizations report to this threshold. The warming associated with SSP2 4.5 is equivalent to the global targets set at the 2021 United Nations COP26 meetings in Glasgow.&nbsp;</p><p><strong>Processing the Climate Data</strong></p><p>WorldClim provides 20-year averaged outputs for the various SSPs from 24 global climate models. A selection of 13 models were averaged for each variable and time based on&nbsp;<a target='_blank' href='https://rmets.onlinelibrary.wiley.com/doi/full/10.1002/joc.7566' rel='nofollow ugc noopener noreferrer'>Mahony et al 2022</a>. These models included ACCESS-ESM1-5, BCC-CSM2-MR, CanESM5, CNRM-ESM2-1, EC-Earth3-Veg, GFDL-ESM4, GISS-E2-1-G, INM-CM5-0,&nbsp;&nbsp;IPSL-CM6A-LR, MIROC6, MPI-ESM1-2-HR, MRI-ESM2-0, UKESM1-0-LL. GFDL-ESM4 was not available for SSP2 4.5 or SSP5 8.5.&nbsp;</p><p><strong>Accessing the Multidimensional Information</strong></p><p>The time and SSP scenario are built into the layer using a multidimensional raster. Enable the time slider to move across the 20-year average periods. In ArcGIS Online and Pro, use the Multidimensional Filter to select the SSP (SSP2 4.5 is the default).&nbsp;<br /><br /><strong>What can you do with this layer?</strong></p><p>These multidimensional imagery tiles support analysis using ArcGIS Online or Pro. Use the&nbsp;<a target='_blank' href='https://arcgis.com/home/item.html?id=e56c9cb70aa949adb791c4311003d9ae' rel='nofollow ugc noopener noreferrer'>Bioclimate Baseline layer</a>&nbsp;to see the difference in pixels and calculate change from the historic period into the future. Use the&nbsp;<a target='_blank' href='https://pro.arcgis.com/en/pro-app/latest/help/data/imagery/an-overview-of-multidimensional-raster-data.htm' rel='nofollow ugc noopener noreferrer'>Multidimensional&nbsp;</a>tab in ArcGIS Pro to access a variety of useful tools. Each layer or variable can be styled using the Image Display options.&nbsp;</p><p><strong>Known Quality Issues</strong></p><p>Each model is downscaled from ~100km resolution to ~5km resolution by WorldClim. Some artifacts are inevitable, especially at a global scale. Some variables have distinct transitions, especially in Greenland. Also, SSP2 4.5 has missing data for several variables in Antarctica.</p><p><strong>Related Layers</strong></p><p><a target='_blank' href='https://arcgis.com/home/item.html?id=fdaa1b7912e440efb9e29cf5d6156bb0' rel='nofollow ugc noopener noreferrer'>Bioclimate 1&nbsp;&nbsp;Annual Mean Temperature</a><br /><a target='_blank' href='https://arcgis.com/home/item.html?id=8012b34e8c854d6fbcfe4eab437ea397' rel='nofollow ugc noopener noreferrer'>Bioclimate 2&nbsp;&nbsp;Mean Diurnal Range</a><br /><a target='_blank' href='https://arcgis.com/home/item.html?id=ef9f5d6a16ca41ada0c0075a8da46d48' rel='nofollow ugc noopener noreferrer'>Bioclimate 3&nbsp;&nbsp;Isothermality</a><br /><a target='_blank' href='https://arcgis.com/home/item.html?id=64799fea8774463aad909020b6590dc8' rel='nofollow ugc noopener noreferrer'>Bioclimate 4&nbsp;&nbsp;Temperature Seasonality</a><br /><a target='_blank' href='https://arcgis.com/home/item.html?id=8433250e0a4148f5a3889c66e78abdf1' rel='nofollow ugc noopener noreferrer'>Bioclimate 5&nbsp;&nbsp;Max Temperature of Warmest Month</a><br /><a target='_blank' href='https://arcgis.com/home/item.html?id=c531d32ab5d746b88a884b6e54f3216e' rel='nofollow ugc noopener noreferrer'>Bioclimate 6&nbsp;&nbsp;Min Temperature Of Coldest Month</a><br /><a target='_blank' href='https://arcgis.com/home/item.html?id=808cfb3ab1614f8ab7e364de737e9e98' rel='nofollow ugc noopener noreferrer'>Bioclimate 7&nbsp;&nbsp;Temperature Annual Range</a><br /><a target='_blank' href='https://arcgis.com/home/item.html?id=b5990aa16fd94bb691a09449716ed7e5' rel='nofollow ugc noopener noreferrer'>Bioclimate 8&nbsp;&nbsp;Mean Temperature Of Wettest Quarter</a><br /><a target='_blank' href='https://arcgis.com/home/item.html?id=231770161a46467e8de9fdd9fd92dad7' rel='nofollow ugc noopener noreferrer'>Bioclimate 9&nbsp;&nbsp;Mean Temperature Of Driest Quarter</a><br /><a target='_blank' href='https://arcgis.com/home/item.html?id=3b98ddf1c78d4f0c88bd297f85847c68' rel='nofollow ugc noopener noreferrer'>Bioclimate 10&nbsp;&nbsp;Mean Temperature Of Warmest Quarter</a><br /><a target='_blank' href='https://arcgis.com/home/item.html?id=1a96d928c93c4e8fbc6a2391afd1da2f' rel='nofollow ugc noopener noreferrer'>Bioclimate 11&nbsp;&nbsp;Mean Temperature Of Coldest Quarter</a><br /><a target='_blank' href='https://arcgis.com/home/item.html?id=7bc0b8c75b0244b7a8128ae1f398bfc0' rel='nofollow ugc noopener noreferrer'>Bioclimate 12&nbsp;&nbsp;Annual Precipitation</a><br /><a target='_blank' href='https://arcgis.com/home/item.html?id=36fde801c8124f93b46b727b9873c993' rel='nofollow ugc noopener noreferrer'>Bioclimate 13&nbsp;&nbsp;Precipitation Of Wettest Month</a><br /><a target='_blank' href='https://arcgis.com/home/item.html?id=e26b01e4fa0a4aec9c5db991467b31a7' rel='nofollow ugc noopener noreferrer'>Bioclimate 14&nbsp;&nbsp;Precipitation Of Driest Month</a><br /><a target='_blank' href='https://arcgis.com/home/item.html?id=33558b5fef8642338f33918d498f41cf' rel='nofollow ugc noopener noreferrer'>Bioclimate 15&nbsp;&nbsp;Precipitation Seasonality</a><br /><a target='_blank' href='https://arcgis.com/home/item.html?id=1324c4e0c86a40e9b7529e91c6bdf220' rel='nofollow ugc noopener noreferrer'>Bioclimate 16&nbsp;&nbsp;Precipitation Of Wettest Quarter</a><br /><a target='_blank' href='https://arcgis.com/home/item.html?id=86fe2a87fe9144f9a5c330a3b5890df0' rel='nofollow ugc noopener noreferrer'>Bioclimate 17&nbsp;&nbsp;Precipitation Of Driest Quarter</a><br /><a target='_blank' href='https://arcgis.com/home/item.html?id=eb8227050ac24b3bb4a47abb924fbc56' rel='nofollow ugc noopener noreferrer'>Bioclimate 18&nbsp;&nbsp;Precipitation Of Warmest Quarter</a><br /><a target='_blank' href='https://arcgis.com/home/item.html?id=ec067623611d40d086193b21a3a4fce1' rel='nofollow ugc noopener noreferrer'>Bioclimate 19&nbsp;&nbsp;Precipitation Of Coldest Quarter</a><br /><a target='_blank' href='https://arcgis.com/home/item.html?id=e56c9cb70aa949adb791c4311003d9ae' rel='nofollow ugc noopener noreferrer'>Bioclimate Baseline 1970-2000</a></p>",
			"keyword": [
				"esri_environment",
				"retiring-2026-12"
			],
			"issued": "2022-05-12T15:56:04.000Z",
			"modified": "2026-05-06T15:26:40.000Z",
			"publisher": {
				"name": "Esri"
			},
			"contactPoint": {
				"@type": "vcard:Contact",
				"fn": "esri_environment",
				"hasEmail": "{{orgContactEmail}}"
			},
			"accessLevel": "public",
			"spatial": "-180.0000,-90.0000,180.0000,90.0000",
			"license": "<p><img src='https://downloads.esri.com/blogs/arcgisonline/esrilogo_new.png' width='113' height='43' /> This work is licensed under the Esri Master License Agreement.&nbsp;</p><p><a target='_blank' href='https://goto.arcgis.com/termsofuse/viewsummary' rel='nofollow ugc noopener noreferrer'>View Summary</a> | <a target='_blank' href='https://goto.arcgis.com/termsofuse/viewtermsofuse' rel='nofollow ugc noopener noreferrer'>View Terms of Use</a></p>",
			"distribution": [
				{
					"@type": "dcat:Distribution",
					"title": "ArcGIS Hub Dataset",
					"format": "Web Page",
					"mediaType": "text/html",
					"accessURL": "https://www.pacificgeoportal.com/content/esri::bioclimate-projections-10-mean-temperature-of-warmest-quarter"
				},
				{
					"@type": "dcat:Distribution",
					"title": "ArcGIS GeoService",
					"format": "ArcGIS GeoServices REST API",
					"mediaType": "application/json",
					"accessURL": "https://tiledimageservices.arcgis.com/P3ePLMYs2RVChkJx/arcgis/rest/services/Bioclimate_Projections__Mean_Temperature_of_Warmest_Quarter/ImageServer"
				}
			],
			"theme": [
				"geospatial"
			]
		},
		{
			"@type": "dcat:Dataset",
			"identifier": "https://www.arcgis.com/home/item.html?id=a79a3e4dc55343b08543b1b6133bfb90&sublayer=0",
			"landingPage": "https://www.pacificgeoportal.com/datasets/esri::world-regions",
			"title": "World Regions",
			"description": "<div><div><span>World Regions represents the boundaries for&nbsp;25 commonly recognized world regions.</span></div><div>&nbsp;</div><div><span>This layer is best viewed out beyond a maximum scale (zoomed in) of 1:5,000,000.</span></div><div>&nbsp;</div><div>The sources of this dataset are Esri, Global Mapping International (GMI), and <a target='_blank' href='https://www.cia.gov/the-world-factbook/' rel='nofollow ugc noopener noreferrer'>U.S. Central Intelligence Agency (The World Factbook)</a>. <span>It is updated as country boundaries coincident to regional boundaries change.</span><br />&nbsp;</div></div><div><span style='background-color:rgb(255,255,255); color:rgb(77,77,77);'>To download the data for this layer as a layer package for use in ArcGIS desktop applications, refer to </span><a target='_blank' href='https://www.arcgis.com/home/item.html?id=84dbc97915244e35808e87a881133d09' rel='nofollow ugc noopener noreferrer'>World Regions</a><span style='background-color:rgb(255,255,255); color:rgb(77,77,77);'>.</span><br />&nbsp;</div>",
			"keyword": [
				"layer",
				"polygon",
				"regions",
				"coastlines",
				"boundaries",
				"World",
				"1996",
				"1998",
				"2000",
				"2007"
			],
			"issued": "2013-06-30T22:56:43.000Z",
			"modified": "2026-05-05T20:13:55.620Z",
			"publisher": {
				"name": "Esri"
			},
			"contactPoint": {
				"@type": "vcard:Contact",
				"fn": "esri_dm",
				"hasEmail": "{{orgContactEmail}}"
			},
			"accessLevel": "public",
			"spatial": "-180.0000,-89.0000,180.0000,83.6236",
			"license": "<div style='text-align:Left;'><div><div><p><img src='https://downloads.esri.com/blogs/arcgisonline/esrilogo_new.png' width='113' height='39' /> This work is licensed under the Esri Master License Agreement.<br />&nbsp;<a target='_blank' href='https://goto.arcgis.com/termsofuse/viewsummary' rel='nofollow ugc noopener noreferrer'><strong>View Summary</strong></a> | <a target='_blank' href='https://goto.arcgis.com/termsofuse/viewtermsofuse' rel='nofollow ugc noopener noreferrer'><strong>View Terms of Use</strong></a></p><div><div><div>&nbsp;</div><div>The data used in this hosted feature layer is provided via <a target='_blank' href='https://www.arcgis.com/home/group.html?id=24838c2d95e14dd18c25e9bad55a7f82#overview' rel='nofollow ugc noopener noreferrer'>ArcGIS Data and Maps</a>. The datasets included within ArcGIS Data and Maps are subject to varying redistribution rights that have been granted by Esri’s third party data suppliers. Consult the <a target='_blank' href='https://www.esri.com/en-us/legal/redistribution-rights' rel='nofollow ugc noopener noreferrer'>Redistribution Rights</a> document to determine the ways in which Licensee is permitted to use and redistribute each specific dataset and the applicable disclaimers, attribution requirements, and other conditions of use.</div></div></div></div></div></div>",
			"distribution": [
				{
					"@type": "dcat:Distribution",
					"title": "ArcGIS Hub Dataset",
					"format": "Web Page",
					"mediaType": "text/html",
					"accessURL": "https://www.pacificgeoportal.com/datasets/esri::world-regions"
				},
				{
					"@type": "dcat:Distribution",
					"title": "ArcGIS GeoService",
					"format": "ArcGIS GeoServices REST API",
					"mediaType": "application/json",
					"accessURL": "https://services.arcgis.com/P3ePLMYs2RVChkJx/arcgis/rest/services/World_Regions/FeatureServer/0"
				},
				{
					"@type": "dcat:Distribution",
					"title": "CSV",
					"format": "CSV",
					"mediaType": "text/csv",
					"accessURL": "https://www.pacificgeoportal.com/api/download/v1/items/a79a3e4dc55343b08543b1b6133bfb90/csv?layers=0"
				},
				{
					"@type": "dcat:Distribution",
					"title": "Shapefile",
					"format": "ZIP",
					"mediaType": "application/zip",
					"accessURL": "https://www.pacificgeoportal.com/api/download/v1/items/a79a3e4dc55343b08543b1b6133bfb90/shapefile?layers=0"
				},
				{
					"@type": "dcat:Distribution",
					"title": "GeoJSON",
					"format": "GeoJSON",
					"mediaType": "application/vnd.geo+json",
					"accessURL": "https://www.pacificgeoportal.com/api/download/v1/items/a79a3e4dc55343b08543b1b6133bfb90/geojson?layers=0"
				},
				{
					"@type": "dcat:Distribution",
					"title": "KML",
					"format": "KML",
					"mediaType": "application/vnd.google-earth.kml+xml",
					"accessURL": "https://www.pacificgeoportal.com/api/download/v1/items/a79a3e4dc55343b08543b1b6133bfb90/kml?layers=0"
				},
				{
					"@type": "dcat:Distribution",
					"title": "File Geodatabase",
					"format": "ZIP",
					"mediaType": "application/zip",
					"accessURL": "https://www.pacificgeoportal.com/api/download/v1/items/a79a3e4dc55343b08543b1b6133bfb90/filegdb?layers=0"
				},
				{
					"@type": "dcat:Distribution",
					"title": "Feature Collection",
					"format": "TXT",
					"mediaType": "text/plain",
					"accessURL": "https://www.pacificgeoportal.com/api/download/v1/items/a79a3e4dc55343b08543b1b6133bfb90/featureCollection?layers=0"
				},
				{
					"@type": "dcat:Distribution",
					"title": "Excel",
					"format": "XLSX",
					"mediaType": "application/vnd.ms-excel",
					"accessURL": "https://www.pacificgeoportal.com/api/download/v1/items/a79a3e4dc55343b08543b1b6133bfb90/excel?layers=0"
				},
				{
					"@type": "dcat:Distribution",
					"title": "GeoPackage",
					"format": "GPKG",
					"mediaType": "application/geopackage+sqlite3",
					"accessURL": "https://www.pacificgeoportal.com/api/download/v1/items/a79a3e4dc55343b08543b1b6133bfb90/geoPackage?layers=0"
				},
				{
					"@type": "dcat:Distribution",
					"title": "SQLite Geodatabase",
					"format": "GDB",
					"mediaType": "application/geopackage+sqlite3",
					"accessURL": "https://www.pacificgeoportal.com/api/download/v1/items/a79a3e4dc55343b08543b1b6133bfb90/sqlite?layers=0"
				}
			],
			"theme": [
				"geospatial"
			]
		},
		{
			"@type": "dcat:Dataset",
			"identifier": "https://www.arcgis.com/home/item.html?id=8f9cb35cec274e25b4c5d6add631f1f0",
			"landingPage": "https://www.pacificgeoportal.com/maps/esri::openstreetmap-streets-with-relief-1",
			"title": "OpenStreetMap Streets with Relief",
			"description": "<div><div style='margin-bottom:3rem;'><span style='color:#b22222;'><font style='font-family:&quot;Avenir Next W01&quot;, &quot;Avenir Next W00&quot;, &quot;Avenir Next&quot;, Avenir, &quot;Helvetica Neue&quot;, sans-serif; font-size:16px;'><strong>Mature Support Notice:&nbsp;</strong></font></span><strong>This item is in&nbsp;</strong><a style='color:rgb(0, 97, 155); font-family:&quot;Avenir Next W01&quot;, &quot;Avenir Next W00&quot;, &quot;Avenir Next&quot;, Avenir, &quot;Helvetica Neue&quot;, sans-serif; font-size:16px; text-decoration-line:none;' target='_blank' href='https://goto.arcgis.com/lifecycle/content' rel='nofollow ugc noopener noreferrer'><strong>mature support</strong></a><strong>&nbsp;as of December 2024. A&nbsp;</strong><a style='background-color:rgb(255, 255, 255); border:0px solid currentcolor; box-sizing:border-box; color:rgb(0, 97, 155); font-family:&quot;Avenir Next&quot;, Avenir, &quot;Helvetica Neue&quot;, sans-serif; font-size:16px; font-style:normal; font-variant-caps:normal; font-variant-ligatures:normal; font-weight:400; letter-spacing:normal; line-height:1.5; text-align:start; text-decoration:none; text-indent:0px; text-transform:none; word-spacing:0px;' target='_blank' href='https://www.arcgis.com/home/item.html?id=dab094bba57c4b7fbbe98e53a383a584' rel='nofollow ugc noopener noreferrer'><strong>new version of this item</strong></a><strong>&nbsp;is available for your use.</strong> Esri recommends updating your maps and apps to use the new version. See&nbsp;<a target='_blank' href='https://goto.arcgis.com/blogs/osmmaturesupport' rel='nofollow ugc noopener noreferrer'>blog</a>&nbsp;for more information.</div><div style='margin-bottom:3rem;'><span style='font-family:&quot;Avenir Next W01&quot;, &quot;Avenir Next W00&quot;, &quot;Avenir Next&quot;, Avenir, &quot;Helvetica Neue&quot;, sans-serif; font-size:16px;'>This vector tile layer presents the OpenStreetMap Streets with Relief style. This style of OpenStreetMap (OSM) data is hosted by Esri.&nbsp;This map, rendered in a style similar to the Esri Street Map (with Relief),&nbsp;includes highways, major roads, minor roads, railways, water features, cities, parks, landmarks, building footprints, and administrative boundaries, and is designed for use with hillshade for added context.&nbsp;Created from the&nbsp;</span><a style='color:rgb(0, 97, 155); font-family:&quot;Avenir Next W01&quot;, &quot;Avenir Next W00&quot;, &quot;Avenir Next&quot;, Avenir, &quot;Helvetica Neue&quot;, sans-serif; font-size:16px; text-decoration-line:none;' target='_blank' href='https://daylightmap.org/2024/05/03/sunsetting-daylight.html' rel='nofollow ugc noopener noreferrer'>sunsetted Daylight map distribution</a><span style='font-family:&quot;Avenir Next W01&quot;, &quot;Avenir Next W00&quot;, &quot;Avenir Next&quot;, Avenir, &quot;Helvetica Neue&quot;, sans-serif; font-size:16px;'>, data updates supporting this layer are no longer available.</span></div><div style='margin-bottom:3rem;'><span style='font-family:inherit; font-size:16px;'>OpenStreetMap is an open collaborative project to create a free editable map of the world. Volunteers gather location data using GPS, local knowledge, and other free sources of information and upload it. The resulting free map can be viewed and downloaded from the OpenStreetMap site: www.OpenStreetMap.org. Esri is a supporter of the OSM project</span><span style='font-family:inherit;'>.&nbsp;</span></div></div>",
			"keyword": [
				"basemap",
				"OpenStreetMap",
				"OSM",
				"Streets with Relief",
				"osmStreetsrelief",
				"wma",
				"vector"
			],
			"issued": "2019-09-03T17:37:15.000Z",
			"modified": "2026-04-30T21:10:07.000Z",
			"publisher": {
				"name": "Esri"
			},
			"contactPoint": {
				"@type": "vcard:Contact",
				"fn": "esri_vector",
				"hasEmail": "{{orgContactEmail}}"
			},
			"accessLevel": "public",
			"spatial": "-140.0000,-60.0000,140.0000,60.0000",
			"license": "<p><img style='font-family:&quot;Avenir Next W01&quot;, &quot;Avenir Next W00&quot;, &quot;Avenir Next&quot;, Avenir, &quot;Helvetica Neue&quot;, sans-serif; font-size:16px; height:auto; max-width:100%;' src='https://downloads.esri.com/blogs/arcgisonline/esrilogo_new.png' width='113' height='43' /><span style='font-family:&quot;Avenir Next W01&quot;, &quot;Avenir Next W00&quot;, &quot;Avenir Next&quot;, Avenir, &quot;Helvetica Neue&quot;, sans-serif; font-size:16px;'> This work is licensed under the Esri Master License Agreement.</span></p><div style='font-family:&quot;Avenir Next W01&quot;, &quot;Avenir Next W00&quot;, &quot;Avenir Next&quot;, Avenir, &quot;Helvetica Neue&quot;, sans-serif; font-size:16px;'><a style='color:rgb(0, 121, 193); text-decoration-line:none;' target='_blank' href='https://goto.arcgis.com/termsofuse/viewsummary' rel='nofollow ugc noopener noreferrer'><strong>View Summary</strong></a><strong>&nbsp;|&nbsp;</strong><a style='color:rgb(0, 121, 193); text-decoration-line:none;' target='_blank' href='https://goto.arcgis.com/termsofuse/viewtermsofuse' rel='nofollow ugc noopener noreferrer'><strong>View Terms of Use</strong></a></div>",
			"distribution": [
				{
					"@type": "dcat:Distribution",
					"title": "ArcGIS Hub Dataset",
					"format": "Web Page",
					"mediaType": "text/html",
					"accessURL": "https://www.pacificgeoportal.com/maps/esri::openstreetmap-streets-with-relief-1"
				},
				{
					"@type": "dcat:Distribution",
					"title": "ArcGIS GeoService",
					"format": "ArcGIS GeoServices REST API",
					"mediaType": "application/json",
					"accessURL": "https://basemaps.arcgis.com/arcgis/rest/services/OpenStreetMap_v2/VectorTileServer"
				}
			],
			"theme": [
				"geospatial"
			]
		},
		{
			"@type": "dcat:Dataset",
			"identifier": "https://www.arcgis.com/home/item.html?id=f455d84d5aab4d64b1191e0d2eed42b1",
			"landingPage": "https://www.pacificgeoportal.com/maps/esri::openstreetmap-streets-1",
			"title": "OpenStreetMap Streets",
			"description": "<div><p style='margin-bottom:1.55rem; margin-top:0px;'><span style='color:#b22222;'><font style='font-family:&quot;Avenir Next W01&quot;, &quot;Avenir Next W00&quot;, &quot;Avenir Next&quot;, Avenir, &quot;Helvetica Neue&quot;, sans-serif; font-size:16px;'><strong>Mature Support Notice:&nbsp;</strong></font></span><strong>This item is in&nbsp;</strong><a style='color:rgb(0, 97, 155); font-family:&quot;Avenir Next W01&quot;, &quot;Avenir Next W00&quot;, &quot;Avenir Next&quot;, Avenir, &quot;Helvetica Neue&quot;, sans-serif; font-size:16px; text-decoration-line:none;' target='_blank' href='https://goto.arcgis.com/lifecycle/content' rel='nofollow ugc noopener noreferrer'><strong>mature support</strong></a><strong>&nbsp;as of December 2024. A&nbsp;</strong><a style='background-color:rgb(255, 255, 255); border:0px solid currentcolor; box-sizing:border-box; color:rgb(0, 97, 155); font-family:&quot;Avenir Next&quot;, Avenir, &quot;Helvetica Neue&quot;, sans-serif; font-size:16px; font-style:normal; font-variant-caps:normal; font-variant-ligatures:normal; font-weight:400; letter-spacing:normal; line-height:1.5; text-align:start; text-decoration:none; text-indent:0px; text-transform:none; word-spacing:0px;' target='_blank' href='https://www.arcgis.com/home/item.html?id=643f29ef5ab94511912dd337c9e1a13b' rel='nofollow ugc noopener noreferrer'><strong>new version of this item</strong></a><strong>&nbsp;is available for your use. </strong>Esri recommends updating your maps and apps to use the new version. <span style='font-family:&quot;Avenir Next W01&quot;, &quot;Avenir Next W00&quot;, &quot;Avenir Next&quot;, Avenir, &quot;Helvetica Neue&quot;, sans-serif; font-size:16px;'>See&nbsp;</span><a style='color:rgb(0, 97, 155); font-family:&quot;Avenir Next W01&quot;, &quot;Avenir Next W00&quot;, &quot;Avenir Next&quot;, Avenir, &quot;Helvetica Neue&quot;, sans-serif; font-size:16px; text-decoration-line:none;' target='_blank' href='https://goto.arcgis.com/blogs/osmmaturesupport' rel='nofollow ugc noopener noreferrer'>blog</a><span style='font-family:inherit; font-size:14px;'>&nbsp;</span><span style='font-family:&quot;Avenir Next W01&quot;, &quot;Avenir Next W00&quot;, &quot;Avenir Next&quot;, Avenir, &quot;Helvetica Neue&quot;, sans-serif; font-size:16px;'>for more information.</span></p></div><div><span style='font-family:&quot;Avenir Next W01&quot;, &quot;Avenir Next W00&quot;, &quot;Avenir Next&quot;, Avenir, &quot;Helvetica Neue&quot;, sans-serif; font-size:16px;'>This tile layer presents a vector basemap of OpenStreetMap (OSM) data hosted by Esri.&nbsp;</span><span style='font-family:&quot;Avenir Next&quot;, Avenir, &quot;Helvetica Neue&quot;, Helvetica, Arial, sans-serif; font-size:15px;'><font style='font-family:&quot;Avenir Next W01&quot;, &quot;Avenir Next W00&quot;, &quot;Avenir Next&quot;, Avenir, &quot;Helvetica Neue&quot;, sans-serif; font-size:16px;'>This version of the map is rendered in a style similar to the Esri Street Map.&nbsp;</font></span><span style='font-family:&quot;Avenir Next W01&quot;, &quot;Avenir Next W00&quot;, &quot;Avenir Next&quot;, Avenir, &quot;Helvetica Neue&quot;, sans-serif; font-size:16px;'>Created from the&nbsp;</span><a style='color:rgb(0, 97, 155); font-family:inherit; font-size:16px; text-decoration-line:none;' target='_blank' href='https://daylightmap.org/2024/05/03/sunsetting-daylight.html' rel='nofollow ugc noopener noreferrer'>sunsetted Daylight map distribution</a><span style='font-family:&quot;Avenir Next W01&quot;, &quot;Avenir Next W00&quot;, &quot;Avenir Next&quot;, Avenir, &quot;Helvetica Neue&quot;, sans-serif; font-size:16px;'>, data updates supporting this layer are no longer available.</span></div><div style='font-family:inherit; font-size:16px;'><div style='font-family:inherit;'>&nbsp;</div><div style='font-family:inherit;'>OpenStreetMap is an open collaborative project to create a free editable map of the world. Volunteers gather location data using GPS, local knowledge, and other free sources of information and upload it. The resulting free map can be viewed and downloaded from the OpenStreetMap site: www.OpenStreetMap.org. Esri is a supporter of the OSM project.&nbsp;</div></div>",
			"keyword": [
				"basemap",
				"OpenStreetMap",
				"OSM",
				"Streets",
				"osmStreets",
				"wma",
				"vector",
				"roads",
				"transportation"
			],
			"issued": "2019-05-03T22:40:29.000Z",
			"modified": "2026-04-30T21:09:36.000Z",
			"publisher": {
				"name": "Esri"
			},
			"contactPoint": {
				"@type": "vcard:Contact",
				"fn": "esri_vector",
				"hasEmail": "{{orgContactEmail}}"
			},
			"accessLevel": "public",
			"spatial": "-140.0000,-60.0000,140.0000,60.0000",
			"license": "<p><img style='font-family:&quot;Avenir Next W01&quot;, &quot;Avenir Next W00&quot;, &quot;Avenir Next&quot;, Avenir, &quot;Helvetica Neue&quot;, sans-serif; font-size:16px; height:auto; max-width:100%;' src='https://downloads.esri.com/blogs/arcgisonline/esrilogo_new.png' width='113' height='43' /><span style='font-family:&quot;Avenir Next W01&quot;, &quot;Avenir Next W00&quot;, &quot;Avenir Next&quot;, Avenir, &quot;Helvetica Neue&quot;, sans-serif; font-size:16px;'> This work is licensed under the Esri Master License Agreement.</span></p><div style='font-family:&quot;Avenir Next W01&quot;, &quot;Avenir Next W00&quot;, &quot;Avenir Next&quot;, Avenir, &quot;Helvetica Neue&quot;, sans-serif; font-size:16px;'><a style='color:rgb(0, 121, 193); text-decoration-line:none;' target='_blank' href='https://goto.arcgis.com/termsofuse/viewsummary' rel='nofollow ugc noopener noreferrer'><strong>View Summary</strong></a><strong>&nbsp;|&nbsp;</strong><a style='color:rgb(0, 121, 193); text-decoration-line:none;' target='_blank' href='https://goto.arcgis.com/termsofuse/viewtermsofuse' rel='nofollow ugc noopener noreferrer'><strong>View Terms of Use</strong></a></div>",
			"distribution": [
				{
					"@type": "dcat:Distribution",
					"title": "ArcGIS Hub Dataset",
					"format": "Web Page",
					"mediaType": "text/html",
					"accessURL": "https://www.pacificgeoportal.com/maps/esri::openstreetmap-streets-1"
				},
				{
					"@type": "dcat:Distribution",
					"title": "ArcGIS GeoService",
					"format": "ArcGIS GeoServices REST API",
					"mediaType": "application/json",
					"accessURL": "https://basemaps.arcgis.com/arcgis/rest/services/OpenStreetMap_v2/VectorTileServer"
				}
			],
			"theme": [
				"geospatial"
			]
		},
		{
			"@type": "dcat:Dataset",
			"identifier": "https://www.arcgis.com/home/item.html?id=a239f73530284c509ab574513dd0cf58&sublayer=0",
			"landingPage": "https://www.pacificgeoportal.com/datasets/esri::global-water-provinces",
			"title": "Global Water Provinces",
			"description": "<p><span style='color:#b22222;'><strong>Retirement Notice:&nbsp;</strong></span><strong>This item is in&nbsp;</strong><a target='_blank' href='https://goto.arcgis.com/lifecycle/content' rel='nofollow ugc noopener noreferrer'><strong>mature support</strong></a><strong>&nbsp;as of April 2026 and will be retired in December 2027.&nbsp;A&nbsp;</strong><a target='_blank' href='https://www.arcgis.com/home/item.html?id=801b9cf3cde64688908e45d860def727' rel='nofollow ugc noopener noreferrer'><strong>new version of this item</strong></a><strong>&nbsp;is available for your use.</strong> Esri recommends updating your maps and apps to use the new version.</p><div><p style='margin:0in 0in 8pt;'>River basins or hydrologic units are often the spatial unit used for aggregating and analyzing components of the water cycle such as precipitation, runoff, riverine discharge, etc. The hydroSHEDS dataset, derived from the <span style='background-attachment:initial; background-clip:initial; background-image:initial; background-origin:initial; background-position:initial; background-repeat:initial; background-size:initial;'>Shuttle Radar Topography Mission</span><span>, are the most commonly used global hydrologic unit for these analyses. But when planning water use or gaps, political boundaries need to be considered. Water provinces (Straatsma et al 2020) provide a much more realistic hydrologic unit for such purposes.</span></p><p style='margin:0in 0in 8pt;'><span>Esri’s World Administration Divisions (2011) defines 3,300 subnational units. Areas less than 150,000 sq km were aggregated into 1,099 regions. The water provinces were then calculated by overlaying these regions with the major basins from hydroSHEDS.&nbsp; After sliver polygons were removed, the result was 1,604 unique units based on river basins but constrained by political boundaries. These water provinces provide a suitable unit for </span>longterm water use planning, especially at local scales.</p></div><div>A more detailed description can be accessed&nbsp;<a target='_blank' href='https://esri.maps.arcgis.com/sharing/rest/content/items/5804c5e25403444d862f88fa8f57b79a/data' rel='nofollow ugc noopener noreferrer'>here</a>.&nbsp;</div><div>&nbsp;</div><p><img src='https://esri-sciences-useast.s3.us-east-1.amazonaws.com/env_water/global_water_provinces/waterprovinces.png' width='1000' height='400' /></p><p><span style='background-color:rgb(255,255,255); color:rgb(74,74,74); font-family:&quot;Avenir Next&quot;, Avenir, &quot;Helvetica Neue&quot;, sans-serif; font-size:large;'><span style='border:0px solid currentcolor; box-sizing:border-box; font-style:normal; font-variant-caps:normal; font-variant-ligatures:normal; font-weight:400; letter-spacing:normal; line-height:1.5; text-align:start; text-decoration-color:initial; text-decoration-style:initial; text-indent:0px; text-transform:none; word-spacing:0px;'><strong>Dataset Summary</strong></span></span><br /><strong>Phenomenon Mapped</strong><span style='background-color:rgb(255,255,255); color:rgb(74,74,74); font-family:&quot;Avenir Next&quot;, Avenir, &quot;Helvetica Neue&quot;, sans-serif; font-size:16px;'><span style='display:inline !important; float:none; font-style:normal; font-variant-caps:normal; font-variant-ligatures:normal; font-weight:400; letter-spacing:normal; text-align:start; text-decoration-color:initial; text-decoration-style:initial; text-indent:0px; text-transform:none; word-spacing:0px;'>: Water provinces of the world</span></span><br /><strong>Geographic Extent</strong><span style='background-color:rgb(255,255,255); color:rgb(74,74,74); font-family:&quot;Avenir Next&quot;, Avenir, &quot;Helvetica Neue&quot;, sans-serif; font-size:16px;'><span style='display:inline !important; float:none; font-style:normal; font-variant-caps:normal; font-variant-ligatures:normal; font-weight:400; letter-spacing:normal; text-align:start; text-decoration-color:initial; text-decoration-style:initial; text-indent:0px; text-transform:none; word-spacing:0px;'>: Global</span></span><br /><strong>Layer Projection</strong><span style='background-color:rgb(255,255,255); color:rgb(74,74,74); font-family:&quot;Avenir Next&quot;, Avenir, &quot;Helvetica Neue&quot;, sans-serif; font-size:16px;'><span style='display:inline !important; float:none; font-style:normal; font-variant-caps:normal; font-variant-ligatures:normal; font-weight:400; letter-spacing:normal; text-align:start; text-decoration-color:initial; text-decoration-style:initial; text-indent:0px; text-transform:none; word-spacing:0px;'>: Web Mercator Auxiliary Sphere&nbsp;</span></span><br /><strong>Update Frequency</strong><span style='background-color:rgb(255,255,255); color:rgb(74,74,74); font-family:&quot;Avenir Next&quot;, Avenir, &quot;Helvetica Neue&quot;, sans-serif; font-size:16px;'><span style='display:inline !important; float:none; font-style:normal; font-variant-caps:normal; font-variant-ligatures:normal; font-weight:400; letter-spacing:normal; text-align:start; text-decoration-color:initial; text-decoration-style:initial; text-indent:0px; text-transform:none; word-spacing:0px;'>: Semi-annual</span></span><br /><strong>Source</strong><span style='background-color:rgb(255,255,255); color:rgb(74,74,74); font-family:&quot;Avenir Next&quot;, Avenir, &quot;Helvetica Neue&quot;, sans-serif; font-size:16px;'><span style='display:inline !important; float:none; font-style:normal; font-variant-caps:normal; font-variant-ligatures:normal; font-weight:400; letter-spacing:normal; text-align:start; text-decoration-color:initial; text-decoration-style:initial; text-indent:0px; text-transform:none; word-spacing:0px;'>:&nbsp;</span></span><a target='_blank' href='https://github.com/UU-Hydro/PCR-GLOBWB_model?tab=readme-ov-file' rel='nofollow ugc noopener noreferrer'><span style='background-color:rgb(255,255,255); color:rgb(74,74,74); font-family:&quot;Avenir Next&quot;, Avenir, &quot;Helvetica Neue&quot;, sans-serif; font-size:16px;'><span style='display:inline !important; float:none; font-style:normal; font-variant-caps:normal; font-variant-ligatures:normal; font-weight:400; letter-spacing:normal; text-align:start; text-decoration-color:initial; text-decoration-style:initial; text-indent:0px; text-transform:none; word-spacing:0px;'>PCR-GLOB</span></span>WB</a><br /><strong>Data Vintage</strong><span style='background-color:rgb(255,255,255); color:rgb(74,74,74); font-family:&quot;Avenir Next&quot;, Avenir, &quot;Helvetica Neue&quot;, sans-serif; font-size:16px;'><span style='display:inline !important; float:none; font-style:normal; font-variant-caps:normal; font-variant-ligatures:normal; font-weight:400; letter-spacing:normal; text-align:start; text-decoration-color:initial; text-decoration-style:initial; text-indent:0px; text-transform:none; word-spacing:0px;'>:&nbsp;June 2013</span></span><br /><strong>Publication Date</strong><span style='background-color:rgb(255,255,255); color:rgb(74,74,74); font-family:&quot;Avenir Next&quot;, Avenir, &quot;Helvetica Neue&quot;, sans-serif; font-size:16px;'><span style='display:inline !important; float:none; font-style:normal; font-variant-caps:normal; font-variant-ligatures:normal; font-weight:400; letter-spacing:normal; text-align:start; text-decoration-color:initial; text-decoration-style:initial; text-indent:0px; text-transform:none; word-spacing:0px;'>: March 2021</span></span></p><p><span style='background-color:rgb(255,255,255); color:rgb(74,74,74); font-family:&quot;Avenir Next&quot;, Avenir, &quot;Helvetica Neue&quot;, sans-serif; font-size:18px;'><span style='border:0px solid currentcolor; box-sizing:border-box; font-style:normal; font-variant-caps:normal; font-variant-ligatures:normal; font-weight:400; letter-spacing:normal; line-height:1.5; text-align:start; text-decoration-color:initial; text-decoration-style:initial; text-indent:0px; text-transform:none; word-spacing:0px;'><strong>Questions?</strong></span></span><br /><span style='background-color:rgb(255,255,255); color:rgb(74,74,74); font-family:&quot;Avenir Next&quot;, Avenir, &quot;Helvetica Neue&quot;, sans-serif; font-size:16px;'><span style='display:inline !important; float:none; font-style:normal; font-variant-caps:normal; font-variant-ligatures:normal; font-weight:400; letter-spacing:normal; text-align:start; text-decoration-color:initial; text-decoration-style:initial; text-indent:0px; text-transform:none; word-spacing:0px;'>Please leave a comment below if you have a question about this layer, and we will get back to you as soon as possible.</span></span></p>",
			"keyword": [
				"landscape2",
				"retiring-2027-12"
			],
			"issued": "2021-03-01T17:08:24.000Z",
			"modified": "2026-03-03T21:15:58.598Z",
			"publisher": {
				"name": "Esri"
			},
			"contactPoint": {
				"@type": "vcard:Contact",
				"fn": "esri_landscape2",
				"hasEmail": "{{orgContactEmail}}"
			},
			"accessLevel": "public",
			"spatial": "-179.9997,-55.9796,179.9999,83.1132",
			"license": "<p><img src='https://downloads.esri.com/blogs/arcgisonline/esrilogo_new.png' /> &nbsp;This work is licensed under the Esri Master License Agreement.</p><div><a target='_blank' href='https://goto.arcgis.com/termsofuse/viewsummary' rel='nofollow ugc noopener noreferrer'><strong>View Summary</strong></a> | <a target='_blank' href='https://goto.arcgis.com/termsofuse/viewtermsofuse' rel='nofollow ugc noopener noreferrer'><strong>View Terms of Use</strong></a></div>",
			"distribution": [
				{
					"@type": "dcat:Distribution",
					"title": "ArcGIS Hub Dataset",
					"format": "Web Page",
					"mediaType": "text/html",
					"accessURL": "https://www.pacificgeoportal.com/datasets/esri::global-water-provinces"
				},
				{
					"@type": "dcat:Distribution",
					"title": "ArcGIS GeoService",
					"format": "ArcGIS GeoServices REST API",
					"mediaType": "application/json",
					"accessURL": "https://services.arcgis.com/P3ePLMYs2RVChkJx/arcgis/rest/services/Global_Water_Provinces/FeatureServer/0"
				},
				{
					"@type": "dcat:Distribution",
					"title": "CSV",
					"format": "CSV",
					"mediaType": "text/csv",
					"accessURL": "https://www.pacificgeoportal.com/api/download/v1/items/a239f73530284c509ab574513dd0cf58/csv?layers=0"
				},
				{
					"@type": "dcat:Distribution",
					"title": "Shapefile",
					"format": "ZIP",
					"mediaType": "application/zip",
					"accessURL": "https://www.pacificgeoportal.com/api/download/v1/items/a239f73530284c509ab574513dd0cf58/shapefile?layers=0"
				},
				{
					"@type": "dcat:Distribution",
					"title": "GeoJSON",
					"format": "GeoJSON",
					"mediaType": "application/vnd.geo+json",
					"accessURL": "https://www.pacificgeoportal.com/api/download/v1/items/a239f73530284c509ab574513dd0cf58/geojson?layers=0"
				},
				{
					"@type": "dcat:Distribution",
					"title": "KML",
					"format": "KML",
					"mediaType": "application/vnd.google-earth.kml+xml",
					"accessURL": "https://www.pacificgeoportal.com/api/download/v1/items/a239f73530284c509ab574513dd0cf58/kml?layers=0"
				},
				{
					"@type": "dcat:Distribution",
					"title": "File Geodatabase",
					"format": "ZIP",
					"mediaType": "application/zip",
					"accessURL": "https://www.pacificgeoportal.com/api/download/v1/items/a239f73530284c509ab574513dd0cf58/filegdb?layers=0"
				},
				{
					"@type": "dcat:Distribution",
					"title": "Feature Collection",
					"format": "TXT",
					"mediaType": "text/plain",
					"accessURL": "https://www.pacificgeoportal.com/api/download/v1/items/a239f73530284c509ab574513dd0cf58/featureCollection?layers=0"
				},
				{
					"@type": "dcat:Distribution",
					"title": "Excel",
					"format": "XLSX",
					"mediaType": "application/vnd.ms-excel",
					"accessURL": "https://www.pacificgeoportal.com/api/download/v1/items/a239f73530284c509ab574513dd0cf58/excel?layers=0"
				},
				{
					"@type": "dcat:Distribution",
					"title": "GeoPackage",
					"format": "GPKG",
					"mediaType": "application/geopackage+sqlite3",
					"accessURL": "https://www.pacificgeoportal.com/api/download/v1/items/a239f73530284c509ab574513dd0cf58/geoPackage?layers=0"
				},
				{
					"@type": "dcat:Distribution",
					"title": "SQLite Geodatabase",
					"format": "GDB",
					"mediaType": "application/geopackage+sqlite3",
					"accessURL": "https://www.pacificgeoportal.com/api/download/v1/items/a239f73530284c509ab574513dd0cf58/sqlite?layers=0"
				}
			],
			"theme": [
				"geospatial"
			]
		},
		{
			"@type": "dcat:Dataset",
			"identifier": "https://www.arcgis.com/home/item.html?id=cfcb7609de5f478eb7666240902d4d3d",
			"landingPage": "https://www.pacificgeoportal.com/datasets/esri::sentinel-2-10m-land-use-land-cover-time-series-1",
			"title": "Sentinel-2 10m Land Use/Land Cover Time Series",
			"description": "<p>This layer displays a global map of land use/land cover (LULC) derived from ESA Sentinel-2 imagery at 10m resolution. Each year is generated with&nbsp;<a target='_blank' href='https://www.impactobservatory.com/global_maps' rel='nofollow ugc noopener noreferrer'>Impact Observatory’s deep learning AI land classification model</a>, trained using&nbsp;billions of human-labeled image pixels from the National Geographic Society. The global maps are produced by applying this model to the Sentinel-2 Level-2A image collection on Microsoft’s Planetary Computer, processing over 400,000 Earth observations per year.<br /><br />The algorithm generates LULC predictions for nine classes, described in detail below. &nbsp;<br /><br />The year 2017 has a land cover class assigned for every pixel, but its class is based upon fewer images than the other years. The years 2018-2025 are based upon a more complete set of imagery. For this reason, the year 2017 may have less accurate land cover class assignments than the years 2018-2025.<br />&nbsp;</p><p><span style='font-size:24px;'><strong>Key Properties&nbsp;</strong></span></p><div>&nbsp;</div><div><strong>Variable mapped</strong>:&nbsp;Land use/land cover in 2017, 2018, 2019, 2020, 2021, 2022, 2023, 2024, 2025<br /><strong>Source Data Coordinate System</strong>:&nbsp;Universal Transverse Mercator (UTM) WGS84<br /><strong>Service Coordinate System</strong>: Web Mercator Auxiliary Sphere WGS84 (EPSG:3857)<br /><strong>Extent</strong>:&nbsp;Global<br /><strong>Source imagery</strong>:&nbsp;Sentinel-2 L2A<br /><strong>Cell Size</strong>:&nbsp;10-meters<br /><strong>Type</strong>:&nbsp;Thematic<br /><strong>Attribution</strong>: Esri, Impact Observatory</div><div><strong>Analysis</strong>: Optimized for analysis</div><div><strong>Class Definitions:&nbsp;</strong><br />&nbsp;</div><div><figure><table style='border-collapse:collapse;' width='auto' cellpadding='0' cellspacing='0' border='0'><tbody><tr style='height:15pt;' height='20'><td style='height:15pt; text-align:center; width:48pt;' height='20' width='64'><span style='font-size:large;'><strong>Value</strong></span></td><td style='text-align:center; width:98pt;' width='75'><span style='font-size:large;'><strong>Name</strong></span></td><td style='text-align:left; width:572pt;' width='762'><span style='font-size:large;'><strong>Description</strong></span></td></tr><tr style='height:45pt;' height='60'><td style='height:45pt; text-align:center;' height='60'><span style='color:#000000; font-size:medium;'>1</span></td><td style='text-align:center;'><span style='color:#000000; font-size:medium;'>Water</span></td><td style='width:572pt;' width='762'><span style='color:#000000; font-size:medium;'>Areas where water was predominantly present throughout the year; may not cover areas with sporadic or ephemeral water; contains little to no sparse vegetation, no rock outcrop nor built up features like docks; examples: rivers, ponds, lakes, oceans, flooded salt plains.</span></td></tr><tr style='height:45pt;' height='60'><td style='height:45pt; text-align:center;' height='60'><span style='color:#000000; font-size:medium;'>2</span></td><td style='text-align:center;'><span style='color:#000000; font-size:medium;'>Trees</span></td><td style='width:572pt;' width='762'><span style='color:#000000; font-size:medium;'>Any significant clustering of tall (~15 feet or higher) dense vegetation, typically with a closed or dense canopy; examples: wooded vegetation,&nbsp; clusters of dense tall vegetation within savannas, plantations, swamp or mangroves (dense/tall vegetation with ephemeral water or canopy too thick to detect water underneath).</span></td></tr><tr style='height:45pt;' height='60'><td style='height:45pt; text-align:center;' height='60'><span style='color:#000000; font-size:medium;'>4</span></td><td style='text-align:center;'><span style='color:#000000; font-size:medium;'>Flooded vegetation</span></td><td style='width:572pt;' width='762'><span style='color:#000000; font-size:medium;'>Areas of any type of vegetation with obvious intermixing of water throughout a majority of the year; seasonally flooded area that is a mix of grass/shrub/trees/bare ground; examples: flooded mangroves, emergent vegetation, rice paddies and other heavily irrigated and inundated agriculture.</span></td></tr><tr style='height:30pt;' height='40'><td style='height:30pt; text-align:center;' height='40'><span style='color:#000000; font-size:medium;'>5</span></td><td style='text-align:center;'><span style='color:#000000; font-size:medium;'>Crops</span></td><td style='width:572pt;' width='762'><span style='color:#000000; font-size:medium;'>Human planted/plotted cereals, grasses, and crops not at tree height; examples: corn, wheat, soy, fallow plots of structured land.</span></td></tr><tr style='height:45pt;' height='60'><td style='height:45pt; text-align:center;' height='60'><span style='color:#000000; font-size:medium;'>7</span></td><td style='text-align:center;'><span style='color:#000000; font-size:medium;'>Built Area</span></td><td style='width:572pt;' width='762'><span style='color:#000000; font-size:medium;'>Human made structures; major road and rail networks; large homogenous impervious surfaces including parking structures, office buildings and residential housing; examples: houses, dense villages / towns / cities, paved roads, asphalt.</span></td></tr><tr style='height:30pt;' height='40'><td style='height:30pt; text-align:center;' height='40'><span style='color:#000000; font-size:medium;'>8</span></td><td style='text-align:center;'><span style='color:#000000; font-size:medium;'>Bare ground</span></td><td style='width:572pt;' width='762'><span style='color:#000000; font-size:medium;'>Areas of rock or soil with very sparse to no vegetation for the entire year; large areas of sand and deserts with no to little vegetation; examples: exposed rock or soil, desert and sand dunes, dry salt flats/pans, dried lake beds, mines.</span></td></tr><tr style='height:30pt;' height='40'><td style='height:30pt; text-align:center;' height='40'><span style='color:#000000; font-size:medium;'>9</span></td><td style='text-align:center;'><span style='color:#000000; font-size:medium;'>Snow/Ice</span></td><td style='width:572pt;' width='762'><span style='color:#000000; font-size:medium;'>Large homogenous areas of permanent snow or ice, typically only in mountain areas or highest latitudes; examples: glaciers, permanent snowpack, snow fields.</span></td></tr><tr style='height:15pt;' height='20'><td style='height:15pt; text-align:center;' height='20'><span style='color:#000000; font-size:medium;'>10</span></td><td style='text-align:center;'><span style='color:#000000; font-size:medium;'>Clouds</span></td><td style='width:572pt;' width='762'><span style='color:#000000; font-size:medium;'>No land cover information due to persistent cloud cover.</span></td></tr><tr style='height:90pt;' height='120'><td style='height:90pt; text-align:center;' height='120'><span style='color:#000000; font-size:medium;'>11</span></td><td style='text-align:center;'><span style='color:#000000; font-size:medium;'>Rangeland</span></td><td style='width:572pt;' width='762'><span style='color:#000000; font-size:medium;'>Open areas covered in homogenous grasses with little to no taller vegetation; wild cereals and grasses with no obvious human plotting (i.e., not a plotted field); examples: natural meadows and fields with sparse to no tree cover, open savanna with few to no trees, parks/golf courses/lawns, pastures. Mix of small clusters of plants or single plants dispersed on a landscape that shows exposed soil or rock; scrub-filled clearings within dense forests that are clearly not taller than trees; examples: moderate to sparse cover of bushes, shrubs and tufts of grass, savannas with very sparse grasses, trees or other plants.</span></td></tr></tbody></table></figure><p><strong>NOTE:</strong> Land use focus does not provide the spatial detail of a land cover map. As such, for the built area classification, yards, parks, and groves will appear as built area rather than trees or rangeland classes.</p><p><br /><span style='font-size:24px;'>Usage Information and Best Practices</span></p><div style='font-size:medium;'><span style='font-size:large;'>Processing Templates</span></div><div><ul><li><span style='font-size:medium;'>This layer includes a number of preconfigured processing templates (raster function templates) to provide on-the-fly data rendering and class isolation for visualization and analysis.&nbsp;</span></li><li><span style='font-size:medium;'>Each processing template includes labels and descriptions to characterize the intended usage. This may include for visualization, for analysis, or for both visualization and analysis.</span></li></ul></div><p>&nbsp;</p><p><span style='font-size:large;'>Visualization</span></p><ul><li><span style='font-size:medium;'>The default rendering on this layer displays all classes.</span></li><li><span style='font-size:medium;'>There are a number of on-the-fly renderings/processing templates designed specifically for data visualization.</span></li><li><span style='font-size:medium;'>By default, the most recent year is displayed.&nbsp;To discover and isolate specific years for visualization in Map Viewer, try using the&nbsp;</span><a style='font-size:medium;' target='_blank' href='https://doc.arcgis.com/en/arcgis-online/create-maps/image-collection-explorer.htm' rel='nofollow ugc noopener noreferrer'>Image Collection Explorer</a><span style='font-size:medium;'>.</span></li></ul><p>&nbsp;</p><p><span style='font-size:large;'>Analysis</span></p><ul><li><span style='font-size:medium;'><strong>In order to leverage the optimization for analysis, the capability must be enabled by your ArcGIS organization administrator. More information on enabling this feature can be found in the ‘Regional data hosting’ section of this </strong></span><a target='_blank' href='https://doc.arcgis.com/en/arcgis-online/administer/configure-security.htm#ESRI_SECTION1_EFD75BC6167B45F2AF510A33B55E20F8' rel='nofollow ugc noopener noreferrer'><span style='font-size:medium;'><strong>help doc</strong></span></a><span style='font-size:medium;'><strong>.</strong></span></li><li><span style='font-family:inherit; font-size:medium;'>Optimized for analysis means this layer does not have size constraints for analysis and it is recommended for multisource analysis with other layers optimized for analysis. See this </span><a target='_blank' href='https://www.arcgis.com/home/group.html?id=55f9f38754f8438bade85c93061bd84c' rel='nofollow ugc noopener noreferrer'><span style='font-family:inherit; font-size:medium;'>group </span></a><span style='font-family:inherit; font-size:medium;'>for a complete list of imagery layers optimized for analysis.</span></li><li><span style='font-size:medium;'>Prior to running analysis, users should always provide some form of data selection with either a&nbsp;</span><a target='_blank' href='https://doc.arcgis.com/en/arcgis-online/create-maps/apply-filters-mv.htm' rel='nofollow ugc noopener noreferrer'><span style='font-size:medium;'>layer filter</span></a><span style='font-size:medium;'>&nbsp;(e.g. for a specific date range, cloud cover percent, mission, etc.) or by selecting specific images. To discover and isolate specific images for analysis in Map Viewer, try using the&nbsp;</span><a target='_blank' href='https://doc.arcgis.com/en/arcgis-online/create-maps/image-collection-explorer.htm' rel='nofollow ugc noopener noreferrer'><span style='font-size:medium;'>Image Collection Explorer</span></a><span style='font-size:medium;'>.</span></li><li><a target='_blank' href='https://doc.arcgis.com/en/arcgis-online/analyze/zonal-statistics-mv-ra.htm' rel='nofollow ugc noopener noreferrer'>Zonal Statistics</a>&nbsp;is a common tool used for understanding the composition of a specified area by reporting the total estimates for each of the classes.&nbsp;</li></ul><p>&nbsp;</p><p><span style='font-size:large;'>General</span></p><ul><li><span style='font-size:medium;'>If you are new to Sentinel-2 LULC, the&nbsp;</span><a target='_blank' href='https://livingatlas.arcgis.com/landcoverexplorer/' rel='nofollow ugc noopener noreferrer'><span style='font-size:medium;'>Sentinel-2 Land Cover Explorer&nbsp;</span></a><span style='font-size:medium;'>provides a good introductory user experience for working with this imagery layer. For more information, see this&nbsp;</span><a target='_blank' href='https://www.esri.com/arcgis-blog/products/arcgis-living-atlas/imagery/global-land-cover-revealed' rel='nofollow ugc noopener noreferrer'><span style='font-size:medium;'>Quick Start Guide</span></a>.</li><li>Global land use/land cover maps provide information on conservation planning, food security, and hydrologic modeling, among other things. This dataset can be used to visualize land use/land cover anywhere on Earth.</li></ul><p>&nbsp;</p><p><span style='font-size:x-large;'>Classification Process</span><br /><br />These maps include Version 003 of the global Sentinel-2 land use/land cover data product. It is produced by a deep learning model trained using over five billion hand-labeled Sentinel-2 pixels, sampled from over 20,000 sites distributed across all major biomes of the world.<br /><br />The underlying deep learning model uses 6-bands of Sentinel-2 L2A surface reflectance data: visible blue, green, red, near infrared, and two shortwave infrared bands. To create the final map, the model is run on multiple dates of imagery throughout the year, and the outputs are composited into a final representative map for each year.<br /><br />The input Sentinel-2 L2A data was accessed via Microsoft’s Planetary Computer and scaled using Microsoft Azure Batch.</p></div><div>&nbsp;</div><div><br /><strong>Citation</strong><br />Karra, Kontgis, et al. “Global land use/land cover with Sentinel-2 and deep learning.” IGARSS 2021-2021 IEEE International Geoscience and Remote Sensing Symposium. IEEE, 2021.<br /><br /><strong>Acknowledgements</strong><br /><br />Training data for this project makes use of the National Geographic Society Dynamic World training dataset, produced for the Dynamic World Project by National Geographic Society in partnership with Google and the World Resources Institute.</div>",
			"keyword": [
				"Sentinel-2",
				"Land Cover",
				"Land Use",
				"land",
				"use",
				"cover",
				"10m",
				"global",
				"world",
				"lulc",
				"Time Series",
				"AnalysisOptimized",
				"Analysis",
				"Optimized"
			],
			"issued": "2022-10-18T18:44:50.000Z",
			"modified": "2026-04-23T05:03:20.000Z",
			"publisher": {
				"name": "Esri"
			},
			"contactPoint": {
				"@type": "vcard:Contact",
				"fn": "esri_imagery",
				"hasEmail": "{{orgContactEmail}}"
			},
			"accessLevel": "public",
			"spatial": "-180.0000,-80.0134,180.0000,84.0326",
			"license": "https://creativecommons.org/licenses/by/4.0",
			"distribution": [
				{
					"@type": "dcat:Distribution",
					"title": "ArcGIS Hub Dataset",
					"format": "Web Page",
					"mediaType": "text/html",
					"accessURL": "https://www.pacificgeoportal.com/datasets/esri::sentinel-2-10m-land-use-land-cover-time-series-1"
				},
				{
					"@type": "dcat:Distribution",
					"title": "ArcGIS GeoService",
					"format": "ArcGIS GeoServices REST API",
					"mediaType": "application/json",
					"accessURL": "https://ic.imagery1.arcgis.com/arcgis/rest/services/Sentinel2_10m_LandCover/ImageServer"
				}
			],
			"theme": [
				"geospatial"
			]
		},
		{
			"@type": "dcat:Dataset",
			"identifier": "https://www.arcgis.com/home/item.html?id=53c82af69cae4c1f99902c0e0d456bf8",
			"landingPage": "https://www.pacificgeoportal.com/datasets/esri::world-lithology",
			"title": "World Lithology",
			"description": "<div>The description of the chemistry, mineral composition, and physical properties of rocks is known as <a href='https://en.wikipedia.org/wiki/Lithology' rel='nofollow ugc' target='_blank'>lithology</a>. The study of lithology can yield valuable insights into the formation and productivity of soils, agricultural suitability, the movement of water, and other important properties of the environment that are influenced by underlying rock type.</div><div><br /></div><div><font size='4'>Dataset Summary</font><br /></div><div><span><br /></span></div><div><span>The data for this layer comes from the </span><a href='https://www.geo.uni-hamburg.de/de/geologie/forschung/geochemie/glim.html' rel='nofollow ugc' target='_blank'>Global Lithological map</a><span> (GLiM). Esri obtained the data in late 2013 and rasterized it at 250m resolution to produce the data in this layer. The basis for lithological types in this layer was the Level1 field value in the GLiM attribute data, which contained these potential values (see below for index of values and Lithology Classes):</span><br /></div><div><div><ul><li>Unconsolidated Sediment</li><li>Carbonate Sedimentary Rocks</li><li>Mixed Sedimentary Rocks</li><li>Siliclastic Sedimentary Rocks</li><li>Evaporites</li><li>Pyroclastic</li><li>Metamorphic Rock</li><li>Acid Plutonics</li><li>Intermediate <span>Plutonics</span></li><li>Basic <span>Plutonics</span></li><li>Acid Volcanics</li><li>Intermediate Volcanics</li><li>Basic Volcanics</li><li>Ice and Glaciers</li><li>Water Bodies</li><li>No Data</li></ul></div><div>The GLiM represents the rock types of the Earth surface with 1,235,400 polygons that were characterized by the authors as being of an average mapping scale of 1:3,750,000 and over 100 times more detailed than previous global lithological maps.<br /></div><div><br /></div><div>The recommended citation for source data is:</div><div><br /></div><div><span>Hartmann, Jörg; Moosdorf, Nils (2012):</span><span style='text-indent:-14.6666669845581px;'> Global Lithological Map Database v1.0 (gridded to 0.5° spatial resolution). doi:10.1594/PANGAEA.788537,</span><br /></div></div><div>Supplement to:<span style='text-indent:-14.6666669845581px;'> </span>Hartmann, Jens; Moosdorf, Nils (2012):<span style='text-indent:-14.6666669845581px;'> </span><a href='https://www.researchgate.net/publication/233851696_The_new_global_lithological_map_database_%28GLiM%29_A_representation_of_rock_properties_at_the_Earth_surface' rel='nofollow ugc' target='_blank'>The new global lithological map database GLiM: A representation of rock properties at the Earth surface</a><span style='text-indent:-14.6666669845581px;'>. </span>Geochemistry, Geophysics, Geosystems<span style='text-indent:-14.6666669845581px;'>, </span>13<span style='text-indent:-14.6666669845581px;'>, Q12004, </span><a href='https://doi.pangaea.de/10.1029/2012GC004370' rel='nofollow ugc' style='text-indent:-14.6666669845581px;' target='_blank'>doi:10.1029/2012GC004370</a><br /></div><div><br /></div><div>This layer is part of the Ecophysiographic Project and is one of the four input layers used to create the <a href='https://www.arcgis.com/home/item.html?id=e55c8b1919854715a0d0ca5762c4dec9' rel='nofollow ugc' target='_blank'>World Ecological Land Units Map</a>.<br /></div><div><br /></div><div><font size='4'>What can you do with this layer?</font></div><div><span><br /></span></div><div><span>This layer is suitable for both visualization and analysis. It can be used in ArcGIS Online in web maps and applications and can be used in ArcGIS Desktop. </span></div><div><span><br /></span></div><div><span>This layer has </span><a href='https://resources.arcgis.com/en/help/main/10.2/index.html#//00sp00000007000000' rel='nofollow ugc' target='_blank'>query</a><span>, </span><a href='https://resources.arcgis.com/en/help/main/10.2/index.html#//00s500000010000000' rel='nofollow ugc' target='_blank'>identify</a><span>, and </span><a href='https://resources.arcgis.com/en/help/main/10.2/index.html#/Downloading_data_from_an_image_service/00sp00000016000000/' rel='nofollow ugc' target='_blank'>export</a><span> image services available. This layer is restricted to a maximum area of 16,000 x 16,000 pixels - an area 4,000 kilometers on a side or an area approximately the size of Europe. </span></div><div><span><br /></span></div><div><div style='margin:0px; padding:0px;'>The source data for this layer are available <a href='https://doi.pangaea.de/10.1594/PANGAEA.788537' rel='nofollow ugc' target='_blank'>here</a>.<br /></div><div style='margin:0px; padding:0px;'><br /></div><div style='margin:0px; padding:0px;'>A service is available providing access to the data table associated with this layer. The data table services can be used by developers to quickly and efficiently query the data and to create custom applications. For more information see the <a href='https://www.arcgis.com/home/item.html?id=5c321f97872b4643a0f061e9781991cf' rel='nofollow ugc' target='_blank'>World Ecophysiographic Tables</a>.<br /></div><div style='margin:0px; padding:0px;'><br /></div><div style='margin:0px; padding:0px;'><div style='margin:0px; padding:0px;'><div style='margin:0px; padding:0px;'><div style='margin:0px; padding:0px;'>Value,EF Lithology Class,ELU Lithology Class</div><div style='margin:0px; padding:0px;'>1,Unconsolidated Sediment,Unconsolidated Sediment</div><div style='margin:0px; padding:0px;'>2,Siliciclastic Sedimentary Rock,Non-Carbonate Sedimentary Rock</div><div style='margin:0px; padding:0px;'>3,Pyroclastics,Pyroclastics</div><div style='margin:0px; padding:0px;'>4,Mixed Sedimentary Rock,Mixed Sedimentary Rock</div><div style='margin:0px; padding:0px;'>5,Carbonate Sedimentary Rock,Carbonate Sedimentary Rock</div><div style='margin:0px; padding:0px;'>6,Evaporite,Evaporite</div><div style='margin:0px; padding:0px;'>7,Acid Volcanic,Acidic Volcanics</div><div style='margin:0px; padding:0px;'>8,Intermediate Volcanics,Non-Acidic Volcanics</div><div style='margin:0px; padding:0px;'>9,Basic Volcanics,Non-Acidic Volcanics</div><div style='margin:0px; padding:0px;'>10,Acid Plutonics,Acidic Plutonics</div><div style='margin:0px; padding:0px;'>11,Intermediate Plutonics,Non-Acidic Plutonics</div><div style='margin:0px; padding:0px;'>12,Basic Plutonics,Non-Acidic Plutonics</div><div style='margin:0px; padding:0px;'>13,Metamorphics,Metamorphic Rock</div><div style='margin:0px; padding:0px;'>14,Unconsolidated Sediment,Unconsolidated Sediment</div><div style='margin:0px; padding:0px;'>15,Ice and Glaciers,Ice and Glaciers</div><div style='margin:0px; padding:0px;'>16,Non-defined,Non-Defined</div></div></div></div></div>",
			"keyword": [
				"landscape6",
				"esri_landscape",
				"retiring-2027-12"
			],
			"issued": "2014-12-03T19:05:27.000Z",
			"modified": "2021-03-25T00:27:20.000Z",
			"publisher": {
				"name": "Esri"
			},
			"contactPoint": {
				"@type": "vcard:Contact",
				"fn": "esri_landscape2",
				"hasEmail": "{{orgContactEmail}}"
			},
			"accessLevel": "public",
			"spatial": "-180.0000,-89.0000,180.0000,89.0000",
			"license": "<p><img src='https://downloads.esri.com/blogs/arcgisonline/esrilogo_new.png' /> This work is licensed under the Esri Master License Agreement.&nbsp;</p><div><a target='_blank' href='https://goto.arcgis.com/termsofuse/viewsummary' rel='nofollow ugc noopener noreferrer'><strong>View Summary</strong></a> | <a target='_blank' href='https://goto.arcgis.com/termsofuse/viewtermsofuse' rel='nofollow ugc noopener noreferrer'><strong>View Terms of Use</strong></a></div><div>&nbsp;</div><div><span style='color:#b22222;'>Important Note:</span> This item requires an ArcGIS Online organizational subscription or an ArcGIS Developer account and does not consume credits. To access this item, you'll need to do one of the following:</div><div><ul><li>Sign in with an account that is a member of an organizational subscription</li><li>Sign in with a developer account</li><li><a target='_blank' href='https://goto.arcgis.com/termsofuse/registeranapplication' rel='nofollow ugc noopener noreferrer'>Register an application</a> and use your application's credentials.<br />&nbsp;</li></ul><p>If you don't have an account, you can sign up for a <a target='_blank' href='https://goto.arcgis.com/features/trial' rel='nofollow ugc noopener noreferrer'>free trial of ArcGIS</a> or a <a target='_blank' href='https://goto.arcgis.com/developers/signup' rel='nofollow ugc noopener noreferrer'>free ArcGIS Developer account</a>.</p></div>",
			"distribution": [
				{
					"@type": "dcat:Distribution",
					"title": "ArcGIS Hub Dataset",
					"format": "Web Page",
					"mediaType": "text/html",
					"accessURL": "https://www.pacificgeoportal.com/datasets/esri::world-lithology"
				},
				{
					"@type": "dcat:Distribution",
					"title": "ArcGIS GeoService",
					"format": "ArcGIS GeoServices REST API",
					"mediaType": "application/json",
					"accessURL": "https://landscape6.arcgis.com/arcgis/rest/services/World_Lithology/ImageServer"
				}
			],
			"theme": [
				"geospatial"
			]
		},
		{
			"@type": "dcat:Dataset",
			"identifier": "https://www.arcgis.com/home/item.html?id=46cbfa5ac94743e4933b6896f1dcecfd",
			"landingPage": "https://www.pacificgeoportal.com/datasets/esri::world-distance-to-water",
			"title": "World Distance to Water",
			"description": "<div>The arrangement of water in the landscape affects the distribution of many species including the <a href='https://www.plosone.org/article/info%3Adoi%2F10.1371%2Fjournal.pone.0020578' rel='nofollow ugc' style='line-height: 1.38461538461538;' target='_blank'>distribution of humans</a>. This layer provides a landscape-scale estimate of the distance from large water bodies.</div><div><br /></div><div><font size='4'>Dataset Summary</font></div><div><br /></div><div>This layer provides access to a 250m cell-sized raster of distance to surface water. To facilitate mapping, the values are in units of pixels. To convert this value to meters multiply by 250. The layer was created by extracting surface water values from the <a href='https://www.arcgis.com/home/item.html?id=53c82af69cae4c1f99902c0e0d456bf8' rel='nofollow ugc' target='_blank'>World Lithology</a> and <a href='https://www.arcgis.com/home/item.html?id=77864b7ae87a49e7984998e63d768c77' rel='nofollow ugc' target='_blank'>World Land Cover</a> layers to produce a <a href='https://www.arcgis.com/home/item.html?id=ddfce15a8ccd4c8c88fb125cb4f23cc9' rel='nofollow ugc' target='_blank'>surface water layer</a>. The distance from water was calculated using the ArcGIS <a href='https://resources.arcgis.com/en/help/main/10.2/index.html#//009z0000001p000000' rel='nofollow ugc' target='_blank'>Euclidian Distance Tool</a>. The layer was created by Esri in 2014.</div><div><span style='font-size: 12.7272720336914px; line-height: 16.7142848968506px;'><br /></span></div><div><font size='4'><font style='line-height: 16.7142848968506px;'>W</font>hat can you do with this layer?</font><br /></div><div><br /></div><div>This layer is suitable for both visualization and analysis. It can be used in ArcGIS Online in web maps and applications and can be used in ArcGIS Desktop. <p></p><div style='margin: 0px; padding: 0px;'>This layer has <a href='https://resources.arcgis.com/en/help/main/10.2/index.html#//00sp00000007000000' rel='nofollow ugc' target='_blank'>query</a>, <a href='https://resources.arcgis.com/en/help/main/10.2/index.html#//00s500000010000000' rel='nofollow ugc' target='_blank'>identify</a>, and <a href='https://resources.arcgis.com/en/help/main/10.2/index.html#/Downloading_data_from_an_image_service/00sp00000016000000/' rel='nofollow ugc' target='_blank'>export</a> image services available. This layer is restricted to a maximum area of 16,000 x 16,000 pixels - an area 4,000 kilometers on a side or an area approximately the size of Europe. </div><div style='margin: 0px; padding: 0px;'><br /></div><div style='margin: 0px; padding: 0px;'><div style='margin: 0px; padding: 0px;'>This layer is part of a larger collection of <a href='https://www.arcgis.com/home/group.html?owner=esri&amp;title=Landscape%20Layers&amp;start=131&amp;q=' rel='nofollow ugc' target='_blank'>landscape layers</a> that you can use to perform a wide variety of mapping and analysis tasks.</div><div style='margin: 0px; padding: 0px;'><br /></div><div style='margin: 0px; padding: 0px;'>The <a href='https://doc.arcgis.com/en/living-atlas/#s=0&amp;n=0&amp;d=1&amp;col=&amp;fs=0&amp;fn=30&amp;npp=120&amp;subCat=0' rel='nofollow ugc' target='_blank'>Living Atlas of the World</a> provides an easy way to explore the landscape layers and many other beautiful and authoritative maps on hundreds of topics.</div><div style='margin: 0px; padding: 0px;'><br /></div><div style='margin: 0px; padding: 0px;'><div style='margin: 0px; padding: 0px;'><a href='https://geonet.esri.com' rel='nofollow ugc' target='_blank'>Geonet</a> is a good resource for learning more about landscape layers and the Living Atlas of the World. To get started see the <a href='https://geonet.esri.com/groups/livingatlas?sr=search&amp;searchId=ec0b33d6-14bb-4319-8ad5-38961b68610e&amp;searchIndex=0' rel='nofollow ugc' target='_blank'>Living Atlas Discussion Group</a>.</div><div style='margin: 0px; padding: 0px;'><br /></div><div style='margin: 0px; padding: 0px;'>The <a href='https://goto.arcgisonline.com/arcgis/Ecological_Land_Units/RolloutBlog ' rel='nofollow ugc' target='_blank'>Esri Insider Blog</a> provides an introduction to the Ecophysiographic Mapping project.</div></div></div></div>",
			"keyword": [
				"esri_landscape",
				"landscape6",
				"landscape",
				"water"
			],
			"issued": "2014-12-03T19:05:14.000Z",
			"modified": "2020-08-27T00:00:41.000Z",
			"publisher": {
				"name": "Esri"
			},
			"contactPoint": {
				"@type": "vcard:Contact",
				"fn": "esri_landscape2",
				"hasEmail": "{{orgContactEmail}}"
			},
			"accessLevel": "public",
			"spatial": "-180.0000,-55.9980,180.0000,83.6250",
			"license": "<img alt='' src='https://downloads.esri.com/blogs/arcgisonline/esrilogo_new.png' />This work is licensed under the Esri Master License Agreement. <br /><div><a href='https://goto.arcgis.com/termsofuse/viewsummary' target='_blank' rel='nofollow ugc noopener noreferrer'><b>View Summary</b></a> | <a href='https://goto.arcgis.com/termsofuse/viewtermsofuse' target='_blank' rel='nofollow ugc noopener noreferrer'><b>View Terms of Use</b></a> </div><div><span style='line-height: 16.05px;'><br /></span></div><div><font color='#b22222'>Important Note:</font> This item requires an ArcGIS Online organizational subscription or an ArcGIS Developer account and does not consume credits. To access this item, you'll need to do one of the following: </div><div><ul><li>Sign in with an account that is a member of an organizational subscription </li><li>Sign in with a developer account </li><li><a href='https://goto.arcgis.com/termsofuse/registeranapplication' target='_blank' rel='nofollow ugc noopener noreferrer'>Register an application</a> and use your application's credentials.</li></ul>If you don't have an account, you can sign up for a <a href='https://goto.arcgis.com/features/trial' target='_blank' rel='nofollow ugc noopener noreferrer'>free trial of ArcGIS</a> or a <a href='https://goto.arcgis.com/developers/signup' target='_blank' rel='nofollow ugc noopener noreferrer'>free ArcGIS Developer account</a>.</div>",
			"distribution": [
				{
					"@type": "dcat:Distribution",
					"title": "ArcGIS Hub Dataset",
					"format": "Web Page",
					"mediaType": "text/html",
					"accessURL": "https://www.pacificgeoportal.com/datasets/esri::world-distance-to-water"
				},
				{
					"@type": "dcat:Distribution",
					"title": "ArcGIS GeoService",
					"format": "ArcGIS GeoServices REST API",
					"mediaType": "application/json",
					"accessURL": "https://landscape6.arcgis.com/arcgis/rest/services/World_Distance_to_Surface_Water/ImageServer"
				}
			],
			"theme": [
				"geospatial"
			]
		},
		{
			"@type": "dcat:Dataset",
			"identifier": "https://www.arcgis.com/home/item.html?id=e6ab693056a9465cbc3b26414f0ddd2c",
			"landingPage": "https://www.pacificgeoportal.com/datasets/esri::worldclim-global-mean-precipitation",
			"title": "WorldClim Global Mean Precipitation",
			"description": "<a href='https://www.worldclim.org/data/worldclim21.html' rel='nofollow ugc' target='_blank'>WorldClim 2.1</a> provides downscaled estimates of climate variables as monthly means over the period of 1970-2000 based on interpolated station measurements. Here we provide analytical image services of precipitation for each month along with an annual mean. Each time step is accessible from a processing template.<div><br /><div><b>Time Extent:</b> Monthly/Annual 1970-2000</div><div><b>Units:</b> mm/month</div><div><b>Cell Size:</b> 2.5 minutes (~5 km)</div><div><b>Source Type:</b> Stretched</div><div><b>Pixel Type:</b> 16 Bit Integer</div><div><b>Data Projection:</b> GCS WGS84</div><div><b>Mosaic Projection:</b> GCS WGS84</div><div><b>Extent:</b> Global</div><div><b>Source:</b> WorldClim v2.1</div><div><br /></div><div><font size='4'>Using Processing Templates to Access Time</font></div><div><font size='4'><br /></font></div><div>There are 13 processing templates applied to this service, each providing access to the 12 monthly and 1 annual mean precipitation layers. To apply these in ArcGIS Online, select the Image Display options on the layer. Then pull down the list of variables from the Renderer options. Click Apply and Close. In ArcGIS Pro, go into the Layer Properties. Select Processing Templates from the left-hand menu. From the Processing Template pull down menu, select the version to display.</div><div><br /></div><div><font size='4'>What can you do with this layer?</font></div><div><br /></div><div>This layer may be added to maps to visualize and quickly interrogate each pixel value. The pop-up provides a graph of the time series along with the calculated annual mean value.</div><div><br /></div><div>This layer can be used in analysis. For example, the layer may be added to ArcGIS Pro and an area count of precipitation may be produced for a feature dataset using the zonal statistics tool. Statistics may be compared with the statistics from month to month to show seasonal patterns.</div><div><br /></div><div>To calculate precipitation by land area, or any other analysis, be sure to use an equal area projection, such as Albers or <a href='https://desktop.arcgis.com/en/arcmap/latest/map/projections/equal-earth.htm' rel='nofollow ugc' target='_blank'>Equal Earth</a>.</div><div><br /></div><div><b>Source Data:</b> The datasets behind this layer were extracted from GeoTIF files produced by WorldClim at 2.5 minutes resolution. The mean of the 12 GeoTIFs was calculated (annual), and the 13 rasters were converted to Cloud Optimized GeoTIFF format and added to a mosaic dataset.<br /></div></div><div><br /></div><div><div><b>Citation:</b> </div><div>Fick, S.E. and R.J. Hijmans, 2017. WorldClim 2: new 1km spatial resolution climate surfaces for global land areas. <a href='https://rmets.onlinelibrary.wiley.com/doi/abs/10.1002/joc.5086' rel='nofollow ugc' target='_blank'>International Journal of Climatology 37 (12): 4302-4315</a>. <br /></div></div>",
			"keyword": [
				"esri_environment",
				"environment",
				"earthobs3",
				"precipitation",
				"rain",
				"weather",
				"climate",
				"hydrology"
			],
			"issued": "2021-03-25T01:32:02.000Z",
			"modified": "2022-12-14T17:49:45.000Z",
			"publisher": {
				"name": "Esri"
			},
			"contactPoint": {
				"@type": "vcard:Contact",
				"fn": "esri",
				"hasEmail": "{{orgContactEmail}}"
			},
			"accessLevel": "public",
			"spatial": "-180.0000,-85.0024,180.0000,85.0000",
			"license": "<img src='https://downloads.esri.com/blogs/arcgisonline/esrilogo_new.png' />This work is licensed under the Esri Master License Agreement. <br /><div><a href='https://goto.arcgis.com/termsofuse/viewsummary' target='_blank' rel='nofollow ugc noopener noreferrer'><b>View Summary</b></a> | <a href='https://goto.arcgis.com/termsofuse/viewtermsofuse' target='_blank' rel='nofollow ugc noopener noreferrer'><b>View Terms of Use</b></a> </div><div><span><br /></span></div><div><font color='#b22222'>Important Note:</font> This item requires an ArcGIS Online organizational subscription or an ArcGIS Developer account and does not consume credits. To access this item, you'll need to do one of the following: </div><div><ul><li>Sign in with an account that is a member of an organizational subscription </li><li>Sign in with a developer account </li><li><a href='https://goto.arcgis.com/termsofuse/registeranapplication' target='_blank' rel='nofollow ugc noopener noreferrer'>Register an application</a> and use your application's credentials.</li></ul>If you don't have an account, you can sign up for a <a href='https://goto.arcgis.com/features/trial' target='_blank' rel='nofollow ugc noopener noreferrer'>free trial of ArcGIS</a> or a <a href='https://goto.arcgis.com/developers/signup' target='_blank' rel='nofollow ugc noopener noreferrer'>free ArcGIS Developer account</a>.</div>",
			"distribution": [
				{
					"@type": "dcat:Distribution",
					"title": "ArcGIS Hub Dataset",
					"format": "Web Page",
					"mediaType": "text/html",
					"accessURL": "https://www.pacificgeoportal.com/datasets/esri::worldclim-global-mean-precipitation"
				},
				{
					"@type": "dcat:Distribution",
					"title": "ArcGIS GeoService",
					"format": "ArcGIS GeoServices REST API",
					"mediaType": "application/json",
					"accessURL": "https://earthobs3.arcgis.com/arcgis/rest/services/Mean_Precipitation_WorldClim/ImageServer"
				}
			],
			"theme": [
				"geospatial"
			]
		},
		{
			"@type": "dcat:Dataset",
			"identifier": "https://www.arcgis.com/home/item.html?id=ef80265cbf414ce48f0e826d0f570411",
			"landingPage": "https://www.pacificgeoportal.com/maps/ef80265cbf414ce48f0e826d0f570411",
			"title": "{{name}}",
			"description": "{{description}}",
			"keyword": [
				"polygon",
				"boundary",
				"boundaries",
				"administrative division",
				"analysis ready",
				"Malaysia",
				"MY",
				"MYS",
				"MYS_Boundaries_2022",
				"retiring-2027-12"
			],
			"issued": "2022-11-30T02:13:38.000Z",
			"modified": "{{modified:toISO}}",
			"publisher": {
				"name": "{{source}}"
			},
			"contactPoint": {
				"@type": "vcard:Contact",
				"fn": "esri_dm",
				"hasEmail": "{{orgContactEmail}}"
			},
			"accessLevel": "public",
			"spatial": "",
			"license": "<div><div><div><div><div><div><img src='https://downloads.esri.com/blogs/arcgisonline/esrilogo_new.png' /> This work is licensed under the Esri Master License Agreement.<br /><div><a href='https://goto.arcgis.com/termsofuse/viewsummary' target='_blank' rel='nofollow ugc noopener noreferrer'><b>View Summary</b></a> | <b><a href='https://goto.arcgis.com/termsofuse/viewtermsofuse' target='_blank' rel='nofollow ugc noopener noreferrer'>View Terms of Use</a></b></div><div><br /></div><div><font color='#b22222'>Important Note:</font> This layer is intended to support online visualization and analysis. Users are <b><u>not permitted to export data</u></b> for offline use.<br /></div><div><br /></div><div><font color='#b22222'>Important Note:</font>  This item requires an ArcGIS Online organizational subscription or an  ArcGIS Developer account and does not consume credits. To access this  item, you'll need to do one of the following: </div><div><ul><li>Sign in with an account that is a member of an organizational subscription </li><li>Sign in with a developer account </li><li><a href='https://goto.arcgis.com/termsofuse/registeranapplication' target='_blank' rel='nofollow ugc noopener noreferrer'>Register an application</a> and use your application's credentials.</li></ul>If you don't have an account, you can sign up for a <a href='https://goto.arcgis.com/features/trial' target='_blank' rel='nofollow ugc noopener noreferrer'>free trial of ArcGIS</a> or a <a href='https://goto.arcgis.com/developers/signup' target='_blank' rel='nofollow ugc noopener noreferrer'>free ArcGIS Developer account</a>.</div></div></div></div></div></div></div>",
			"distribution": [
				{
					"@type": "dcat:Distribution",
					"title": "ArcGIS Hub Dataset",
					"format": "Web Page",
					"mediaType": "text/html",
					"accessURL": "https://www.pacificgeoportal.com/maps/ef80265cbf414ce48f0e826d0f570411"
				}
			],
			"theme": ""
		},
		{
			"@type": "dcat:Dataset",
			"identifier": "https://www.arcgis.com/home/item.html?id=e5f0bde6e92c4638870ba81ca28e85e2",
			"landingPage": "https://www.pacificgeoportal.com/maps/e5f0bde6e92c4638870ba81ca28e85e2",
			"title": "{{name}}",
			"description": "{{description}}",
			"keyword": [
				"polygon",
				"boundary",
				"boundaries",
				"administrative division",
				"analysis ready",
				"ID",
				"IDN",
				"Indonesia",
				"IDN_Boundaries_2022",
				"retiring-2027-12"
			],
			"issued": "2022-11-29T23:56:15.000Z",
			"modified": "{{modified:toISO}}",
			"publisher": {
				"name": "{{source}}"
			},
			"contactPoint": {
				"@type": "vcard:Contact",
				"fn": "esri_dm",
				"hasEmail": "{{orgContactEmail}}"
			},
			"accessLevel": "public",
			"spatial": "",
			"license": "<div><div><div><div><div><div><img src='https://downloads.esri.com/blogs/arcgisonline/esrilogo_new.png' /> This work is licensed under the Esri Master License Agreement.<br /><div><a href='https://goto.arcgis.com/termsofuse/viewsummary' target='_blank' rel='nofollow ugc noopener noreferrer'><b>View Summary</b></a> | <b><a href='https://goto.arcgis.com/termsofuse/viewtermsofuse' target='_blank' rel='nofollow ugc noopener noreferrer'>View Terms of Use</a></b></div><div><br /></div><div><font color='#b22222'>Important Note:</font> This layer is intended to support online visualization and analysis. Users are <b><u>not permitted to export data</u></b> for offline use.<br /></div><div><br /></div><div><font color='#b22222'>Important Note:</font>  This item requires an ArcGIS Online organizational subscription or an  ArcGIS Developer account and does not consume credits. To access this  item, you'll need to do one of the following: </div><div><ul><li>Sign in with an account that is a member of an organizational subscription </li><li>Sign in with a developer account </li><li><a href='https://goto.arcgis.com/termsofuse/registeranapplication' target='_blank' rel='nofollow ugc noopener noreferrer'>Register an application</a> and use your application's credentials.</li></ul>If you don't have an account, you can sign up for a <a href='https://goto.arcgis.com/features/trial' target='_blank' rel='nofollow ugc noopener noreferrer'>free trial of ArcGIS</a> or a <a href='https://goto.arcgis.com/developers/signup' target='_blank' rel='nofollow ugc noopener noreferrer'>free ArcGIS Developer account</a>.</div></div></div></div></div></div></div>",
			"distribution": [
				{
					"@type": "dcat:Distribution",
					"title": "ArcGIS Hub Dataset",
					"format": "Web Page",
					"mediaType": "text/html",
					"accessURL": "https://www.pacificgeoportal.com/maps/e5f0bde6e92c4638870ba81ca28e85e2"
				}
			],
			"theme": ""
		},
		{
			"@type": "dcat:Dataset",
			"identifier": "https://www.arcgis.com/home/item.html?id=33558b5fef8642338f33918d498f41cf",
			"landingPage": "https://www.pacificgeoportal.com/content/esri::bioclimate-projections-15-precipitation-seasonality",
			"title": "Bioclimate Projections: (15) Precipitation Seasonality",
			"description": "<p><span style='color:#dc143c;'><strong>Retirement Notice:</strong></span><strong>&nbsp;This </strong><a target='_blank' href='https://goto.arcgis.com/termsofuse/beta' rel='nofollow ugc noopener noreferrer'><strong>beta</strong></a><strong> item will be retired in December 2026. A</strong><a target='_blank' href='https://www.arcgis.com/home/item.html?id=c643ea4555e248e39ad163fee6e3b4b4' rel='nofollow ugc noopener noreferrer'><strong> new version of this item</strong></a><strong>&nbsp;is available for your use. </strong>Esri recommends updating your maps and apps to use the new version.</p><div><p style='background-attachment:initial; background-clip:initial; background-image:initial; background-origin:initial; background-position:initial; background-repeat:initial; background-size:initial; margin-top:0in;'>This layer represents CMIP6 future projections of the variation in monthly precipitation totals over the course of the year. This index is the ratio of the standard deviation of the monthly total precipitation to the mean monthly total precipitation (also known as the coefficient of variation) and is expressed as a percentage. The larger the percentage, the greater the variability of precipitation. In some regions the CV values exceed 100%. These regions, such as deserts, may have such little rainfall that any variation creates an extreme percentage. This layer can be used to compare with recent climate histories to better understand the potential impacts of future climate change.</p><p><a target='_blank' href='https://worldclim.org/' rel='nofollow ugc noopener noreferrer'><span style='background-attachment:initial; background-clip:initial; background-image:initial; background-origin:initial; background-position:initial; background-repeat:initial; background-size:initial;'>WorldClim</span></a><span style='background-attachment:initial; background-clip:initial; background-image:initial; background-origin:initial; background-position:initial; background-repeat:initial; background-size:initial;'>&nbsp;produced this projection as part of a series of&nbsp;</span><a target='_blank' href='https://pubs.usgs.gov/ds/691/ds691.pdf' rel='nofollow ugc noopener noreferrer'><span style='background-attachment:initial; background-clip:initial; background-image:initial; background-origin:initial; background-position:initial; background-repeat:initial; background-size:initial;'>19 bioclimate variables identified by the USGS</span></a><span style='background-attachment:initial; background-clip:initial; background-image:initial; background-origin:initial; background-position:initial; background-repeat:initial; background-size:initial;'>&nbsp;and provides this description:</span><br /><br /><i>\"Bioclimatic variables are derived from the monthly temperature and rainfall values in order to generate more biologically meaningful variables. These are often used in species distribution modeling and related ecological modeling techniques. The bioclimatic variables represent annual trends (e.g., mean annual temperature, annual precipitation) seasonality (e.g., annual range in temperature and precipitation) and extreme or limiting environmental factors (e.g., temperature of the coldest and warmest month, and precipitation of the wet and dry quarters). A quarter is a period of three months (1/4 of the year).\"</i></p><p style='background-attachment:initial; background-clip:initial; background-image:initial; background-origin:initial; background-position:initial; background-repeat:initial; background-size:initial; margin-bottom:0in;'><strong>Time Extent:</strong>&nbsp;averages from 2021-2040, 2041-2060, 2061-2080, 2081-2100<br /><strong>Units:</strong>&nbsp;mm<br /><strong>Cell Size:</strong> 2.5 minutes (~5 km)<br /><strong>Source Type:</strong> Stretched<br /><strong>Pixel Type:</strong> 32 Bit Float<br /><strong>Data Projection:</strong> GCS WGS84<br /><strong>Mosaic Projection:</strong> GCS WGS84<br /><strong>Extent:</strong> Global<br /><strong>Source:</strong> <a target='_blank' href='https://worldclim.org/data/cmip6/cmip6_clim2.5m.html' rel='nofollow ugc noopener noreferrer'>WorldClim CMIP6 Bioclimate</a><br />&nbsp;</p><p><strong>Climate Scenarios</strong></p><p>The CMIP6 climate experiments use&nbsp;<a target='_blank' href='https://www.carbonbrief.org/explainer-how-shared-socioeconomic-pathways-explore-future-climate-change/' rel='nofollow ugc noopener noreferrer'>Shared Socioeconomic Pathways (SSPs)</a>&nbsp;to model future climate scenarios. Each SSP pairs a human/community behavior component with the traditional RCP greenhouse gas forcing from the previous CMIP5. Three SSPs were chosen by Esri to be included in the service based on user requests: SSP2 4.5, SSP3 7.0 and SSP5 8.5.</p><figure><table style='background-color:rgb(248, 249, 250); border-collapse:collapse;' width='850' cellpadding='0' cellspacing='0' border='1'><tbody><tr><td style='background-color:rgb(234, 236, 240); border:1pt solid rgb(162, 169, 177); padding:2.4pt 4.8pt;'><p style='margin:12pt 0in; text-align:center;'><span style='color:rgb(32,33,34); font-family:Arial, sans-serif; font-size:10.5pt;'><strong>SSP</strong></span></p></td><td style='background-color:rgb(234, 236, 240); border-bottom:1pt solid rgb(162, 169, 177); border-image:initial; border-left-style:none; border-right:1pt solid rgb(162, 169, 177); border-top:1pt solid rgb(162, 169, 177); padding:2.4pt 4.8pt;'><p style='margin:12pt 0in; text-align:center;'><span style='color:rgb(32,33,34); font-family:Arial, sans-serif; font-size:10.5pt;'><strong>Scenario</strong></span></p></td><td style='background-color:rgb(234, 236, 240); border-bottom:1pt solid rgb(162, 169, 177); border-image:initial; border-left-style:none; border-right:1pt solid rgb(162, 169, 177); border-top:1pt solid rgb(162, 169, 177); padding:2.4pt 4.8pt;'><p style='margin:12pt 0in; text-align:center;'><span style='color:rgb(32,33,34); font-family:Arial, sans-serif; font-size:10.5pt;'><strong>Estimated warming</strong></span><br /><span style='color:rgb(32,33,34); font-family:Arial, sans-serif; font-size:10.5pt;'><strong>(2041–2060)</strong></span></p></td><td style='background-color:rgb(234, 236, 240); border-bottom:1pt solid rgb(162, 169, 177); border-image:initial; border-left-style:none; border-right:1pt solid rgb(162, 169, 177); border-top:1pt solid rgb(162, 169, 177); padding:2.4pt 4.8pt;'><p style='margin:12pt 0in; text-align:center;'><span style='color:rgb(32,33,34); font-family:Arial, sans-serif; font-size:10.5pt;'><strong>Estimated warming</strong></span><br /><span style='color:rgb(32,33,34); font-family:Arial, sans-serif; font-size:10.5pt;'><strong>(2081–2100)</strong></span></p></td><td style='background-color:rgb(234, 236, 240); border-bottom:1pt solid rgb(162, 169, 177); border-image:initial; border-left-style:none; border-right:1pt solid rgb(162, 169, 177); border-top:1pt solid rgb(162, 169, 177); padding:2.4pt 4.8pt;'><p style='margin:12pt 0in; text-align:center;'><span style='color:rgb(32,33,34); font-family:Arial, sans-serif; font-size:10.5pt;'><strong>Very likely range in °C</strong></span><br /><span style='color:rgb(32,33,34); font-family:Arial, sans-serif; font-size:10.5pt;'><strong>(2081–2100)</strong></span></p></td></tr><tr><td style='border-bottom:1pt solid rgb(162, 169, 177); border-image:initial; border-left:1pt solid rgb(162, 169, 177); border-right:1pt solid rgb(162, 169, 177); border-top-style:none; padding:2.4pt 4.8pt;'><p style='margin:12pt 0in; text-align:center;'><span style='color:rgb(32,33,34); font-family:Arial, sans-serif; font-size:10.5pt;'>SSP2-4.5</span></p></td><td style='border-bottom:1pt solid rgb(162, 169, 177); border-left-style:none; border-right:1pt solid rgb(162, 169, 177); border-top-style:none; padding:2.4pt 4.8pt;'><p style='margin:12pt 0in; text-align:center;'><span style='color:rgb(32,33,34); font-family:Arial, sans-serif; font-size:10.5pt;'>intermediate GHG emissions:</span><br /><span style='color:rgb(32,33,34); font-family:Arial, sans-serif; font-size:10.5pt;'>CO</span><span style='color:rgb(32,33,34); font-family:Arial, sans-serif; font-size:8.5pt;'><sub>2</sub></span><span style='color:rgb(32,33,34); font-family:Arial, sans-serif; font-size:10.5pt;'>&nbsp;emissions around current levels until 2050, then falling but not reaching net zero by 2100</span></p></td><td style='border-bottom:1pt solid rgb(162, 169, 177); border-left-style:none; border-right:1pt solid rgb(162, 169, 177); border-top-style:none; padding:2.4pt 4.8pt;'><p style='margin:12pt 0in; text-align:center;'><span style='color:rgb(32,33,34); font-family:Arial, sans-serif; font-size:10.5pt;'>2.0 °C</span></p></td><td style='border-bottom:1pt solid rgb(162, 169, 177); border-left-style:none; border-right:1pt solid rgb(162, 169, 177); border-top-style:none; padding:2.4pt 4.8pt;'><p style='margin:12pt 0in; text-align:center;'><span style='color:rgb(32,33,34); font-family:Arial, sans-serif; font-size:10.5pt;'>2.7 °C</span></p></td><td style='border-bottom:1pt solid rgb(162, 169, 177); border-left-style:none; border-right:1pt solid rgb(162, 169, 177); border-top-style:none; padding:2.4pt 4.8pt;'><p style='margin:12pt 0in; text-align:center;'><span style='color:rgb(32,33,34); font-family:Arial, sans-serif; font-size:10.5pt;'>2.1 – 3.5</span></p></td></tr><tr><td style='border-bottom:1pt solid rgb(162, 169, 177); border-image:initial; border-left:1pt solid rgb(162, 169, 177); border-right:1pt solid rgb(162, 169, 177); border-top-style:none; padding:2.4pt 4.8pt;'><p style='margin:12pt 0in; text-align:center;'><span style='color:rgb(32,33,34); font-family:Arial, sans-serif; font-size:10.5pt;'>SSP3-7.0</span></p></td><td style='border-bottom:1pt solid rgb(162, 169, 177); border-left-style:none; border-right:1pt solid rgb(162, 169, 177); border-top-style:none; padding:2.4pt 4.8pt;'><p style='margin:12pt 0in; text-align:center;'><span style='color:rgb(32,33,34); font-family:Arial, sans-serif; font-size:10.5pt;'>high GHG emissions:</span><br /><span style='color:rgb(32,33,34); font-family:Arial, sans-serif; font-size:10.5pt;'>CO</span><span style='color:rgb(32,33,34); font-family:Arial, sans-serif; font-size:8.5pt;'><sub>2</sub></span><span style='color:rgb(32,33,34); font-family:Arial, sans-serif; font-size:10.5pt;'>&nbsp;emissions double by 2100</span></p></td><td style='border-bottom:1pt solid rgb(162, 169, 177); border-left-style:none; border-right:1pt solid rgb(162, 169, 177); border-top-style:none; padding:2.4pt 4.8pt;'><p style='margin:12pt 0in; text-align:center;'><span style='color:rgb(32,33,34); font-family:Arial, sans-serif; font-size:10.5pt;'>2.1 °C</span></p></td><td style='border-bottom:1pt solid rgb(162, 169, 177); border-left-style:none; border-right:1pt solid rgb(162, 169, 177); border-top-style:none; padding:2.4pt 4.8pt;'><p style='margin:12pt 0in; text-align:center;'><span style='color:rgb(32,33,34); font-family:Arial, sans-serif; font-size:10.5pt;'>3.6 °C</span></p></td><td style='border-bottom:1pt solid rgb(162, 169, 177); border-left-style:none; border-right:1pt solid rgb(162, 169, 177); border-top-style:none; padding:2.4pt 4.8pt;'><p style='margin:12pt 0in; text-align:center;'><span style='color:rgb(32,33,34); font-family:Arial, sans-serif; font-size:10.5pt;'>2.8 – 4.6</span></p></td></tr><tr><td style='border-bottom:1pt solid rgb(162, 169, 177); border-image:initial; border-left:1pt solid rgb(162, 169, 177); border-right:1pt solid rgb(162, 169, 177); border-top-style:none; padding:2.4pt 4.8pt;'><p style='margin:12pt 0in; text-align:center;'><span style='color:rgb(32,33,34); font-family:Arial, sans-serif; font-size:10.5pt;'>SSP5-8.5</span></p></td><td style='border-bottom:1pt solid rgb(162, 169, 177); border-left-style:none; border-right:1pt solid rgb(162, 169, 177); border-top-style:none; padding:2.4pt 4.8pt;'><p style='margin:12pt 0in; text-align:center;'><span style='color:rgb(32,33,34); font-family:Arial, sans-serif; font-size:10.5pt;'>very high GHG emissions:</span><br /><span style='color:rgb(32,33,34); font-family:Arial, sans-serif; font-size:10.5pt;'>CO</span><span style='color:rgb(32,33,34); font-family:Arial, sans-serif; font-size:8.5pt;'><sub>2</sub></span><span style='color:rgb(32,33,34); font-family:Arial, sans-serif; font-size:10.5pt;'>&nbsp;emissions triple by 2075</span></p></td><td style='border-bottom:1pt solid rgb(162, 169, 177); border-left-style:none; border-right:1pt solid rgb(162, 169, 177); border-top-style:none; padding:2.4pt 4.8pt;'><p style='margin:12pt 0in; text-align:center;'><span style='color:rgb(32,33,34); font-family:Arial, sans-serif; font-size:10.5pt;'>2.4 °C</span></p></td><td style='border-bottom:1pt solid rgb(162, 169, 177); border-left-style:none; border-right:1pt solid rgb(162, 169, 177); border-top-style:none; padding:2.4pt 4.8pt;'><p style='margin:12pt 0in; text-align:center;'><span style='color:rgb(32,33,34); font-family:Arial, sans-serif; font-size:10.5pt;'>4.4 °C</span></p></td><td style='border-bottom:1pt solid rgb(162, 169, 177); border-left-style:none; border-right:1pt solid rgb(162, 169, 177); border-top-style:none; padding:2.4pt 4.8pt;'><p style='margin:12pt 0in; text-align:center;'><span style='color:rgb(32,33,34); font-family:Arial, sans-serif; font-size:10.5pt;'>3.3 – 5.7</span></p></td></tr></tbody></table></figure><p>While the 8.5 scenario is no longer generally considered likely, SSP3 7.0 has been included and is considered the high end of possibilities. SSP5 8.5 has been retained since many organizations report to this threshold. The warming associated with SSP2 4.5 is equivalent to the global targets set at the 2021 United Nations COP26 meetings in Glasgow.&nbsp;<br />&nbsp;</p><p><strong>Processing the Climate Data</strong></p><p>WorldClim provides 20-year averaged outputs for the various SSPs from 24 global climate models. A selection of 13 models were averaged for each variable and time based on&nbsp;<a target='_blank' href='https://rmets.onlinelibrary.wiley.com/doi/full/10.1002/joc.7566' rel='nofollow ugc noopener noreferrer'>Mahony et al 2022</a>. These models included ACCESS-ESM1-5, BCC-CSM2-MR, CanESM5, CNRM-ESM2-1, EC-Earth3-Veg, GFDL-ESM4, GISS-E2-1-G, INM-CM5-0,&nbsp;&nbsp;IPSL-CM6A-LR, MIROC6, MPI-ESM1-2-HR, MRI-ESM2-0, UKESM1-0-LL. GFDL-ESM4 was not available for SSP2 4.5 or SSP5 8.5.&nbsp;</p><p><strong>Accessing the Multidimensional Information</strong></p><p>The time and SSP scenario are built into the layer using a multidimensional raster. Enable the time slider to move across the 20-year average periods. In ArcGIS Online and Pro, use the Multidimensional Filter to select the SSP (SSP2 4.5 is the default).&nbsp;<br /><br /><strong>What can you do with this layer?</strong></p><p>These multidimensional imagery tiles support analysis using ArcGIS Online or Pro. Use the&nbsp;<a target='_blank' href='https://arcgis.com/home/item.html?id=e56c9cb70aa949adb791c4311003d9ae' rel='nofollow ugc noopener noreferrer'>Bioclimate Baseline layer</a>&nbsp;to see the difference in pixels and calculate change from the historic period into the future. Use the&nbsp;<a target='_blank' href='https://pro.arcgis.com/en/pro-app/latest/help/data/imagery/an-overview-of-multidimensional-raster-data.htm' rel='nofollow ugc noopener noreferrer'>Multidimensional&nbsp;</a>tab in ArcGIS Pro to access a variety of useful tools. Each layer or variable can be styled using the Image Display options.&nbsp;</p><p><strong>Known Quality Issues</strong></p><p>Each model is downscaled from ~100km resolution to ~5km resolution by WorldClim. Some artifacts are inevitable, especially at a global scale. Some variables have distinct transitions, especially in Greenland. Also, SSP2 4.5 has missing data for several variables in Antarctica.<br />&nbsp;</p><p><strong>Related Layers</strong></p><p><a target='_blank' href='https://arcgis.com/home/item.html?id=fdaa1b7912e440efb9e29cf5d6156bb0' rel='nofollow ugc noopener noreferrer'>Bioclimate 1&nbsp;&nbsp;Annual Mean Temperature</a><br /><a target='_blank' href='https://arcgis.com/home/item.html?id=8012b34e8c854d6fbcfe4eab437ea397' rel='nofollow ugc noopener noreferrer'>Bioclimate 2&nbsp;&nbsp;Mean Diurnal Range</a><br /><a target='_blank' href='https://arcgis.com/home/item.html?id=ef9f5d6a16ca41ada0c0075a8da46d48' rel='nofollow ugc noopener noreferrer'>Bioclimate 3&nbsp;&nbsp;Isothermality</a><br /><a target='_blank' href='https://arcgis.com/home/item.html?id=64799fea8774463aad909020b6590dc8' rel='nofollow ugc noopener noreferrer'>Bioclimate 4&nbsp;&nbsp;Temperature Seasonality</a><br /><a target='_blank' href='https://arcgis.com/home/item.html?id=8433250e0a4148f5a3889c66e78abdf1' rel='nofollow ugc noopener noreferrer'>Bioclimate 5&nbsp;&nbsp;Max Temperature of Warmest Month</a><br /><a target='_blank' href='https://arcgis.com/home/item.html?id=c531d32ab5d746b88a884b6e54f3216e' rel='nofollow ugc noopener noreferrer'>Bioclimate 6&nbsp;&nbsp;Min Temperature Of Coldest Month</a><br /><a target='_blank' href='https://arcgis.com/home/item.html?id=808cfb3ab1614f8ab7e364de737e9e98' rel='nofollow ugc noopener noreferrer'>Bioclimate 7&nbsp;&nbsp;Temperature Annual Range</a><br /><a target='_blank' href='https://arcgis.com/home/item.html?id=b5990aa16fd94bb691a09449716ed7e5' rel='nofollow ugc noopener noreferrer'>Bioclimate 8&nbsp;&nbsp;Mean Temperature Of Wettest Quarter</a><br /><a target='_blank' href='https://arcgis.com/home/item.html?id=231770161a46467e8de9fdd9fd92dad7' rel='nofollow ugc noopener noreferrer'>Bioclimate 9&nbsp;&nbsp;Mean Temperature Of Driest Quarter</a><br /><a target='_blank' href='https://arcgis.com/home/item.html?id=3b98ddf1c78d4f0c88bd297f85847c68' rel='nofollow ugc noopener noreferrer'>Bioclimate 10&nbsp;&nbsp;Mean Temperature Of Warmest Quarter</a><br /><a target='_blank' href='https://arcgis.com/home/item.html?id=1a96d928c93c4e8fbc6a2391afd1da2f' rel='nofollow ugc noopener noreferrer'>Bioclimate 11&nbsp;&nbsp;Mean Temperature Of Coldest Quarter</a><br /><a target='_blank' href='https://arcgis.com/home/item.html?id=7bc0b8c75b0244b7a8128ae1f398bfc0' rel='nofollow ugc noopener noreferrer'>Bioclimate 12&nbsp;&nbsp;Annual Precipitation</a><br /><a target='_blank' href='https://arcgis.com/home/item.html?id=36fde801c8124f93b46b727b9873c993' rel='nofollow ugc noopener noreferrer'>Bioclimate 13&nbsp;&nbsp;Precipitation Of Wettest Month</a><br /><a target='_blank' href='https://arcgis.com/home/item.html?id=e26b01e4fa0a4aec9c5db991467b31a7' rel='nofollow ugc noopener noreferrer'>Bioclimate 14&nbsp;&nbsp;Precipitation Of Driest Month</a><br /><a target='_blank' href='https://arcgis.com/home/item.html?id=33558b5fef8642338f33918d498f41cf' rel='nofollow ugc noopener noreferrer'>Bioclimate 15&nbsp;&nbsp;Precipitation Seasonality</a><br /><a target='_blank' href='https://arcgis.com/home/item.html?id=1324c4e0c86a40e9b7529e91c6bdf220' rel='nofollow ugc noopener noreferrer'>Bioclimate 16&nbsp;&nbsp;Precipitation Of Wettest Quarter</a><br /><a target='_blank' href='https://arcgis.com/home/item.html?id=86fe2a87fe9144f9a5c330a3b5890df0' rel='nofollow ugc noopener noreferrer'>Bioclimate 17&nbsp;&nbsp;Precipitation Of Driest Quarter</a><br /><a target='_blank' href='https://arcgis.com/home/item.html?id=eb8227050ac24b3bb4a47abb924fbc56' rel='nofollow ugc noopener noreferrer'>Bioclimate 18&nbsp;&nbsp;Precipitation Of Warmest Quarter</a><br /><a target='_blank' href='https://arcgis.com/home/item.html?id=ec067623611d40d086193b21a3a4fce1' rel='nofollow ugc noopener noreferrer'>Bioclimate 19&nbsp;&nbsp;Precipitation Of Coldest Quarter</a><br /><a target='_blank' href='https://arcgis.com/home/item.html?id=e56c9cb70aa949adb791c4311003d9ae' rel='nofollow ugc noopener noreferrer'>Bioclimate Baseline 1970-2000</a></p></div>",
			"keyword": [
				"esri_environment",
				"retiring-2026-12"
			],
			"issued": "2022-05-12T14:49:18.000Z",
			"modified": "2026-03-02T22:32:00.000Z",
			"publisher": {
				"name": "Esri"
			},
			"contactPoint": {
				"@type": "vcard:Contact",
				"fn": "esri_environment",
				"hasEmail": "{{orgContactEmail}}"
			},
			"accessLevel": "public",
			"spatial": "-180.0000,-90.0000,180.0000,90.0000",
			"license": "<p><img src='https://downloads.esri.com/blogs/arcgisonline/esrilogo_new.png' width='113' height='43' /> This work is licensed under the Esri Master License Agreement.&nbsp;</p><p><a target='_blank' href='https://goto.arcgis.com/termsofuse/viewsummary' rel='nofollow ugc noopener noreferrer'>View Summary</a> | <a target='_blank' href='https://goto.arcgis.com/termsofuse/viewtermsofuse' rel='nofollow ugc noopener noreferrer'>View Terms of Use</a></p>",
			"distribution": [
				{
					"@type": "dcat:Distribution",
					"title": "ArcGIS Hub Dataset",
					"format": "Web Page",
					"mediaType": "text/html",
					"accessURL": "https://www.pacificgeoportal.com/content/esri::bioclimate-projections-15-precipitation-seasonality"
				},
				{
					"@type": "dcat:Distribution",
					"title": "ArcGIS GeoService",
					"format": "ArcGIS GeoServices REST API",
					"mediaType": "application/json",
					"accessURL": "https://tiledimageservices.arcgis.com/P3ePLMYs2RVChkJx/arcgis/rest/services/Bioclimate_Projections__Precipitation_Seasonality/ImageServer"
				}
			],
			"theme": [
				"geospatial"
			]
		},
		{
			"@type": "dcat:Dataset",
			"identifier": "https://www.arcgis.com/home/item.html?id=312cebfea2624e108e234220b04460b8&sublayer=0",
			"landingPage": "https://www.pacificgeoportal.com/datasets/esri::world-time-zones",
			"title": "World Time Zones",
			"description": "<div style='text-align:Left;'><div><div><div><span style='color:#b22222;'><strong>Retirement Notice:</strong></span><strong>&nbsp;</strong><span><strong>This item is in </strong></span><a target='_blank' href='https://goto.arcgisonline.com/lifecycle/boundaries' rel='nofollow ugc noopener noreferrer'><span><strong>mature support</strong></span></a><span><strong> as of June 2025 and will retire in December 2026.&nbsp;</strong></span><a target='_blank' href='https://www.arcgis.com/home/item.html?id=1627d2eff2ef4fb0874171b9aa67ee07' rel='nofollow ugc noopener noreferrer'><span> A new version of this item is available for your use</span></a><a target='_blank' href='https://www.arcgis.com/home/item.html?id=ed464548ea5f42f5ace81998f7882688' rel='nofollow ugc noopener noreferrer'><span>.</span></a> <span>Esri recommends updating your maps and apps to use the new version.</span></div><div>&nbsp;</div><div><span>World Time Zones represents the time zones of the world. The time zones are best displayed with World Countries or World Administrative Divisions.</span></div></div></div></div>",
			"keyword": [
				"layer",
				"polygon",
				"time zones",
				"standard time",
				"time",
				"Coordinated Universal Time",
				"UTC",
				"Greenwich Mean Time",
				"GMT",
				"regions",
				"location",
				"boundaries",
				"World",
				"2001",
				"1992",
				"1996",
				"2011",
				"2010",
				"1991",
				"2018",
				"retiring-2026-12"
			],
			"issued": "2013-06-30T22:57:40.000Z",
			"modified": "2020-09-03T06:38:18.661Z",
			"publisher": {
				"name": "Esri"
			},
			"contactPoint": {
				"@type": "vcard:Contact",
				"fn": "esri_dm",
				"hasEmail": "{{orgContactEmail}}"
			},
			"accessLevel": "public",
			"spatial": "-180.0000,-89.0000,180.0000,89.0000",
			"license": "<p><img src='https://downloads.esri.com/blogs/arcgisonline/esrilogo_new.png' /> This work is licensed under the Esri Master License Agreement.</p><p><a target='_blank' href='https://goto.arcgis.com/termsofuse/viewsummary' rel='nofollow ugc noopener noreferrer'><strong>View Summary</strong></a> | <a target='_blank' href='https://goto.arcgis.com/termsofuse/viewtermsofuse' rel='nofollow ugc noopener noreferrer'><strong>View Terms of Use</strong></a></p>",
			"distribution": [
				{
					"@type": "dcat:Distribution",
					"title": "ArcGIS Hub Dataset",
					"format": "Web Page",
					"mediaType": "text/html",
					"accessURL": "https://www.pacificgeoportal.com/datasets/esri::world-time-zones"
				},
				{
					"@type": "dcat:Distribution",
					"title": "ArcGIS GeoService",
					"format": "ArcGIS GeoServices REST API",
					"mediaType": "application/json",
					"accessURL": "https://services.arcgis.com/P3ePLMYs2RVChkJx/arcgis/rest/services/World_Time_Zones/FeatureServer/0"
				},
				{
					"@type": "dcat:Distribution",
					"title": "CSV",
					"format": "CSV",
					"mediaType": "text/csv",
					"accessURL": "https://www.pacificgeoportal.com/api/download/v1/items/312cebfea2624e108e234220b04460b8/csv?layers=0"
				},
				{
					"@type": "dcat:Distribution",
					"title": "Shapefile",
					"format": "ZIP",
					"mediaType": "application/zip",
					"accessURL": "https://www.pacificgeoportal.com/api/download/v1/items/312cebfea2624e108e234220b04460b8/shapefile?layers=0"
				},
				{
					"@type": "dcat:Distribution",
					"title": "GeoJSON",
					"format": "GeoJSON",
					"mediaType": "application/vnd.geo+json",
					"accessURL": "https://www.pacificgeoportal.com/api/download/v1/items/312cebfea2624e108e234220b04460b8/geojson?layers=0"
				},
				{
					"@type": "dcat:Distribution",
					"title": "KML",
					"format": "KML",
					"mediaType": "application/vnd.google-earth.kml+xml",
					"accessURL": "https://www.pacificgeoportal.com/api/download/v1/items/312cebfea2624e108e234220b04460b8/kml?layers=0"
				}
			],
			"theme": [
				"geospatial"
			]
		},
		{
			"@type": "dcat:Dataset",
			"identifier": "https://www.arcgis.com/home/item.html?id=58526e3af88b46a3a1d1eb1738230ee3",
			"landingPage": "https://www.pacificgeoportal.com/apps/esri::ecological-marine-unit-emu-explorer",
			"title": "Ecological Marine Unit (EMU) Explorer",
			"description": "<p>The existence, sources, distribution, circulation, and physicochemical nature of macroscale oceanic water bodies have long been a focus of oceanographic inquiry. Building on that work, this paper describes an objectively derived and globally comprehensive set of 37 distinct volumetric region units, called ecological marine units (EMUs). They are constructed on a regularly spaced ocean point-mesh grid, from sea surface to seafloor, and attributed with data from the <a target='_blank' href='https://arcgis.com/home/item.html?id=a7661bbffa6649cfbb0d09cd308b8eae' rel='nofollow ugc noopener noreferrer'>2018 World Ocean Atlas</a>.&nbsp;</p><p>The point attribute data are the means of the decadal averages from a 57-year climatology of six physical and chemical environment parameters (temperature, salinity, dissolved oxygen, nitrate, phosphate, and silicate). The database includes over 52 million points that depict the global ocean in x, y, and z dimensions. The point data were statistically clustered to define the 37 EMUs, which represent physically and chemically distinct water volumes based on spatial variation in the six marine environmental characteristics used. The aspatial clustering to produce the 37 EMUs did not include point location or depth as a determinant, yet strong geographic and vertical separation was observed. Twenty-two of the 37 EMUs are globally or regionally extensive, and account for 99% of the ocean volume, while the remaining 15 are smaller and shallower, and occur around coastal features. We assessed the vertical distribution of EMUs in the water column and placed them into classical depth zones representing epipelagic (0 m to 200 m), mesopelagic (200 m to 1,000 m), bathypelagic (1,000 m to 4,000 m) and abyssopelagic (&gt;4,000 m) layers. The mapping and characterization of the EMUs represent a new spatial framework for organizing and understanding the physical, chemical, and ultimately biological properties and processes of oceanic water bodies.&nbsp;</p><p>The EMUs are an initial objective partitioning of the ocean using longterm historical average data, and could be extended in the future by adding new&nbsp;classification variables and by introducing functionality to develop time-specific EMU distribution maps. The EMUs are an open-access resource, and as both a standardized geographic framework and a baseline physicochemical characterization of the oceanic environment, they are intended to be useful for disturbance assessments, ecosystem&nbsp;accounting exercises, conservation priority setting, and marine protected area network design, along with other research and management applications.</p>",
			"keyword": [
				"open science",
				"emu",
				"ecological marine units",
				"ocean",
				"marine",
				"ecosystem",
				"ExU"
			],
			"issued": "2016-09-13T20:29:05.000Z",
			"modified": "2026-02-19T22:46:27.000Z",
			"publisher": {
				"name": "Esri"
			},
			"contactPoint": {
				"@type": "vcard:Contact",
				"fn": "esri_oceans",
				"hasEmail": "{{orgContactEmail}}"
			},
			"accessLevel": "public",
			"spatial": "-180.0000,-71.3458,180.0000,83.7386",
			"license": "https://creativecommons.org/licenses/by/4.0",
			"distribution": [
				{
					"@type": "dcat:Distribution",
					"title": "ArcGIS Hub Dataset",
					"format": "Web Page",
					"mediaType": "text/html",
					"accessURL": "https://www.pacificgeoportal.com/apps/esri::ecological-marine-unit-emu-explorer"
				},
				{
					"@type": "dcat:Distribution",
					"title": "ArcGIS GeoService",
					"format": "ArcGIS GeoServices REST API",
					"mediaType": "application/json",
					"accessURL": "https://livingatlas.arcgis.com/emu"
				}
			],
			"theme": [
				"geospatial"
			]
		},
		{
			"@type": "dcat:Dataset",
			"identifier": "https://www.arcgis.com/home/item.html?id=658732a227624146ba8322a94bc6ad8c",
			"landingPage": "https://www.pacificgeoportal.com/maps/esri::live-stream-gauges",
			"title": "Live Stream Gauges",
			"description": "<div><div><div>Information on the amount of water flowing in streams and rivers is critical to the management of water resources, emergency response to flooding, fisheries management, and many other uses. This layer provides access to real-time stream gauge readings compiled from a variety of agencies and organizations.</div><div><br /></div><div><font size='4'>Dataset Summary</font></div><div>The Live Stream Gauges layer contains real-time measurements of water depth from multiple reporting agencies recording at sensors across the world. This layer uses <a href='https://www.esri.com/software/arcgis/arcgisserver/extensions/geoevent-extension' target='_blank' rel='nofollow ugc noopener noreferrer'>GeoEvent Processor</a> to ingest and consolidate the many live sensor feeds, and updates itself every hour. At some gauges, flow in cubic feet per second is estimated using a <a href='https://water.usgs.gov/edu/streamflow3.html' target='_blank' rel='nofollow ugc noopener noreferrer'>stage-discharge rating curve</a>. Flow forecasts are also provided where available. These sensor feeds are owned and maintained by the GIS community. For details on the coverage in this map and the users who contributed data for this map via the <a href='https://livingatlas.arcgis.com/en/participate/#v=community&amp;subTab=what-to-contribute' target='_blank' rel='nofollow ugc noopener noreferrer'>Community Maps Program</a>, view the list of <a href='https://goto.arcgisonline.com/blogs/GageContributors' target='_blank' rel='nofollow ugc noopener noreferrer'>Contributors for the Live Stream Gauges Service</a>. <span style='color: rgb(77, 77, 77); font-family: '>If you want to contribute your organization's gauges, read more about the program </span><a href='https://downloads.esri.com/blogs/hydro/AGOL_Content/GaugeSubmissionRequirements.pdf' style='color: rgb(33, 117, 155); font-family: ' target='_blank' rel='nofollow ugc noopener noreferrer'>here</a><span style='color: rgb(77, 77, 77); font-family: '>.</span></div></div></div>",
			"keyword": [
				"NOAA",
				"AHPS",
				"Flood",
				"Gauge",
				"Gage",
				"USGS",
				"NWIS",
				"earth observations",
				"environment",
				"esri_environment"
			],
			"issued": "2014-06-26T20:53:23.000Z",
			"modified": "2026-02-19T18:41:13.000Z",
			"publisher": {
				"name": "Esri"
			},
			"contactPoint": {
				"@type": "vcard:Contact",
				"fn": "esri_observations",
				"hasEmail": "{{orgContactEmail}}"
			},
			"accessLevel": "public",
			"spatial": "-98.5826,27.7191,-92.9741,30.7929",
			"license": "<img src='https://downloads.esri.com/blogs/arcgisonline/esrilogo_new.png' /> This work is licensed under the Esri Master License Agreement.<br /><div><a href='https://goto.arcgis.com/termsofuse/viewsummary' target='_blank' rel='nofollow ugc noopener noreferrer'><b>View Summary</b></a> | <a href='https://goto.arcgis.com/termsofuse/viewtermsofuse' target='_blank' rel='nofollow ugc noopener noreferrer'><b>View Terms of Use</b></a></div>",
			"distribution": [
				{
					"@type": "dcat:Distribution",
					"title": "ArcGIS Hub Dataset",
					"format": "Web Page",
					"mediaType": "text/html",
					"accessURL": "https://www.pacificgeoportal.com/maps/esri::live-stream-gauges"
				}
			],
			"theme": [
				"geospatial"
			]
		},
		{
			"@type": "dcat:Dataset",
			"identifier": "https://www.arcgis.com/home/item.html?id=8dda0e7b5e2d4fafa80132d59122268c",
			"landingPage": "https://www.pacificgeoportal.com/maps/esri::streets-wgs84",
			"title": "Streets (WGS84)",
			"description": "<div><div style='font-family:&quot;Avenir Next W01&quot;, &quot;Avenir Next W00&quot;, &quot;Avenir Next&quot;, Avenir, &quot;Helvetica Neue&quot;, Helvetica, Arial, sans-serif; font-size:17px; background-color:rgb(255, 255, 255);'><div style='overflow:auto; word-wrap:break-word; max-width:100%; display:inherit;'><div><div><div style='font-family:&quot;Avenir Next&quot;, Avenir, &quot;Helvetica Neue&quot;, Helvetica, Arial, sans-serif; font-size:15px;'><div style='font-family:inherit;'>The <b>Streets (WGS84) </b>(World Edition) web map is presented with a classic Esri street map style. The comprehensive street map includes highways, major roads, minor roads, railways, water features, cities, parks, landmarks, building footprints, and administrative boundaries.  </div><div style='font-family:inherit;'><br /></div><div style='font-family:inherit;'>This basemap, included in the ArcGIS Living Atlas of the World, uses the <a href='https://www.arcgis.com/home/item.html?id=cc8072363d614d96b08b2361a09979a5' target='_blank' rel='nofollow ugc noopener noreferrer'>World Street Map (WGS84)</a> vector tile layer.</div><div style='font-family:inherit;'><br /></div><div>The vector tile layer in this web map is built using the same data sources used for other Esri Vector Basemaps. For details on data sources contributed by the GIS community, view the map of <a href='https://goto.arcgis.com/vectorbasemaps/community' target='_blank' rel='nofollow ugc noopener noreferrer'>Community Maps Basemap Contributors</a>. Esri Vector Basemaps WGS84 are updated quarterly.</div><div><br /></div><div>Check out other WGS84 basemaps in the <a href='https://www.arcgis.com/home/group.html?id=4c790318395940c18a16e8acd721de25#overview' target='_blank' rel='nofollow ugc noopener noreferrer'>World Basemaps (WGS84)</a> group. </div><div><br /></div><div><font size='4'>Use this Map</font></div><div><font size='3'><br /></font></div><div>This map is designed to be used as a basemap for overlaying other layers of information or as a stand-alone reference map.  You can add layers to this web map and save as your own map.  If you like, you can add this web map to a custom basemap gallery for others in your organization to use in creating web maps.  If you would like to add this map as a layer in other maps you are creating, you may use the layers referenced in this map.</div><div><br /></div><br /></div><div style='font-family:&quot;Avenir Next&quot;, Avenir, &quot;Helvetica Neue&quot;, Helvetica, Arial, sans-serif; font-size:15px;'><font size='4'>Precise Tile Registration </font></div><div style='font-family:&quot;Avenir Next&quot;, Avenir, &quot;Helvetica Neue&quot;, Helvetica, Arial, sans-serif; font-size:15px;'><font size='4'><br /></font></div><div style='font-family:&quot;Avenir Next&quot;, Avenir, &quot;Helvetica Neue&quot;, Helvetica, Arial, sans-serif; font-size:15px;'>The map uses the improved tiling scheme “WGS84 Geographic, Version 2” to ensure proper tile positioning at higher resolutions (neighborhood level and beyond). The new tiling scheme is much more precise than tiling schemes of the legacy basemaps Esri released years ago. We recommend that you start using this new basemap for any new web maps in WGS84 that you plan to author. Due to the number of differences between the old and new tiling schemes, some web clients will not be able to overlay tile layers in the old and new tiling schemes in one web map. </div></div><div><ul></ul></div></div></div></div><div style='margin-top:3.1rem; margin-bottom:3.1rem; display:inherit; font-family:&quot;Avenir Next W01&quot;, &quot;Avenir Next W00&quot;, &quot;Avenir Next&quot;, Avenir, &quot;Helvetica Neue&quot;, Helvetica, Arial, sans-serif; font-size:17px; background-color:rgb(255, 255, 255);'><div style='display:inherit;'></div></div></div><div><div><ul></ul></div></div>",
			"keyword": [
				"basemap",
				"Esri Basemaps",
				"Streets",
				"esriStreets",
				"gcs",
				"vector",
				"World"
			],
			"issued": "2017-04-26T23:50:24.000Z",
			"modified": "2026-01-09T07:13:13.000Z",
			"publisher": {
				"name": "Esri"
			},
			"contactPoint": {
				"@type": "vcard:Contact",
				"fn": "esri",
				"hasEmail": "{{orgContactEmail}}"
			},
			"accessLevel": "public",
			"spatial": "-129.9902,-71.1035,129.6387,71.1035",
			"license": "<div><img src='https://downloads.esri.com/blogs/arcgisonline/esrilogo_new.png' /> This work is licensed under the Esri Master License Agreement.<br /><div><a href='https://goto.arcgis.com/termsofuse/viewsummary' target='_blank' rel='nofollow ugc noopener noreferrer'><b>View Summary</b></a> | <b><a href='https://goto.arcgis.com/termsofuse/viewtermsofuse' target='_blank' rel='nofollow ugc noopener noreferrer'>View Terms of Use</a></b></div><div><br /></div><div>Alignment of boundaries is a presentation of the feature provided by our data vendors and does not imply endorsement by Esri or any governing authority.<br /></div><div><br /></div><div>For details on data sources contributed by the GIS community, view the map of <a href='https://goto.arcgis.com/vectorbasemaps/community' target='_blank' rel='nofollow ugc noopener noreferrer'>Community Maps Basemap Contributors</a>.</div></div>",
			"distribution": [
				{
					"@type": "dcat:Distribution",
					"title": "ArcGIS Hub Dataset",
					"format": "Web Page",
					"mediaType": "text/html",
					"accessURL": "https://www.pacificgeoportal.com/maps/esri::streets-wgs84"
				}
			],
			"theme": [
				"geospatial"
			]
		},
		{
			"@type": "dcat:Dataset",
			"identifier": "https://www.arcgis.com/home/item.html?id=c21b6cf0d229428b9b23604b38f6ed70",
			"landingPage": "https://www.pacificgeoportal.com/datasets/esri::seafloor-silicate-μmol-l",
			"title": "Seafloor Silicate (μmol/l)",
			"description": "<div>Silica is most common on the ocean floor beneath cold surface waters as it dissolves quickly in warm water. Silica is formed from the remains of organisms with silica based skeletons like diatoms or radiolarians. When large plankton blooms with a sudden die-off occur massive amounts of diatoms that associate die and contribute to the siliceous material on the seafloor. Silicate directly influences marine primary productivity.  </div><div><br /></div><div><div style='margin: 0px; padding: 0px;'><div style='color: rgb(77, 77, 77); font-family: '><b>Phenomenon Mapped:</b> Seafloor silicate</div><div style='color: rgb(77, 77, 77); font-family: '><b>Units:</b> Micromoles per liter</div><div style='color: rgb(77, 77, 77); font-family: '><b>Cell Size:</b> 30 arc seconds, approximately 1 km</div><div style='color: rgb(77, 77, 77); margin: 0px; padding: 0px;'><b>Source Type: </b>Discrete</div><div style='color: rgb(77, 77, 77); font-family: '><b>Pixel Type: </b><span style='line-height: 1.38462;'>Unsigned integer</span></div><div><font color='#4d4d4d'><b>Spatial Reference: </b>GCS_WGS_1984</font><br /></div><div style='color: rgb(77, 77, 77); font-family: '><span style='line-height: 16.3636px;'><b>Mosaic Projection: </b>Web Mercator Auxiliary Sphere</span></div><div style='color: rgb(77, 77, 77); font-family: '><span style='line-height: 16.3636px;'><b>Extent:</b> Global oceans</span></div><div style='color: rgb(77, 77, 77); font-family: '><span style='line-height: 16.3636px;'><b>Source:</b> </span><a href='https://marine-conservation.org/' rel='nofollow ugc' style='line-height: 1.38462;' target='_blank'>Marine Conservation Institute (MCI)</a></div><div style='margin: 0px; padding: 0px;'><span style='background-color: rgb(255, 255, 255);'><b>Citation:</b><font color='#4d4d4d' face='Lucida Grande, Lucida Sans Unicode, Arial, Helvetica, sans-serif'><span style='font-size: 14px; line-height: 22px;'> </span></font><span style='line-height: 16.3636px;'>Garcia HE, Locarnini RA, Boyer TP, Antonov JI (2006) World Ocean Atlas 2005, Volume 4: Nutrients (phosphate, nitrate, silicate). In: Levitus S, editor. 396 p. NOAA Atlas NESDIS 64, U.S. Government Printing Office, Washington DC.</span></span></div></div><div style='margin: 0px; padding: 0px; color: rgb(77, 77, 77); font-family: '><span style='background-color: rgb(255, 255, 255);'><b>Publication Date:</b> 2006</span></div><div style='margin: 0px; padding: 0px; color: rgb(77, 77, 77); font-family: '><b>ArcGIS Server URL:</b> <a href='https://oceans2.arcgis.com/arcgis/' rel='nofollow ugc' style='line-height: 1.38462;' target='_blank'>https://oceans2.arcgis.com/arcgis/</a><br /></div><div style='margin: 0px; padding: 0px; color: rgb(77, 77, 77); font-family: '><br /></div><div style='margin: 0px; padding: 0px; color: rgb(77, 77, 77); font-family: '><span style='background-color: rgb(255, 255, 255);'>The </span><a href='https://marine-conservation.org/' rel='nofollow ugc' target='_blank'>Marine Conservation Institute</a><span style='background-color: rgb(255, 255, 255);'> used this dataset as an input to a predictive habitat model documented in the publication <a href='https://journals.plos.org/plosone/article?id=10.1371/journal.pone.0018483' rel='nofollow ugc' style='color: rgb(33, 117, 155); outline: none !important;' target='_blank'>Global Habitat Suitability for Framework-Forming Cold-Water Corals</a>.</span></div><div style='margin: 0px; padding: 0px; color: rgb(77, 77, 77); font-family: '><br /></div><div style='margin: 0px; padding: 0px; color: rgb(77, 77, 77); font-family: '><div style='color: rgb(68, 68, 68); line-height: 16.3636px;'><span style='line-height: 16.3636px;'><font size='4'>What can you do with this layer?</font></span></div><div style='color: rgb(68, 68, 68); line-height: 16.3636px;'><span style='line-height: 16.3636px;'><b><br /></b></span></div><div style='color: rgb(68, 68, 68); line-height: 16.3636px;'><span style='line-height: 16.3636px;'><b>Visualization:</b> This layer can be used for visualization online in web maps and in ArcGIS Desktop.</span></div><div style='color: rgb(68, 68, 68); line-height: 16.3636px;'><span style='line-height: 16.3636px;'><br /></span></div><div style='color: rgb(68, 68, 68); line-height: 16.3636px;'><span style='line-height: 16.3636px;'><b>Analysis:</b> This layer can be used as an input to geoprocessing tools and model builder.</span></div><div style='color: rgb(68, 68, 68); line-height: 16.3636px;'><span style='line-height: 16.3636px;'><br /></span></div><div style='color: rgb(68, 68, 68); line-height: 16.3636px;'><b>Raster Functions</b><span style='line-height: 18px;'>: Cartographic Renderer - see this </span><a href='https://blogs.esri.com/esri/arcgis/?p=59353' rel='nofollow ugc' style='line-height: 18px;' target='_blank'>blog</a><span style='line-height: 18px;'> for more information.</span><span style='line-height: 16.3636px;'><br /></span></div><div style='color: rgb(68, 68, 68); line-height: 16.3636px;'><span style='line-height: 16.3636px;'><br /></span></div><div style='color: rgb(68, 68, 68); line-height: 16.3636px;'><span style='line-height: 16.3636px;'>This layer is part of the </span><a href='https://doc.arcgis.com/en/living-atlas/about/' rel='nofollow ugc' target='_blank'>Living Atlas of the World</a><span style='line-height: 16.3636px;'> that provides access to thousands of beautiful and authoritative layers, web maps, and apps.</span></div></div></div>",
			"keyword": [
				"oceans",
				"oceans2",
				"esri_oceans",
				"retiring-2027-12"
			],
			"issued": "2015-10-28T16:00:04.000Z",
			"modified": "2024-02-23T01:15:56.000Z",
			"publisher": {
				"name": "Esri"
			},
			"contactPoint": {
				"@type": "vcard:Contact",
				"fn": "esri_oceans",
				"hasEmail": "{{orgContactEmail}}"
			},
			"accessLevel": "public",
			"spatial": "-180.0000,-90.0000,180.0000,90.0000",
			"license": "<p><img src='https://downloads.esri.com/blogs/arcgisonline/esrilogo_new.png' /> This work is licensed under the Esri Master License Agreement.&nbsp;</p><div><a target='_blank' href='https://goto.arcgis.com/termsofuse/viewsummary' rel='nofollow ugc noopener noreferrer'><strong>View Summary</strong></a> | <a target='_blank' href='https://goto.arcgis.com/termsofuse/viewtermsofuse' rel='nofollow ugc noopener noreferrer'><strong>View Terms of Use</strong></a><br />&nbsp;</div><div><span style='color:#b22222;'>Important Note:</span> This item requires an ArcGIS Online organizational subscription or an ArcGIS Developer account and does not consume credits. To access this item, you'll need to do one of the following:</div><div><ul><li>Sign in with an account that is a member of an organizational subscription</li><li>Sign in with a developer account</li><li><a target='_blank' href='https://goto.arcgis.com/termsofuse/registeranapplication' rel='nofollow ugc noopener noreferrer'>Register an application</a> and use your application's credentials.<br />&nbsp;</li></ul><p>If you don't have an account, you can sign up for a <a target='_blank' href='https://goto.arcgis.com/features/trial' rel='nofollow ugc noopener noreferrer'>free trial of ArcGIS</a> or a <a target='_blank' href='https://goto.arcgis.com/developers/signup' rel='nofollow ugc noopener noreferrer'>free ArcGIS Developer account</a>.</p></div>",
			"distribution": [
				{
					"@type": "dcat:Distribution",
					"title": "ArcGIS Hub Dataset",
					"format": "Web Page",
					"mediaType": "text/html",
					"accessURL": "https://www.pacificgeoportal.com/datasets/esri::seafloor-silicate-μmol-l"
				},
				{
					"@type": "dcat:Distribution",
					"title": "ArcGIS GeoService",
					"format": "ArcGIS GeoServices REST API",
					"mediaType": "application/json",
					"accessURL": "https://oceans2.arcgis.com/arcgis/rest/services/Seafloor_Silicate/ImageServer"
				}
			],
			"theme": [
				"geospatial"
			]
		},
		{
			"@type": "dcat:Dataset",
			"identifier": "https://www.arcgis.com/home/item.html?id=ab0926890e444fd0a2ecd4f40fb318f7",
			"landingPage": "https://www.pacificgeoportal.com/datasets/esri::seafloor-temperature-°c",
			"title": "Seafloor Temperature (°C)",
			"description": "<div><span style='line-height: 1.38462;'>Marine life have certain thresholds for temperature that they can live in. For instance, deep-water corals have been recorded in temperatures of -1⁰C. Seafloor temperatures generally decrease with increasing depth.  </span><br /></div><div><br /></div><div><div style='margin: 0px; padding: 0px;'><div style='color: rgb(77, 77, 77); font-family: '><b>Phenomenon Mapped:</b> Seafloor temperature</div><div style='color: rgb(77, 77, 77); font-family: '><b>Units:</b> Degrees Celsius</div><div style='color: rgb(77, 77, 77); font-family: '><b>Cell Size:</b> 30 arc seconds, approximately 1 km</div><div><b>Source Type: </b>Discrete</div><div style='color: rgb(77, 77, 77); font-family: '><b>Pixel Type: </b><span style='color: rgb(68, 68, 68); line-height: 1.38462;'>Signed integer</span></div><div><font color='#4d4d4d'><b>Spatial Reference: </b>GCS_WGS_1984</font><br /></div><div style='color: rgb(77, 77, 77); font-family: '><span style='line-height: 16.3636px;'><b>Mosaic Projection: </b>Web Mercator Auxiliary Sphere</span></div><div style='color: rgb(77, 77, 77); font-family: '><span style='line-height: 16.3636px;'><b>Extent:</b> Global oceans</span></div><div style='color: rgb(77, 77, 77); font-family: '><span style='line-height: 16.3636px;'><b>Source:</b> </span><a href='https://marine-conservation.org/' rel='nofollow ugc' style='line-height: 1.38462;' target='_blank'>Marine Conservation Institute (MCI)</a></div><div style='margin: 0px; padding: 0px;'><span style='background-color: rgb(255, 255, 255);'><b>Citation: </b><font color='#4d4d4d' face='Lucida Grande, Lucida Sans Unicode, Arial, Helvetica, sans-serif'><span style='font-size: 14px; line-height: 22px;'>Boyer TP, Levitus S, Garcia HE, Locamini RA, Stephens C, et al. (2005) Objective analyses of annual, seasonal, and monthly temperature and salinity for the World Ocean on a 0.25° grid. International Journal of Climatology 25: 931–945.</span></font></span></div></div><div style='margin: 0px; padding: 0px; color: rgb(77, 77, 77); font-family: '><span style='background-color: rgb(255, 255, 255);'><b>Publication Date:</b> 2005</span></div><div style='margin: 0px; padding: 0px; color: rgb(77, 77, 77); font-family: '><b>ArcGIS Server URL:</b><span style='color: rgb(68, 68, 68); line-height: 1.38462;'> </span><a href='https://oceans2.arcgis.com/arcgis/' rel='nofollow ugc' style='line-height: 1.38462;' target='_blank'>https://oceans2.arcgis.com/arcgis/</a><br /></div><div style='margin: 0px; padding: 0px; color: rgb(77, 77, 77); font-family: '><span style='color: rgb(68, 68, 68); line-height: 1.38462;'><br /></span></div><div style='margin: 0px; padding: 0px; color: rgb(77, 77, 77); font-family: '><span style='background-color: rgb(255, 255, 255);'>The </span><a href='https://marine-conservation.org/' rel='nofollow ugc' target='_blank'>Marine Conservation Institute</a><span style='background-color: rgb(255, 255, 255);'> used this dataset as an input to a predictive habitat model documented in the publication <a href='https://journals.plos.org/plosone/article?id=10.1371/journal.pone.0018483' rel='nofollow ugc' style='color: rgb(33, 117, 155); outline: none !important;' target='_blank'>Global Habitat Suitability for Framework-Forming Cold-Water Corals</a>.</span></div><div style='margin: 0px; padding: 0px; color: rgb(77, 77, 77); font-family: '><br /></div><div style='margin: 0px; padding: 0px; color: rgb(77, 77, 77); font-family: '><div style='color: rgb(68, 68, 68); line-height: 16.3636px;'><span style='line-height: 16.3636px;'><font size='4'>What can you do with this layer?</font></span></div><div style='color: rgb(68, 68, 68); line-height: 16.3636px;'><span style='line-height: 16.3636px;'><b><br /></b></span></div><div style='color: rgb(68, 68, 68); line-height: 16.3636px;'><span style='line-height: 16.3636px;'><b>Visualization:</b> This layer can be used for visualization online in web maps and in ArcGIS Desktop.</span></div><div style='color: rgb(68, 68, 68); line-height: 16.3636px;'><span style='line-height: 16.3636px;'><br /></span></div><div style='color: rgb(68, 68, 68); line-height: 16.3636px;'><span style='line-height: 16.3636px;'><b>Analysis:</b> This layer can be used as an input to geoprocessing tools and model builder.</span></div><div style='color: rgb(68, 68, 68); line-height: 16.3636px;'><span style='line-height: 16.3636px;'><br /></span></div><div style='color: rgb(68, 68, 68); line-height: 16.3636px;'><b>Raster Functions</b><span style='line-height: 18px;'>: Unit Conversion – </span><span style='font-size:11.0pt;line-height:107%;\nfont-family:&quot;Calibri&quot;,sans-serif;mso-ascii-theme-font:minor-latin;mso-fareast-font-family:\nCalibri;mso-fareast-theme-font:minor-latin;mso-hansi-theme-font:minor-latin;\nmso-bidi-font-family:&quot;Times New Roman&quot;;mso-bidi-theme-font:minor-bidi;\nmso-ansi-language:EN-US;mso-fareast-language:EN-US;mso-bidi-language:AR-SA'>Celsius\nto Fahrenheit</span><span style='line-height: 18px;'>, </span><span style='line-height: 18px;'>Unit Conversion – </span><span style='font-size: 11pt; line-height: 15.6933px; font-family: Calibri, sans-serif;'>Celsius to </span><span style='font-size:11.0pt;line-height:107%;\nfont-family:&quot;Calibri&quot;,sans-serif;mso-ascii-theme-font:minor-latin;mso-fareast-font-family:\nCalibri;mso-fareast-theme-font:minor-latin;mso-hansi-theme-font:minor-latin;\nmso-bidi-font-family:&quot;Times New Roman&quot;;mso-bidi-theme-font:minor-bidi;\nmso-ansi-language:EN-US;mso-fareast-language:EN-US;mso-bidi-language:AR-SA'>Kelvin</span><span style='line-height: 18px;'>, and Cartographic Renderer - see this </span><a href='https://blogs.esri.com/esri/arcgis/?p=59353' rel='nofollow ugc' style='line-height: 18px;' target='_blank'>blog</a><span style='line-height: 18px;'> for more information.</span><span style='line-height: 16.3636px;'><br /></span></div><div style='color: rgb(68, 68, 68); line-height: 16.3636px;'><span style='line-height: 16.3636px;'><br /></span></div><div style='color: rgb(68, 68, 68); line-height: 16.3636px;'><span style='line-height: 16.3636px;'>This layer is part of the </span><a href='https://doc.arcgis.com/en/living-atlas/about/' rel='nofollow ugc' target='_blank'>Living Atlas of the World</a><span style='line-height: 16.3636px;'> that provides access to thousands of beautiful and authoritative layers, web maps, and apps.</span></div></div></div>",
			"keyword": [
				"oceans",
				"oceans2",
				"esri_oceans",
				"retiring-2027-12"
			],
			"issued": "2015-10-28T16:00:21.000Z",
			"modified": "2024-02-23T01:16:00.000Z",
			"publisher": {
				"name": "Esri"
			},
			"contactPoint": {
				"@type": "vcard:Contact",
				"fn": "esri_oceans",
				"hasEmail": "{{orgContactEmail}}"
			},
			"accessLevel": "public",
			"spatial": "-180.0000,-90.0000,180.0000,90.0000",
			"license": "<p><img src='https://downloads.esri.com/blogs/arcgisonline/esrilogo_new.png' /> This work is licensed under the Esri Master License Agreement.&nbsp;</p><div><a target='_blank' href='https://goto.arcgis.com/termsofuse/viewsummary' rel='nofollow ugc noopener noreferrer'><strong>View Summary</strong></a> | <a target='_blank' href='https://goto.arcgis.com/termsofuse/viewtermsofuse' rel='nofollow ugc noopener noreferrer'><strong>View Terms of Use</strong></a><br />&nbsp;</div><div><span style='color:#b22222;'>Important Note:</span> This item requires an ArcGIS Online organizational subscription or an ArcGIS Developer account and does not consume credits. To access this item, you'll need to do one of the following:</div><div><ul><li>Sign in with an account that is a member of an organizational subscription</li><li>Sign in with a developer account</li><li><a target='_blank' href='https://goto.arcgis.com/termsofuse/registeranapplication' rel='nofollow ugc noopener noreferrer'>Register an application</a> and use your application's credentials.<br />&nbsp;</li></ul><p>If you don't have an account, you can sign up for a <a target='_blank' href='https://goto.arcgis.com/features/trial' rel='nofollow ugc noopener noreferrer'>free trial of ArcGIS</a> or a <a target='_blank' href='https://goto.arcgis.com/developers/signup' rel='nofollow ugc noopener noreferrer'>free ArcGIS Developer account</a>.</p></div>",
			"distribution": [
				{
					"@type": "dcat:Distribution",
					"title": "ArcGIS Hub Dataset",
					"format": "Web Page",
					"mediaType": "text/html",
					"accessURL": "https://www.pacificgeoportal.com/datasets/esri::seafloor-temperature-°c"
				},
				{
					"@type": "dcat:Distribution",
					"title": "ArcGIS GeoService",
					"format": "ArcGIS GeoServices REST API",
					"mediaType": "application/json",
					"accessURL": "https://oceans2.arcgis.com/arcgis/rest/services/Seafloor_Temperature/ImageServer"
				}
			],
			"theme": [
				"geospatial"
			]
		},
		{
			"@type": "dcat:Dataset",
			"identifier": "https://www.arcgis.com/home/item.html?id=f724cddbec6b45f0bbb9950404b10163",
			"landingPage": "https://www.pacificgeoportal.com/datasets/esri::seafloor-salinity-pss",
			"title": "Seafloor Salinity (pss)",
			"description": "<div>Salinity is the quantity of dissolved salt in water. Marine life have a limited range of salinity that they can live in. Open ocean seawater typically has a salinity of 32 to 37. Temperature and salinity characteristics help determine origin of water masses.</div><div><br /></div><div><div style='margin: 0px; padding: 0px; color: rgb(77, 77, 77); font-family: '><b>Phenomenon Mapped:</b><span style='line-height: 1.38462; background-color: rgb(255, 255, 255);'> Seafloor Salinity</span><br /></div><div style='margin: 0px; padding: 0px;'><div style='margin: 0px; padding: 0px;'><div style='margin: 0px; padding: 0px;'><b>Units:</b><span style='color: rgb(77, 77, 77); background-color: rgb(255, 255, 255);'> </span>g/kg - practical salinity scale</div><div style='color: rgb(77, 77, 77); margin: 0px; padding: 0px; background-color: rgb(255, 255, 255);'><b>Cell Size:</b> 30 arc seconds, approximately 1 km</div><div style='color: rgb(77, 77, 77); margin: 0px; padding: 0px;'><b>Source Type: </b>Discrete</div><div style='color: rgb(77, 77, 77); margin: 0px; padding: 0px; background-color: rgb(255, 255, 255);'><b>Pixel Type: </b><span style='line-height: 1.38462; background-color: transparent;'>Unsigned integer</span></div><div style='margin: 0px; padding: 0px; background-color: rgb(255, 255, 255);'><font color='#4d4d4d'><b>Spatial Reference: </b>GCS_WGS_1984</font><br /></div><div style='color: rgb(77, 77, 77); margin: 0px; padding: 0px; background-color: rgb(255, 255, 255);'><span style='line-height: 16.3636px;'><b>Mosaic Projection: </b>Web Mercator Auxiliary Sphere</span></div><div style='color: rgb(77, 77, 77); margin: 0px; padding: 0px; background-color: rgb(255, 255, 255);'><span style='line-height: 16.3636px;'><b>Extent:</b> Global oceans</span></div><div style='color: rgb(77, 77, 77); margin: 0px; padding: 0px; background-color: rgb(255, 255, 255);'><span style='line-height: 16.3636px;'><b>Source:</b> </span><a href='https://marine-conservation.org/' rel='nofollow ugc' style='line-height: 1.38462; background-color: transparent;' target='_blank'>Marine Conservation Institute (MCI)</a></div><div style='margin: 0px; padding: 0px;'><span style='background-color: rgb(255, 255, 255);'><span style='color: rgb(77, 77, 77);'><b>Citation:</b> </span>Boyer TP, Levitus S, Garcia HE, Locamini RA, Stephens C, et al. (2005) Objective analyses of annual, seasonal, and monthly temperature and salinity for the World Ocean on a 0.25° grid. International Journal of Climatology 25: 931–945.</span></div></div><div style='color: rgb(77, 77, 77); margin: 0px; padding: 0px;'><span style='background-color: rgb(255, 255, 255);'><b>Publication Date:</b> 2005</span></div><div style='color: rgb(77, 77, 77); margin: 0px; padding: 0px; background-color: rgb(255, 255, 255);'><b>ArcGIS Server URL:</b> <a href='https://oceans2.arcgis.com/arcgis/' rel='nofollow ugc' style='line-height: 1.38462; background-color: transparent;' target='_blank'>https://oceans2.arcgis.com/arcgis/</a><br /></div><div style='color: rgb(77, 77, 77); margin: 0px; padding: 0px; background-color: rgb(255, 255, 255);'><br /></div><div style='color: rgb(77, 77, 77); margin: 0px; padding: 0px;'><span style='background-color: rgb(255, 255, 255);'>The </span><a href='https://marine-conservation.org/' rel='nofollow ugc' target='_blank'>Marine Conservation Institute</a><span style='background-color: rgb(255, 255, 255);'> used this dataset as an input to a predictive habitat model documented in the publication <a href='https://journals.plos.org/plosone/article?id=10.1371/journal.pone.0018483' rel='nofollow ugc' style='color: rgb(33, 117, 155); outline: none !important;' target='_blank'>Global Habitat Suitability for Framework-Forming Cold-Water Corals</a>.</span></div><div style='color: rgb(77, 77, 77); margin: 0px; padding: 0px; background-color: rgb(255, 255, 255);'><br /></div><div style='color: rgb(77, 77, 77); margin: 0px; padding: 0px; background-color: rgb(255, 255, 255);'><div style='color: rgb(68, 68, 68); line-height: 16.3636px;'><span style='line-height: 16.3636px;'><font size='4'>What can you do with this layer?</font></span></div><div style='color: rgb(68, 68, 68); line-height: 16.3636px;'><span style='line-height: 16.3636px;'><b><br /></b></span></div><div style='color: rgb(68, 68, 68); line-height: 16.3636px;'><span style='line-height: 16.3636px;'><b>Visualization:</b> This layer can be used for visualization online in web maps and in ArcGIS Desktop.</span></div><div style='color: rgb(68, 68, 68); line-height: 16.3636px;'><span style='line-height: 16.3636px;'><br /></span></div><div style='color: rgb(68, 68, 68); line-height: 16.3636px;'><span style='line-height: 16.3636px;'><b>Analysis:</b> This layer can be used as an input to geoprocessing tools and model builder.</span></div><div style='color: rgb(68, 68, 68); line-height: 16.3636px;'><span style='line-height: 16.3636px;'><br /></span></div><div style='color: rgb(68, 68, 68); line-height: 16.3636px;'><b>Raster Functions</b><span style='line-height: 18px;'>: Cartographic Renderer - see this </span><a href='https://blogs.esri.com/esri/arcgis/?p=59353' rel='nofollow ugc' style='line-height: 18px;' target='_blank'>blog</a><span style='line-height: 18px;'> for more information.</span><span style='line-height: 16.3636px;'><br /></span></div><div style='color: rgb(68, 68, 68); line-height: 16.3636px;'><span style='line-height: 16.3636px;'><br /></span></div><div style='color: rgb(68, 68, 68); line-height: 16.3636px;'><span style='line-height: 16.3636px;'>This layer is part of the </span><a href='https://doc.arcgis.com/en/living-atlas/about/' rel='nofollow ugc' target='_blank'>Living Atlas of the World</a><span style='line-height: 16.3636px;'> that provides access to thousands of beautiful and authoritative layers, web maps, and apps.</span></div></div></div></div>",
			"keyword": [
				"oceans",
				"oceans2",
				"esri_oceans",
				"retiring-2027-12"
			],
			"issued": "2015-10-28T16:00:02.000Z",
			"modified": "2024-02-23T01:16:02.000Z",
			"publisher": {
				"name": "Esri"
			},
			"contactPoint": {
				"@type": "vcard:Contact",
				"fn": "esri_oceans",
				"hasEmail": "{{orgContactEmail}}"
			},
			"accessLevel": "public",
			"spatial": "-180.0000,-90.0000,180.0000,90.0000",
			"license": "<p><img src='https://downloads.esri.com/blogs/arcgisonline/esrilogo_new.png' width='113' height='39' /> This work is licensed under the Esri Master License Agreement.&nbsp;</p><div><a target='_blank' href='https://goto.arcgis.com/termsofuse/viewsummary' rel='nofollow ugc noopener noreferrer'><strong>View Summary</strong></a> | <a target='_blank' href='https://goto.arcgis.com/termsofuse/viewtermsofuse' rel='nofollow ugc noopener noreferrer'><strong>View Terms of Use</strong></a><br />&nbsp;</div><div><span style='color:#b22222;'>Important Note:</span> This item requires an ArcGIS Online organizational subscription or an ArcGIS Developer account and does not consume credits. To access this item, you'll need to do one of the following:</div><div><ul><li>Sign in with an account that is a member of an organizational subscription</li><li>Sign in with a developer account</li><li><a target='_blank' href='https://goto.arcgis.com/termsofuse/registeranapplication' rel='nofollow ugc noopener noreferrer'>Register an application</a> and use your application's credentials.<br />&nbsp;</li></ul><p>If you don't have an account, you can sign up for a <a target='_blank' href='https://goto.arcgis.com/features/trial' rel='nofollow ugc noopener noreferrer'>free trial of ArcGIS</a> or a <a target='_blank' href='https://goto.arcgis.com/developers/signup' rel='nofollow ugc noopener noreferrer'>free ArcGIS Developer account</a>.</p></div>",
			"distribution": [
				{
					"@type": "dcat:Distribution",
					"title": "ArcGIS Hub Dataset",
					"format": "Web Page",
					"mediaType": "text/html",
					"accessURL": "https://www.pacificgeoportal.com/datasets/esri::seafloor-salinity-pss"
				},
				{
					"@type": "dcat:Distribution",
					"title": "ArcGIS GeoService",
					"format": "ArcGIS GeoServices REST API",
					"mediaType": "application/json",
					"accessURL": "https://oceans2.arcgis.com/arcgis/rest/services/Seafloor_Salinity/ImageServer"
				}
			],
			"theme": [
				"geospatial"
			]
		},
		{
			"@type": "dcat:Dataset",
			"identifier": "https://www.arcgis.com/home/item.html?id=3e20c8ae23b44ca7b99af621fdc129de",
			"landingPage": "https://www.pacificgeoportal.com/datasets/esri::seafloor-bathymetry-meters",
			"title": "Seafloor Bathymetry (meters)",
			"description": "<div>Ocean depth plays an important role in the distribution and abundance of living organisms and has important implications for shipping and offshore development projects such as wind power and oil extraction.</div><div><br /></div><div><div style='margin: 0px; padding: 0px;'><div style='color: rgb(77, 77, 77); margin: 0px; padding: 0px; background-color: rgb(255, 255, 255);'><b>Phenomenon Mapped:</b> Seafloor depth, bathymetry</div><div style='margin: 0px; padding: 0px;'><b>Units:</b><span style='color: rgb(77, 77, 77); background-color: rgb(255, 255, 255);'> </span>Meters below sea level</div><div style='margin: 0px; padding: 0px;'><b>Cell Size:</b> 30 arc seconds, approximately 1 km</div><div><div><b>Source Type: </b>Discrete</div><div><b>Pixel Type: </b>Signed integer</div><div><b>Spatial Reference: </b>GCS_WGS_1984<br /></div></div><div style='color: rgb(77, 77, 77); margin: 0px; padding: 0px; background-color: rgb(255, 255, 255);'><span style='line-height: 16.3636px;'><b>Mosaic Projection: </b>Web Mercator Auxiliary Sphere</span></div><div style='color: rgb(77, 77, 77); margin: 0px; padding: 0px; background-color: rgb(255, 255, 255);'><span style='line-height: 16.3636px;'><b>Extent:</b> Global oceans</span></div><div style='color: rgb(77, 77, 77); margin: 0px; padding: 0px; background-color: rgb(255, 255, 255);'><span style='line-height: 16.3636px;'><b>Source:</b> </span><a href='https://marine-conservation.org/' rel='nofollow ugc' style='line-height: 1.38462; background-color: transparent;' target='_blank'>Marine Conservation Institute (MCI)</a></div><div style='color: rgb(77, 77, 77); margin: 0px; padding: 0px; background-color: rgb(255, 255, 255);'><b>Citation:</b> <span style='color: rgb(68, 68, 68); font-family: Verdana; font-size: 13px; line-height: 16.3636px;'>Becker JJ, Sandwell DT, Smith WHF, Braud J, Binder B, et al. (2009) Global bathymetry and elevation data at 30 arc seconds resolution: SRTM30_PLUS. Marine Geodesy 32: 355–371.</span></div></div><div style='margin: 0px; padding: 0px; color: rgb(77, 77, 77); font-family: '><b>Publication Date:</b> 2009</div><div style='margin: 0px; padding: 0px; color: rgb(77, 77, 77); font-family: '><b>ArcGIS Server URL:</b><span style='color: rgb(68, 68, 68); line-height: 1.38462;'> </span><a href='https://oceans2.arcgis.com/arcgis/' rel='nofollow ugc' style='line-height: 1.38462;' target='_blank'>https://oceans2.arcgis.com/arcgis/</a><br /></div><div style='margin: 0px; padding: 0px; color: rgb(77, 77, 77); font-family: '><br /></div><div style='margin: 0px; padding: 0px;'><font color='#4d4d4d' style='background-color: rgb(255, 255, 255);'>The </font><a href='https://marine-conservation.org/' rel='nofollow ugc' target='_blank'>Marine Conservation Institute</a><font color='#4d4d4d' style='background-color: rgb(255, 255, 255);'> used this dataset as an input to a predictive habitat model documented in the publication <a href='https://journals.plos.org/plosone/article?id=10.1371/journal.pone.0018483' rel='nofollow ugc' target='_blank'>Global Habitat Suitability for Framework-Forming Cold-Water Corals</a>.</font><br /></div><div style='margin: 0px; padding: 0px; color: rgb(77, 77, 77); font-family: '><span style='color: rgb(68, 68, 68); line-height: 16.3636px;'><br /></span></div><div style='margin: 0px; padding: 0px;'><span style='color: rgb(68, 68, 68); line-height: 16.3636px;'>The source data is available from the </span><a href='https://topex.ucsd.edu/WWW_html/srtm30_plus.html' rel='nofollow ugc' target='_blank'>Scripps Institution of Oceanography Satellite Geodesy Webpage</a><span style='line-height: 16.3636px;'>.</span></div></div><div style='margin: 0px; padding: 0px;'><span style='line-height: 16.3636px;'><br /></span></div><div style='margin: 0px; padding: 0px;'><div style='line-height: 16.3636px;'><span style='line-height: 16.3636px;'><font size='4'>What can you do with this layer?</font></span></div><div style='line-height: 16.3636px;'><span style='line-height: 16.3636px;'><font size='4'><br /></font></span></div><div style='line-height: 16.3636px;'><span style='line-height: 16.3636px;'><b>Visualization:</b> This layer can be used for visualization online in web maps and in ArcGIS Desktop.</span></div><div style='line-height: 16.3636px;'><span style='line-height: 16.3636px;'><br /></span></div><div style='line-height: 16.3636px;'><span style='line-height: 16.3636px;'><b>Analysis:</b> This layer can be used as an input to geoprocessing tools and model builder.</span></div><div style='line-height: 16.3636px;'><span style='line-height: 16.3636px;'><br /></span></div><div style='line-height: 16.3636px;'><b>Raster Functions</b><span style='line-height: 18px;'>: Unit Conversion – meters to feet, Cartographic Renderer, Aspect, Slope, and Hillshade - see this </span><a href='https://blogs.esri.com/esri/arcgis/?p=59353' rel='nofollow ugc' style='line-height: 18px;' target='_blank'>blog</a><span style='line-height: 18px;'> for more information.</span><span style='line-height: 16.3636px;'><br /></span></div><div style='line-height: 16.3636px;'><span style='line-height: 16.3636px;'><br /></span></div><div style='line-height: 16.3636px;'><span style='line-height: 16.3636px;'>This layer is part of the </span><a href='https://doc.arcgis.com/en/living-atlas/about/' rel='nofollow ugc' target='_blank'>Living Atlas of the World</a><span style='line-height: 16.3636px;'> that provides access to thousands of beautiful and authoritative layers, web maps, and apps.</span></div></div>",
			"keyword": [
				"oceans",
				"oceans2",
				"esri_oceans",
				"retiring-2027-12"
			],
			"issued": "2015-10-28T15:59:56.000Z",
			"modified": "2024-02-23T01:16:03.000Z",
			"publisher": {
				"name": "Esri"
			},
			"contactPoint": {
				"@type": "vcard:Contact",
				"fn": "esri_oceans",
				"hasEmail": "{{orgContactEmail}}"
			},
			"accessLevel": "public",
			"spatial": "-180.0000,-90.0000,180.0000,90.0000",
			"license": "<p><img src='https://downloads.esri.com/blogs/arcgisonline/esrilogo_new.png' /> This work is licensed under the Esri Master License Agreement.&nbsp;</p><div><a target='_blank' href='https://goto.arcgis.com/termsofuse/viewsummary' rel='nofollow ugc noopener noreferrer'><strong>View Summary</strong></a> | <a target='_blank' href='https://goto.arcgis.com/termsofuse/viewtermsofuse' rel='nofollow ugc noopener noreferrer'><strong>View Terms of Use</strong></a></div><div>&nbsp;</div><div><span style='color:#b22222;'>Important Note:</span> This item requires an ArcGIS Online organizational subscription or an ArcGIS Developer account and does not consume credits. To access this item, you'll need to do one of the following:</div><div><ul><li>Sign in with an account that is a member of an organizational subscription</li><li>Sign in with a developer account</li><li><a target='_blank' href='https://goto.arcgis.com/termsofuse/registeranapplication' rel='nofollow ugc noopener noreferrer'>Register an application</a> and use your application's credentials.<br />&nbsp;</li></ul><p>If you don't have an account, you can sign up for a <a target='_blank' href='https://goto.arcgis.com/features/trial' rel='nofollow ugc noopener noreferrer'>free trial of ArcGIS</a> or a <a target='_blank' href='https://goto.arcgis.com/developers/signup' rel='nofollow ugc noopener noreferrer'>free ArcGIS Developer account</a>.</p></div>",
			"distribution": [
				{
					"@type": "dcat:Distribution",
					"title": "ArcGIS Hub Dataset",
					"format": "Web Page",
					"mediaType": "text/html",
					"accessURL": "https://www.pacificgeoportal.com/datasets/esri::seafloor-bathymetry-meters"
				},
				{
					"@type": "dcat:Distribution",
					"title": "ArcGIS GeoService",
					"format": "ArcGIS GeoServices REST API",
					"mediaType": "application/json",
					"accessURL": "https://oceans2.arcgis.com/arcgis/rest/services/Seafloor_Bathymetry/ImageServer"
				}
			],
			"theme": [
				"geospatial"
			]
		},
		{
			"@type": "dcat:Dataset",
			"identifier": "https://www.arcgis.com/home/item.html?id=edc6d54479014a49941122acf1104cbe",
			"landingPage": "https://www.pacificgeoportal.com/datasets/esri::distance-to-coast-km",
			"title": "Distance to Coast (km)",
			"description": "<span><div>Portions\n of the world's interior, such as central Asia are extremely secluded \nfrom the ocean and are more than 2,000 km from the nearest coast. \nDistance to coast can be used in asset management and modeling project \ncosts. </div><div><br /></div><div><b>Phenomenon Mapped</b>: Distance to coast</div><div><b>Units</b>: Kilometers</div><div><b>Cell Size</b>: 655.9259912 meters</div><div><b>Source Type</b>: Discrete</div><div><b>Pixel Type</b>: Signed integer</div><div><b>Spatial Reference</b>: World Equidistant Cylindrical</div><div><b>Mosaic Projection</b>: Web Mercator Auxiliary Sphere</div><div><b>Extent</b>: Global</div><div><b>Source</b>: Esri</div><div><b>Publication Date</b>: 2015</div><div><b>ArcGIS Server URL</b>: <a href='https://oceans2.arcgis.com/arcgis/' rel='nofollow ugc' style='line-height: 1.38462;' target='_blank'>https://oceans2.arcgis.com/arcgis/</a></div></span><span><div><br /></div><div>The Distance to Coast layer was calculated by Esri using the Euclidean Distance Tool in ArcMap and the <a href='https://www.arcgis.com/home/item.html?id=ac80670eb213440ea5899bbf92a04998' rel='nofollow ugc' target='_blank'>Esri Country Boundaries layer</a>.</div><div><br /></div><div><font size='4'>What can you do with this layer?</font></div><div><br /></div><div><b>Visualization</b>: This layer can be used for visualization online in web maps and in ArcGIS Desktop.</div><div><br /></div><div><b>Analysis</b>:\n This layer can be used as an input to geoprocessing tools and model \nbuilder.</div><div><br /></div><div><b>Raster Functions</b>:\n Unit Conversion – kilometers to miles, Unit Conversion - kilometers to \nnautical miles, Cartographic Renderer, and Classified Renderer see this <a href='https://blogs.esri.com/esri/arcgis/?p=59353' rel='nofollow ugc' target='_blank'>blog</a> for more information.<br /></div><div><br /></div><div><span style='color: rgb(77, 77, 77); font-family: '>This layer is part of the </span><a href='https://doc.arcgis.com/en/living-atlas/about/' rel='nofollow ugc' style='color: rgb(33, 117, 155); font-family: ' target='_blank'>Living Atlas of the World</a><span style='color: rgb(77, 77, 77); font-family: '> that provides access to thousands of beautiful and authoritative layers, web maps, and apps.</span></div></span>",
			"keyword": [
				"esri_oceans",
				"Oceans2",
				"oceans",
				"retiring-2027-12"
			],
			"issued": "2016-02-11T18:51:32.000Z",
			"modified": "2024-02-23T01:16:07.000Z",
			"publisher": {
				"name": "Esri"
			},
			"contactPoint": {
				"@type": "vcard:Contact",
				"fn": "esri_oceans",
				"hasEmail": "{{orgContactEmail}}"
			},
			"accessLevel": "public",
			"spatial": "-180.0000,-89.0000,179.9998,83.6654",
			"license": "<p><img src='https://downloads.esri.com/blogs/arcgisonline/esrilogo_new.png' /> This work is licensed under the Esri Master License Agreement.&nbsp;</p><div><a target='_blank' href='https://goto.arcgis.com/termsofuse/viewsummary' rel='nofollow ugc noopener noreferrer'><strong>View Summary</strong></a> | <a target='_blank' href='https://goto.arcgis.com/termsofuse/viewtermsofuse' rel='nofollow ugc noopener noreferrer'><strong>View Terms of Use</strong></a></div><div>&nbsp;</div><div><span style='color:#b22222;'>Important Note:</span> This item requires an ArcGIS Online organizational subscription or an ArcGIS Developer account and does not consume credits. To access this item, you'll need to do one of the following:</div><div><ul><li>Sign in with an account that is a member of an organizational subscription</li><li>Sign in with a developer account</li><li><a target='_blank' href='https://goto.arcgis.com/termsofuse/registeranapplication' rel='nofollow ugc noopener noreferrer'>Register an application</a> and use your application's credentials.<br />&nbsp;</li></ul><p>If you don't have an account, you can sign up for a <a target='_blank' href='https://goto.arcgis.com/features/trial' rel='nofollow ugc noopener noreferrer'>free trial of ArcGIS</a> or a <a target='_blank' href='https://goto.arcgis.com/developers/signup' rel='nofollow ugc noopener noreferrer'>free ArcGIS Developer account</a>.</p></div>",
			"distribution": [
				{
					"@type": "dcat:Distribution",
					"title": "ArcGIS Hub Dataset",
					"format": "Web Page",
					"mediaType": "text/html",
					"accessURL": "https://www.pacificgeoportal.com/datasets/esri::distance-to-coast-km"
				},
				{
					"@type": "dcat:Distribution",
					"title": "ArcGIS GeoService",
					"format": "ArcGIS GeoServices REST API",
					"mediaType": "application/json",
					"accessURL": "https://oceans2.arcgis.com/arcgis/rest/services/Distance_to_Coast/ImageServer"
				}
			],
			"theme": [
				"geospatial"
			]
		},
		{
			"@type": "dcat:Dataset",
			"identifier": "https://www.arcgis.com/home/item.html?id=0182b19deac74ce6bcdc16b0ee290b56&sublayer=0",
			"landingPage": "https://www.pacificgeoportal.com/datasets/eaglegis::nz-urban-rural-indicator-areas-current",
			"title": "NZ Urban Rural Indicator Areas - Current",
			"description": "<p><span style='font-size:medium;'><font style='font-family:&quot;Avenir Next W01&quot;, &quot;Avenir Next W00&quot;, &quot;Avenir Next&quot;, Avenir, &quot;Helvetica Neue&quot;, Helvetica, Arial, sans-serif !important;'>Topicality:&nbsp;01-01-2026</font></span></p><div><span style='font-family:&quot;Avenir Next W01&quot;, &quot;Avenir Next W00&quot;, &quot;Avenir Next&quot;, Avenir, &quot;Helvetica Neue&quot;, Helvetica, Arial, sans-serif; font-size:medium;'>Projection: New Zealand Transverse Mercator (NZTM)</span><br />&nbsp;</div><div><div><div><span style='font-size:medium;'><font style='font-family:&quot;Avenir Next W01&quot;, &quot;Avenir Next W00&quot;, &quot;Avenir Next&quot;, Avenir, &quot;Helvetica Neue&quot;, Helvetica, Arial, sans-serif !important; font-size:17px;'>This layer contains the archive of urban-rural indicator areas as defined by Stats NZ.&nbsp;</font></span><br />&nbsp;</div><div><span style='font-size:medium;'>Urban rural is an output geography that classifies New Zealand into areas that share common urban or rural characteristics and is used to disseminate a broad range of Stats NZ’s social, demographic and economic statistics. The urban rural geography separately identifies urban areas, rural settlements, other rural areas, and water areas. The urban areas represent densely developed spaces, and encompass residential, commercial, and other nonresidential urban land uses. Rural settlements, other rural areas, and bodies of water represent areas not included within an urban area.</span></div><ul><li><span style='font-family:Avenir Next W01, Avenir Next W00, Avenir Next, Avenir, Helvetica Neue, Helvetica, Arial, sans-serif; font-size:medium;'>This layer gets updated yearly with the latest boundary data.</span></li><li><span style='font-family:Avenir Next W01, Avenir Next W00, Avenir Next, Avenir, Helvetica Neue, Helvetica, Arial, sans-serif; font-size:medium;'><font style='font-family:&quot;Avenir Next W01&quot;, &quot;Avenir Next W00&quot;, &quot;Avenir Next&quot;, Avenir, &quot;Helvetica Neue&quot;, Helvetica, Arial, sans-serif;'>A layer with the full archive of the data for all the available years is available </font></span><a target='_blank' href='https://www.arcgis.com/home/item.html?id=a1e9e78dbdaf49e39dffd5020dc4f7fc' rel='nofollow ugc noopener noreferrer'>here.</a></li><li><span style='font-family:Avenir Next W01, Avenir Next W00, Avenir Next, Avenir, Helvetica Neue, Helvetica, Arial, sans-serif; font-size:medium;'>For information about the fields in this dataset go to the Data tab.</span></li></ul><div><div><span style='font-size:medium;'><strong>Urban Rural indicator classes</strong></span></div><div><div><ul><li><div style='display:inline !important;'><span style='font-size:medium;'>urban area:</span></div><ul><li><div style='display:inline !important;'><span style='font-size:medium;'>urban major (11)</span></div></li><li><div style='display:inline !important;'><span style='font-size:medium;'>urban large (12)</span></div></li><li><div style='display:inline !important;'><span style='font-size:medium;'>urban medium (13)</span></div></li><li><div style='display:inline !important;'><span style='font-size:medium;'>urban small (14)</span></div></li></ul></li><li><div style='display:inline !important;'><span style='font-size:medium;'>rural area:</span></div><ul><li><div style='display:inline !important;'><span style='font-size:medium;'>rural settlement (21)</span></div></li><li><div style='display:inline !important;'><span style='font-size:medium;'>rural other (22)</span></div></li></ul></li><li><div style='display:inline !important;'><span style='font-size:medium;'>water:</span></div><ul><li><div style='display:inline !important;'><span style='font-size:medium;'>inland water (31)</span></div></li><li><div style='display:inline !important;'><span style='font-size:medium;'>inlet (32)</span></div></li><li><div style='display:inline !important;'><span style='font-size:medium;'>oceanic (33)</span></div></li></ul></li></ul></div></div></div><div><span style='font-size:medium;'>The layer is further generalised by Eagle Technology for improved performance on the web,&nbsp;</span><span style='font-family:&quot;Avenir Next W01&quot;, &quot;Avenir Next W00&quot;, &quot;Avenir Next&quot;, Avenir, &quot;Helvetica Neue&quot;, sans-serif; font-size:medium;'>therefore it doesn't fully represent the official boundaries.</span></div><div style='font-family:&quot;Avenir Next W01&quot;, &quot;Avenir Next W00&quot;, &quot;Avenir Next&quot;, Avenir, &quot;Helvetica Neue&quot;, Helvetica, Arial, sans-serif !important;'><div>&nbsp;</div><div><span style='font-size:medium;'><font style='font-family:&quot;Avenir Next W01&quot;, &quot;Avenir Next W00&quot;, &quot;Avenir Next&quot;, Avenir, &quot;Helvetica Neue&quot;, Helvetica, Arial, sans-serif;'>The official dataset can be found on</font></span><span style='font-family:Avenir Next W01, Avenir Next W00, Avenir Next, Avenir, Helvetica Neue, Helvetica, Arial, sans-serif; font-size:medium;'><font style='font-family:&quot;Avenir Next W01&quot;, &quot;Avenir Next W00&quot;, &quot;Avenir Next&quot;, Avenir, &quot;Helvetica Neue&quot;, Helvetica, Arial, sans-serif;'> </font></span><a target='_blank' href='https://datafinder.stats.govt.nz/data/category/annual-boundaries/' rel='nofollow ugc noopener noreferrer'>https://datafinder.stats.govt.nz.</a></div><div>&nbsp;</div></div><div style='font-family:&quot;Avenir Next W01&quot;, &quot;Avenir Next W00&quot;, &quot;Avenir Next&quot;, Avenir, &quot;Helvetica Neue&quot;, Helvetica, Arial, sans-serif !important; font-size:17px;'><div><span style='color:#2f4f4f; font-size:medium;'>This layer is offered by Eagle Technology (Official Esri Distributor). Eagle Technology offers services that can be used in the ArcGIS platform. The Content team at Eagle Technology updates the layers on a regular basis and regularly adds new content to the Living Atlas. By using this content and combining it with other data you can create new information products quickly and easily.</span></div><div>&nbsp;</div><div><span style='color:#2f4f4f; font-size:medium;'>If you have any questions or comments about the content, please let us now&nbsp; at&nbsp;</span><a style='color:rgb(0, 121, 193); text-decoration-line:none;' href='mailto:livingatlas@eagle.co.nz' target='_blank' rel='nofollow ugc noopener noreferrer'><span style='font-size:medium;'>livingatlas@eagle.co.nz</span></a></div></div></div></div>",
			"keyword": [
				"Boundary",
				"Boundaries",
				"New zealand",
				"Statistics New Zealand",
				"StatsNZ",
				"Eagle technology",
				"Nz",
				"Content",
				"Kiwi",
				"eaglegis"
			],
			"issued": "2021-02-04T01:09:58.000Z",
			"modified": "2025-12-19T00:26:21.299Z",
			"publisher": {
				"name": "Eagle Technology Group Ltd"
			},
			"contactPoint": {
				"@type": "vcard:Contact",
				"fn": "eaglegis",
				"hasEmail": "mailto:ts@eaglegis.co.nz"
			},
			"accessLevel": "public",
			"spatial": "166.2620,-47.2230,-177.6190,-33.7734",
			"license": "https://creativecommons.org/licenses/by/4.0",
			"distribution": [
				{
					"@type": "dcat:Distribution",
					"title": "ArcGIS Hub Dataset",
					"format": "Web Page",
					"mediaType": "text/html",
					"accessURL": "https://www.pacificgeoportal.com/datasets/eaglegis::nz-urban-rural-indicator-areas-current"
				},
				{
					"@type": "dcat:Distribution",
					"title": "ArcGIS GeoService",
					"format": "ArcGIS GeoServices REST API",
					"mediaType": "application/json",
					"accessURL": "https://services.arcgis.com/XTtANUDT8Va4DLwI/arcgis/rest/services/nz_urban_rural_indicator_areas/FeatureServer/0"
				},
				{
					"@type": "dcat:Distribution",
					"title": "CSV",
					"format": "CSV",
					"mediaType": "text/csv",
					"accessURL": "https://www.pacificgeoportal.com/api/download/v1/items/0182b19deac74ce6bcdc16b0ee290b56/csv?layers=0"
				},
				{
					"@type": "dcat:Distribution",
					"title": "Shapefile",
					"format": "ZIP",
					"mediaType": "application/zip",
					"accessURL": "https://www.pacificgeoportal.com/api/download/v1/items/0182b19deac74ce6bcdc16b0ee290b56/shapefile?layers=0"
				},
				{
					"@type": "dcat:Distribution",
					"title": "GeoJSON",
					"format": "GeoJSON",
					"mediaType": "application/vnd.geo+json",
					"accessURL": "https://www.pacificgeoportal.com/api/download/v1/items/0182b19deac74ce6bcdc16b0ee290b56/geojson?layers=0"
				},
				{
					"@type": "dcat:Distribution",
					"title": "KML",
					"format": "KML",
					"mediaType": "application/vnd.google-earth.kml+xml",
					"accessURL": "https://www.pacificgeoportal.com/api/download/v1/items/0182b19deac74ce6bcdc16b0ee290b56/kml?layers=0"
				},
				{
					"@type": "dcat:Distribution",
					"title": "File Geodatabase",
					"format": "ZIP",
					"mediaType": "application/zip",
					"accessURL": "https://www.pacificgeoportal.com/api/download/v1/items/0182b19deac74ce6bcdc16b0ee290b56/filegdb?layers=0"
				},
				{
					"@type": "dcat:Distribution",
					"title": "Feature Collection",
					"format": "TXT",
					"mediaType": "text/plain",
					"accessURL": "https://www.pacificgeoportal.com/api/download/v1/items/0182b19deac74ce6bcdc16b0ee290b56/featureCollection?layers=0"
				},
				{
					"@type": "dcat:Distribution",
					"title": "Excel",
					"format": "XLSX",
					"mediaType": "application/vnd.ms-excel",
					"accessURL": "https://www.pacificgeoportal.com/api/download/v1/items/0182b19deac74ce6bcdc16b0ee290b56/excel?layers=0"
				},
				{
					"@type": "dcat:Distribution",
					"title": "GeoPackage",
					"format": "GPKG",
					"mediaType": "application/geopackage+sqlite3",
					"accessURL": "https://www.pacificgeoportal.com/api/download/v1/items/0182b19deac74ce6bcdc16b0ee290b56/geoPackage?layers=0"
				},
				{
					"@type": "dcat:Distribution",
					"title": "SQLite Geodatabase",
					"format": "GDB",
					"mediaType": "application/geopackage+sqlite3",
					"accessURL": "https://www.pacificgeoportal.com/api/download/v1/items/0182b19deac74ce6bcdc16b0ee290b56/sqlite?layers=0"
				}
			],
			"theme": [
				"geospatial"
			]
		},
		{
			"@type": "dcat:Dataset",
			"identifier": "https://www.arcgis.com/home/item.html?id=dc1888b123da42b19f09d96608fc3b0e&sublayer=0",
			"landingPage": "https://www.pacificgeoportal.com/datasets/eaglegis::nz-māori-wards-current",
			"title": "NZ Māori Wards - Current",
			"description": "<div><span style='font-size:medium;'><font style='font-family:&quot;Avenir Next W01&quot;, &quot;Avenir Next W00&quot;, &quot;Avenir Next&quot;, Avenir, &quot;Helvetica Neue&quot;, Helvetica, Arial, sans-serif !important;'>Topicality:&nbsp;01-01-2026</font></span></div><div><span style='font-size:17px;'><font style='font-family:&quot;Avenir Next W01&quot;, &quot;Avenir Next W00&quot;, &quot;Avenir Next&quot;, Avenir, &quot;Helvetica Neue&quot;, Helvetica, Arial, sans-serif !important; font-size:17px;'>Projection: New Zealand Transverse Mercator (NZTM)</font></span></div><div style='font-family:&quot;Avenir Next W01&quot;, &quot;Avenir Next W00&quot;, &quot;Avenir Next&quot;, Avenir, &quot;Helvetica Neue&quot;, Helvetica, Arial, sans-serif !important; font-size:17px;'>&nbsp;</div><div style='font-family:&quot;Avenir Next W01&quot;, &quot;Avenir Next W00&quot;, &quot;Avenir Next&quot;, Avenir, &quot;Helvetica Neue&quot;, Helvetica, Arial, sans-serif !important; font-size:17px;'><span style='font-size:medium;'>This layer contains the latest set of the <span>Māori </span></span><span style='font-family:&quot;Avenir Next W01&quot;, &quot;Avenir Next W00&quot;, &quot;Avenir Next&quot;, Avenir, &quot;Helvetica Neue&quot;, sans-serif; font-size:medium;'>Ward boundaries</span><span style='font-size:medium;'> as defined by the regional councils and Local Government Commission but maintained by Stats NZ (the custodian).</span></div><div style='font-family:&quot;Avenir Next W01&quot;, &quot;Avenir Next W00&quot;, &quot;Avenir Next&quot;, Avenir, &quot;Helvetica Neue&quot;, Helvetica, Arial, sans-serif !important; font-size:17px;'>&nbsp;</div><div style='font-family:&quot;Avenir Next W01&quot;, &quot;Avenir Next W00&quot;, &quot;Avenir Next&quot;, Avenir, &quot;Helvetica Neue&quot;, Helvetica, Arial, sans-serif !important; font-size:17px;'><span style='font-size:medium;'>The Local Electoral Act 2001 provides that Māori wards may be established in territorial authorities. The statutory provisions for establishing Māori wards are set out in sections 19Z to 19ZH of the Local Electoral Act 2001. The first Māori ward was established by representation review in 2019 and appears in the 2021 geographic boundaries released by Stats NZ. The first Māori ward to be created is Wairoa Māori ward (02901) in the Wairoa District. Māori ward boundaries are defined at meshblock level.&nbsp;</span></div><ul><li><span style='font-size:medium;'>This layer get updated yearly with the latest boundary data.</span></li><li><span style='font-family:Avenir Next W01, Avenir Next W00, Avenir Next, Avenir, Helvetica Neue, Helvetica, Arial, sans-serif; font-size:medium;'><font style='font-family:&quot;Avenir Next W01&quot;, &quot;Avenir Next W00&quot;, &quot;Avenir Next&quot;, Avenir, &quot;Helvetica Neue&quot;, Helvetica, Arial, sans-serif;'>A layer with the full archive of the data for all the available years is available </font></span><a target='_blank' href='https://www.arcgis.com/home/item.html?id=5e95349d27754b21b3068b713df63173' rel='nofollow ugc noopener noreferrer'>here.</a></li><li><span style='font-size:medium;'>For information about the fields in this dataset go to the Data tab.</span></li></ul><div style='font-family:&quot;Avenir Next W01&quot;, &quot;Avenir Next W00&quot;, &quot;Avenir Next&quot;, Avenir, &quot;Helvetica Neue&quot;, Helvetica, Arial, sans-serif !important; font-size:17px;'><div><span style='font-size:medium;'>The layer is further generalised by Eagle Technology for improved performance on the web,&nbsp;</span><span style='font-family:&quot;Avenir Next W01&quot;, &quot;Avenir Next W00&quot;, &quot;Avenir Next&quot;, Avenir, &quot;Helvetica Neue&quot;, sans-serif; font-size:medium;'>therefore it doesn't fully represent the official boundaries.</span></div><div><div style='font-family:&quot;Avenir Next W01&quot;, &quot;Avenir Next W00&quot;, &quot;Avenir Next&quot;, Avenir, &quot;Helvetica Neue&quot;, Helvetica, Arial, sans-serif; font-size:17px;'>&nbsp;</div><div style='font-family:&quot;Avenir Next W01&quot;, &quot;Avenir Next W00&quot;, &quot;Avenir Next&quot;, Avenir, &quot;Helvetica Neue&quot;, Helvetica, Arial, sans-serif; font-size:17px;'><span style='font-size:medium;'><font style='font-family:&quot;Avenir Next W01&quot;, &quot;Avenir Next W00&quot;, &quot;Avenir Next&quot;, Avenir, &quot;Helvetica Neue&quot;, Helvetica, Arial, sans-serif;'>The official dataset can be found on</font></span><span style='font-family:Avenir Next W01, Avenir Next W00, Avenir Next, Avenir, Helvetica Neue, Helvetica, Arial, sans-serif; font-size:medium;'><font style='font-family:&quot;Avenir Next W01&quot;, &quot;Avenir Next W00&quot;, &quot;Avenir Next&quot;, Avenir, &quot;Helvetica Neue&quot;, Helvetica, Arial, sans-serif;'> </font></span><a target='_blank' href='https://datafinder.stats.govt.nz/data/category/annual-boundaries/' rel='nofollow ugc noopener noreferrer'>https://datafinder.stats.govt.nz.</a></div><div style='font-family:&quot;Avenir Next W01&quot;, &quot;Avenir Next W00&quot;, &quot;Avenir Next&quot;, Avenir, &quot;Helvetica Neue&quot;, Helvetica, Arial, sans-serif; font-size:17px;'>&nbsp;</div><div style='font-family:&quot;Avenir Next W01&quot;, &quot;Avenir Next W00&quot;, &quot;Avenir Next&quot;, Avenir, &quot;Helvetica Neue&quot;, Helvetica, Arial, sans-serif; font-size:17px;'><div><span style='color:#2f4f4f; font-size:medium;'>This layer is offered by Eagle Technology (Official Esri Distributor). Eagle Technology offers services that can be used in the ArcGIS platform. The Content team at Eagle Technology updates the layers on a regular basis and regularly adds new content to the Living Atlas. By using this content and combining it with other data you can create new information products quickly and easily.</span></div><div>&nbsp;</div><div><span style='color:#2f4f4f; font-size:medium;'>If you have any questions or comments about the content, please let us now&nbsp; at&nbsp;</span><a style='color:rgb(0, 121, 193); text-decoration-line:none;' href='mailto:livingatlas@eagle.co.nz' target='_blank' rel='nofollow ugc noopener noreferrer'><span style='font-size:medium;'>livingatlas@eagle.co.nz</span></a></div></div></div></div>",
			"keyword": [
				"Boundary",
				"Boundaries",
				"New zealand",
				"Statistics New Zealand",
				"StatsNZ",
				"Eagle technology",
				"Nz",
				"Content",
				"Kiwi",
				"eaglegis"
			],
			"issued": "2021-02-04T01:10:52.000Z",
			"modified": "2025-12-19T00:26:25.256Z",
			"publisher": {
				"name": "Eagle Technology Group Ltd"
			},
			"contactPoint": {
				"@type": "vcard:Contact",
				"fn": "eaglegis",
				"hasEmail": "mailto:ts@eaglegis.co.nz"
			},
			"accessLevel": "public",
			"spatial": "166.2620,-47.2230,-177.6189,-33.7734",
			"license": "https://creativecommons.org/licenses/by/4.0",
			"distribution": [
				{
					"@type": "dcat:Distribution",
					"title": "ArcGIS Hub Dataset",
					"format": "Web Page",
					"mediaType": "text/html",
					"accessURL": "https://www.pacificgeoportal.com/datasets/eaglegis::nz-māori-wards-current"
				},
				{
					"@type": "dcat:Distribution",
					"title": "ArcGIS GeoService",
					"format": "ArcGIS GeoServices REST API",
					"mediaType": "application/json",
					"accessURL": "https://services.arcgis.com/XTtANUDT8Va4DLwI/arcgis/rest/services/nz_maori_wards/FeatureServer/0"
				},
				{
					"@type": "dcat:Distribution",
					"title": "CSV",
					"format": "CSV",
					"mediaType": "text/csv",
					"accessURL": "https://www.pacificgeoportal.com/api/download/v1/items/dc1888b123da42b19f09d96608fc3b0e/csv?layers=0"
				},
				{
					"@type": "dcat:Distribution",
					"title": "Shapefile",
					"format": "ZIP",
					"mediaType": "application/zip",
					"accessURL": "https://www.pacificgeoportal.com/api/download/v1/items/dc1888b123da42b19f09d96608fc3b0e/shapefile?layers=0"
				},
				{
					"@type": "dcat:Distribution",
					"title": "GeoJSON",
					"format": "GeoJSON",
					"mediaType": "application/vnd.geo+json",
					"accessURL": "https://www.pacificgeoportal.com/api/download/v1/items/dc1888b123da42b19f09d96608fc3b0e/geojson?layers=0"
				},
				{
					"@type": "dcat:Distribution",
					"title": "KML",
					"format": "KML",
					"mediaType": "application/vnd.google-earth.kml+xml",
					"accessURL": "https://www.pacificgeoportal.com/api/download/v1/items/dc1888b123da42b19f09d96608fc3b0e/kml?layers=0"
				},
				{
					"@type": "dcat:Distribution",
					"title": "File Geodatabase",
					"format": "ZIP",
					"mediaType": "application/zip",
					"accessURL": "https://www.pacificgeoportal.com/api/download/v1/items/dc1888b123da42b19f09d96608fc3b0e/filegdb?layers=0"
				},
				{
					"@type": "dcat:Distribution",
					"title": "Feature Collection",
					"format": "TXT",
					"mediaType": "text/plain",
					"accessURL": "https://www.pacificgeoportal.com/api/download/v1/items/dc1888b123da42b19f09d96608fc3b0e/featureCollection?layers=0"
				},
				{
					"@type": "dcat:Distribution",
					"title": "Excel",
					"format": "XLSX",
					"mediaType": "application/vnd.ms-excel",
					"accessURL": "https://www.pacificgeoportal.com/api/download/v1/items/dc1888b123da42b19f09d96608fc3b0e/excel?layers=0"
				},
				{
					"@type": "dcat:Distribution",
					"title": "GeoPackage",
					"format": "GPKG",
					"mediaType": "application/geopackage+sqlite3",
					"accessURL": "https://www.pacificgeoportal.com/api/download/v1/items/dc1888b123da42b19f09d96608fc3b0e/geoPackage?layers=0"
				},
				{
					"@type": "dcat:Distribution",
					"title": "SQLite Geodatabase",
					"format": "GDB",
					"mediaType": "application/geopackage+sqlite3",
					"accessURL": "https://www.pacificgeoportal.com/api/download/v1/items/dc1888b123da42b19f09d96608fc3b0e/sqlite?layers=0"
				}
			],
			"theme": [
				"geospatial"
			]
		},
		{
			"@type": "dcat:Dataset",
			"identifier": "https://www.arcgis.com/home/item.html?id=030d32f649c94ab8959215951c03fbca&sublayer=0",
			"landingPage": "https://www.pacificgeoportal.com/datasets/eaglegis::nz-wards-current",
			"title": "NZ Wards - Current",
			"description": "<p><span style='font-size:medium;'><font style='font-family:&quot;Avenir Next W01&quot;, &quot;Avenir Next W00&quot;, &quot;Avenir Next&quot;, Avenir, &quot;Helvetica Neue&quot;, Helvetica, Arial, sans-serif !important;'>Topicality:&nbsp;01-01-2026</font></span></p><div><p><span style='font-family:Avenir Next W01, Avenir Next W00, Avenir Next, Avenir, Helvetica Neue, Helvetica, Arial, sans-serif; font-size:17px;'><font style='font-family:&quot;Avenir Next W01&quot;, &quot;Avenir Next W00&quot;, &quot;Avenir Next&quot;, Avenir, &quot;Helvetica Neue&quot;, Helvetica, Arial, sans-serif !important; font-size:17px;'>Projection: New Zealand Transverse Mercator (NZTM)</font></span></p><div style='font-family:&quot;Avenir Next W01&quot;, &quot;Avenir Next W00&quot;, &quot;Avenir Next&quot;, Avenir, &quot;Helvetica Neue&quot;, Helvetica, Arial, sans-serif !important; font-size:17px;'><span style='font-family:Avenir Next W01, Avenir Next W00, Avenir Next, Avenir, Helvetica Neue, Helvetica, Arial, sans-serif; font-size:medium;'>This layer </span><span style='font-family:&quot;Avenir Next W01&quot;, &quot;Avenir Next W00&quot;, &quot;Avenir Next&quot;, Avenir, &quot;Helvetica Neue&quot;, Helvetica, Arial, sans-serif; font-size:medium;'>contains the latest set </span><span style='font-size:medium;'>of&nbsp;</span><span style='font-family:&quot;Avenir Next W01&quot;, &quot;Avenir Next W00&quot;, &quot;Avenir Next&quot;, Avenir, &quot;Helvetica Neue&quot;, sans-serif; font-size:medium;'>Ward boundaries</span><span style='font-size:medium;'> as defined by the regional councils and Local Government Commission but maintained by Stats NZ (the custodian).</span></div><div style='font-family:&quot;Avenir Next W01&quot;, &quot;Avenir Next W00&quot;, &quot;Avenir Next&quot;, Avenir, &quot;Helvetica Neue&quot;, Helvetica, Arial, sans-serif !important; font-size:17px;'>&nbsp;</div><div><span style='font-family:Avenir Next W01, Avenir Next W00, Avenir Next, Avenir, Helvetica Neue, Helvetica, Arial, sans-serif; font-size:medium;'>Wards were originally set up within any territorial authority with a population of at least 20,000. Wards are defined under the Local Electoral Act 2001 and result from dividing a territorial authority for electoral purposes. The ward system was designed to allow for the recognition of communities within a territorial authority and to increase community involvement in the local government system.</span><br />&nbsp;</div><div><span style='font-family:Avenir Next W01, Avenir Next W00, Avenir Next, Avenir, Helvetica Neue, Helvetica, Arial, sans-serif; font-size:medium;'>Territorial authorities can now choose whether they would like to maintain electoral wards. As a result, the number of wards has steadily decreased since they were first created in 1989. Ward boundaries are reviewed in the year before the three-yearly local government elections.</span></div><ul><li><span style='font-family:Avenir Next W01, Avenir Next W00, Avenir Next, Avenir, Helvetica Neue, Helvetica, Arial, sans-serif; font-size:medium;'>This layer gets updated yearly with the latest boundary data.</span></li><li><span style='font-family:Avenir Next W01, Avenir Next W00, Avenir Next, Avenir, Helvetica Neue, Helvetica, Arial, sans-serif; font-size:medium;'><font style='font-family:&quot;Avenir Next W01&quot;, &quot;Avenir Next W00&quot;, &quot;Avenir Next&quot;, Avenir, &quot;Helvetica Neue&quot;, Helvetica, Arial, sans-serif;'>A layer with the full archive of the data for all the available years is available </font></span><a target='_blank' href='https://www.arcgis.com/home/item.html?id=31b3469be5c4445c93f11e7ec02d78a6' rel='nofollow ugc noopener noreferrer'>here.</a></li><li><span style='font-family:Avenir Next W01, Avenir Next W00, Avenir Next, Avenir, Helvetica Neue, Helvetica, Arial, sans-serif; font-size:medium;'>For information about the fields in this dataset go to the Data tab.</span></li></ul><div><span style='font-family:Avenir Next W01, Avenir Next W00, Avenir Next, Avenir, Helvetica Neue, Helvetica, Arial, sans-serif; font-size:medium;'>The layer is further generalised by Eagle Technology for improved performance on the web,&nbsp;</span><span style='font-family:&quot;Avenir Next W01&quot;, &quot;Avenir Next W00&quot;, &quot;Avenir Next&quot;, Avenir, &quot;Helvetica Neue&quot;, sans-serif; font-size:medium;'>therefore it doesn't fully represent the official boundaries.</span></div><div>&nbsp;</div><div><span style='font-family:Avenir Next W01, Avenir Next W00, Avenir Next, Avenir, Helvetica Neue, Helvetica, Arial, sans-serif; font-size:medium;'><font style='font-family:&quot;Avenir Next W01&quot;, &quot;Avenir Next W00&quot;, &quot;Avenir Next&quot;, Avenir, &quot;Helvetica Neue&quot;, Helvetica, Arial, sans-serif;'>The official dataset can be found on </font></span><a target='_blank' href='https://datafinder.stats.govt.nz/data/category/annual-boundaries/' rel='nofollow ugc noopener noreferrer'><span style='font-family:Avenir Next W01, Avenir Next W00, Avenir Next, Avenir, Helvetica Neue, Helvetica, Arial, sans-serif; font-size:medium;'>https://datafinder.stats.govt.nz.</span></a></div><div><div style='font-family:&quot;Avenir Next W01&quot;, &quot;Avenir Next W00&quot;, &quot;Avenir Next&quot;, Avenir, &quot;Helvetica Neue&quot;, Helvetica, Arial, sans-serif; font-size:17px;'>&nbsp;</div><div style='font-family:&quot;Avenir Next W01&quot;, &quot;Avenir Next W00&quot;, &quot;Avenir Next&quot;, Avenir, &quot;Helvetica Neue&quot;, Helvetica, Arial, sans-serif; font-size:17px;'><div><span style='color:#2f4f4f; font-size:medium;'>This layer is offered by Eagle Technology (Official Esri Distributor). Eagle Technology offers services that can be used in the ArcGIS platform. The Content team at Eagle Technology updates the layers on a regular basis and regularly adds new content to the Living Atlas. By using this content and combining it with other data you can create new information products quickly and easily.</span></div><div>&nbsp;</div><div><span style='color:#2f4f4f; font-size:medium;'>If you have any questions or comments about the content, please let us now&nbsp; at&nbsp;</span><a style='color:rgb(0, 121, 193); text-decoration-line:none;' href='mailto:livingatlas@eagle.co.nz' target='_blank' rel='nofollow ugc noopener noreferrer'><span style='font-size:medium;'>livingatlas@eagle.co.nz</span></a></div></div></div></div>",
			"keyword": [
				"Boundaries",
				"Boundary",
				"New zealand",
				"Statistics new zealand",
				"Statsnz",
				"Eagle technology",
				"Kiwi",
				"Statnz",
				"Election",
				"Elections",
				"Ward",
				"Wards",
				"eaglegis"
			],
			"issued": "2021-02-04T00:57:58.000Z",
			"modified": "2025-12-19T00:24:54.506Z",
			"publisher": {
				"name": "Eagle Technology Group Ltd"
			},
			"contactPoint": {
				"@type": "vcard:Contact",
				"fn": "eaglegis",
				"hasEmail": "mailto:ts@eaglegis.co.nz"
			},
			"accessLevel": "public",
			"spatial": "166.2620,-47.2230,-177.6374,-33.6045",
			"license": "https://creativecommons.org/licenses/by/4.0",
			"distribution": [
				{
					"@type": "dcat:Distribution",
					"title": "ArcGIS Hub Dataset",
					"format": "Web Page",
					"mediaType": "text/html",
					"accessURL": "https://www.pacificgeoportal.com/datasets/eaglegis::nz-wards-current"
				},
				{
					"@type": "dcat:Distribution",
					"title": "ArcGIS GeoService",
					"format": "ArcGIS GeoServices REST API",
					"mediaType": "application/json",
					"accessURL": "https://services.arcgis.com/XTtANUDT8Va4DLwI/arcgis/rest/services/nz_wards/FeatureServer/0"
				},
				{
					"@type": "dcat:Distribution",
					"title": "CSV",
					"format": "CSV",
					"mediaType": "text/csv",
					"accessURL": "https://www.pacificgeoportal.com/api/download/v1/items/030d32f649c94ab8959215951c03fbca/csv?layers=0"
				},
				{
					"@type": "dcat:Distribution",
					"title": "Shapefile",
					"format": "ZIP",
					"mediaType": "application/zip",
					"accessURL": "https://www.pacificgeoportal.com/api/download/v1/items/030d32f649c94ab8959215951c03fbca/shapefile?layers=0"
				},
				{
					"@type": "dcat:Distribution",
					"title": "GeoJSON",
					"format": "GeoJSON",
					"mediaType": "application/vnd.geo+json",
					"accessURL": "https://www.pacificgeoportal.com/api/download/v1/items/030d32f649c94ab8959215951c03fbca/geojson?layers=0"
				},
				{
					"@type": "dcat:Distribution",
					"title": "KML",
					"format": "KML",
					"mediaType": "application/vnd.google-earth.kml+xml",
					"accessURL": "https://www.pacificgeoportal.com/api/download/v1/items/030d32f649c94ab8959215951c03fbca/kml?layers=0"
				},
				{
					"@type": "dcat:Distribution",
					"title": "File Geodatabase",
					"format": "ZIP",
					"mediaType": "application/zip",
					"accessURL": "https://www.pacificgeoportal.com/api/download/v1/items/030d32f649c94ab8959215951c03fbca/filegdb?layers=0"
				},
				{
					"@type": "dcat:Distribution",
					"title": "Feature Collection",
					"format": "TXT",
					"mediaType": "text/plain",
					"accessURL": "https://www.pacificgeoportal.com/api/download/v1/items/030d32f649c94ab8959215951c03fbca/featureCollection?layers=0"
				},
				{
					"@type": "dcat:Distribution",
					"title": "Excel",
					"format": "XLSX",
					"mediaType": "application/vnd.ms-excel",
					"accessURL": "https://www.pacificgeoportal.com/api/download/v1/items/030d32f649c94ab8959215951c03fbca/excel?layers=0"
				},
				{
					"@type": "dcat:Distribution",
					"title": "GeoPackage",
					"format": "GPKG",
					"mediaType": "application/geopackage+sqlite3",
					"accessURL": "https://www.pacificgeoportal.com/api/download/v1/items/030d32f649c94ab8959215951c03fbca/geoPackage?layers=0"
				},
				{
					"@type": "dcat:Distribution",
					"title": "SQLite Geodatabase",
					"format": "GDB",
					"mediaType": "application/geopackage+sqlite3",
					"accessURL": "https://www.pacificgeoportal.com/api/download/v1/items/030d32f649c94ab8959215951c03fbca/sqlite?layers=0"
				}
			],
			"theme": [
				"geospatial"
			]
		},
		{
			"@type": "dcat:Dataset",
			"identifier": "https://www.arcgis.com/home/item.html?id=2755ebaa5e1d462da7265a7c268e222b&sublayer=0",
			"landingPage": "https://www.pacificgeoportal.com/datasets/eaglegis::nz-statistical-areas-3-current",
			"title": "NZ Statistical Areas 3 - Current",
			"description": "<div style='font-family:&quot;Avenir Next W01&quot;, &quot;Avenir Next W00&quot;, &quot;Avenir Next&quot;, Avenir, &quot;Helvetica Neue&quot;, Helvetica, Arial, sans-serif !important; font-size:17px;'><span style='font-size:medium;'>Topicality: 01-01-2026</span></div><div style='font-family:&quot;Avenir Next W01&quot;, &quot;Avenir Next W00&quot;, &quot;Avenir Next&quot;, Avenir, &quot;Helvetica Neue&quot;, Helvetica, Arial, sans-serif !important; font-size:17px;'><div><span style='font-size:medium;'>Projection: New Zealand Transverse Mercator (NZTM)</span><br />&nbsp;</div></div><div style='font-family:&quot;Avenir Next W01&quot;, &quot;Avenir Next W00&quot;, &quot;Avenir Next&quot;, Avenir, &quot;Helvetica Neue&quot;, Helvetica, Arial, sans-serif !important; font-size:17px;'><div style='font-family:&quot;Avenir Next W01&quot;, &quot;Avenir Next W00&quot;, &quot;Avenir Next&quot;, Avenir, &quot;Helvetica Neue&quot;, Helvetica, Arial, sans-serif !important; font-size:17px;'><span style='font-family:&quot;Avenir Next W01&quot;, &quot;Avenir Next W00&quot;, &quot;Avenir Next&quot;, Avenir, &quot;Helvetica Neue&quot;, sans-serif; font-size:medium;'><font style='font-family:&quot;Avenir Next W01&quot;, &quot;Avenir Next W00&quot;, &quot;Avenir Next&quot;, Avenir, &quot;Helvetica Neue&quot;, Helvetica, Arial, sans-serif !important;'>This layer contains the latest set of statistical area 3 (SA3) boundaries maintained by Stats NZ and as defined by Stats NZ.</font>&nbsp;</span><br />&nbsp;</div><div style='font-family:&quot;Avenir Next W01&quot;, &quot;Avenir Next W00&quot;, &quot;Avenir Next&quot;, Avenir, &quot;Helvetica Neue&quot;, Helvetica, Arial, sans-serif !important; font-size:17px;'><span style='font-size:medium;'>Statistical area 3 (SA3) is a new output geography, introduced in 2023 that allows aggregations of population data between the SA2 and territorial authority geography.</span></div></div><div style='font-family:&quot;Avenir Next W01&quot;, &quot;Avenir Next W00&quot;, &quot;Avenir Next&quot;, Avenir, &quot;Helvetica Neue&quot;, Helvetica, Arial, sans-serif !important; font-size:17px;'>&nbsp;</div><div style='font-family:&quot;Avenir Next W01&quot;, &quot;Avenir Next W00&quot;, &quot;Avenir Next&quot;, Avenir, &quot;Helvetica Neue&quot;, Helvetica, Arial, sans-serif !important; font-size:17px;'><p><span style='font-size:medium;'>The SA3 geography aims to meet three purposes:</span></p><ol><li><span style='font-size:medium;'>approximate suburbs in major, large, and medium urban areas,</span></li><li><span style='font-size:medium;'>in predominantly rural areas, provide geographical areas that are larger in area and population size than SA2s but smaller than territorial authorities,</span></li><li><span style='font-size:medium;'>minimise data suppression.</span></li></ol><div><span style='font-size:medium;'><font style='font-family:Avenir Next W01, Avenir Next W00, Avenir Next, Avenir, Helvetica Neue, Helvetica, Arial, sans-serif;'><strong>About the layer</strong></font></span></div></div><div><ul><li><span style='font-family:Avenir Next W01, Avenir Next W00, Avenir Next, Avenir, Helvetica Neue, Helvetica, Arial, sans-serif; font-size:medium;'>This layer gets updated yearly with the latest boundary data.</span></li><li><span style='font-family:Avenir Next W01, Avenir Next W00, Avenir Next, Avenir, Helvetica Neue, Helvetica, Arial, sans-serif; font-size:medium;'><font style='font-family:&quot;Avenir Next W01&quot;, &quot;Avenir Next W00&quot;, &quot;Avenir Next&quot;, Avenir, &quot;Helvetica Neue&quot;, Helvetica, Arial, sans-serif;'>A layer with the full archive of the data for all the available years is available </font></span><a target='_blank' href='https://www.arcgis.com/home/item.html?id=145414c973944521ab244f2ba54420c8' rel='nofollow ugc noopener noreferrer'><span style='font-family:Avenir Next W01, Avenir Next W00, Avenir Next, Avenir, Helvetica Neue, Helvetica, Arial, sans-serif; font-size:medium;'>here.</span></a></li><li><span style='font-family:Avenir Next W01, Avenir Next W00, Avenir Next, Avenir, Helvetica Neue, Helvetica, Arial, sans-serif; font-size:medium;'>For information about the fields in this dataset go to the Data tab.</span></li></ul></div><div><span style='font-family:Avenir Next W01, Avenir Next W00, Avenir Next, Avenir, Helvetica Neue, Helvetica, Arial, sans-serif; font-size:medium;'>The layer is further generalised by Eagle Technology for improved performance on the web,&nbsp;</span><span style='font-family:&quot;Avenir Next W01&quot;, &quot;Avenir Next W00&quot;, &quot;Avenir Next&quot;, Avenir, &quot;Helvetica Neue&quot;, sans-serif; font-size:medium;'>therefore it doesn't fully represent the official boundaries.</span></div><div>&nbsp;</div><div><span style='font-family:Avenir Next W01, Avenir Next W00, Avenir Next, Avenir, Helvetica Neue, Helvetica, Arial, sans-serif; font-size:medium;'><font style='font-family:&quot;Avenir Next W01&quot;, &quot;Avenir Next W00&quot;, &quot;Avenir Next&quot;, Avenir, &quot;Helvetica Neue&quot;, Helvetica, Arial, sans-serif;'>The official dataset can be found on </font></span><a target='_blank' href='https://datafinder.stats.govt.nz/data/category/annual-boundaries/' rel='nofollow ugc noopener noreferrer'><span style='font-family:Avenir Next W01, Avenir Next W00, Avenir Next, Avenir, Helvetica Neue, Helvetica, Arial, sans-serif; font-size:medium;'>https://datafinder.stats.govt.nz.</span></a></div><div style='font-family:&quot;Avenir Next W01&quot;, &quot;Avenir Next W00&quot;, &quot;Avenir Next&quot;, Avenir, &quot;Helvetica Neue&quot;, Helvetica, Arial, sans-serif !important; font-size:17px;'>&nbsp;</div><div style='font-family:&quot;Avenir Next W01&quot;, &quot;Avenir Next W00&quot;, &quot;Avenir Next&quot;, Avenir, &quot;Helvetica Neue&quot;, Helvetica, Arial, sans-serif !important; font-size:17px;'><div><span style='color:#2f4f4f; font-size:medium;'>This layer is offered by Eagle Technology (Official Esri Distributor). Eagle Technology offers services that can be used in the ArcGIS platform. The Content team at Eagle Technology updates the layers on a regular basis and regularly adds new content to the Living Atlas. By using this content and combining it with other data you can create new information products quickly and easily.</span></div><div>&nbsp;</div><div><span style='color:#2f4f4f; font-size:medium;'>If you have any questions or comments about the content, please let us now&nbsp; at&nbsp;</span><a style='color:rgb(0, 121, 193); text-decoration-line:none;' href='mailto:livingatlas@eagle.co.nz' target='_blank' rel='nofollow ugc noopener noreferrer'><span style='font-size:medium;'>livingatlas@eagle.co.nz</span></a><span style='font-size:medium;'>.</span></div></div>",
			"keyword": [
				"Boundary",
				"Boundaries",
				"New zealand",
				"Statistics New Zealand",
				"StatsNZ",
				"Eagle technology",
				"Nz",
				"Content",
				"Kiwi",
				"eaglegis"
			],
			"issued": "2023-04-05T10:03:22.000Z",
			"modified": "2025-12-19T00:26:34.025Z",
			"publisher": {
				"name": "Eagle Technology Group Ltd"
			},
			"contactPoint": {
				"@type": "vcard:Contact",
				"fn": "eaglegis",
				"hasEmail": "mailto:ts@eaglegis.co.nz"
			},
			"accessLevel": "public",
			"spatial": "166.2620,-47.2230,-177.6189,-33.7734",
			"license": "https://creativecommons.org/licenses/by/4.0",
			"distribution": [
				{
					"@type": "dcat:Distribution",
					"title": "ArcGIS Hub Dataset",
					"format": "Web Page",
					"mediaType": "text/html",
					"accessURL": "https://www.pacificgeoportal.com/datasets/eaglegis::nz-statistical-areas-3-current"
				},
				{
					"@type": "dcat:Distribution",
					"title": "ArcGIS GeoService",
					"format": "ArcGIS GeoServices REST API",
					"mediaType": "application/json",
					"accessURL": "https://services.arcgis.com/XTtANUDT8Va4DLwI/arcgis/rest/services/NZ_Statistical_Areas_3_-_Archive_-_Main_-_Not_Public_view/FeatureServer/0"
				},
				{
					"@type": "dcat:Distribution",
					"title": "CSV",
					"format": "CSV",
					"mediaType": "text/csv",
					"accessURL": "https://www.pacificgeoportal.com/api/download/v1/items/2755ebaa5e1d462da7265a7c268e222b/csv?layers=0"
				},
				{
					"@type": "dcat:Distribution",
					"title": "Shapefile",
					"format": "ZIP",
					"mediaType": "application/zip",
					"accessURL": "https://www.pacificgeoportal.com/api/download/v1/items/2755ebaa5e1d462da7265a7c268e222b/shapefile?layers=0"
				},
				{
					"@type": "dcat:Distribution",
					"title": "GeoJSON",
					"format": "GeoJSON",
					"mediaType": "application/vnd.geo+json",
					"accessURL": "https://www.pacificgeoportal.com/api/download/v1/items/2755ebaa5e1d462da7265a7c268e222b/geojson?layers=0"
				},
				{
					"@type": "dcat:Distribution",
					"title": "KML",
					"format": "KML",
					"mediaType": "application/vnd.google-earth.kml+xml",
					"accessURL": "https://www.pacificgeoportal.com/api/download/v1/items/2755ebaa5e1d462da7265a7c268e222b/kml?layers=0"
				}
			],
			"theme": [
				"geospatial"
			]
		},
		{
			"@type": "dcat:Dataset",
			"identifier": "https://www.arcgis.com/home/item.html?id=6b4508cfd8c4445fb5074aacd13eb4b8&sublayer=0",
			"landingPage": "https://www.pacificgeoportal.com/datasets/eaglegis::nz-statistical-areas-2-current",
			"title": "NZ Statistical Areas 2 - Current",
			"description": "<div style='font-family:&quot;Avenir Next W01&quot;, &quot;Avenir Next W00&quot;, &quot;Avenir Next&quot;, Avenir, &quot;Helvetica Neue&quot;, Helvetica, Arial, sans-serif !important; font-size:17px;'><span style='font-size:medium;'>Topicality: 01-01-2026</span></div><div style='font-family:&quot;Avenir Next W01&quot;, &quot;Avenir Next W00&quot;, &quot;Avenir Next&quot;, Avenir, &quot;Helvetica Neue&quot;, Helvetica, Arial, sans-serif !important; font-size:17px;'><div><span style='font-size:medium;'>Projection: New Zealand Transverse Mercator (NZTM)</span><br />&nbsp;</div></div><div style='font-family:&quot;Avenir Next W01&quot;, &quot;Avenir Next W00&quot;, &quot;Avenir Next&quot;, Avenir, &quot;Helvetica Neue&quot;, Helvetica, Arial, sans-serif !important; font-size:17px;'><span style='font-size:medium;'>This layer contains the latest set of statistical area 2 (SA2) boundaries maintained by Stats NZ and as defined by Stats NZ.</span><br />&nbsp;</div><div style='font-family:&quot;Avenir Next W01&quot;, &quot;Avenir Next W00&quot;, &quot;Avenir Next&quot;, Avenir, &quot;Helvetica Neue&quot;, Helvetica, Arial, sans-serif !important; font-size:17px;'><span style='font-size:medium;'>Statistical area 2 (SA2) is a new output geography that provides higher aggregations of population data than can be provided at the&nbsp;</span><a target='_blank' href='https://datafinder.stats.govt.nz/data/category/annual-boundaries/2022/' rel='nofollow ugc noopener noreferrer'><span style='font-size:medium;'>statistical area 1 (SA1)</span></a><span style='font-size:medium;'>&nbsp;level. The SA2 geography aims to reflect communities that interact together socially and economically. In populated areas, SA2s generally contain similar sized populations.</span><br />&nbsp;</div><p><span style='font-family:&quot;Avenir Next W01&quot;, &quot;Avenir Next W00&quot;, &quot;Avenir Next&quot;, Avenir, &quot;Helvetica Neue&quot;, sans-serif; font-size:medium;'><font style='font-family:&quot;Avenir Next W01&quot;, &quot;Avenir Next W00&quot;, &quot;Avenir Next&quot;, Avenir, &quot;Helvetica Neue&quot;, Helvetica, Arial, sans-serif !important;'>This layer contains the definitive set of statistical area 2 (SA2) boundaries for 2021 as defined by Stats NZ.&nbsp;</font></span><span style='font-family:&quot;Avenir Next W01&quot;, &quot;Avenir Next W00&quot;, &quot;Avenir Next&quot;, Avenir, &quot;Helvetica Neue&quot;, Helvetica, Arial, sans-serif; font-size:17px;'>Statistical area 2 (SA2) is a new output geography that provides higher aggregations of population data than can be provided at the statistical area 1 (SA1) level. The SA2 geography aims to reflect communities that interact together socially and economically. In populated areas, SA2s generally contain similar sized populations.</span></p><ul><li><span style='font-family:Avenir Next W01, Avenir Next W00, Avenir Next, Avenir, Helvetica Neue, Helvetica, Arial, sans-serif; font-size:medium;'>This layer gets updated yearly with the latest boundary data.</span></li><li><span style='font-family:Avenir Next W01, Avenir Next W00, Avenir Next, Avenir, Helvetica Neue, Helvetica, Arial, sans-serif; font-size:medium;'><font style='font-family:&quot;Avenir Next W01&quot;, &quot;Avenir Next W00&quot;, &quot;Avenir Next&quot;, Avenir, &quot;Helvetica Neue&quot;, Helvetica, Arial, sans-serif;'>A layer with the full archive of the data for all the available years is available </font></span><a target='_blank' href='https://www.arcgis.com/home/item.html?id=a3422b4ed51645919308d5f595770eff' rel='nofollow ugc noopener noreferrer'>here.</a></li><li><span style='font-family:Avenir Next W01, Avenir Next W00, Avenir Next, Avenir, Helvetica Neue, Helvetica, Arial, sans-serif; font-size:medium;'>For information about the fields in this dataset go to the Data tab.</span></li></ul><div><span style='font-family:Avenir Next W01, Avenir Next W00, Avenir Next, Avenir, Helvetica Neue, Helvetica, Arial, sans-serif; font-size:medium;'>The layer is further generalised by Eagle Technology for improved performance on the web,&nbsp;</span><span style='font-family:&quot;Avenir Next W01&quot;, &quot;Avenir Next W00&quot;, &quot;Avenir Next&quot;, Avenir, &quot;Helvetica Neue&quot;, sans-serif; font-size:medium;'>therefore it doesn't fully represent the official boundaries.</span></div><div>&nbsp;</div><div><span style='font-family:Avenir Next W01, Avenir Next W00, Avenir Next, Avenir, Helvetica Neue, Helvetica, Arial, sans-serif; font-size:medium;'><font style='font-family:&quot;Avenir Next W01&quot;, &quot;Avenir Next W00&quot;, &quot;Avenir Next&quot;, Avenir, &quot;Helvetica Neue&quot;, Helvetica, Arial, sans-serif;'>The official dataset can be found on </font></span><a target='_blank' href='https://datafinder.stats.govt.nz/data/category/annual-boundaries/' rel='nofollow ugc noopener noreferrer'><span style='font-family:Avenir Next W01, Avenir Next W00, Avenir Next, Avenir, Helvetica Neue, Helvetica, Arial, sans-serif; font-size:medium;'>https://datafinder.stats.govt.nz.</span></a></div><div style='font-family:&quot;Avenir Next W01&quot;, &quot;Avenir Next W00&quot;, &quot;Avenir Next&quot;, Avenir, &quot;Helvetica Neue&quot;, Helvetica, Arial, sans-serif !important; font-size:17px;'>&nbsp;</div><div style='font-family:&quot;Avenir Next W01&quot;, &quot;Avenir Next W00&quot;, &quot;Avenir Next&quot;, Avenir, &quot;Helvetica Neue&quot;, Helvetica, Arial, sans-serif !important; font-size:17px;'><div><span style='color:#2f4f4f; font-size:medium;'>This layer is offered by Eagle Technology (Official Esri Distributor). Eagle Technology offers services that can be used in the ArcGIS platform. The Content team at Eagle Technology updates the layers on a regular basis and regularly adds new content to the Living Atlas. By using this content and combining it with other data you can create new information products quickly and easily.</span></div><div>&nbsp;</div><div><span style='color:#2f4f4f; font-size:medium;'>If you have any questions or comments about the content, please let us now&nbsp; at&nbsp;</span><a style='color:rgb(0, 121, 193); text-decoration-line:none;' href='mailto:livingatlas@eagle.co.nz' target='_blank' rel='nofollow ugc noopener noreferrer'><span style='font-size:medium;'>livingatlas@eagle.co.nz</span></a><span style='font-size:medium;'>.</span></div></div>",
			"keyword": [
				"Boundary",
				"Boundaries",
				"New zealand",
				"Statistics New Zealand",
				"StatsNZ",
				"Eagle technology",
				"Nz",
				"Content",
				"Kiwi",
				"eaglegis"
			],
			"issued": "2021-02-04T01:08:05.000Z",
			"modified": "2025-12-19T00:26:13.026Z",
			"publisher": {
				"name": "Eagle Technology Group Ltd"
			},
			"contactPoint": {
				"@type": "vcard:Contact",
				"fn": "eaglegis",
				"hasEmail": "mailto:ts@eaglegis.co.nz"
			},
			"accessLevel": "public",
			"spatial": "166.2620,-47.2230,-177.6189,-33.7734",
			"license": "https://creativecommons.org/licenses/by/4.0",
			"distribution": [
				{
					"@type": "dcat:Distribution",
					"title": "ArcGIS Hub Dataset",
					"format": "Web Page",
					"mediaType": "text/html",
					"accessURL": "https://www.pacificgeoportal.com/datasets/eaglegis::nz-statistical-areas-2-current"
				},
				{
					"@type": "dcat:Distribution",
					"title": "ArcGIS GeoService",
					"format": "ArcGIS GeoServices REST API",
					"mediaType": "application/json",
					"accessURL": "https://services.arcgis.com/XTtANUDT8Va4DLwI/arcgis/rest/services/nz_statistical_areas_2/FeatureServer/0"
				},
				{
					"@type": "dcat:Distribution",
					"title": "CSV",
					"format": "CSV",
					"mediaType": "text/csv",
					"accessURL": "https://www.pacificgeoportal.com/api/download/v1/items/6b4508cfd8c4445fb5074aacd13eb4b8/csv?layers=0"
				},
				{
					"@type": "dcat:Distribution",
					"title": "Shapefile",
					"format": "ZIP",
					"mediaType": "application/zip",
					"accessURL": "https://www.pacificgeoportal.com/api/download/v1/items/6b4508cfd8c4445fb5074aacd13eb4b8/shapefile?layers=0"
				},
				{
					"@type": "dcat:Distribution",
					"title": "GeoJSON",
					"format": "GeoJSON",
					"mediaType": "application/vnd.geo+json",
					"accessURL": "https://www.pacificgeoportal.com/api/download/v1/items/6b4508cfd8c4445fb5074aacd13eb4b8/geojson?layers=0"
				},
				{
					"@type": "dcat:Distribution",
					"title": "KML",
					"format": "KML",
					"mediaType": "application/vnd.google-earth.kml+xml",
					"accessURL": "https://www.pacificgeoportal.com/api/download/v1/items/6b4508cfd8c4445fb5074aacd13eb4b8/kml?layers=0"
				},
				{
					"@type": "dcat:Distribution",
					"title": "File Geodatabase",
					"format": "ZIP",
					"mediaType": "application/zip",
					"accessURL": "https://www.pacificgeoportal.com/api/download/v1/items/6b4508cfd8c4445fb5074aacd13eb4b8/filegdb?layers=0"
				},
				{
					"@type": "dcat:Distribution",
					"title": "Feature Collection",
					"format": "TXT",
					"mediaType": "text/plain",
					"accessURL": "https://www.pacificgeoportal.com/api/download/v1/items/6b4508cfd8c4445fb5074aacd13eb4b8/featureCollection?layers=0"
				},
				{
					"@type": "dcat:Distribution",
					"title": "Excel",
					"format": "XLSX",
					"mediaType": "application/vnd.ms-excel",
					"accessURL": "https://www.pacificgeoportal.com/api/download/v1/items/6b4508cfd8c4445fb5074aacd13eb4b8/excel?layers=0"
				},
				{
					"@type": "dcat:Distribution",
					"title": "GeoPackage",
					"format": "GPKG",
					"mediaType": "application/geopackage+sqlite3",
					"accessURL": "https://www.pacificgeoportal.com/api/download/v1/items/6b4508cfd8c4445fb5074aacd13eb4b8/geoPackage?layers=0"
				},
				{
					"@type": "dcat:Distribution",
					"title": "SQLite Geodatabase",
					"format": "GDB",
					"mediaType": "application/geopackage+sqlite3",
					"accessURL": "https://www.pacificgeoportal.com/api/download/v1/items/6b4508cfd8c4445fb5074aacd13eb4b8/sqlite?layers=0"
				}
			],
			"theme": [
				"geospatial"
			]
		},
		{
			"@type": "dcat:Dataset",
			"identifier": "https://www.arcgis.com/home/item.html?id=e0adfbdcfc714ae2a00c1b78a459bd43&sublayer=0",
			"landingPage": "https://www.pacificgeoportal.com/datasets/eaglegis::nz-statistical-areas-1-current",
			"title": "NZ Statistical Areas 1 - Current",
			"description": "<div style='font-family:&quot;Avenir Next W01&quot;, &quot;Avenir Next W00&quot;, &quot;Avenir Next&quot;, Avenir, &quot;Helvetica Neue&quot;, Helvetica, Arial, sans-serif !important;'><span style='font-size:medium;'>Topicality: 01-01-2026</span></div><div style='font-family:&quot;Avenir Next W01&quot;, &quot;Avenir Next W00&quot;, &quot;Avenir Next&quot;, Avenir, &quot;Helvetica Neue&quot;, Helvetica, Arial, sans-serif !important;'><div style='font-size:17px;'><span style='font-size:medium;'>Projection: New Zealand Transverse Mercator (NZTM)</span><br />&nbsp;</div></div><div style='font-family:&quot;Avenir Next W01&quot;, &quot;Avenir Next W00&quot;, &quot;Avenir Next&quot;, Avenir, &quot;Helvetica Neue&quot;, Helvetica, Arial, sans-serif !important;'><span style='font-family:&quot;Avenir Next W01&quot;, &quot;Avenir Next W00&quot;, &quot;Avenir Next&quot;, Avenir, &quot;Helvetica Neue&quot;, sans-serif; font-size:medium;'><font style='font-family:&quot;Avenir Next W01&quot;, &quot;Avenir Next W00&quot;, &quot;Avenir Next&quot;, Avenir, &quot;Helvetica Neue&quot;, Helvetica, Arial, sans-serif !important;'>This layer contains the latest set of statistical area 1 (SA1) boundaries maintained by Stats NZ and as defined by Stats NZ.</font>&nbsp;</span><br />&nbsp;</div><p><span style='font-size:medium;'>Statistical area 1 (SA1) is a geography that allows the release of more detailed information about population characteristics than is available at the meshblock level. Built by joining meshblocks, SA1s have an ideal size range of 100–200 residents, and a maximum population of about 500. This is to minimise suppression of population data in multivariate statistics tables.</span></p><ul><li><span style='font-family:Avenir Next W01, Avenir Next W00, Avenir Next, Avenir, Helvetica Neue, Helvetica, Arial, sans-serif; font-size:medium;'>This layer gets updated yearly with the latest boundary data.</span></li><li><span style='font-family:Avenir Next W01, Avenir Next W00, Avenir Next, Avenir, Helvetica Neue, Helvetica, Arial, sans-serif; font-size:medium;'><font style='font-family:&quot;Avenir Next W01&quot;, &quot;Avenir Next W00&quot;, &quot;Avenir Next&quot;, Avenir, &quot;Helvetica Neue&quot;, Helvetica, Arial, sans-serif;'>A layer with the full archive of the data for all the available years is available </font></span><a target='_blank' href='https://www.arcgis.com/home/item.html?id=c4089e5978944a899679e68aed59ae4d' rel='nofollow ugc noopener noreferrer'>here.</a></li><li><span style='font-family:Avenir Next W01, Avenir Next W00, Avenir Next, Avenir, Helvetica Neue, Helvetica, Arial, sans-serif; font-size:medium;'>For information about the fields in this dataset go to the Data tab.</span></li></ul><div><span style='font-family:Avenir Next W01, Avenir Next W00, Avenir Next, Avenir, Helvetica Neue, Helvetica, Arial, sans-serif; font-size:medium;'>The layer is further generalised by Eagle Technology for improved performance on the web,&nbsp;</span><span style='font-family:&quot;Avenir Next W01&quot;, &quot;Avenir Next W00&quot;, &quot;Avenir Next&quot;, Avenir, &quot;Helvetica Neue&quot;, sans-serif; font-size:medium;'>therefore it doesn't fully represent the official boundaries.</span></div><div>&nbsp;</div><div><span style='font-family:Avenir Next W01, Avenir Next W00, Avenir Next, Avenir, Helvetica Neue, Helvetica, Arial, sans-serif; font-size:medium;'><font style='font-family:&quot;Avenir Next W01&quot;, &quot;Avenir Next W00&quot;, &quot;Avenir Next&quot;, Avenir, &quot;Helvetica Neue&quot;, Helvetica, Arial, sans-serif;'>The official dataset can be found on </font></span><a target='_blank' href='https://datafinder.stats.govt.nz/data/category/annual-boundaries/' rel='nofollow ugc noopener noreferrer'><span style='font-family:Avenir Next W01, Avenir Next W00, Avenir Next, Avenir, Helvetica Neue, Helvetica, Arial, sans-serif; font-size:medium;'>https://datafinder.stats.govt.nz.</span></a></div><div style='font-family:&quot;Avenir Next W01&quot;, &quot;Avenir Next W00&quot;, &quot;Avenir Next&quot;, Avenir, &quot;Helvetica Neue&quot;, Helvetica, Arial, sans-serif !important;'>&nbsp;</div><div style='font-family:&quot;Avenir Next W01&quot;, &quot;Avenir Next W00&quot;, &quot;Avenir Next&quot;, Avenir, &quot;Helvetica Neue&quot;, Helvetica, Arial, sans-serif !important;'><div><span style='color:#2f4f4f; font-size:medium;'>This layer is offered by Eagle Technology (Official Esri Distributor). Eagle Technology offers services that can be used in the ArcGIS platform. The Content team at Eagle Technology updates the layers on a regular basis and regularly adds new content to the Living Atlas. By using this content and combining it with other data you can create new information products quickly and easily.</span></div><div>&nbsp;</div><div><span style='color:#2f4f4f; font-size:medium;'>If you have any questions or comments about the content, please let us now&nbsp; at&nbsp;</span><a style='color:rgb(0, 121, 193); text-decoration-line:none;' href='mailto:livingatlas@eagle.co.nz' target='_blank' rel='nofollow ugc noopener noreferrer'><span style='font-size:medium;'>livingatlas@eagle.co.nz</span></a><span style='font-size:medium;'>.</span></div></div>",
			"keyword": [
				"Boundary",
				"Boundaries",
				"New zealand",
				"Statistics New Zealand",
				"StatsNZ",
				"Eagle technology",
				"Nz",
				"Content",
				"Kiwi",
				"eaglegis"
			],
			"issued": "2021-02-04T01:07:08.000Z",
			"modified": "2025-12-19T00:26:09.401Z",
			"publisher": {
				"name": "Eagle Technology Group Ltd"
			},
			"contactPoint": {
				"@type": "vcard:Contact",
				"fn": "eaglegis",
				"hasEmail": "mailto:ts@eaglegis.co.nz"
			},
			"accessLevel": "public",
			"spatial": "166.2620,-47.2230,-177.6190,-33.7734",
			"license": "https://creativecommons.org/licenses/by/4.0",
			"distribution": [
				{
					"@type": "dcat:Distribution",
					"title": "ArcGIS Hub Dataset",
					"format": "Web Page",
					"mediaType": "text/html",
					"accessURL": "https://www.pacificgeoportal.com/datasets/eaglegis::nz-statistical-areas-1-current"
				},
				{
					"@type": "dcat:Distribution",
					"title": "ArcGIS GeoService",
					"format": "ArcGIS GeoServices REST API",
					"mediaType": "application/json",
					"accessURL": "https://services.arcgis.com/XTtANUDT8Va4DLwI/arcgis/rest/services/nz_statistical_areas_1/FeatureServer/0"
				},
				{
					"@type": "dcat:Distribution",
					"title": "CSV",
					"format": "CSV",
					"mediaType": "text/csv",
					"accessURL": "https://www.pacificgeoportal.com/api/download/v1/items/e0adfbdcfc714ae2a00c1b78a459bd43/csv?layers=0"
				},
				{
					"@type": "dcat:Distribution",
					"title": "Shapefile",
					"format": "ZIP",
					"mediaType": "application/zip",
					"accessURL": "https://www.pacificgeoportal.com/api/download/v1/items/e0adfbdcfc714ae2a00c1b78a459bd43/shapefile?layers=0"
				},
				{
					"@type": "dcat:Distribution",
					"title": "GeoJSON",
					"format": "GeoJSON",
					"mediaType": "application/vnd.geo+json",
					"accessURL": "https://www.pacificgeoportal.com/api/download/v1/items/e0adfbdcfc714ae2a00c1b78a459bd43/geojson?layers=0"
				},
				{
					"@type": "dcat:Distribution",
					"title": "KML",
					"format": "KML",
					"mediaType": "application/vnd.google-earth.kml+xml",
					"accessURL": "https://www.pacificgeoportal.com/api/download/v1/items/e0adfbdcfc714ae2a00c1b78a459bd43/kml?layers=0"
				},
				{
					"@type": "dcat:Distribution",
					"title": "File Geodatabase",
					"format": "ZIP",
					"mediaType": "application/zip",
					"accessURL": "https://www.pacificgeoportal.com/api/download/v1/items/e0adfbdcfc714ae2a00c1b78a459bd43/filegdb?layers=0"
				},
				{
					"@type": "dcat:Distribution",
					"title": "Feature Collection",
					"format": "TXT",
					"mediaType": "text/plain",
					"accessURL": "https://www.pacificgeoportal.com/api/download/v1/items/e0adfbdcfc714ae2a00c1b78a459bd43/featureCollection?layers=0"
				},
				{
					"@type": "dcat:Distribution",
					"title": "Excel",
					"format": "XLSX",
					"mediaType": "application/vnd.ms-excel",
					"accessURL": "https://www.pacificgeoportal.com/api/download/v1/items/e0adfbdcfc714ae2a00c1b78a459bd43/excel?layers=0"
				},
				{
					"@type": "dcat:Distribution",
					"title": "GeoPackage",
					"format": "GPKG",
					"mediaType": "application/geopackage+sqlite3",
					"accessURL": "https://www.pacificgeoportal.com/api/download/v1/items/e0adfbdcfc714ae2a00c1b78a459bd43/geoPackage?layers=0"
				},
				{
					"@type": "dcat:Distribution",
					"title": "SQLite Geodatabase",
					"format": "GDB",
					"mediaType": "application/geopackage+sqlite3",
					"accessURL": "https://www.pacificgeoportal.com/api/download/v1/items/e0adfbdcfc714ae2a00c1b78a459bd43/sqlite?layers=0"
				}
			],
			"theme": [
				"geospatial"
			]
		},
		{
			"@type": "dcat:Dataset",
			"identifier": "https://www.arcgis.com/home/item.html?id=7fcb716dbf304397a8ee68e92d8fedae&sublayer=0",
			"landingPage": "https://www.pacificgeoportal.com/datasets/eaglegis::nz-meshblocks-current",
			"title": "NZ Meshblocks - Current",
			"description": "<div><span style='font-size:medium;'>Topicality: 01-01-2026</span></div><div><div style='font-family:&quot;Avenir Next W01&quot;, &quot;Avenir Next W00&quot;, &quot;Avenir Next&quot;, Avenir, &quot;Helvetica Neue&quot;, Helvetica, Arial, sans-serif !important; font-size:17px;'><span style='font-size:medium;'>Projection: New Zealand Transverse Mercator (NZTM)</span><br />&nbsp;</div></div><div><span style='font-size:medium;'><span>This layer contains the latest set of the meshblock boundaries maintained by Stats NZ as defined by Stats NZ.</span>&nbsp;</span><br />&nbsp;</div><div><span style='font-size:medium;'>Stats NZ maintains an annual meshblock pattern for collecting and producing statistical data. This allows data to be compared over time. A meshblock is the smallest geographic unit for which statistical data is collected and processed by Stats NZ. A meshblock is defined by a geographic area, which can vary in size from part of a city block to a large area of rural land.</span></div><div><ul><li><span style='font-family:Avenir Next W01, Avenir Next W00, Avenir Next, Avenir, Helvetica Neue, Helvetica, Arial, sans-serif; font-size:medium;'>For information about the fields in this dataset go to the Data tab.</span></li><li><span style='font-family:Avenir Next W01, Avenir Next W00, Avenir Next, Avenir, Helvetica Neue, Helvetica, Arial, sans-serif; font-size:medium;'><font style='font-family:&quot;Avenir Next W01&quot;, &quot;Avenir Next W00&quot;, &quot;Avenir Next&quot;, Avenir, &quot;Helvetica Neue&quot;, Helvetica, Arial, sans-serif;'>A layer with the full archive of the data for all the available years is available </font></span><a target='_blank' href='https://www.arcgis.com/home/item.html?id=d350fe4ba9364ae89c783eb5a9f0290f' rel='nofollow ugc noopener noreferrer'><span style='font-family:Avenir Next W01, Avenir Next W00, Avenir Next, Avenir, Helvetica Neue, Helvetica, Arial, sans-serif; font-size:medium;'>here.</span></a></li><li><span style='font-family:Avenir Next W01, Avenir Next W00, Avenir Next, Avenir, Helvetica Neue, Helvetica, Arial, sans-serif; font-size:medium;'>This layer get updated yearly with the latest boundary data.</span></li></ul></div><div><span style='font-family:Avenir Next W01, Avenir Next W00, Avenir Next, Avenir, Helvetica Neue, Helvetica, Arial, sans-serif; font-size:medium;'>The layer is further generalised by Eagle Technology for improved performance on the web,&nbsp;</span><span style='font-family:&quot;Avenir Next W01&quot;, &quot;Avenir Next W00&quot;, &quot;Avenir Next&quot;, Avenir, &quot;Helvetica Neue&quot;, sans-serif; font-size:medium;'>therefore it doesn't fully represent the official boundaries.</span></div><div>&nbsp;</div><div><span style='font-family:Avenir Next W01, Avenir Next W00, Avenir Next, Avenir, Helvetica Neue, Helvetica, Arial, sans-serif; font-size:medium;'><font style='font-family:&quot;Avenir Next W01&quot;, &quot;Avenir Next W00&quot;, &quot;Avenir Next&quot;, Avenir, &quot;Helvetica Neue&quot;, Helvetica, Arial, sans-serif;'>The official dataset can be found on </font></span><a target='_blank' href='https://datafinder.stats.govt.nz/data/category/annual-boundaries/' rel='nofollow ugc noopener noreferrer'><span style='font-family:Avenir Next W01, Avenir Next W00, Avenir Next, Avenir, Helvetica Neue, Helvetica, Arial, sans-serif; font-size:medium;'>https://datafinder.stats.govt.nz.</span></a></div><div>&nbsp;</div><div><div style='font-family:&quot;Avenir Next W01&quot;, &quot;Avenir Next W00&quot;, &quot;Avenir Next&quot;, Avenir, &quot;Helvetica Neue&quot;, Helvetica, Arial, sans-serif !important; font-size:17px;'><span style='color:#2f4f4f; font-size:medium;'>This layer is offered by Eagle Technology (Official Esri Distributor). Eagle Technology offers services that can be used in the ArcGIS platform. The Content team at Eagle Technology updates the layers on a regular basis and regularly adds new content to the Living Atlas. By using this content and combining it with other data you can create new information products quickly and easily.</span></div><div style='font-family:&quot;Avenir Next W01&quot;, &quot;Avenir Next W00&quot;, &quot;Avenir Next&quot;, Avenir, &quot;Helvetica Neue&quot;, Helvetica, Arial, sans-serif !important; font-size:17px;'>&nbsp;</div><div style='font-family:&quot;Avenir Next W01&quot;, &quot;Avenir Next W00&quot;, &quot;Avenir Next&quot;, Avenir, &quot;Helvetica Neue&quot;, Helvetica, Arial, sans-serif !important; font-size:17px;'><span style='color:#2f4f4f; font-size:medium;'>If you have any questions or comments about the content, please let us now&nbsp; at&nbsp;</span><a style='color:rgb(0, 121, 193); text-decoration-line:none;' href='mailto:livingatlas@eagle.co.nz' target='_blank' rel='nofollow ugc noopener noreferrer'><span style='font-size:medium;'>livingatlas@eagle.co.nz</span></a><span style='font-size:medium;'>.</span></div></div><div>&nbsp;</div>",
			"keyword": [
				"Boundary",
				"Boundaries",
				"New zealand",
				"Statistics New Zealand",
				"StatsNZ",
				"Eagle technology",
				"Nz",
				"Content",
				"Kiwi",
				"eaglegis"
			],
			"issued": "2021-02-04T01:04:44.000Z",
			"modified": "2025-12-19T00:26:00.865Z",
			"publisher": {
				"name": "Eagle Technology Group Ltd"
			},
			"contactPoint": {
				"@type": "vcard:Contact",
				"fn": "eaglegis",
				"hasEmail": "mailto:ts@eaglegis.co.nz"
			},
			"accessLevel": "public",
			"spatial": "166.2620,-47.2230,-177.6190,-33.7734",
			"license": "https://creativecommons.org/licenses/by/4.0",
			"distribution": [
				{
					"@type": "dcat:Distribution",
					"title": "ArcGIS Hub Dataset",
					"format": "Web Page",
					"mediaType": "text/html",
					"accessURL": "https://www.pacificgeoportal.com/datasets/eaglegis::nz-meshblocks-current"
				},
				{
					"@type": "dcat:Distribution",
					"title": "ArcGIS GeoService",
					"format": "ArcGIS GeoServices REST API",
					"mediaType": "application/json",
					"accessURL": "https://services.arcgis.com/XTtANUDT8Va4DLwI/arcgis/rest/services/nz_meshblocks/FeatureServer/0"
				},
				{
					"@type": "dcat:Distribution",
					"title": "CSV",
					"format": "CSV",
					"mediaType": "text/csv",
					"accessURL": "https://www.pacificgeoportal.com/api/download/v1/items/7fcb716dbf304397a8ee68e92d8fedae/csv?layers=0"
				},
				{
					"@type": "dcat:Distribution",
					"title": "Shapefile",
					"format": "ZIP",
					"mediaType": "application/zip",
					"accessURL": "https://www.pacificgeoportal.com/api/download/v1/items/7fcb716dbf304397a8ee68e92d8fedae/shapefile?layers=0"
				},
				{
					"@type": "dcat:Distribution",
					"title": "GeoJSON",
					"format": "GeoJSON",
					"mediaType": "application/vnd.geo+json",
					"accessURL": "https://www.pacificgeoportal.com/api/download/v1/items/7fcb716dbf304397a8ee68e92d8fedae/geojson?layers=0"
				},
				{
					"@type": "dcat:Distribution",
					"title": "KML",
					"format": "KML",
					"mediaType": "application/vnd.google-earth.kml+xml",
					"accessURL": "https://www.pacificgeoportal.com/api/download/v1/items/7fcb716dbf304397a8ee68e92d8fedae/kml?layers=0"
				},
				{
					"@type": "dcat:Distribution",
					"title": "File Geodatabase",
					"format": "ZIP",
					"mediaType": "application/zip",
					"accessURL": "https://www.pacificgeoportal.com/api/download/v1/items/7fcb716dbf304397a8ee68e92d8fedae/filegdb?layers=0"
				},
				{
					"@type": "dcat:Distribution",
					"title": "Feature Collection",
					"format": "TXT",
					"mediaType": "text/plain",
					"accessURL": "https://www.pacificgeoportal.com/api/download/v1/items/7fcb716dbf304397a8ee68e92d8fedae/featureCollection?layers=0"
				},
				{
					"@type": "dcat:Distribution",
					"title": "Excel",
					"format": "XLSX",
					"mediaType": "application/vnd.ms-excel",
					"accessURL": "https://www.pacificgeoportal.com/api/download/v1/items/7fcb716dbf304397a8ee68e92d8fedae/excel?layers=0"
				},
				{
					"@type": "dcat:Distribution",
					"title": "GeoPackage",
					"format": "GPKG",
					"mediaType": "application/geopackage+sqlite3",
					"accessURL": "https://www.pacificgeoportal.com/api/download/v1/items/7fcb716dbf304397a8ee68e92d8fedae/geoPackage?layers=0"
				},
				{
					"@type": "dcat:Distribution",
					"title": "SQLite Geodatabase",
					"format": "GDB",
					"mediaType": "application/geopackage+sqlite3",
					"accessURL": "https://www.pacificgeoportal.com/api/download/v1/items/7fcb716dbf304397a8ee68e92d8fedae/sqlite?layers=0"
				}
			],
			"theme": [
				"geospatial"
			]
		},
		{
			"@type": "dcat:Dataset",
			"identifier": "https://www.arcgis.com/home/item.html?id=c79cf92a933a44b8ba27ed833163202f&sublayer=0",
			"landingPage": "https://www.pacificgeoportal.com/datasets/eaglegis::nz-māori-constituencies-current",
			"title": "NZ Māori Constituencies - Current",
			"description": "<p><span style='font-size:medium;'><font style='font-family:&quot;Avenir Next W01&quot;, &quot;Avenir Next W00&quot;, &quot;Avenir Next&quot;, Avenir, &quot;Helvetica Neue&quot;, Helvetica, Arial, sans-serif !important;'>Topicality:&nbsp;01-01-2026</font></span></p><div><p><span style='font-family:Avenir Next W01, Avenir Next W00, Avenir Next, Avenir, Helvetica Neue, Helvetica, Arial, sans-serif; font-size:medium;'>Projection: New Zealand Transverse Mercator (NZTM)</span></p><div><div style='font-family:&quot;Avenir Next W01&quot;, &quot;Avenir Next W00&quot;, &quot;Avenir Next&quot;, Avenir, &quot;Helvetica Neue&quot;, Helvetica, Arial, sans-serif !important; font-size:17px;'><span style='font-family:Avenir Next W01, Avenir Next W00, Avenir Next, Avenir, Helvetica Neue, Helvetica, Arial, sans-serif; font-size:medium;'>This layer contains the latest set of </span><span style='font-size:medium;'>regional council&nbsp;Māori constituency boundaries as defined by the regional councils and Local Government Commission but maintained by Stats NZ (the custodian).</span><span style='font-family:Avenir Next W01, Avenir Next W00, Avenir Next, Avenir, Helvetica Neue, Helvetica, Arial, sans-serif; font-size:medium;'>&nbsp;</span></div><div style='font-family:&quot;Avenir Next W01&quot;, &quot;Avenir Next W00&quot;, &quot;Avenir Next&quot;, Avenir, &quot;Helvetica Neue&quot;, Helvetica, Arial, sans-serif !important; font-size:17px;'>&nbsp;</div></div><div style='font-family:&quot;Avenir Next W01&quot;, &quot;Avenir Next W00&quot;, &quot;Avenir Next&quot;, Avenir, &quot;Helvetica Neue&quot;, Helvetica, Arial, sans-serif !important; font-size:17px;'><span style='font-size:medium;'>Māori constituencies are established under the Local Electoral Act 2001 and result from the division of a region for electoral purposes.</span><br />&nbsp;</div><div style='font-family:&quot;Avenir Next W01&quot;, &quot;Avenir Next W00&quot;, &quot;Avenir Next&quot;, Avenir, &quot;Helvetica Neue&quot;, Helvetica, Arial, sans-serif !important; font-size:17px;'><span style='font-size:medium;'>Māori constituencies are divisions of regional council areas. They are created, based on population, to be the voting areas within councils. Māori constituencies are defined at meshblock level, and do not coincide with the statistical area 1 (SA1) geography or the statistical area 2 (SA2) geography.&nbsp;</span></div><div style='font-family:&quot;Avenir Next W01&quot;, &quot;Avenir Next W00&quot;, &quot;Avenir Next&quot;, Avenir, &quot;Helvetica Neue&quot;, Helvetica, Arial, sans-serif !important; font-size:17px;'>&nbsp;</div><div style='font-family:&quot;Avenir Next W01&quot;, &quot;Avenir Next W00&quot;, &quot;Avenir Next&quot;, Avenir, &quot;Helvetica Neue&quot;, Helvetica, Arial, sans-serif !important; font-size:17px;'><span style='font-size:medium;'>If a regional council decides to have a Māori constituency, the constituencies within the council are known as general constituencies and Māori constituencies.&nbsp;</span><br />&nbsp;</div><div style='font-family:&quot;Avenir Next W01&quot;, &quot;Avenir Next W00&quot;, &quot;Avenir Next&quot;, Avenir, &quot;Helvetica Neue&quot;, Helvetica, Arial, sans-serif !important; font-size:17px;'><span style='font-size:medium;'>The boundaries of Māori constituencies may be reviewed before each three yearly local government election. Regional councils must review their representation arrangements at least once every six years. The provisions for such reviews are contained in the Local Government Act 2002.&nbsp;</span></div><div style='font-family:&quot;Avenir Next W01&quot;, &quot;Avenir Next W00&quot;, &quot;Avenir Next&quot;, Avenir, &quot;Helvetica Neue&quot;, Helvetica, Arial, sans-serif !important; font-size:17px;'>&nbsp;</div><div><span style='font-size:medium;'>Māori constituencies are numbered based on their corresponding regional council. Each Māori constituency has a unique four-digit code. The first two digits represent the regional council that the Māori constituency lies within. The last two digits are sequential and represent the number of Māori constituencies within a regional council. For example, the Waikato Regional Council (03) contains two Māori constituencies which are coded 0301 and 0302.</span></div><div><ul><li><span style='font-family:Avenir Next W01, Avenir Next W00, Avenir Next, Avenir, Helvetica Neue, Helvetica, Arial, sans-serif; font-size:medium;'>This layer get updated yearly with the latest boundary data.</span></li><li><span style='font-family:Avenir Next W01, Avenir Next W00, Avenir Next, Avenir, Helvetica Neue, Helvetica, Arial, sans-serif; font-size:medium;'><font style='font-family:&quot;Avenir Next W01&quot;, &quot;Avenir Next W00&quot;, &quot;Avenir Next&quot;, Avenir, &quot;Helvetica Neue&quot;, Helvetica, Arial, sans-serif;'>A layer with the full archive of the data for all the available years is available </font></span><a target='_blank' href='https://www.arcgis.com/home/item.html?id=8d442899956446188be600fbaa8ad6dc' rel='nofollow ugc noopener noreferrer'>here.</a></li><li><span style='font-family:Avenir Next W01, Avenir Next W00, Avenir Next, Avenir, Helvetica Neue, Helvetica, Arial, sans-serif; font-size:medium;'>For information about the fields in this dataset go to the Data tab.</span></li></ul></div><div><span style='font-family:Avenir Next W01, Avenir Next W00, Avenir Next, Avenir, Helvetica Neue, Helvetica, Arial, sans-serif; font-size:medium;'>The layer is further generalised by Eagle Technology for improved performance on the web,&nbsp;</span><span style='font-family:&quot;Avenir Next W01&quot;, &quot;Avenir Next W00&quot;, &quot;Avenir Next&quot;, Avenir, &quot;Helvetica Neue&quot;, sans-serif; font-size:medium;'>therefore it doesn't fully represent the official boundaries.</span></div><div>&nbsp;</div><div><span style='font-family:Avenir Next W01, Avenir Next W00, Avenir Next, Avenir, Helvetica Neue, Helvetica, Arial, sans-serif; font-size:medium;'><font style='font-family:&quot;Avenir Next W01&quot;, &quot;Avenir Next W00&quot;, &quot;Avenir Next&quot;, Avenir, &quot;Helvetica Neue&quot;, Helvetica, Arial, sans-serif;'>The official dataset can be found on </font></span><a target='_blank' href='https://datafinder.stats.govt.nz/data/category/annual-boundaries/' rel='nofollow ugc noopener noreferrer'><span style='font-family:Avenir Next W01, Avenir Next W00, Avenir Next, Avenir, Helvetica Neue, Helvetica, Arial, sans-serif; font-size:medium;'>https://datafinder.stats.govt.nz.</span></a></div><div style='font-family:&quot;Avenir Next W01&quot;, &quot;Avenir Next W00&quot;, &quot;Avenir Next&quot;, Avenir, &quot;Helvetica Neue&quot;, Helvetica, Arial, sans-serif !important; font-size:17px;'><div>&nbsp;</div><div><div><span style='color:#2f4f4f; font-size:medium;'>This layer is offered by Eagle Technology (Official Esri Distributor). Eagle Technology offers services that can be used in the ArcGIS platform. The Content team at Eagle Technology updates the layers on a regular basis and regularly adds new content to the Living Atlas. By using this content and combining it with other data you can create new information products quickly and easily.</span></div><div><br />&nbsp;</div><div><span style='color:#2f4f4f; font-size:medium;'>If you have any questions or comments about the content, please let us now&nbsp; at&nbsp;</span><a style='color:rgb(0, 121, 193); text-decoration-line:none;' href='mailto:livingatlas@eagle.co.nz' target='_blank' rel='nofollow ugc noopener noreferrer'><span style='font-size:medium;'>livingatlas@eagle.co.nz</span></a></div></div></div></div>",
			"keyword": [
				"Boundary",
				"Boundaries",
				"New zealand",
				"Statistics New Zealand",
				"StatsNZ",
				"Eagle technology",
				"Nz",
				"Content",
				"Kiwi",
				"eaglegis"
			],
			"issued": "2021-02-04T01:02:42.000Z",
			"modified": "2025-12-19T00:25:56.706Z",
			"publisher": {
				"name": "Eagle Technology Group Ltd"
			},
			"contactPoint": {
				"@type": "vcard:Contact",
				"fn": "eaglegis",
				"hasEmail": "mailto:ts@eaglegis.co.nz"
			},
			"accessLevel": "public",
			"spatial": "166.2620,-47.2230,-177.6189,-33.7734",
			"license": "https://creativecommons.org/licenses/by/4.0",
			"distribution": [
				{
					"@type": "dcat:Distribution",
					"title": "ArcGIS Hub Dataset",
					"format": "Web Page",
					"mediaType": "text/html",
					"accessURL": "https://www.pacificgeoportal.com/datasets/eaglegis::nz-māori-constituencies-current"
				},
				{
					"@type": "dcat:Distribution",
					"title": "ArcGIS GeoService",
					"format": "ArcGIS GeoServices REST API",
					"mediaType": "application/json",
					"accessURL": "https://services.arcgis.com/XTtANUDT8Va4DLwI/arcgis/rest/services/nz_maori_constituencies/FeatureServer/0"
				},
				{
					"@type": "dcat:Distribution",
					"title": "CSV",
					"format": "CSV",
					"mediaType": "text/csv",
					"accessURL": "https://www.pacificgeoportal.com/api/download/v1/items/c79cf92a933a44b8ba27ed833163202f/csv?layers=0"
				},
				{
					"@type": "dcat:Distribution",
					"title": "Shapefile",
					"format": "ZIP",
					"mediaType": "application/zip",
					"accessURL": "https://www.pacificgeoportal.com/api/download/v1/items/c79cf92a933a44b8ba27ed833163202f/shapefile?layers=0"
				},
				{
					"@type": "dcat:Distribution",
					"title": "GeoJSON",
					"format": "GeoJSON",
					"mediaType": "application/vnd.geo+json",
					"accessURL": "https://www.pacificgeoportal.com/api/download/v1/items/c79cf92a933a44b8ba27ed833163202f/geojson?layers=0"
				},
				{
					"@type": "dcat:Distribution",
					"title": "KML",
					"format": "KML",
					"mediaType": "application/vnd.google-earth.kml+xml",
					"accessURL": "https://www.pacificgeoportal.com/api/download/v1/items/c79cf92a933a44b8ba27ed833163202f/kml?layers=0"
				},
				{
					"@type": "dcat:Distribution",
					"title": "File Geodatabase",
					"format": "ZIP",
					"mediaType": "application/zip",
					"accessURL": "https://www.pacificgeoportal.com/api/download/v1/items/c79cf92a933a44b8ba27ed833163202f/filegdb?layers=0"
				},
				{
					"@type": "dcat:Distribution",
					"title": "Feature Collection",
					"format": "TXT",
					"mediaType": "text/plain",
					"accessURL": "https://www.pacificgeoportal.com/api/download/v1/items/c79cf92a933a44b8ba27ed833163202f/featureCollection?layers=0"
				},
				{
					"@type": "dcat:Distribution",
					"title": "Excel",
					"format": "XLSX",
					"mediaType": "application/vnd.ms-excel",
					"accessURL": "https://www.pacificgeoportal.com/api/download/v1/items/c79cf92a933a44b8ba27ed833163202f/excel?layers=0"
				},
				{
					"@type": "dcat:Distribution",
					"title": "GeoPackage",
					"format": "GPKG",
					"mediaType": "application/geopackage+sqlite3",
					"accessURL": "https://www.pacificgeoportal.com/api/download/v1/items/c79cf92a933a44b8ba27ed833163202f/geoPackage?layers=0"
				},
				{
					"@type": "dcat:Distribution",
					"title": "SQLite Geodatabase",
					"format": "GDB",
					"mediaType": "application/geopackage+sqlite3",
					"accessURL": "https://www.pacificgeoportal.com/api/download/v1/items/c79cf92a933a44b8ba27ed833163202f/sqlite?layers=0"
				}
			],
			"theme": [
				"geospatial"
			]
		},
		{
			"@type": "dcat:Dataset",
			"identifier": "https://www.arcgis.com/home/item.html?id=c8f6ba6b968c4d31beddfb69abfe3df0&sublayer=0",
			"landingPage": "https://www.pacificgeoportal.com/datasets/eaglegis::nz-territorial-authorities-and-local-boards-current",
			"title": "NZ Territorial Authorities and Local Boards - Current",
			"description": "<div><span style='font-size:medium;'><font style='font-family:&quot;Avenir Next W01&quot;, &quot;Avenir Next W00&quot;, &quot;Avenir Next&quot;, Avenir, &quot;Helvetica Neue&quot;, Helvetica, Arial, sans-serif !important;'>Topicality:&nbsp;01-01-2026</font></span><br />&nbsp;</div><div><span style='font-size:17px;'><font style='font-family:&quot;Avenir Next W01&quot;, &quot;Avenir Next W00&quot;, &quot;Avenir Next&quot;, Avenir, &quot;Helvetica Neue&quot;, Helvetica, Arial, sans-serif !important; font-size:17px;'>Projection: New Zealand Transverse Mercator (NZTM)</font></span><br />&nbsp;</div><div><span style='font-size:medium;'><span>This layer contains the latest set of the Territorial Authority and Local Board boundaries maintained by Stats NZ.</span></span><br />&nbsp;</div><div><span style='font-size:medium;'>This dataset is a derived version comprising local boards for Auckland and territorial authorities for the rest of New Zealand, as defined by the territorial authorities and/or Local Government Commission and maintained by Stats NZ(the custodian), clipped to the coastline. This clipped version has been created for map creation/cartographic purposes and so does not fully represent the official full extent boundaries.</span></div><div>&nbsp;</div><div><span style='font-size:medium;'>For statistical outputs that use territorial authorities to aggregate and report data Auckland Council is treated as a single geographic entity. This can hide meaningful patterns and trends for a significant portion of the population. A solution was to create a new classification of territorial authorities that includes the local boards for Auckland. The Auckland Council was established in 2010 under the Local Government (Tamaki Makaurau Reorganisation) Act 2009. Seven territorial authorities within the Auckland Region were abolished and replaced by the unitary authority Auckland Council. Local boards fall within the community board classification</span></div><div><ul><li><span style='font-family:Avenir Next W01, Avenir Next W00, Avenir Next, Avenir, Helvetica Neue, Helvetica, Arial, sans-serif; font-size:medium;'>This layer gets updated yearly with the latest boundary data.</span></li><li><span style='font-family:Avenir Next W01, Avenir Next W00, Avenir Next, Avenir, Helvetica Neue, Helvetica, Arial, sans-serif; font-size:medium;'><font style='font-family:&quot;Avenir Next W01&quot;, &quot;Avenir Next W00&quot;, &quot;Avenir Next&quot;, Avenir, &quot;Helvetica Neue&quot;, Helvetica, Arial, sans-serif;'>A layer with the full archive of the data for all the available years is available </font></span><a target='_blank' href='https://www.arcgis.com/home/item.html?id=240bca66c4f242c7be1355621c83fd57' rel='nofollow ugc noopener noreferrer'>here.</a></li><li><span style='font-family:Avenir Next W01, Avenir Next W00, Avenir Next, Avenir, Helvetica Neue, Helvetica, Arial, sans-serif; font-size:medium;'>For information about the fields in this dataset go to the Data tab.</span></li></ul><div><span style='font-size:medium;'>The layer is further generalised by Eagle Technology for improved performance on the web,&nbsp;</span><span style='font-family:&quot;Avenir Next W01&quot;, &quot;Avenir Next W00&quot;, &quot;Avenir Next&quot;, Avenir, &quot;Helvetica Neue&quot;, sans-serif; font-size:medium;'>therefore it doesn't fully represent the official boundaries.</span></div><div style='font-family:&quot;Avenir Next W01&quot;, &quot;Avenir Next W00&quot;, &quot;Avenir Next&quot;, Avenir, &quot;Helvetica Neue&quot;, Helvetica, Arial, sans-serif !important;'>&nbsp;</div><div style='font-family:&quot;Avenir Next W01&quot;, &quot;Avenir Next W00&quot;, &quot;Avenir Next&quot;, Avenir, &quot;Helvetica Neue&quot;, Helvetica, Arial, sans-serif !important;'><span style='font-size:medium;'><font style='font-family:&quot;Avenir Next W01&quot;, &quot;Avenir Next W00&quot;, &quot;Avenir Next&quot;, Avenir, &quot;Helvetica Neue&quot;, Helvetica, Arial, sans-serif;'>The official dataset can be found on</font></span><span style='font-family:Avenir Next W01, Avenir Next W00, Avenir Next, Avenir, Helvetica Neue, Helvetica, Arial, sans-serif; font-size:medium;'><font style='font-family:&quot;Avenir Next W01&quot;, &quot;Avenir Next W00&quot;, &quot;Avenir Next&quot;, Avenir, &quot;Helvetica Neue&quot;, Helvetica, Arial, sans-serif;'> </font></span><a target='_blank' href='https://datafinder.stats.govt.nz/data/category/annual-boundaries/' rel='nofollow ugc noopener noreferrer'>https://datafinder.stats.govt.nz.</a></div><div style='font-family:&quot;Avenir Next W01&quot;, &quot;Avenir Next W00&quot;, &quot;Avenir Next&quot;, Avenir, &quot;Helvetica Neue&quot;, Helvetica, Arial, sans-serif !important;'>&nbsp;</div><div style='font-family:&quot;Avenir Next W01&quot;, &quot;Avenir Next W00&quot;, &quot;Avenir Next&quot;, Avenir, &quot;Helvetica Neue&quot;, Helvetica, Arial, sans-serif !important;'><span style='color:#2f4f4f; font-size:medium;'>This layer is offered by Eagle Technology (Official Esri Distributor). Eagle Technology offers services that can be used in the ArcGIS platform. The Content team at Eagle Technology updates the layers on a regular basis and regularly adds new content to the Living Atlas. By using this content and combining it with other data you can create new information products quickly and easily.</span></div><div><div style='font-family:&quot;Avenir Next W01&quot;, &quot;Avenir Next W00&quot;, &quot;Avenir Next&quot;, Avenir, &quot;Helvetica Neue&quot;, Helvetica, Arial, sans-serif !important;'>&nbsp;</div><div style='font-family:&quot;Avenir Next W01&quot;, &quot;Avenir Next W00&quot;, &quot;Avenir Next&quot;, Avenir, &quot;Helvetica Neue&quot;, Helvetica, Arial, sans-serif !important;'><span style='color:#2f4f4f; font-size:medium;'>If you have any questions or comments about the content, please let us now&nbsp; at&nbsp;</span><a style='color:rgb(0, 121, 193); text-decoration-line:none;' href='mailto:livingatlas@eagle.co.nz' target='_blank' rel='nofollow ugc noopener noreferrer'><span style='font-size:medium;'>livingatlas@eagle.co.nz</span></a></div></div></div>",
			"keyword": [
				"Boundary",
				"Boundaries",
				"New zealand",
				"Statistics New Zealand",
				"StatsNZ",
				"Eagle technology",
				"Nz",
				"Content",
				"Kiwi",
				"eaglegis"
			],
			"issued": "2021-02-04T01:11:46.000Z",
			"modified": "2025-12-19T00:26:29.624Z",
			"publisher": {
				"name": "Eagle Technology Group Ltd"
			},
			"contactPoint": {
				"@type": "vcard:Contact",
				"fn": "eaglegis",
				"hasEmail": "mailto:ts@eaglegis.co.nz"
			},
			"accessLevel": "public",
			"spatial": "166.2620,-47.2230,-177.6189,-33.7734",
			"license": "https://creativecommons.org/licenses/by/4.0",
			"distribution": [
				{
					"@type": "dcat:Distribution",
					"title": "ArcGIS Hub Dataset",
					"format": "Web Page",
					"mediaType": "text/html",
					"accessURL": "https://www.pacificgeoportal.com/datasets/eaglegis::nz-territorial-authorities-and-local-boards-current"
				},
				{
					"@type": "dcat:Distribution",
					"title": "ArcGIS GeoService",
					"format": "ArcGIS GeoServices REST API",
					"mediaType": "application/json",
					"accessURL": "https://services.arcgis.com/XTtANUDT8Va4DLwI/arcgis/rest/services/nz_territorial_authorities_and_local_boards/FeatureServer/0"
				},
				{
					"@type": "dcat:Distribution",
					"title": "CSV",
					"format": "CSV",
					"mediaType": "text/csv",
					"accessURL": "https://www.pacificgeoportal.com/api/download/v1/items/c8f6ba6b968c4d31beddfb69abfe3df0/csv?layers=0"
				},
				{
					"@type": "dcat:Distribution",
					"title": "Shapefile",
					"format": "ZIP",
					"mediaType": "application/zip",
					"accessURL": "https://www.pacificgeoportal.com/api/download/v1/items/c8f6ba6b968c4d31beddfb69abfe3df0/shapefile?layers=0"
				},
				{
					"@type": "dcat:Distribution",
					"title": "GeoJSON",
					"format": "GeoJSON",
					"mediaType": "application/vnd.geo+json",
					"accessURL": "https://www.pacificgeoportal.com/api/download/v1/items/c8f6ba6b968c4d31beddfb69abfe3df0/geojson?layers=0"
				},
				{
					"@type": "dcat:Distribution",
					"title": "KML",
					"format": "KML",
					"mediaType": "application/vnd.google-earth.kml+xml",
					"accessURL": "https://www.pacificgeoportal.com/api/download/v1/items/c8f6ba6b968c4d31beddfb69abfe3df0/kml?layers=0"
				},
				{
					"@type": "dcat:Distribution",
					"title": "File Geodatabase",
					"format": "ZIP",
					"mediaType": "application/zip",
					"accessURL": "https://www.pacificgeoportal.com/api/download/v1/items/c8f6ba6b968c4d31beddfb69abfe3df0/filegdb?layers=0"
				},
				{
					"@type": "dcat:Distribution",
					"title": "Feature Collection",
					"format": "TXT",
					"mediaType": "text/plain",
					"accessURL": "https://www.pacificgeoportal.com/api/download/v1/items/c8f6ba6b968c4d31beddfb69abfe3df0/featureCollection?layers=0"
				},
				{
					"@type": "dcat:Distribution",
					"title": "Excel",
					"format": "XLSX",
					"mediaType": "application/vnd.ms-excel",
					"accessURL": "https://www.pacificgeoportal.com/api/download/v1/items/c8f6ba6b968c4d31beddfb69abfe3df0/excel?layers=0"
				},
				{
					"@type": "dcat:Distribution",
					"title": "GeoPackage",
					"format": "GPKG",
					"mediaType": "application/geopackage+sqlite3",
					"accessURL": "https://www.pacificgeoportal.com/api/download/v1/items/c8f6ba6b968c4d31beddfb69abfe3df0/geoPackage?layers=0"
				},
				{
					"@type": "dcat:Distribution",
					"title": "SQLite Geodatabase",
					"format": "GDB",
					"mediaType": "application/geopackage+sqlite3",
					"accessURL": "https://www.pacificgeoportal.com/api/download/v1/items/c8f6ba6b968c4d31beddfb69abfe3df0/sqlite?layers=0"
				}
			],
			"theme": [
				"geospatial"
			]
		},
		{
			"@type": "dcat:Dataset",
			"identifier": "https://www.arcgis.com/home/item.html?id=31b3469be5c4445c93f11e7ec02d78a6&sublayer=0",
			"landingPage": "https://www.pacificgeoportal.com/datasets/eaglegis::nz-wards-archive",
			"title": "NZ Wards - Archive",
			"description": "<p><span style='font-size:medium;'><font style='font-family:&quot;Avenir Next W01&quot;, &quot;Avenir Next W00&quot;, &quot;Avenir Next&quot;, Avenir, &quot;Helvetica Neue&quot;, Helvetica, Arial, sans-serif !important;'>Topicality:&nbsp;01-01-2026</font></span></p><div><p><span style='font-family:Avenir Next W01, Avenir Next W00, Avenir Next, Avenir, Helvetica Neue, Helvetica, Arial, sans-serif; font-size:17px;'><font style='font-family:&quot;Avenir Next W01&quot;, &quot;Avenir Next W00&quot;, &quot;Avenir Next&quot;, Avenir, &quot;Helvetica Neue&quot;, Helvetica, Arial, sans-serif !important; font-size:17px;'>Projection: New Zealand Transverse Mercator (NZTM)</font></span></p><div style='font-family:&quot;Avenir Next W01&quot;, &quot;Avenir Next W00&quot;, &quot;Avenir Next&quot;, Avenir, &quot;Helvetica Neue&quot;, Helvetica, Arial, sans-serif !important; font-size:17px;'><span style='font-family:Avenir Next W01, Avenir Next W00, Avenir Next, Avenir, Helvetica Neue, Helvetica, Arial, sans-serif; font-size:medium;'>This layer </span><span style='font-family:&quot;Avenir Next W01&quot;, &quot;Avenir Next W00&quot;, &quot;Avenir Next&quot;, Avenir, &quot;Helvetica Neue&quot;, Helvetica, Arial, sans-serif; font-size:medium;'>contains the archive</span><span style='font-size:medium;'> of&nbsp;</span><span style='font-family:&quot;Avenir Next W01&quot;, &quot;Avenir Next W00&quot;, &quot;Avenir Next&quot;, Avenir, &quot;Helvetica Neue&quot;, sans-serif; font-size:medium;'>Ward boundaries</span><span style='font-size:medium;'> as defined by the regional councils and Local Government Commission but maintained by Stats NZ (the custodian).</span></div><div style='font-family:&quot;Avenir Next W01&quot;, &quot;Avenir Next W00&quot;, &quot;Avenir Next&quot;, Avenir, &quot;Helvetica Neue&quot;, Helvetica, Arial, sans-serif !important; font-size:17px;'>&nbsp;</div><div><span style='font-family:Avenir Next W01, Avenir Next W00, Avenir Next, Avenir, Helvetica Neue, Helvetica, Arial, sans-serif; font-size:medium;'>Wards were originally set up within any territorial authority with a population of at least 20,000. Wards are defined under the Local Electoral Act 2001 and result from dividing a territorial authority for electoral purposes. The ward system was designed to allow for the recognition of communities within a territorial authority and to increase community involvement in the local government system.</span><br />&nbsp;</div><div><span style='font-family:Avenir Next W01, Avenir Next W00, Avenir Next, Avenir, Helvetica Neue, Helvetica, Arial, sans-serif; font-size:medium;'>Territorial authorities can now choose whether they would like to maintain electoral wards. As a result, the number of wards has steadily decreased since they were first created in 1989. Ward boundaries are reviewed in the year before the three-yearly local government elections.</span><br />&nbsp;</div><p><span style='font-family:Avenir Next W01, Avenir Next W00, Avenir Next, Avenir, Helvetica Neue, Helvetica, Arial, sans-serif; font-size:medium;'>This layer get updated yearly with the latest boundary data.<font style='font-family:&quot;Avenir Next W01&quot;, &quot;Avenir Next W00&quot;, &quot;Avenir Next&quot;, Avenir, &quot;Helvetica Neue&quot;, Helvetica, Arial, sans-serif;'> You can use this layer when you need any year of boundary data in your map. By setting a filter on the dataset year you can filter on specific year of the dataset.</font></span></p><div><span style='font-family:Avenir Next W01, Avenir Next W00, Avenir Next, Avenir, Helvetica Neue, Helvetica, Arial, sans-serif; font-size:medium;'>For information about the fields in this dataset go to the Data tab.</span></div><div>&nbsp;</div><div><span style='font-family:Avenir Next W01, Avenir Next W00, Avenir Next, Avenir, Helvetica Neue, Helvetica, Arial, sans-serif; font-size:medium;'>The layer is further generalised by Eagle Technology for improved performance on the web,&nbsp;</span><span style='font-family:&quot;Avenir Next W01&quot;, &quot;Avenir Next W00&quot;, &quot;Avenir Next&quot;, Avenir, &quot;Helvetica Neue&quot;, sans-serif; font-size:medium;'>therefore it doesn't fully represent the official boundaries.</span></div><div>&nbsp;</div><div><span style='font-family:Avenir Next W01, Avenir Next W00, Avenir Next, Avenir, Helvetica Neue, Helvetica, Arial, sans-serif; font-size:medium;'><font style='font-family:&quot;Avenir Next W01&quot;, &quot;Avenir Next W00&quot;, &quot;Avenir Next&quot;, Avenir, &quot;Helvetica Neue&quot;, Helvetica, Arial, sans-serif;'>If you only need the latest boundary data in your map you can use the </font></span><a target='_blank' href='https://www.arcgis.com/home/item.html?id=030d32f649c94ab8959215951c03fbca' rel='nofollow ugc noopener noreferrer'><span style='font-family:Avenir Next W01, Avenir Next W00, Avenir Next, Avenir, Helvetica Neue, Helvetica, Arial, sans-serif; font-size:medium;'>current version</span></a><span style='font-family:Avenir Next W01, Avenir Next W00, Avenir Next, Avenir, Helvetica Neue, Helvetica, Arial, sans-serif; font-size:medium;'><font style='font-family:&quot;Avenir Next W01&quot;, &quot;Avenir Next W00&quot;, &quot;Avenir Next&quot;, Avenir, &quot;Helvetica Neue&quot;, Helvetica, Arial, sans-serif;'> of this dataset. All the current versions of Stats NZ Boundary layers can be found </font></span><a target='_blank' href='https://www.arcgis.com/home/group.html?id=b22e4f0012a8426dac21cd3d02f25c67' rel='nofollow ugc noopener noreferrer'><span style='font-family:Avenir Next W01, Avenir Next W00, Avenir Next, Avenir, Helvetica Neue, Helvetica, Arial, sans-serif; font-size:medium;'><font style='font-family:&quot;Avenir Next W01&quot;, &quot;Avenir Next W00&quot;, &quot;Avenir Next&quot;, Avenir, &quot;Helvetica Neue&quot;, Helvetica, Arial, sans-serif;'>here</font></span></a><span style='font-family:Avenir Next W01, Avenir Next W00, Avenir Next, Avenir, Helvetica Neue, Helvetica, Arial, sans-serif; font-size:medium;'><font style='font-family:&quot;Avenir Next W01&quot;, &quot;Avenir Next W00&quot;, &quot;Avenir Next&quot;, Avenir, &quot;Helvetica Neue&quot;, Helvetica, Arial, sans-serif;'>.</font></span></div><div>&nbsp;</div><div><span style='font-family:Avenir Next W01, Avenir Next W00, Avenir Next, Avenir, Helvetica Neue, Helvetica, Arial, sans-serif; font-size:medium;'><font style='font-family:&quot;Avenir Next W01&quot;, &quot;Avenir Next W00&quot;, &quot;Avenir Next&quot;, Avenir, &quot;Helvetica Neue&quot;, Helvetica, Arial, sans-serif;'>The official dataset can be found on&nbsp;</font></span><a target='_blank' href='https://datafinder.stats.govt.nz/data/category/annual-boundaries/2022/' rel='nofollow ugc noopener noreferrer'><span style='font-family:Avenir Next W01, Avenir Next W00, Avenir Next, Avenir, Helvetica Neue, Helvetica, Arial, sans-serif; font-size:medium;'>https://datafinder.stats.govt.nz.</span></a></div><div><div style='font-family:&quot;Avenir Next W01&quot;, &quot;Avenir Next W00&quot;, &quot;Avenir Next&quot;, Avenir, &quot;Helvetica Neue&quot;, Helvetica, Arial, sans-serif; font-size:17px;'>&nbsp;</div><div style='font-family:&quot;Avenir Next W01&quot;, &quot;Avenir Next W00&quot;, &quot;Avenir Next&quot;, Avenir, &quot;Helvetica Neue&quot;, Helvetica, Arial, sans-serif; font-size:17px;'><div><span style='color:#2f4f4f; font-size:medium;'>This layer is offered by Eagle Technology (Official Esri Distributor). Eagle Technology offers services that can be used in the ArcGIS platform. The Content team at Eagle Technology updates the layers on a regular basis and regularly adds new content to the Living Atlas. By using this content and combining it with other data you can create new information products quickly and easily.</span></div><div>&nbsp;</div><div><span style='color:#2f4f4f; font-size:medium;'>If you have any questions or comments about the content, please let us now&nbsp; at&nbsp;</span><a style='color:rgb(0, 121, 193); text-decoration-line:none;' href='mailto:livingatlas@eagle.co.nz' target='_blank' rel='nofollow ugc noopener noreferrer'><span style='font-size:medium;'>livingatlas@eagle.co.nz</span></a></div></div></div></div>",
			"keyword": [
				"Boundaries",
				"Boundary",
				"New zealand",
				"Statistics new zealand",
				"Statsnz",
				"Eagle technology",
				"Kiwi",
				"Statnz",
				"Election",
				"Elections",
				"Ward",
				"Wards",
				"eaglegis"
			],
			"issued": "2023-01-18T00:29:18.000Z",
			"modified": "2025-12-19T00:24:54.506Z",
			"publisher": {
				"name": "Eagle Technology Group Ltd"
			},
			"contactPoint": {
				"@type": "vcard:Contact",
				"fn": "eaglegis",
				"hasEmail": "mailto:ts@eaglegis.co.nz"
			},
			"accessLevel": "public",
			"spatial": "166.2620,-47.2230,-177.6374,-33.6045",
			"license": "https://creativecommons.org/licenses/by/4.0",
			"distribution": [
				{
					"@type": "dcat:Distribution",
					"title": "ArcGIS Hub Dataset",
					"format": "Web Page",
					"mediaType": "text/html",
					"accessURL": "https://www.pacificgeoportal.com/datasets/eaglegis::nz-wards-archive"
				},
				{
					"@type": "dcat:Distribution",
					"title": "ArcGIS GeoService",
					"format": "ArcGIS GeoServices REST API",
					"mediaType": "application/json",
					"accessURL": "https://services.arcgis.com/XTtANUDT8Va4DLwI/arcgis/rest/services/nz_wards_archive/FeatureServer/0"
				},
				{
					"@type": "dcat:Distribution",
					"title": "CSV",
					"format": "CSV",
					"mediaType": "text/csv",
					"accessURL": "https://www.pacificgeoportal.com/api/download/v1/items/31b3469be5c4445c93f11e7ec02d78a6/csv?layers=0"
				},
				{
					"@type": "dcat:Distribution",
					"title": "Shapefile",
					"format": "ZIP",
					"mediaType": "application/zip",
					"accessURL": "https://www.pacificgeoportal.com/api/download/v1/items/31b3469be5c4445c93f11e7ec02d78a6/shapefile?layers=0"
				},
				{
					"@type": "dcat:Distribution",
					"title": "GeoJSON",
					"format": "GeoJSON",
					"mediaType": "application/vnd.geo+json",
					"accessURL": "https://www.pacificgeoportal.com/api/download/v1/items/31b3469be5c4445c93f11e7ec02d78a6/geojson?layers=0"
				},
				{
					"@type": "dcat:Distribution",
					"title": "KML",
					"format": "KML",
					"mediaType": "application/vnd.google-earth.kml+xml",
					"accessURL": "https://www.pacificgeoportal.com/api/download/v1/items/31b3469be5c4445c93f11e7ec02d78a6/kml?layers=0"
				},
				{
					"@type": "dcat:Distribution",
					"title": "File Geodatabase",
					"format": "ZIP",
					"mediaType": "application/zip",
					"accessURL": "https://www.pacificgeoportal.com/api/download/v1/items/31b3469be5c4445c93f11e7ec02d78a6/filegdb?layers=0"
				},
				{
					"@type": "dcat:Distribution",
					"title": "Feature Collection",
					"format": "TXT",
					"mediaType": "text/plain",
					"accessURL": "https://www.pacificgeoportal.com/api/download/v1/items/31b3469be5c4445c93f11e7ec02d78a6/featureCollection?layers=0"
				},
				{
					"@type": "dcat:Distribution",
					"title": "Excel",
					"format": "XLSX",
					"mediaType": "application/vnd.ms-excel",
					"accessURL": "https://www.pacificgeoportal.com/api/download/v1/items/31b3469be5c4445c93f11e7ec02d78a6/excel?layers=0"
				},
				{
					"@type": "dcat:Distribution",
					"title": "GeoPackage",
					"format": "GPKG",
					"mediaType": "application/geopackage+sqlite3",
					"accessURL": "https://www.pacificgeoportal.com/api/download/v1/items/31b3469be5c4445c93f11e7ec02d78a6/geoPackage?layers=0"
				},
				{
					"@type": "dcat:Distribution",
					"title": "SQLite Geodatabase",
					"format": "GDB",
					"mediaType": "application/geopackage+sqlite3",
					"accessURL": "https://www.pacificgeoportal.com/api/download/v1/items/31b3469be5c4445c93f11e7ec02d78a6/sqlite?layers=0"
				}
			],
			"theme": [
				"geospatial"
			]
		},
		{
			"@type": "dcat:Dataset",
			"identifier": "https://www.arcgis.com/home/item.html?id=a1e9e78dbdaf49e39dffd5020dc4f7fc&sublayer=0",
			"landingPage": "https://www.pacificgeoportal.com/datasets/eaglegis::nz-urban-rural-indicator-areas-archive",
			"title": "NZ Urban Rural Indicator Areas - Archive",
			"description": "<p><span style='font-size:medium;'><font style='font-family:&quot;Avenir Next W01&quot;, &quot;Avenir Next W00&quot;, &quot;Avenir Next&quot;, Avenir, &quot;Helvetica Neue&quot;, Helvetica, Arial, sans-serif !important;'>Topicality:&nbsp;01-01-2026</font></span></p><div><span style='font-family:&quot;Avenir Next W01&quot;, &quot;Avenir Next W00&quot;, &quot;Avenir Next&quot;, Avenir, &quot;Helvetica Neue&quot;, Helvetica, Arial, sans-serif; font-size:medium;'>Projection: New Zealand Transverse Mercator (NZTM)</span><br />&nbsp;</div><div><div><div><span style='font-size:medium;'><font style='font-family:&quot;Avenir Next W01&quot;, &quot;Avenir Next W00&quot;, &quot;Avenir Next&quot;, Avenir, &quot;Helvetica Neue&quot;, Helvetica, Arial, sans-serif !important; font-size:17px;'>This layer contains the archive of urban-rural indicator areas as defined by Stats NZ.&nbsp;</font></span><br />&nbsp;</div><div><span style='font-size:medium;'>Urban rural is an output geography that classifies New Zealand into areas that share common urban or rural characteristics and is used to disseminate a broad range of Stats NZ’s social, demographic and economic statistics. The urban rural geography separately identifies urban areas, rural settlements, other rural areas, and water areas. The urban areas represent densely developed spaces, and encompass residential, commercial, and other nonresidential urban land uses. Rural settlements, other rural areas, and bodies of water represent areas not included within an urban area.</span></div><div style='font-family:&quot;Avenir Next W01&quot;, &quot;Avenir Next W00&quot;, &quot;Avenir Next&quot;, Avenir, &quot;Helvetica Neue&quot;, Helvetica, Arial, sans-serif !important; font-size:17px;'>&nbsp;</div><p><span style='font-size:medium;'>This layer get updated yearly with the latest boundary data.<font style='font-family:&quot;Avenir Next W01&quot;, &quot;Avenir Next W00&quot;, &quot;Avenir Next&quot;, Avenir, &quot;Helvetica Neue&quot;, Helvetica, Arial, sans-serif;'> You can use this layer when you need any year of boundary data in your map. By setting a filter on the dataset year you can filter on specific year of the dataset.</font></span></p><div><span style='font-size:medium;'>For information about the fields in this dataset go to the Data tab.</span></div><div>&nbsp;</div><div><div><span style='font-size:medium;'><strong>Urban Rural indicator classes</strong></span></div><div><div><ul><li><div style='display:inline !important;'><span style='font-size:medium;'>urban area:</span></div><ul><li><div style='display:inline !important;'><span style='font-size:medium;'>urban major (11)</span></div></li><li><div style='display:inline !important;'><span style='font-size:medium;'>urban large (12)</span></div></li><li><div style='display:inline !important;'><span style='font-size:medium;'>urban medium (13)</span></div></li><li><div style='display:inline !important;'><span style='font-size:medium;'>urban small (14)</span></div></li></ul></li><li><div style='display:inline !important;'><span style='font-size:medium;'>rural area:</span></div><ul><li><div style='display:inline !important;'><span style='font-size:medium;'>rural settlement (21)</span></div></li><li><div style='display:inline !important;'><span style='font-size:medium;'>rural other (22)</span></div></li></ul></li><li><div style='display:inline !important;'><span style='font-size:medium;'>water:</span></div><ul><li><div style='display:inline !important;'><span style='font-size:medium;'>inland water (31)</span></div></li><li><div style='display:inline !important;'><span style='font-size:medium;'>inlet (32)</span></div></li><li><div style='display:inline !important;'><span style='font-size:medium;'>oceanic (33)</span></div></li></ul></li></ul></div></div></div><div><span style='font-size:medium;'>The layer is further generalised by Eagle Technology for improved performance on the web,&nbsp;</span><span style='font-family:&quot;Avenir Next W01&quot;, &quot;Avenir Next W00&quot;, &quot;Avenir Next&quot;, Avenir, &quot;Helvetica Neue&quot;, sans-serif; font-size:medium;'>therefore it doesn't fully represent the official boundaries.</span></div><div>&nbsp;</div><p><span style='font-size:medium;'><font style='font-family:&quot;Avenir Next W01&quot;, &quot;Avenir Next W00&quot;, &quot;Avenir Next&quot;, Avenir, &quot;Helvetica Neue&quot;, Helvetica, Arial, sans-serif;'>If you only need the latest boundary data in your map you can use the </font></span><a target='_blank' href='https://www.arcgis.com/home/item.html?id=0182b19deac74ce6bcdc16b0ee290b56' rel='nofollow ugc noopener noreferrer'>current version</a><span style='font-size:medium;'><font style='font-family:&quot;Avenir Next W01&quot;, &quot;Avenir Next W00&quot;, &quot;Avenir Next&quot;, Avenir, &quot;Helvetica Neue&quot;, Helvetica, Arial, sans-serif;'> of this dataset. All the current versions of Stats NZ Boundary layers can be found </font></span><a target='_blank' href='https://www.arcgis.com/home/group.html?id=b22e4f0012a8426dac21cd3d02f25c67' rel='nofollow ugc noopener noreferrer'><span style='font-size:medium;'><font style='font-family:&quot;Avenir Next W01&quot;, &quot;Avenir Next W00&quot;, &quot;Avenir Next&quot;, Avenir, &quot;Helvetica Neue&quot;, Helvetica, Arial, sans-serif;'>here</font></span></a><span style='font-size:medium;'><font style='font-family:&quot;Avenir Next W01&quot;, &quot;Avenir Next W00&quot;, &quot;Avenir Next&quot;, Avenir, &quot;Helvetica Neue&quot;, Helvetica, Arial, sans-serif;'>.</font></span></p><div style='font-family:&quot;Avenir Next W01&quot;, &quot;Avenir Next W00&quot;, &quot;Avenir Next&quot;, Avenir, &quot;Helvetica Neue&quot;, Helvetica, Arial, sans-serif !important;'><div><span style='font-size:medium;'><font style='font-family:&quot;Avenir Next W01&quot;, &quot;Avenir Next W00&quot;, &quot;Avenir Next&quot;, Avenir, &quot;Helvetica Neue&quot;, Helvetica, Arial, sans-serif;'>The official dataset can be found on</font></span><span style='font-family:Avenir Next W01, Avenir Next W00, Avenir Next, Avenir, Helvetica Neue, Helvetica, Arial, sans-serif; font-size:medium;'><font style='font-family:&quot;Avenir Next W01&quot;, &quot;Avenir Next W00&quot;, &quot;Avenir Next&quot;, Avenir, &quot;Helvetica Neue&quot;, Helvetica, Arial, sans-serif;'>&nbsp;</font></span><a target='_blank' href='https://datafinder.stats.govt.nz/data/category/annual-boundaries/2022/' rel='nofollow ugc noopener noreferrer'><span style='font-size:medium;'>https://datafinder.stats.govt.nz.</span></a></div><div>&nbsp;</div></div><div style='font-family:&quot;Avenir Next W01&quot;, &quot;Avenir Next W00&quot;, &quot;Avenir Next&quot;, Avenir, &quot;Helvetica Neue&quot;, Helvetica, Arial, sans-serif !important; font-size:17px;'><div><span style='color:#2f4f4f; font-size:medium;'>This layer is offered by Eagle Technology (Official Esri Distributor). Eagle Technology offers services that can be used in the ArcGIS platform. The Content team at Eagle Technology updates the layers on a regular basis and regularly adds new content to the Living Atlas. By using this content and combining it with other data you can create new information products quickly and easily.</span></div><div>&nbsp;</div><div><span style='color:#2f4f4f; font-size:medium;'>If you have any questions or comments about the content, please let us now&nbsp; at&nbsp;</span><a style='color:rgb(0, 121, 193); text-decoration-line:none;' href='mailto:livingatlas@eagle.co.nz' target='_blank' rel='nofollow ugc noopener noreferrer'><span style='font-size:medium;'>livingatlas@eagle.co.nz</span></a></div></div></div></div>",
			"keyword": [
				"Boundary",
				"Boundaries",
				"New zealand",
				"Statistics New Zealand",
				"StatsNZ",
				"Eagle technology",
				"Nz",
				"Content",
				"Kiwi",
				"eaglegis"
			],
			"issued": "2023-01-18T00:52:55.000Z",
			"modified": "2025-12-19T00:26:21.299Z",
			"publisher": {
				"name": "Eagle Technology Group Ltd"
			},
			"contactPoint": {
				"@type": "vcard:Contact",
				"fn": "eaglegis",
				"hasEmail": "mailto:ts@eaglegis.co.nz"
			},
			"accessLevel": "public",
			"spatial": "166.2620,-47.2230,-177.6190,-33.7734",
			"license": "https://creativecommons.org/licenses/by/4.0",
			"distribution": [
				{
					"@type": "dcat:Distribution",
					"title": "ArcGIS Hub Dataset",
					"format": "Web Page",
					"mediaType": "text/html",
					"accessURL": "https://www.pacificgeoportal.com/datasets/eaglegis::nz-urban-rural-indicator-areas-archive"
				},
				{
					"@type": "dcat:Distribution",
					"title": "ArcGIS GeoService",
					"format": "ArcGIS GeoServices REST API",
					"mediaType": "application/json",
					"accessURL": "https://services.arcgis.com/XTtANUDT8Va4DLwI/arcgis/rest/services/nz_urban_rural_indicator_areas_archive/FeatureServer/0"
				},
				{
					"@type": "dcat:Distribution",
					"title": "CSV",
					"format": "CSV",
					"mediaType": "text/csv",
					"accessURL": "https://www.pacificgeoportal.com/api/download/v1/items/a1e9e78dbdaf49e39dffd5020dc4f7fc/csv?layers=0"
				},
				{
					"@type": "dcat:Distribution",
					"title": "Shapefile",
					"format": "ZIP",
					"mediaType": "application/zip",
					"accessURL": "https://www.pacificgeoportal.com/api/download/v1/items/a1e9e78dbdaf49e39dffd5020dc4f7fc/shapefile?layers=0"
				},
				{
					"@type": "dcat:Distribution",
					"title": "GeoJSON",
					"format": "GeoJSON",
					"mediaType": "application/vnd.geo+json",
					"accessURL": "https://www.pacificgeoportal.com/api/download/v1/items/a1e9e78dbdaf49e39dffd5020dc4f7fc/geojson?layers=0"
				},
				{
					"@type": "dcat:Distribution",
					"title": "KML",
					"format": "KML",
					"mediaType": "application/vnd.google-earth.kml+xml",
					"accessURL": "https://www.pacificgeoportal.com/api/download/v1/items/a1e9e78dbdaf49e39dffd5020dc4f7fc/kml?layers=0"
				},
				{
					"@type": "dcat:Distribution",
					"title": "File Geodatabase",
					"format": "ZIP",
					"mediaType": "application/zip",
					"accessURL": "https://www.pacificgeoportal.com/api/download/v1/items/a1e9e78dbdaf49e39dffd5020dc4f7fc/filegdb?layers=0"
				},
				{
					"@type": "dcat:Distribution",
					"title": "Feature Collection",
					"format": "TXT",
					"mediaType": "text/plain",
					"accessURL": "https://www.pacificgeoportal.com/api/download/v1/items/a1e9e78dbdaf49e39dffd5020dc4f7fc/featureCollection?layers=0"
				},
				{
					"@type": "dcat:Distribution",
					"title": "Excel",
					"format": "XLSX",
					"mediaType": "application/vnd.ms-excel",
					"accessURL": "https://www.pacificgeoportal.com/api/download/v1/items/a1e9e78dbdaf49e39dffd5020dc4f7fc/excel?layers=0"
				},
				{
					"@type": "dcat:Distribution",
					"title": "GeoPackage",
					"format": "GPKG",
					"mediaType": "application/geopackage+sqlite3",
					"accessURL": "https://www.pacificgeoportal.com/api/download/v1/items/a1e9e78dbdaf49e39dffd5020dc4f7fc/geoPackage?layers=0"
				},
				{
					"@type": "dcat:Distribution",
					"title": "SQLite Geodatabase",
					"format": "GDB",
					"mediaType": "application/geopackage+sqlite3",
					"accessURL": "https://www.pacificgeoportal.com/api/download/v1/items/a1e9e78dbdaf49e39dffd5020dc4f7fc/sqlite?layers=0"
				}
			],
			"theme": [
				"geospatial"
			]
		},
		{
			"@type": "dcat:Dataset",
			"identifier": "https://www.arcgis.com/home/item.html?id=240bca66c4f242c7be1355621c83fd57&sublayer=0",
			"landingPage": "https://www.pacificgeoportal.com/datasets/eaglegis::nz-territorial-authorities-and-local-boards-archive",
			"title": "NZ Territorial Authorities and Local Boards - Archive",
			"description": "<div><span style='font-size:medium;'><font style='font-family:&quot;Avenir Next W01&quot;, &quot;Avenir Next W00&quot;, &quot;Avenir Next&quot;, Avenir, &quot;Helvetica Neue&quot;, Helvetica, Arial, sans-serif !important;'>Topicality:&nbsp;01-01-2026</font></span></div><div><span style='font-size:17px;'><font style='font-family:&quot;Avenir Next W01&quot;, &quot;Avenir Next W00&quot;, &quot;Avenir Next&quot;, Avenir, &quot;Helvetica Neue&quot;, Helvetica, Arial, sans-serif !important; font-size:17px;'>Projection: New Zealand Transverse Mercator (NZTM)</font></span><br />&nbsp;</div><div><span style='font-size:medium;'><span>This layer contains the archive of the Territorial Authority and Local Board boundaries maintained by Stats NZ.</span></span><br />&nbsp;</div><div><span style='font-size:medium;'>This dataset is a derived version comprising local boards for Auckland and territorial authorities for the rest of New Zealand, as defined by the territorial authorities and/or Local Government Commission and maintained by Stats NZ(the custodian), clipped to the coastline. This clipped version has been created for map creation/cartographic purposes and so does not fully represent the official full extent boundaries.</span></div><div>&nbsp;</div><div><span style='font-size:medium;'>For statistical outputs that use territorial authorities to aggregate and report data Auckland Council is treated as a single geographic entity. This can hide meaningful patterns and trends for a significant portion of the population. A solution was to create a new classification of territorial authorities that includes the local boards for Auckland. The Auckland Council was established in 2010 under the Local Government (Tamaki Makaurau Reorganisation) Act 2009. Seven territorial authorities within the Auckland Region were abolished and replaced by the unitary authority Auckland Council. Local boards fall within the community board classification</span></div><div><div>&nbsp;</div><p><span style='font-size:medium;'>This layer get updated yearly with the latest boundary data.<font style='font-family:&quot;Avenir Next W01&quot;, &quot;Avenir Next W00&quot;, &quot;Avenir Next&quot;, Avenir, &quot;Helvetica Neue&quot;, Helvetica, Arial, sans-serif;'> You can use this layer when you need any year of boundary data in your map. By setting a filter on the dataset year you can filter on specific year of the dataset.</font></span></p><div><span style='font-size:medium;'>For information about the fields in this dataset go to the Data tab.</span></div><div>&nbsp;</div><div><span style='font-size:medium;'>The layer is further generalised by Eagle Technology for improved performance on the web,&nbsp;</span><span style='font-family:&quot;Avenir Next W01&quot;, &quot;Avenir Next W00&quot;, &quot;Avenir Next&quot;, Avenir, &quot;Helvetica Neue&quot;, sans-serif; font-size:medium;'>therefore it doesn't fully represent the official boundaries.</span></div><div>&nbsp;</div><div><span style='font-size:medium;'><font style='font-family:&quot;Avenir Next W01&quot;, &quot;Avenir Next W00&quot;, &quot;Avenir Next&quot;, Avenir, &quot;Helvetica Neue&quot;, Helvetica, Arial, sans-serif;'>If you only need the latest boundary data in your map you can use the </font></span><a target='_blank' href='https://www.arcgis.com/home/item.html?id=c8f6ba6b968c4d31beddfb69abfe3df0' rel='nofollow ugc noopener noreferrer'>current version</a><span style='font-size:medium;'><font style='font-family:&quot;Avenir Next W01&quot;, &quot;Avenir Next W00&quot;, &quot;Avenir Next&quot;, Avenir, &quot;Helvetica Neue&quot;, Helvetica, Arial, sans-serif;'> of this dataset. All the current versions of Stats NZ Boundary layers can be found </font></span><a target='_blank' href='https://www.arcgis.com/home/group.html?id=b22e4f0012a8426dac21cd3d02f25c67' rel='nofollow ugc noopener noreferrer'><span style='font-size:medium;'><font style='font-family:&quot;Avenir Next W01&quot;, &quot;Avenir Next W00&quot;, &quot;Avenir Next&quot;, Avenir, &quot;Helvetica Neue&quot;, Helvetica, Arial, sans-serif;'>here</font></span></a><span style='font-size:medium;'><font style='font-family:&quot;Avenir Next W01&quot;, &quot;Avenir Next W00&quot;, &quot;Avenir Next&quot;, Avenir, &quot;Helvetica Neue&quot;, Helvetica, Arial, sans-serif;'>.</font></span><br />&nbsp;</div><div style='font-family:&quot;Avenir Next W01&quot;, &quot;Avenir Next W00&quot;, &quot;Avenir Next&quot;, Avenir, &quot;Helvetica Neue&quot;, Helvetica, Arial, sans-serif !important;'><span style='font-size:medium;'><font style='font-family:&quot;Avenir Next W01&quot;, &quot;Avenir Next W00&quot;, &quot;Avenir Next&quot;, Avenir, &quot;Helvetica Neue&quot;, Helvetica, Arial, sans-serif;'>The official dataset can be found on</font></span><span style='font-family:Avenir Next W01, Avenir Next W00, Avenir Next, Avenir, Helvetica Neue, Helvetica, Arial, sans-serif; font-size:medium;'><font style='font-family:&quot;Avenir Next W01&quot;, &quot;Avenir Next W00&quot;, &quot;Avenir Next&quot;, Avenir, &quot;Helvetica Neue&quot;, Helvetica, Arial, sans-serif;'>&nbsp;</font></span><a target='_blank' href='https://datafinder.stats.govt.nz/data/category/annual-boundaries/2022/' rel='nofollow ugc noopener noreferrer'><span style='font-size:medium;'>https://datafinder.stats.govt.nz.</span></a><br />&nbsp;</div><div style='font-family:&quot;Avenir Next W01&quot;, &quot;Avenir Next W00&quot;, &quot;Avenir Next&quot;, Avenir, &quot;Helvetica Neue&quot;, Helvetica, Arial, sans-serif !important;'><span style='color:#2f4f4f; font-size:medium;'>This layer is offered by Eagle Technology (Official Esri Distributor). Eagle Technology offers services that can be used in the ArcGIS platform. The Content team at Eagle Technology updates the layers on a regular basis and regularly adds new content to the Living Atlas. By using this content and combining it with other data you can create new information products quickly and easily.</span></div><div style='font-family:&quot;Avenir Next W01&quot;, &quot;Avenir Next W00&quot;, &quot;Avenir Next&quot;, Avenir, &quot;Helvetica Neue&quot;, Helvetica, Arial, sans-serif !important;'>&nbsp;</div><div><div style='font-family:&quot;Avenir Next W01&quot;, &quot;Avenir Next W00&quot;, &quot;Avenir Next&quot;, Avenir, &quot;Helvetica Neue&quot;, Helvetica, Arial, sans-serif !important;'><span style='color:#2f4f4f; font-size:medium;'>If you have any questions or comments about the content, please let us now&nbsp; at&nbsp;</span><a style='color:rgb(0, 121, 193); text-decoration-line:none;' href='mailto:livingatlas@eagle.co.nz' target='_blank' rel='nofollow ugc noopener noreferrer'><span style='font-size:medium;'>livingatlas@eagle.co.nz</span></a></div></div></div>",
			"keyword": [
				"Boundary",
				"Boundaries",
				"New zealand",
				"Statistics New Zealand",
				"StatsNZ",
				"Eagle technology",
				"Nz",
				"Content",
				"Kiwi",
				"eaglegis"
			],
			"issued": "2023-01-18T00:54:42.000Z",
			"modified": "2025-12-19T00:26:29.624Z",
			"publisher": {
				"name": "Eagle Technology Group Ltd"
			},
			"contactPoint": {
				"@type": "vcard:Contact",
				"fn": "eaglegis",
				"hasEmail": "mailto:ts@eaglegis.co.nz"
			},
			"accessLevel": "public",
			"spatial": "166.2620,-47.2230,-177.6189,-33.7734",
			"license": "https://creativecommons.org/licenses/by/4.0",
			"distribution": [
				{
					"@type": "dcat:Distribution",
					"title": "ArcGIS Hub Dataset",
					"format": "Web Page",
					"mediaType": "text/html",
					"accessURL": "https://www.pacificgeoportal.com/datasets/eaglegis::nz-territorial-authorities-and-local-boards-archive"
				},
				{
					"@type": "dcat:Distribution",
					"title": "ArcGIS GeoService",
					"format": "ArcGIS GeoServices REST API",
					"mediaType": "application/json",
					"accessURL": "https://services.arcgis.com/XTtANUDT8Va4DLwI/arcgis/rest/services/nz_territorial_authorities_and_local_boards_archive/FeatureServer/0"
				},
				{
					"@type": "dcat:Distribution",
					"title": "CSV",
					"format": "CSV",
					"mediaType": "text/csv",
					"accessURL": "https://www.pacificgeoportal.com/api/download/v1/items/240bca66c4f242c7be1355621c83fd57/csv?layers=0"
				},
				{
					"@type": "dcat:Distribution",
					"title": "Shapefile",
					"format": "ZIP",
					"mediaType": "application/zip",
					"accessURL": "https://www.pacificgeoportal.com/api/download/v1/items/240bca66c4f242c7be1355621c83fd57/shapefile?layers=0"
				},
				{
					"@type": "dcat:Distribution",
					"title": "GeoJSON",
					"format": "GeoJSON",
					"mediaType": "application/vnd.geo+json",
					"accessURL": "https://www.pacificgeoportal.com/api/download/v1/items/240bca66c4f242c7be1355621c83fd57/geojson?layers=0"
				},
				{
					"@type": "dcat:Distribution",
					"title": "KML",
					"format": "KML",
					"mediaType": "application/vnd.google-earth.kml+xml",
					"accessURL": "https://www.pacificgeoportal.com/api/download/v1/items/240bca66c4f242c7be1355621c83fd57/kml?layers=0"
				},
				{
					"@type": "dcat:Distribution",
					"title": "File Geodatabase",
					"format": "ZIP",
					"mediaType": "application/zip",
					"accessURL": "https://www.pacificgeoportal.com/api/download/v1/items/240bca66c4f242c7be1355621c83fd57/filegdb?layers=0"
				},
				{
					"@type": "dcat:Distribution",
					"title": "Feature Collection",
					"format": "TXT",
					"mediaType": "text/plain",
					"accessURL": "https://www.pacificgeoportal.com/api/download/v1/items/240bca66c4f242c7be1355621c83fd57/featureCollection?layers=0"
				},
				{
					"@type": "dcat:Distribution",
					"title": "Excel",
					"format": "XLSX",
					"mediaType": "application/vnd.ms-excel",
					"accessURL": "https://www.pacificgeoportal.com/api/download/v1/items/240bca66c4f242c7be1355621c83fd57/excel?layers=0"
				},
				{
					"@type": "dcat:Distribution",
					"title": "GeoPackage",
					"format": "GPKG",
					"mediaType": "application/geopackage+sqlite3",
					"accessURL": "https://www.pacificgeoportal.com/api/download/v1/items/240bca66c4f242c7be1355621c83fd57/geoPackage?layers=0"
				},
				{
					"@type": "dcat:Distribution",
					"title": "SQLite Geodatabase",
					"format": "GDB",
					"mediaType": "application/geopackage+sqlite3",
					"accessURL": "https://www.pacificgeoportal.com/api/download/v1/items/240bca66c4f242c7be1355621c83fd57/sqlite?layers=0"
				}
			],
			"theme": [
				"geospatial"
			]
		},
		{
			"@type": "dcat:Dataset",
			"identifier": "https://www.arcgis.com/home/item.html?id=725ccdca733d49268ff6a707d20cf14e&sublayer=0",
			"landingPage": "https://www.pacificgeoportal.com/datasets/eaglegis::nz-subdivisions-archive",
			"title": "NZ Subdivisions - Archive",
			"description": "<p><span style='font-size:medium;'><font style='font-family:&quot;Avenir Next W01&quot;, &quot;Avenir Next W00&quot;, &quot;Avenir Next&quot;, Avenir, &quot;Helvetica Neue&quot;, Helvetica, Arial, sans-serif !important;'>Topicality:&nbsp;01-01-2026</font></span></p><div><p><span style='font-size:medium;'><font style='font-family:&quot;Avenir Next W01&quot;, &quot;Avenir Next W00&quot;, &quot;Avenir Next&quot;, Avenir, &quot;Helvetica Neue&quot;, Helvetica, Arial, sans-serif !important; font-size:17px;'>Projection: New Zealand Transverse Mercator (NZTM)</font></span></p><div style='font-family:&quot;Avenir Next W01&quot;, &quot;Avenir Next W00&quot;, &quot;Avenir Next&quot;, Avenir, &quot;Helvetica Neue&quot;, Helvetica, Arial, sans-serif !important; font-size:17px;'><span style='font-family:Avenir Next W01, Avenir Next W00, Avenir Next, Avenir, Helvetica Neue, Helvetica, Arial, sans-serif; font-size:medium;'>This layer contains the archive of the </span><span style='font-family:&quot;Avenir Next W01&quot;, &quot;Avenir Next W00&quot;, &quot;Avenir Next&quot;, Avenir, &quot;Helvetica Neue&quot;, sans-serif; font-size:medium;'>Territorial Authority Subdivision boundaries</span><span style='font-family:&quot;Avenir Next W01&quot;, &quot;Avenir Next W00&quot;, &quot;Avenir Next&quot;, Avenir, &quot;Helvetica Neue&quot;, Helvetica, Arial, sans-serif; font-size:medium;'> </span><span style='font-size:medium;'>as defined by the regional councils and Local Government Commission but maintained by Stats NZ (the custodian).</span><span style='font-family:Avenir Next W01, Avenir Next W00, Avenir Next, Avenir, Helvetica Neue, Helvetica, Arial, sans-serif; font-size:medium;'>&nbsp;</span></div><div style='font-family:&quot;Avenir Next W01&quot;, &quot;Avenir Next W00&quot;, &quot;Avenir Next&quot;, Avenir, &quot;Helvetica Neue&quot;, Helvetica, Arial, sans-serif !important; font-size:17px;'>&nbsp;</div><div><div><span style='font-family:Avenir Next W01, Avenir Next W00, Avenir Next, Avenir, Helvetica Neue, Helvetica, Arial, sans-serif; font-size:medium;'>Subdivisions are set up under the Local Government Act 2002 and Local Electoral Act 2001. A subdivision is a division of a community or local board area for electoral purposes.</span></div><div>&nbsp;</div><div><span style='font-family:Avenir Next W01, Avenir Next W00, Avenir Next, Avenir, Helvetica Neue, Helvetica, Arial, sans-serif; font-size:medium;'>Subdivisions are defined at meshblock level, and do not coincide with the&nbsp; statistical area 1 (SA1) geography or the statistical area 2 (SA2) geography. A&nbsp; number of territorial authorities do not have subdivisions, and if they do, the&nbsp; subdivisions do not necessarily cover the whole territorial authority area.&nbsp; Subdivisions nest within community or local boards. Where a community or&nbsp; local board is divided into subdivisions all of the community or local board area&nbsp; must be included in a subdivision.</span><br />&nbsp;</div><div><span style='font-family:Avenir Next W01, Avenir Next W00, Avenir Next, Avenir, Helvetica Neue, Helvetica, Arial, sans-serif; font-size:medium;'>Subdivisions are numbered based on their corresponding territorial authority. Each subdivision has a unique five-digit number. The first three digits refer to the territorial authority that the subdivision lies within. The following two digits are sequential, and represent the number of subdivisions within the territorial authority. For example, Southland District (073) has two subdivisions numbered 07301 and 07302. The rest of the district is not represented by a subdivision and is coded 07399 (Area Outside Subdivision).</span><br />&nbsp;</div><div><p><span style='font-family:Avenir Next W01, Avenir Next W00, Avenir Next, Avenir, Helvetica Neue, Helvetica, Arial, sans-serif; font-size:medium;'>This layer get updated yearly with the latest boundary data.<font style='font-family:&quot;Avenir Next W01&quot;, &quot;Avenir Next W00&quot;, &quot;Avenir Next&quot;, Avenir, &quot;Helvetica Neue&quot;, Helvetica, Arial, sans-serif;'> You can use this layer when you need any year of boundary data in your map. By setting a filter on the dataset year you can filter on specific year of the dataset.</font></span></p><div><span style='font-family:Avenir Next W01, Avenir Next W00, Avenir Next, Avenir, Helvetica Neue, Helvetica, Arial, sans-serif; font-size:medium;'>For information about the fields in this dataset go to the Data tab.</span></div><div>&nbsp;</div><div><span style='font-family:Avenir Next W01, Avenir Next W00, Avenir Next, Avenir, Helvetica Neue, Helvetica, Arial, sans-serif; font-size:medium;'>The layer is further generalised by Eagle Technology for improved performance on the web,&nbsp;</span><span style='font-family:&quot;Avenir Next W01&quot;, &quot;Avenir Next W00&quot;, &quot;Avenir Next&quot;, Avenir, &quot;Helvetica Neue&quot;, sans-serif; font-size:medium;'>therefore it doesn't fully represent the official boundaries.</span></div><div>&nbsp;</div><div><span style='font-family:Avenir Next W01, Avenir Next W00, Avenir Next, Avenir, Helvetica Neue, Helvetica, Arial, sans-serif; font-size:medium;'><font style='font-family:&quot;Avenir Next W01&quot;, &quot;Avenir Next W00&quot;, &quot;Avenir Next&quot;, Avenir, &quot;Helvetica Neue&quot;, Helvetica, Arial, sans-serif;'>If you only need the latest boundary data in your map you can use the </font></span><a target='_blank' href='https://www.arcgis.com/home/item.html?id=4f0cb6eb82ea4a12a3a749067b6ee1fd' rel='nofollow ugc noopener noreferrer'><span style='font-family:Avenir Next W01, Avenir Next W00, Avenir Next, Avenir, Helvetica Neue, Helvetica, Arial, sans-serif; font-size:medium;'>current version</span></a><span style='font-family:Avenir Next W01, Avenir Next W00, Avenir Next, Avenir, Helvetica Neue, Helvetica, Arial, sans-serif; font-size:medium;'><font style='font-family:&quot;Avenir Next W01&quot;, &quot;Avenir Next W00&quot;, &quot;Avenir Next&quot;, Avenir, &quot;Helvetica Neue&quot;, Helvetica, Arial, sans-serif;'> of this dataset. All the current versions of Stats NZ Boundary layers can be found </font></span><a target='_blank' href='https://www.arcgis.com/home/group.html?id=b22e4f0012a8426dac21cd3d02f25c67' rel='nofollow ugc noopener noreferrer'><span style='font-family:Avenir Next W01, Avenir Next W00, Avenir Next, Avenir, Helvetica Neue, Helvetica, Arial, sans-serif; font-size:medium;'><font style='font-family:&quot;Avenir Next W01&quot;, &quot;Avenir Next W00&quot;, &quot;Avenir Next&quot;, Avenir, &quot;Helvetica Neue&quot;, Helvetica, Arial, sans-serif;'>here</font></span></a><span style='font-family:Avenir Next W01, Avenir Next W00, Avenir Next, Avenir, Helvetica Neue, Helvetica, Arial, sans-serif; font-size:medium;'><font style='font-family:&quot;Avenir Next W01&quot;, &quot;Avenir Next W00&quot;, &quot;Avenir Next&quot;, Avenir, &quot;Helvetica Neue&quot;, Helvetica, Arial, sans-serif;'>.</font></span></div><div>&nbsp;</div><div><span style='font-family:Avenir Next W01, Avenir Next W00, Avenir Next, Avenir, Helvetica Neue, Helvetica, Arial, sans-serif; font-size:medium;'><font style='font-family:&quot;Avenir Next W01&quot;, &quot;Avenir Next W00&quot;, &quot;Avenir Next&quot;, Avenir, &quot;Helvetica Neue&quot;, Helvetica, Arial, sans-serif;'>The official dataset can be found on&nbsp;</font></span><a target='_blank' href='https://datafinder.stats.govt.nz/data/category/annual-boundaries/2022/' rel='nofollow ugc noopener noreferrer'><span style='font-family:Avenir Next W01, Avenir Next W00, Avenir Next, Avenir, Helvetica Neue, Helvetica, Arial, sans-serif; font-size:medium;'>https://datafinder.stats.govt.nz.</span></a></div><div style='font-size:17px;'>&nbsp;</div><div style='font-size:17px;'><div><span style='color:#2f4f4f; font-family:Avenir Next W01, Avenir Next W00, Avenir Next, Avenir, Helvetica Neue, Helvetica, Arial, sans-serif; font-size:medium;'>This layer is offered by Eagle Technology (Official Esri Distributor). Eagle Technology offers services that can be used in the ArcGIS platform. The Content team at Eagle Technology updates the layers on a regular basis and regularly adds new content to the Living Atlas. By using this content and combining it with other data you can create new information products quickly and easily.</span></div><div>&nbsp;</div><div><span style='color:#2f4f4f; font-family:Avenir Next W01, Avenir Next W00, Avenir Next, Avenir, Helvetica Neue, Helvetica, Arial, sans-serif; font-size:medium;'>If you have any questions or comments about the content, please let us now&nbsp; at&nbsp;</span><a style='color:rgb(0, 121, 193); text-decoration-line:none;' href='mailto:livingatlas@eagle.co.nz' target='_blank' rel='nofollow ugc noopener noreferrer'><span style='font-family:Avenir Next W01, Avenir Next W00, Avenir Next, Avenir, Helvetica Neue, Helvetica, Arial, sans-serif; font-size:medium;'>livingatlas@eagle.co.nz</span></a></div></div></div></div></div>",
			"keyword": [
				"Boundary",
				"Boundaries",
				"New zealand",
				"Statistics New Zealand",
				"StatsNZ",
				"Eagle technology",
				"Nz",
				"Content",
				"Kiwi",
				"eaglegis"
			],
			"issued": "2023-01-18T00:51:56.000Z",
			"modified": "2025-12-19T00:26:17.500Z",
			"publisher": {
				"name": "Eagle Technology Group Ltd"
			},
			"contactPoint": {
				"@type": "vcard:Contact",
				"fn": "eaglegis",
				"hasEmail": "mailto:ts@eaglegis.co.nz"
			},
			"accessLevel": "public",
			"spatial": "166.2620,-47.2230,-177.6189,-33.7734",
			"license": "https://creativecommons.org/licenses/by/4.0",
			"distribution": [
				{
					"@type": "dcat:Distribution",
					"title": "ArcGIS Hub Dataset",
					"format": "Web Page",
					"mediaType": "text/html",
					"accessURL": "https://www.pacificgeoportal.com/datasets/eaglegis::nz-subdivisions-archive"
				},
				{
					"@type": "dcat:Distribution",
					"title": "ArcGIS GeoService",
					"format": "ArcGIS GeoServices REST API",
					"mediaType": "application/json",
					"accessURL": "https://services.arcgis.com/XTtANUDT8Va4DLwI/arcgis/rest/services/nz_subdivisions_archive/FeatureServer/0"
				},
				{
					"@type": "dcat:Distribution",
					"title": "CSV",
					"format": "CSV",
					"mediaType": "text/csv",
					"accessURL": "https://www.pacificgeoportal.com/api/download/v1/items/725ccdca733d49268ff6a707d20cf14e/csv?layers=0"
				},
				{
					"@type": "dcat:Distribution",
					"title": "Shapefile",
					"format": "ZIP",
					"mediaType": "application/zip",
					"accessURL": "https://www.pacificgeoportal.com/api/download/v1/items/725ccdca733d49268ff6a707d20cf14e/shapefile?layers=0"
				},
				{
					"@type": "dcat:Distribution",
					"title": "GeoJSON",
					"format": "GeoJSON",
					"mediaType": "application/vnd.geo+json",
					"accessURL": "https://www.pacificgeoportal.com/api/download/v1/items/725ccdca733d49268ff6a707d20cf14e/geojson?layers=0"
				},
				{
					"@type": "dcat:Distribution",
					"title": "KML",
					"format": "KML",
					"mediaType": "application/vnd.google-earth.kml+xml",
					"accessURL": "https://www.pacificgeoportal.com/api/download/v1/items/725ccdca733d49268ff6a707d20cf14e/kml?layers=0"
				},
				{
					"@type": "dcat:Distribution",
					"title": "File Geodatabase",
					"format": "ZIP",
					"mediaType": "application/zip",
					"accessURL": "https://www.pacificgeoportal.com/api/download/v1/items/725ccdca733d49268ff6a707d20cf14e/filegdb?layers=0"
				},
				{
					"@type": "dcat:Distribution",
					"title": "Feature Collection",
					"format": "TXT",
					"mediaType": "text/plain",
					"accessURL": "https://www.pacificgeoportal.com/api/download/v1/items/725ccdca733d49268ff6a707d20cf14e/featureCollection?layers=0"
				},
				{
					"@type": "dcat:Distribution",
					"title": "Excel",
					"format": "XLSX",
					"mediaType": "application/vnd.ms-excel",
					"accessURL": "https://www.pacificgeoportal.com/api/download/v1/items/725ccdca733d49268ff6a707d20cf14e/excel?layers=0"
				},
				{
					"@type": "dcat:Distribution",
					"title": "GeoPackage",
					"format": "GPKG",
					"mediaType": "application/geopackage+sqlite3",
					"accessURL": "https://www.pacificgeoportal.com/api/download/v1/items/725ccdca733d49268ff6a707d20cf14e/geoPackage?layers=0"
				},
				{
					"@type": "dcat:Distribution",
					"title": "SQLite Geodatabase",
					"format": "GDB",
					"mediaType": "application/geopackage+sqlite3",
					"accessURL": "https://www.pacificgeoportal.com/api/download/v1/items/725ccdca733d49268ff6a707d20cf14e/sqlite?layers=0"
				}
			],
			"theme": [
				"geospatial"
			]
		},
		{
			"@type": "dcat:Dataset",
			"identifier": "https://www.arcgis.com/home/item.html?id=a3422b4ed51645919308d5f595770eff&sublayer=0",
			"landingPage": "https://www.pacificgeoportal.com/datasets/eaglegis::nz-statistical-areas-2-archive",
			"title": "NZ Statistical Areas 2 - Archive",
			"description": "<div style='font-family:&quot;Avenir Next W01&quot;, &quot;Avenir Next W00&quot;, &quot;Avenir Next&quot;, Avenir, &quot;Helvetica Neue&quot;, Helvetica, Arial, sans-serif !important; font-size:17px;'><span style='font-size:medium;'>Topicality: 01-01-<font style='font-family:&quot;Avenir Next W01&quot;, &quot;Avenir Next W00&quot;, &quot;Avenir Next&quot;, Avenir, &quot;Helvetica Neue&quot;, Helvetica, Arial, sans-serif !important;'>2026</font></span></div><div style='font-family:&quot;Avenir Next W01&quot;, &quot;Avenir Next W00&quot;, &quot;Avenir Next&quot;, Avenir, &quot;Helvetica Neue&quot;, Helvetica, Arial, sans-serif !important; font-size:17px;'><div><span style='font-size:medium;'>Projection: New Zealand Transverse Mercator (NZTM)</span><br />&nbsp;</div></div><div style='font-family:&quot;Avenir Next W01&quot;, &quot;Avenir Next W00&quot;, &quot;Avenir Next&quot;, Avenir, &quot;Helvetica Neue&quot;, Helvetica, Arial, sans-serif !important; font-size:17px;'><span style='font-size:medium;'>This layer contains the archive of statistical area 2 (SA2) boundaries maintained by Stats NZ and as defined by Stats NZ.</span><br />&nbsp;</div><div style='font-family:&quot;Avenir Next W01&quot;, &quot;Avenir Next W00&quot;, &quot;Avenir Next&quot;, Avenir, &quot;Helvetica Neue&quot;, Helvetica, Arial, sans-serif !important; font-size:17px;'><span style='font-size:medium;'>Statistical area 2 (SA2) is a new output geography that provides higher aggregations of population data than can be provided at the&nbsp;</span><a target='_blank' href='https://datafinder.stats.govt.nz/data/category/annual-boundaries/2022/' rel='nofollow ugc noopener noreferrer'><span style='font-size:medium;'>statistical area 1 (SA1)</span></a><span style='font-size:medium;'>&nbsp;level. The SA2 geography aims to reflect communities that interact together socially and economically. In populated areas, SA2s generally contain similar sized populations.</span><br />&nbsp;</div><p><span style='font-family:&quot;Avenir Next W01&quot;, &quot;Avenir Next W00&quot;, &quot;Avenir Next&quot;, Avenir, &quot;Helvetica Neue&quot;, sans-serif; font-size:medium;'><font style='font-family:&quot;Avenir Next W01&quot;, &quot;Avenir Next W00&quot;, &quot;Avenir Next&quot;, Avenir, &quot;Helvetica Neue&quot;, Helvetica, Arial, sans-serif !important;'>This layer contains the definitive set of statistical area 2 (SA2) boundaries for 2021 as defined by Stats NZ.&nbsp;</font></span><span style='font-family:&quot;Avenir Next W01&quot;, &quot;Avenir Next W00&quot;, &quot;Avenir Next&quot;, Avenir, &quot;Helvetica Neue&quot;, Helvetica, Arial, sans-serif; font-size:17px;'>Statistical area 2 (SA2) is a new output geography that provides higher aggregations of population data than can be provided at the statistical area 1 (SA1) level. The SA2 geography aims to reflect communities that interact together socially and economically. In populated areas, SA2s generally contain similar sized populations.</span></p><p><span style='font-family:Avenir Next W01, Avenir Next W00, Avenir Next, Avenir, Helvetica Neue, Helvetica, Arial, sans-serif; font-size:medium;'>This layer get updated yearly with the latest boundary data.<font style='font-family:&quot;Avenir Next W01&quot;, &quot;Avenir Next W00&quot;, &quot;Avenir Next&quot;, Avenir, &quot;Helvetica Neue&quot;, Helvetica, Arial, sans-serif;'> You can use this layer when you need any year of boundary data in your map. By setting a filter on the dataset year you can filter on specific year of the dataset.</font></span></p><div><span style='font-family:Avenir Next W01, Avenir Next W00, Avenir Next, Avenir, Helvetica Neue, Helvetica, Arial, sans-serif; font-size:medium;'>For information about the fields in this dataset go to the Data tab.</span></div><div>&nbsp;</div><div><span style='font-family:Avenir Next W01, Avenir Next W00, Avenir Next, Avenir, Helvetica Neue, Helvetica, Arial, sans-serif; font-size:medium;'>The layer is further generalised by Eagle Technology for improved performance on the web,&nbsp;</span><span style='font-family:&quot;Avenir Next W01&quot;, &quot;Avenir Next W00&quot;, &quot;Avenir Next&quot;, Avenir, &quot;Helvetica Neue&quot;, sans-serif; font-size:medium;'>therefore it doesn't fully represent the official boundaries.</span></div><div>&nbsp;</div><div><span style='font-family:Avenir Next W01, Avenir Next W00, Avenir Next, Avenir, Helvetica Neue, Helvetica, Arial, sans-serif; font-size:medium;'><font style='font-family:&quot;Avenir Next W01&quot;, &quot;Avenir Next W00&quot;, &quot;Avenir Next&quot;, Avenir, &quot;Helvetica Neue&quot;, Helvetica, Arial, sans-serif;'>If you only need the latest boundary data in your map you can use the </font></span><a target='_blank' href='https://www.arcgis.com/home/item.html?id=6b4508cfd8c4445fb5074aacd13eb4b8' rel='nofollow ugc noopener noreferrer'><span style='font-family:Avenir Next W01, Avenir Next W00, Avenir Next, Avenir, Helvetica Neue, Helvetica, Arial, sans-serif; font-size:medium;'>current version</span></a><span style='font-family:Avenir Next W01, Avenir Next W00, Avenir Next, Avenir, Helvetica Neue, Helvetica, Arial, sans-serif; font-size:medium;'><font style='font-family:&quot;Avenir Next W01&quot;, &quot;Avenir Next W00&quot;, &quot;Avenir Next&quot;, Avenir, &quot;Helvetica Neue&quot;, Helvetica, Arial, sans-serif;'> of this dataset. All the current versions of Stats NZ Boundary layers can be found </font></span><a target='_blank' href='https://www.arcgis.com/home/group.html?id=b22e4f0012a8426dac21cd3d02f25c67' rel='nofollow ugc noopener noreferrer'><span style='font-family:Avenir Next W01, Avenir Next W00, Avenir Next, Avenir, Helvetica Neue, Helvetica, Arial, sans-serif; font-size:medium;'><font style='font-family:&quot;Avenir Next W01&quot;, &quot;Avenir Next W00&quot;, &quot;Avenir Next&quot;, Avenir, &quot;Helvetica Neue&quot;, Helvetica, Arial, sans-serif;'>here</font></span></a><span style='font-family:Avenir Next W01, Avenir Next W00, Avenir Next, Avenir, Helvetica Neue, Helvetica, Arial, sans-serif; font-size:medium;'><font style='font-family:&quot;Avenir Next W01&quot;, &quot;Avenir Next W00&quot;, &quot;Avenir Next&quot;, Avenir, &quot;Helvetica Neue&quot;, Helvetica, Arial, sans-serif;'>.</font></span></div><div>&nbsp;</div><div><span style='font-family:Avenir Next W01, Avenir Next W00, Avenir Next, Avenir, Helvetica Neue, Helvetica, Arial, sans-serif; font-size:medium;'><font style='font-family:&quot;Avenir Next W01&quot;, &quot;Avenir Next W00&quot;, &quot;Avenir Next&quot;, Avenir, &quot;Helvetica Neue&quot;, Helvetica, Arial, sans-serif;'>The official dataset can be found on&nbsp;</font></span><a target='_blank' href='https://datafinder.stats.govt.nz/data/category/annual-boundaries/2022/' rel='nofollow ugc noopener noreferrer'><span style='font-family:Avenir Next W01, Avenir Next W00, Avenir Next, Avenir, Helvetica Neue, Helvetica, Arial, sans-serif; font-size:medium;'>https://datafinder.stats.govt.nz.</span></a></div><div style='font-family:&quot;Avenir Next W01&quot;, &quot;Avenir Next W00&quot;, &quot;Avenir Next&quot;, Avenir, &quot;Helvetica Neue&quot;, Helvetica, Arial, sans-serif !important; font-size:17px;'>&nbsp;</div><div style='font-family:&quot;Avenir Next W01&quot;, &quot;Avenir Next W00&quot;, &quot;Avenir Next&quot;, Avenir, &quot;Helvetica Neue&quot;, Helvetica, Arial, sans-serif !important; font-size:17px;'><div><span style='color:#2f4f4f; font-size:medium;'>This layer is offered by Eagle Technology (Official Esri Distributor). Eagle Technology offers services that can be used in the ArcGIS platform. The Content team at Eagle Technology updates the layers on a regular basis and regularly adds new content to the Living Atlas. By using this content and combining it with other data you can create new information products quickly and easily.</span></div><div>&nbsp;</div><div><span style='color:#2f4f4f; font-size:medium;'>If you have any questions or comments about the content, please let us now&nbsp; at&nbsp;</span><a style='color:rgb(0, 121, 193); text-decoration-line:none;' href='mailto:livingatlas@eagle.co.nz' target='_blank' rel='nofollow ugc noopener noreferrer'><span style='font-size:medium;'>livingatlas@eagle.co.nz</span></a><span style='font-size:medium;'>.</span></div></div>",
			"keyword": [
				"Boundary",
				"Boundaries",
				"New zealand",
				"Statistics New Zealand",
				"StatsNZ",
				"Eagle technology",
				"Nz",
				"Content",
				"Kiwi",
				"eaglegis"
			],
			"issued": "2023-01-18T00:50:53.000Z",
			"modified": "2025-12-19T00:26:13.026Z",
			"publisher": {
				"name": "Eagle Technology Group Ltd"
			},
			"contactPoint": {
				"@type": "vcard:Contact",
				"fn": "eaglegis",
				"hasEmail": "mailto:ts@eaglegis.co.nz"
			},
			"accessLevel": "public",
			"spatial": "166.2620,-47.2230,-177.6189,-33.7734",
			"license": "https://creativecommons.org/licenses/by/4.0",
			"distribution": [
				{
					"@type": "dcat:Distribution",
					"title": "ArcGIS Hub Dataset",
					"format": "Web Page",
					"mediaType": "text/html",
					"accessURL": "https://www.pacificgeoportal.com/datasets/eaglegis::nz-statistical-areas-2-archive"
				},
				{
					"@type": "dcat:Distribution",
					"title": "ArcGIS GeoService",
					"format": "ArcGIS GeoServices REST API",
					"mediaType": "application/json",
					"accessURL": "https://services.arcgis.com/XTtANUDT8Va4DLwI/arcgis/rest/services/nz_statistical_areas_2_archive/FeatureServer/0"
				},
				{
					"@type": "dcat:Distribution",
					"title": "CSV",
					"format": "CSV",
					"mediaType": "text/csv",
					"accessURL": "https://www.pacificgeoportal.com/api/download/v1/items/a3422b4ed51645919308d5f595770eff/csv?layers=0"
				},
				{
					"@type": "dcat:Distribution",
					"title": "Shapefile",
					"format": "ZIP",
					"mediaType": "application/zip",
					"accessURL": "https://www.pacificgeoportal.com/api/download/v1/items/a3422b4ed51645919308d5f595770eff/shapefile?layers=0"
				},
				{
					"@type": "dcat:Distribution",
					"title": "GeoJSON",
					"format": "GeoJSON",
					"mediaType": "application/vnd.geo+json",
					"accessURL": "https://www.pacificgeoportal.com/api/download/v1/items/a3422b4ed51645919308d5f595770eff/geojson?layers=0"
				},
				{
					"@type": "dcat:Distribution",
					"title": "KML",
					"format": "KML",
					"mediaType": "application/vnd.google-earth.kml+xml",
					"accessURL": "https://www.pacificgeoportal.com/api/download/v1/items/a3422b4ed51645919308d5f595770eff/kml?layers=0"
				},
				{
					"@type": "dcat:Distribution",
					"title": "File Geodatabase",
					"format": "ZIP",
					"mediaType": "application/zip",
					"accessURL": "https://www.pacificgeoportal.com/api/download/v1/items/a3422b4ed51645919308d5f595770eff/filegdb?layers=0"
				},
				{
					"@type": "dcat:Distribution",
					"title": "Feature Collection",
					"format": "TXT",
					"mediaType": "text/plain",
					"accessURL": "https://www.pacificgeoportal.com/api/download/v1/items/a3422b4ed51645919308d5f595770eff/featureCollection?layers=0"
				},
				{
					"@type": "dcat:Distribution",
					"title": "Excel",
					"format": "XLSX",
					"mediaType": "application/vnd.ms-excel",
					"accessURL": "https://www.pacificgeoportal.com/api/download/v1/items/a3422b4ed51645919308d5f595770eff/excel?layers=0"
				},
				{
					"@type": "dcat:Distribution",
					"title": "GeoPackage",
					"format": "GPKG",
					"mediaType": "application/geopackage+sqlite3",
					"accessURL": "https://www.pacificgeoportal.com/api/download/v1/items/a3422b4ed51645919308d5f595770eff/geoPackage?layers=0"
				},
				{
					"@type": "dcat:Distribution",
					"title": "SQLite Geodatabase",
					"format": "GDB",
					"mediaType": "application/geopackage+sqlite3",
					"accessURL": "https://www.pacificgeoportal.com/api/download/v1/items/a3422b4ed51645919308d5f595770eff/sqlite?layers=0"
				}
			],
			"theme": [
				"geospatial"
			]
		},
		{
			"@type": "dcat:Dataset",
			"identifier": "https://www.arcgis.com/home/item.html?id=d350fe4ba9364ae89c783eb5a9f0290f&sublayer=0",
			"landingPage": "https://www.pacificgeoportal.com/datasets/eaglegis::nz-meshblocks-archive",
			"title": "NZ Meshblocks - Archive",
			"description": "<div><span style='font-size:medium;'>Topicality: 01-01-<font style='font-family:&quot;Avenir Next W01&quot;, &quot;Avenir Next W00&quot;, &quot;Avenir Next&quot;, Avenir, &quot;Helvetica Neue&quot;, Helvetica, Arial, sans-serif !important;'>2026</font></span></div><div><div style='font-family:&quot;Avenir Next W01&quot;, &quot;Avenir Next W00&quot;, &quot;Avenir Next&quot;, Avenir, &quot;Helvetica Neue&quot;, Helvetica, Arial, sans-serif !important; font-size:17px;'><span style='font-size:medium;'>Projection: New Zealand Transverse Mercator (NZTM)</span><br />&nbsp;</div></div><div><span style='font-size:medium;'><span>This layer contains the archive of the meshblock boundaries maintained by Stats NZ as defined by Stats NZ.</span>&nbsp;</span><br />&nbsp;</div><div><span style='font-size:medium;'>Stats NZ maintains an annual meshblock pattern for collecting and producing statistical data. This allows data to be compared over time. A meshblock is the smallest geographic unit for which statistical data is collected and processed by Stats NZ. A meshblock is defined by a geographic area, which can vary in size from part of a city block to a large area of rural land.</span></div><div>&nbsp;</div><p><span style='font-family:Avenir Next W01, Avenir Next W00, Avenir Next, Avenir, Helvetica Neue, Helvetica, Arial, sans-serif; font-size:medium;'>This layer get updated yearly with the latest boundary data.<font style='font-family:&quot;Avenir Next W01&quot;, &quot;Avenir Next W00&quot;, &quot;Avenir Next&quot;, Avenir, &quot;Helvetica Neue&quot;, Helvetica, Arial, sans-serif;'> You can use this layer when you need any year of boundary data in your map. By setting a filter on the dataset year you can filter on specific year of the dataset.</font></span></p><div><span style='font-family:Avenir Next W01, Avenir Next W00, Avenir Next, Avenir, Helvetica Neue, Helvetica, Arial, sans-serif; font-size:medium;'>For information about the fields in this dataset go to the Data tab.</span></div><div>&nbsp;</div><div><span style='font-family:Avenir Next W01, Avenir Next W00, Avenir Next, Avenir, Helvetica Neue, Helvetica, Arial, sans-serif; font-size:medium;'>The layer is further generalised by Eagle Technology for improved performance on the web,&nbsp;</span><span style='font-family:&quot;Avenir Next W01&quot;, &quot;Avenir Next W00&quot;, &quot;Avenir Next&quot;, Avenir, &quot;Helvetica Neue&quot;, sans-serif; font-size:medium;'>therefore it doesn't fully represent the official boundaries.</span></div><div>&nbsp;</div><div><span style='font-family:Avenir Next W01, Avenir Next W00, Avenir Next, Avenir, Helvetica Neue, Helvetica, Arial, sans-serif; font-size:medium;'><font style='font-family:&quot;Avenir Next W01&quot;, &quot;Avenir Next W00&quot;, &quot;Avenir Next&quot;, Avenir, &quot;Helvetica Neue&quot;, Helvetica, Arial, sans-serif;'>If you only need the latest boundary data in your map you can use the </font></span><a target='_blank' href='https://www.arcgis.com/home/item.html?id=7fcb716dbf304397a8ee68e92d8fedae' rel='nofollow ugc noopener noreferrer'><span style='font-family:Avenir Next W01, Avenir Next W00, Avenir Next, Avenir, Helvetica Neue, Helvetica, Arial, sans-serif; font-size:medium;'>current version</span></a><span style='font-family:Avenir Next W01, Avenir Next W00, Avenir Next, Avenir, Helvetica Neue, Helvetica, Arial, sans-serif; font-size:medium;'><font style='font-family:&quot;Avenir Next W01&quot;, &quot;Avenir Next W00&quot;, &quot;Avenir Next&quot;, Avenir, &quot;Helvetica Neue&quot;, Helvetica, Arial, sans-serif;'> of this dataset. All the current versions of Stats NZ Boundary layers can be found </font></span><a target='_blank' href='https://www.arcgis.com/home/group.html?id=b22e4f0012a8426dac21cd3d02f25c67' rel='nofollow ugc noopener noreferrer'><span style='font-family:Avenir Next W01, Avenir Next W00, Avenir Next, Avenir, Helvetica Neue, Helvetica, Arial, sans-serif; font-size:medium;'><font style='font-family:&quot;Avenir Next W01&quot;, &quot;Avenir Next W00&quot;, &quot;Avenir Next&quot;, Avenir, &quot;Helvetica Neue&quot;, Helvetica, Arial, sans-serif;'>here</font></span></a><span style='font-family:Avenir Next W01, Avenir Next W00, Avenir Next, Avenir, Helvetica Neue, Helvetica, Arial, sans-serif; font-size:medium;'><font style='font-family:&quot;Avenir Next W01&quot;, &quot;Avenir Next W00&quot;, &quot;Avenir Next&quot;, Avenir, &quot;Helvetica Neue&quot;, Helvetica, Arial, sans-serif;'>.</font></span></div><div>&nbsp;</div><div><span style='font-family:Avenir Next W01, Avenir Next W00, Avenir Next, Avenir, Helvetica Neue, Helvetica, Arial, sans-serif; font-size:medium;'><font style='font-family:&quot;Avenir Next W01&quot;, &quot;Avenir Next W00&quot;, &quot;Avenir Next&quot;, Avenir, &quot;Helvetica Neue&quot;, Helvetica, Arial, sans-serif;'>The official dataset can be found on&nbsp;</font></span><a target='_blank' href='https://datafinder.stats.govt.nz/data/category/annual-boundaries/2022/' rel='nofollow ugc noopener noreferrer'><span style='font-family:Avenir Next W01, Avenir Next W00, Avenir Next, Avenir, Helvetica Neue, Helvetica, Arial, sans-serif; font-size:medium;'>https://datafinder.stats.govt.nz.</span></a></div><div>&nbsp;</div><div><div style='font-family:&quot;Avenir Next W01&quot;, &quot;Avenir Next W00&quot;, &quot;Avenir Next&quot;, Avenir, &quot;Helvetica Neue&quot;, Helvetica, Arial, sans-serif !important; font-size:17px;'><span style='color:#2f4f4f; font-size:medium;'>This layer is offered by Eagle Technology (Official Esri Distributor). Eagle Technology offers services that can be used in the ArcGIS platform. The Content team at Eagle Technology updates the layers on a regular basis and regularly adds new content to the Living Atlas. By using this content and combining it with other data you can create new information products quickly and easily.</span></div><div style='font-family:&quot;Avenir Next W01&quot;, &quot;Avenir Next W00&quot;, &quot;Avenir Next&quot;, Avenir, &quot;Helvetica Neue&quot;, Helvetica, Arial, sans-serif !important; font-size:17px;'>&nbsp;</div><div style='font-family:&quot;Avenir Next W01&quot;, &quot;Avenir Next W00&quot;, &quot;Avenir Next&quot;, Avenir, &quot;Helvetica Neue&quot;, Helvetica, Arial, sans-serif !important; font-size:17px;'><span style='color:#2f4f4f; font-size:medium;'>If you have any questions or comments about the content, please let us now&nbsp; at&nbsp;</span><a style='color:rgb(0, 121, 193); text-decoration-line:none;' href='mailto:livingatlas@eagle.co.nz' target='_blank' rel='nofollow ugc noopener noreferrer'><span style='font-size:medium;'>livingatlas@eagle.co.nz</span></a><span style='font-size:medium;'>.</span></div></div>",
			"keyword": [
				"Boundary",
				"Boundaries",
				"New zealand",
				"Statistics New Zealand",
				"StatsNZ",
				"Eagle technology",
				"Nz",
				"Content",
				"Kiwi",
				"eaglegis"
			],
			"issued": "2023-01-18T00:43:10.000Z",
			"modified": "2025-12-19T00:26:00.865Z",
			"publisher": {
				"name": "Eagle Technology Group Ltd"
			},
			"contactPoint": {
				"@type": "vcard:Contact",
				"fn": "eaglegis",
				"hasEmail": "mailto:ts@eaglegis.co.nz"
			},
			"accessLevel": "public",
			"spatial": "166.2620,-47.2230,-177.6190,-33.7734",
			"license": "https://creativecommons.org/licenses/by/4.0",
			"distribution": [
				{
					"@type": "dcat:Distribution",
					"title": "ArcGIS Hub Dataset",
					"format": "Web Page",
					"mediaType": "text/html",
					"accessURL": "https://www.pacificgeoportal.com/datasets/eaglegis::nz-meshblocks-archive"
				},
				{
					"@type": "dcat:Distribution",
					"title": "ArcGIS GeoService",
					"format": "ArcGIS GeoServices REST API",
					"mediaType": "application/json",
					"accessURL": "https://services.arcgis.com/XTtANUDT8Va4DLwI/arcgis/rest/services/nz_meshblocks_archive/FeatureServer/0"
				},
				{
					"@type": "dcat:Distribution",
					"title": "CSV",
					"format": "CSV",
					"mediaType": "text/csv",
					"accessURL": "https://www.pacificgeoportal.com/api/download/v1/items/d350fe4ba9364ae89c783eb5a9f0290f/csv?layers=0"
				},
				{
					"@type": "dcat:Distribution",
					"title": "Shapefile",
					"format": "ZIP",
					"mediaType": "application/zip",
					"accessURL": "https://www.pacificgeoportal.com/api/download/v1/items/d350fe4ba9364ae89c783eb5a9f0290f/shapefile?layers=0"
				},
				{
					"@type": "dcat:Distribution",
					"title": "GeoJSON",
					"format": "GeoJSON",
					"mediaType": "application/vnd.geo+json",
					"accessURL": "https://www.pacificgeoportal.com/api/download/v1/items/d350fe4ba9364ae89c783eb5a9f0290f/geojson?layers=0"
				},
				{
					"@type": "dcat:Distribution",
					"title": "KML",
					"format": "KML",
					"mediaType": "application/vnd.google-earth.kml+xml",
					"accessURL": "https://www.pacificgeoportal.com/api/download/v1/items/d350fe4ba9364ae89c783eb5a9f0290f/kml?layers=0"
				},
				{
					"@type": "dcat:Distribution",
					"title": "File Geodatabase",
					"format": "ZIP",
					"mediaType": "application/zip",
					"accessURL": "https://www.pacificgeoportal.com/api/download/v1/items/d350fe4ba9364ae89c783eb5a9f0290f/filegdb?layers=0"
				},
				{
					"@type": "dcat:Distribution",
					"title": "Feature Collection",
					"format": "TXT",
					"mediaType": "text/plain",
					"accessURL": "https://www.pacificgeoportal.com/api/download/v1/items/d350fe4ba9364ae89c783eb5a9f0290f/featureCollection?layers=0"
				},
				{
					"@type": "dcat:Distribution",
					"title": "Excel",
					"format": "XLSX",
					"mediaType": "application/vnd.ms-excel",
					"accessURL": "https://www.pacificgeoportal.com/api/download/v1/items/d350fe4ba9364ae89c783eb5a9f0290f/excel?layers=0"
				},
				{
					"@type": "dcat:Distribution",
					"title": "GeoPackage",
					"format": "GPKG",
					"mediaType": "application/geopackage+sqlite3",
					"accessURL": "https://www.pacificgeoportal.com/api/download/v1/items/d350fe4ba9364ae89c783eb5a9f0290f/geoPackage?layers=0"
				},
				{
					"@type": "dcat:Distribution",
					"title": "SQLite Geodatabase",
					"format": "GDB",
					"mediaType": "application/geopackage+sqlite3",
					"accessURL": "https://www.pacificgeoportal.com/api/download/v1/items/d350fe4ba9364ae89c783eb5a9f0290f/sqlite?layers=0"
				}
			],
			"theme": [
				"geospatial"
			]
		},
		{
			"@type": "dcat:Dataset",
			"identifier": "https://www.arcgis.com/home/item.html?id=5e95349d27754b21b3068b713df63173&sublayer=0",
			"landingPage": "https://www.pacificgeoportal.com/datasets/eaglegis::nz-māori-wards-archive",
			"title": "NZ Māori Wards - Archive",
			"description": "<div><span style='font-size:medium;'><font style='font-family:&quot;Avenir Next W01&quot;, &quot;Avenir Next W00&quot;, &quot;Avenir Next&quot;, Avenir, &quot;Helvetica Neue&quot;, Helvetica, Arial, sans-serif !important;'>Topicality:&nbsp;01-01-2026</font></span></div><div><span style='font-size:17px;'><font style='font-family:&quot;Avenir Next W01&quot;, &quot;Avenir Next W00&quot;, &quot;Avenir Next&quot;, Avenir, &quot;Helvetica Neue&quot;, Helvetica, Arial, sans-serif !important; font-size:17px;'>Projection: New Zealand Transverse Mercator (NZTM)</font></span></div><div>&nbsp;</div><div style='font-family:&quot;Avenir Next W01&quot;, &quot;Avenir Next W00&quot;, &quot;Avenir Next&quot;, Avenir, &quot;Helvetica Neue&quot;, Helvetica, Arial, sans-serif !important; font-size:17px;'><span style='font-size:medium;'>This layer contains the archive of the <span>Māori </span></span><span style='font-family:&quot;Avenir Next W01&quot;, &quot;Avenir Next W00&quot;, &quot;Avenir Next&quot;, Avenir, &quot;Helvetica Neue&quot;, sans-serif; font-size:medium;'>Ward boundaries</span><span style='font-size:medium;'> as defined by the regional councils and Local Government Commission but maintained by Stats NZ (the custodian).</span></div><div style='font-family:&quot;Avenir Next W01&quot;, &quot;Avenir Next W00&quot;, &quot;Avenir Next&quot;, Avenir, &quot;Helvetica Neue&quot;, Helvetica, Arial, sans-serif !important; font-size:17px;'>&nbsp;</div><div style='font-family:&quot;Avenir Next W01&quot;, &quot;Avenir Next W00&quot;, &quot;Avenir Next&quot;, Avenir, &quot;Helvetica Neue&quot;, Helvetica, Arial, sans-serif !important; font-size:17px;'><span style='font-size:medium;'>The Local Electoral Act 2001 provides that Māori wards may be established in territorial authorities. The statutory provisions for establishing Māori wards are set out in sections 19Z to 19ZH of the Local Electoral Act 2001. The first Māori ward was established by representation review in 2019 and appears in the 2021 geographic boundaries released by Stats NZ. The first Māori ward to be created is Wairoa Māori ward (02901) in the Wairoa District. Māori ward boundaries are defined at meshblock level.&nbsp;</span><br />&nbsp;</div><div style='font-family:&quot;Avenir Next W01&quot;, &quot;Avenir Next W00&quot;, &quot;Avenir Next&quot;, Avenir, &quot;Helvetica Neue&quot;, Helvetica, Arial, sans-serif !important; font-size:17px;'><p><span style='font-size:medium;'>This layer get updated yearly with the latest boundary data.<font style='font-family:&quot;Avenir Next W01&quot;, &quot;Avenir Next W00&quot;, &quot;Avenir Next&quot;, Avenir, &quot;Helvetica Neue&quot;, Helvetica, Arial, sans-serif;'> You can use this layer when you need any year of boundary data in your map. By setting a filter on the dataset year you can filter on specific year of the dataset.</font></span></p><div><span style='font-size:medium;'>For information about the fields in this dataset go to the Data tab.</span></div><div>&nbsp;</div><div><span style='font-size:medium;'>The layer is further generalised by Eagle Technology for improved performance on the web,&nbsp;</span><span style='font-family:&quot;Avenir Next W01&quot;, &quot;Avenir Next W00&quot;, &quot;Avenir Next&quot;, Avenir, &quot;Helvetica Neue&quot;, sans-serif; font-size:medium;'>therefore it doesn't fully represent the official boundaries.</span></div><div>&nbsp;</div><p><span style='font-size:medium;'><font style='font-family:&quot;Avenir Next W01&quot;, &quot;Avenir Next W00&quot;, &quot;Avenir Next&quot;, Avenir, &quot;Helvetica Neue&quot;, Helvetica, Arial, sans-serif;'>If you only need the latest boundary data in your map you can use the </font></span><a target='_blank' href='https://www.arcgis.com/home/item.html?id=dc1888b123da42b19f09d96608fc3b0e' rel='nofollow ugc noopener noreferrer'>current version</a><span style='font-size:medium;'><font style='font-family:&quot;Avenir Next W01&quot;, &quot;Avenir Next W00&quot;, &quot;Avenir Next&quot;, Avenir, &quot;Helvetica Neue&quot;, Helvetica, Arial, sans-serif;'> of this dataset. All the current versions of Stats NZ Boundary layers can be found </font></span><a target='_blank' href='https://www.arcgis.com/home/group.html?id=b22e4f0012a8426dac21cd3d02f25c67' rel='nofollow ugc noopener noreferrer'><span style='font-size:medium;'><font style='font-family:&quot;Avenir Next W01&quot;, &quot;Avenir Next W00&quot;, &quot;Avenir Next&quot;, Avenir, &quot;Helvetica Neue&quot;, Helvetica, Arial, sans-serif;'>here</font></span></a><span style='font-size:medium;'><font style='font-family:&quot;Avenir Next W01&quot;, &quot;Avenir Next W00&quot;, &quot;Avenir Next&quot;, Avenir, &quot;Helvetica Neue&quot;, Helvetica, Arial, sans-serif;'>.</font></span></p><div><div style='font-family:&quot;Avenir Next W01&quot;, &quot;Avenir Next W00&quot;, &quot;Avenir Next&quot;, Avenir, &quot;Helvetica Neue&quot;, Helvetica, Arial, sans-serif; font-size:17px;'><span style='font-size:medium;'><font style='font-family:&quot;Avenir Next W01&quot;, &quot;Avenir Next W00&quot;, &quot;Avenir Next&quot;, Avenir, &quot;Helvetica Neue&quot;, Helvetica, Arial, sans-serif;'>The official dataset can be found on</font></span><span style='font-family:Avenir Next W01, Avenir Next W00, Avenir Next, Avenir, Helvetica Neue, Helvetica, Arial, sans-serif; font-size:medium;'><font style='font-family:&quot;Avenir Next W01&quot;, &quot;Avenir Next W00&quot;, &quot;Avenir Next&quot;, Avenir, &quot;Helvetica Neue&quot;, Helvetica, Arial, sans-serif;'>&nbsp;</font></span><a target='_blank' href='https://datafinder.stats.govt.nz/data/category/annual-boundaries/2022/' rel='nofollow ugc noopener noreferrer'><span style='font-size:medium;'>https://datafinder.stats.govt.nz.</span></a><br />&nbsp;</div><div style='font-family:&quot;Avenir Next W01&quot;, &quot;Avenir Next W00&quot;, &quot;Avenir Next&quot;, Avenir, &quot;Helvetica Neue&quot;, Helvetica, Arial, sans-serif; font-size:17px;'><div><span style='color:#2f4f4f; font-size:medium;'>This layer is offered by Eagle Technology (Official Esri Distributor). Eagle Technology offers services that can be used in the ArcGIS platform. The Content team at Eagle Technology updates the layers on a regular basis and regularly adds new content to the Living Atlas. By using this content and combining it with other data you can create new information products quickly and easily.</span></div><div>&nbsp;</div><div><span style='color:#2f4f4f; font-size:medium;'>If you have any questions or comments about the content, please let us now&nbsp; at&nbsp;</span><a style='color:rgb(0, 121, 193); text-decoration-line:none;' href='mailto:livingatlas@eagle.co.nz' target='_blank' rel='nofollow ugc noopener noreferrer'><span style='font-size:medium;'>livingatlas@eagle.co.nz</span></a></div></div></div></div>",
			"keyword": [
				"Boundary",
				"Boundaries",
				"New zealand",
				"Statistics New Zealand",
				"StatsNZ",
				"Eagle technology",
				"Nz",
				"Content",
				"Kiwi",
				"eaglegis"
			],
			"issued": "2023-01-18T00:53:51.000Z",
			"modified": "2025-12-19T00:26:25.256Z",
			"publisher": {
				"name": "Eagle Technology Group Ltd"
			},
			"contactPoint": {
				"@type": "vcard:Contact",
				"fn": "eaglegis",
				"hasEmail": "mailto:ts@eaglegis.co.nz"
			},
			"accessLevel": "public",
			"spatial": "166.2620,-47.2230,-177.6189,-33.7734",
			"license": "https://creativecommons.org/licenses/by/4.0",
			"distribution": [
				{
					"@type": "dcat:Distribution",
					"title": "ArcGIS Hub Dataset",
					"format": "Web Page",
					"mediaType": "text/html",
					"accessURL": "https://www.pacificgeoportal.com/datasets/eaglegis::nz-māori-wards-archive"
				},
				{
					"@type": "dcat:Distribution",
					"title": "ArcGIS GeoService",
					"format": "ArcGIS GeoServices REST API",
					"mediaType": "application/json",
					"accessURL": "https://services.arcgis.com/XTtANUDT8Va4DLwI/arcgis/rest/services/nz_maori_wards_archive/FeatureServer/0"
				},
				{
					"@type": "dcat:Distribution",
					"title": "CSV",
					"format": "CSV",
					"mediaType": "text/csv",
					"accessURL": "https://www.pacificgeoportal.com/api/download/v1/items/5e95349d27754b21b3068b713df63173/csv?layers=0"
				},
				{
					"@type": "dcat:Distribution",
					"title": "Shapefile",
					"format": "ZIP",
					"mediaType": "application/zip",
					"accessURL": "https://www.pacificgeoportal.com/api/download/v1/items/5e95349d27754b21b3068b713df63173/shapefile?layers=0"
				},
				{
					"@type": "dcat:Distribution",
					"title": "GeoJSON",
					"format": "GeoJSON",
					"mediaType": "application/vnd.geo+json",
					"accessURL": "https://www.pacificgeoportal.com/api/download/v1/items/5e95349d27754b21b3068b713df63173/geojson?layers=0"
				},
				{
					"@type": "dcat:Distribution",
					"title": "KML",
					"format": "KML",
					"mediaType": "application/vnd.google-earth.kml+xml",
					"accessURL": "https://www.pacificgeoportal.com/api/download/v1/items/5e95349d27754b21b3068b713df63173/kml?layers=0"
				},
				{
					"@type": "dcat:Distribution",
					"title": "File Geodatabase",
					"format": "ZIP",
					"mediaType": "application/zip",
					"accessURL": "https://www.pacificgeoportal.com/api/download/v1/items/5e95349d27754b21b3068b713df63173/filegdb?layers=0"
				},
				{
					"@type": "dcat:Distribution",
					"title": "Feature Collection",
					"format": "TXT",
					"mediaType": "text/plain",
					"accessURL": "https://www.pacificgeoportal.com/api/download/v1/items/5e95349d27754b21b3068b713df63173/featureCollection?layers=0"
				},
				{
					"@type": "dcat:Distribution",
					"title": "Excel",
					"format": "XLSX",
					"mediaType": "application/vnd.ms-excel",
					"accessURL": "https://www.pacificgeoportal.com/api/download/v1/items/5e95349d27754b21b3068b713df63173/excel?layers=0"
				},
				{
					"@type": "dcat:Distribution",
					"title": "GeoPackage",
					"format": "GPKG",
					"mediaType": "application/geopackage+sqlite3",
					"accessURL": "https://www.pacificgeoportal.com/api/download/v1/items/5e95349d27754b21b3068b713df63173/geoPackage?layers=0"
				},
				{
					"@type": "dcat:Distribution",
					"title": "SQLite Geodatabase",
					"format": "GDB",
					"mediaType": "application/geopackage+sqlite3",
					"accessURL": "https://www.pacificgeoportal.com/api/download/v1/items/5e95349d27754b21b3068b713df63173/sqlite?layers=0"
				}
			],
			"theme": [
				"geospatial"
			]
		},
		{
			"@type": "dcat:Dataset",
			"identifier": "https://www.arcgis.com/home/item.html?id=8d442899956446188be600fbaa8ad6dc&sublayer=0",
			"landingPage": "https://www.pacificgeoportal.com/datasets/eaglegis::nz-māori-constituencies-archive",
			"title": "NZ Māori Constituencies - Archive",
			"description": "<p><span style='font-size:medium;'><font style='font-family:&quot;Avenir Next W01&quot;, &quot;Avenir Next W00&quot;, &quot;Avenir Next&quot;, Avenir, &quot;Helvetica Neue&quot;, Helvetica, Arial, sans-serif !important;'>Topicality:&nbsp;01-01-2026</font></span></p><div><p><span style='font-family:Avenir Next W01, Avenir Next W00, Avenir Next, Avenir, Helvetica Neue, Helvetica, Arial, sans-serif; font-size:medium;'>Projection: New Zealand Transverse Mercator (NZTM)</span></p><div><div style='font-family:&quot;Avenir Next W01&quot;, &quot;Avenir Next W00&quot;, &quot;Avenir Next&quot;, Avenir, &quot;Helvetica Neue&quot;, Helvetica, Arial, sans-serif !important; font-size:17px;'><span style='font-family:Avenir Next W01, Avenir Next W00, Avenir Next, Avenir, Helvetica Neue, Helvetica, Arial, sans-serif; font-size:medium;'>This layer contains the archive of </span><span style='font-size:medium;'>regional council&nbsp;Māori constituency boundaries as defined by the regional councils and Local Government Commission but maintained by Stats NZ (the custodian).</span><span style='font-family:Avenir Next W01, Avenir Next W00, Avenir Next, Avenir, Helvetica Neue, Helvetica, Arial, sans-serif; font-size:medium;'>&nbsp;</span></div><div style='font-family:&quot;Avenir Next W01&quot;, &quot;Avenir Next W00&quot;, &quot;Avenir Next&quot;, Avenir, &quot;Helvetica Neue&quot;, Helvetica, Arial, sans-serif !important; font-size:17px;'>&nbsp;</div></div><div style='font-family:&quot;Avenir Next W01&quot;, &quot;Avenir Next W00&quot;, &quot;Avenir Next&quot;, Avenir, &quot;Helvetica Neue&quot;, Helvetica, Arial, sans-serif !important; font-size:17px;'><span style='font-size:medium;'>Māori constituencies are established under the Local Electoral Act 2001 and result from the division of a region for electoral purposes.</span><br />&nbsp;</div><div style='font-family:&quot;Avenir Next W01&quot;, &quot;Avenir Next W00&quot;, &quot;Avenir Next&quot;, Avenir, &quot;Helvetica Neue&quot;, Helvetica, Arial, sans-serif !important; font-size:17px;'><span style='font-size:medium;'>Māori constituencies are divisions of regional council areas. They are created, based on population, to be the voting areas within councils. Māori constituencies are defined at meshblock level, and do not coincide with the statistical area 1 (SA1) geography or the statistical area 2 (SA2) geography.&nbsp;</span></div><div style='font-family:&quot;Avenir Next W01&quot;, &quot;Avenir Next W00&quot;, &quot;Avenir Next&quot;, Avenir, &quot;Helvetica Neue&quot;, Helvetica, Arial, sans-serif !important; font-size:17px;'>&nbsp;</div><div style='font-family:&quot;Avenir Next W01&quot;, &quot;Avenir Next W00&quot;, &quot;Avenir Next&quot;, Avenir, &quot;Helvetica Neue&quot;, Helvetica, Arial, sans-serif !important; font-size:17px;'><span style='font-size:medium;'>If a regional council decides to have a Māori constituency, the constituencies within the council are known as general constituencies and Māori constituencies.&nbsp;</span><br />&nbsp;</div><div style='font-family:&quot;Avenir Next W01&quot;, &quot;Avenir Next W00&quot;, &quot;Avenir Next&quot;, Avenir, &quot;Helvetica Neue&quot;, Helvetica, Arial, sans-serif !important; font-size:17px;'><span style='font-size:medium;'>The boundaries of Māori constituencies may be reviewed before each three yearly local government election. Regional councils must review their representation arrangements at least once every six years. The provisions for such reviews are contained in the Local Government Act 2002.&nbsp;</span></div><div style='font-family:&quot;Avenir Next W01&quot;, &quot;Avenir Next W00&quot;, &quot;Avenir Next&quot;, Avenir, &quot;Helvetica Neue&quot;, Helvetica, Arial, sans-serif !important; font-size:17px;'>&nbsp;</div><div style='font-family:&quot;Avenir Next W01&quot;, &quot;Avenir Next W00&quot;, &quot;Avenir Next&quot;, Avenir, &quot;Helvetica Neue&quot;, Helvetica, Arial, sans-serif !important; font-size:17px;'><span style='font-size:medium;'>Māori constituencies are numbered based on their corresponding regional council. Each Māori constituency has a unique four-digit code. The first two digits represent the regional council that the Māori constituency lies within. The last two digits are sequential and represent the number of Māori constituencies within a regional council. For example, the Waikato Regional Council (03) contains two Māori constituencies which are coded 0301 and 0302.</span><br />&nbsp;</div><p><span style='font-family:Avenir Next W01, Avenir Next W00, Avenir Next, Avenir, Helvetica Neue, Helvetica, Arial, sans-serif; font-size:medium;'>This layer get updated yearly with the latest boundary data.<font style='font-family:&quot;Avenir Next W01&quot;, &quot;Avenir Next W00&quot;, &quot;Avenir Next&quot;, Avenir, &quot;Helvetica Neue&quot;, Helvetica, Arial, sans-serif;'> You can use this layer when you need any year of boundary data in your map. By setting a filter on the dataset year you can filter on specific year of the dataset.</font></span></p><div><span style='font-family:Avenir Next W01, Avenir Next W00, Avenir Next, Avenir, Helvetica Neue, Helvetica, Arial, sans-serif; font-size:medium;'>For information about the fields in this dataset go to the Data tab.</span></div><div>&nbsp;</div><div><span style='font-family:Avenir Next W01, Avenir Next W00, Avenir Next, Avenir, Helvetica Neue, Helvetica, Arial, sans-serif; font-size:medium;'>The layer is further generalised by Eagle Technology for improved performance on the web,&nbsp;</span><span style='font-family:&quot;Avenir Next W01&quot;, &quot;Avenir Next W00&quot;, &quot;Avenir Next&quot;, Avenir, &quot;Helvetica Neue&quot;, sans-serif; font-size:medium;'>therefore it doesn't fully represent the official boundaries.</span></div><div>&nbsp;</div><div><span style='font-family:Avenir Next W01, Avenir Next W00, Avenir Next, Avenir, Helvetica Neue, Helvetica, Arial, sans-serif; font-size:medium;'><font style='font-family:&quot;Avenir Next W01&quot;, &quot;Avenir Next W00&quot;, &quot;Avenir Next&quot;, Avenir, &quot;Helvetica Neue&quot;, Helvetica, Arial, sans-serif;'>If you only need the latest boundary data in your map you can use the </font></span><a target='_blank' href='https://www.arcgis.com/home/item.html?id=c79cf92a933a44b8ba27ed833163202f' rel='nofollow ugc noopener noreferrer'><span style='font-family:Avenir Next W01, Avenir Next W00, Avenir Next, Avenir, Helvetica Neue, Helvetica, Arial, sans-serif; font-size:medium;'>current version</span></a><span style='font-family:Avenir Next W01, Avenir Next W00, Avenir Next, Avenir, Helvetica Neue, Helvetica, Arial, sans-serif; font-size:medium;'><font style='font-family:&quot;Avenir Next W01&quot;, &quot;Avenir Next W00&quot;, &quot;Avenir Next&quot;, Avenir, &quot;Helvetica Neue&quot;, Helvetica, Arial, sans-serif;'> of this dataset. All the current versions of Stats NZ Boundary layers can be found </font></span><a target='_blank' href='https://www.arcgis.com/home/group.html?id=b22e4f0012a8426dac21cd3d02f25c67' rel='nofollow ugc noopener noreferrer'><span style='font-family:Avenir Next W01, Avenir Next W00, Avenir Next, Avenir, Helvetica Neue, Helvetica, Arial, sans-serif; font-size:medium;'><font style='font-family:&quot;Avenir Next W01&quot;, &quot;Avenir Next W00&quot;, &quot;Avenir Next&quot;, Avenir, &quot;Helvetica Neue&quot;, Helvetica, Arial, sans-serif;'>here</font></span></a><span style='font-family:Avenir Next W01, Avenir Next W00, Avenir Next, Avenir, Helvetica Neue, Helvetica, Arial, sans-serif; font-size:medium;'><font style='font-family:&quot;Avenir Next W01&quot;, &quot;Avenir Next W00&quot;, &quot;Avenir Next&quot;, Avenir, &quot;Helvetica Neue&quot;, Helvetica, Arial, sans-serif;'>.</font></span></div><div>&nbsp;</div><div><span style='font-family:Avenir Next W01, Avenir Next W00, Avenir Next, Avenir, Helvetica Neue, Helvetica, Arial, sans-serif; font-size:medium;'><font style='font-family:&quot;Avenir Next W01&quot;, &quot;Avenir Next W00&quot;, &quot;Avenir Next&quot;, Avenir, &quot;Helvetica Neue&quot;, Helvetica, Arial, sans-serif;'>The official dataset can be found on&nbsp;</font></span><a target='_blank' href='https://datafinder.stats.govt.nz/data/category/annual-boundaries/2022/' rel='nofollow ugc noopener noreferrer'><span style='font-family:Avenir Next W01, Avenir Next W00, Avenir Next, Avenir, Helvetica Neue, Helvetica, Arial, sans-serif; font-size:medium;'>https://datafinder.stats.govt.nz.</span></a></div><div style='font-family:&quot;Avenir Next W01&quot;, &quot;Avenir Next W00&quot;, &quot;Avenir Next&quot;, Avenir, &quot;Helvetica Neue&quot;, Helvetica, Arial, sans-serif !important; font-size:17px;'><div>&nbsp;</div><div><div><span style='color:#2f4f4f; font-size:medium;'>This layer is offered by Eagle Technology (Official Esri Distributor). Eagle Technology offers services that can be used in the ArcGIS platform. The Content team at Eagle Technology updates the layers on a regular basis and regularly adds new content to the Living Atlas. By using this content and combining it with other data you can create new information products quickly and easily.</span></div><div>&nbsp;</div><div><span style='color:#2f4f4f; font-size:medium;'>If you have any questions or comments about the content, please let us now&nbsp; at&nbsp;</span><a style='color:rgb(0, 121, 193); text-decoration-line:none;' href='mailto:livingatlas@eagle.co.nz' target='_blank' rel='nofollow ugc noopener noreferrer'><span style='font-size:medium;'>livingatlas@eagle.co.nz</span></a></div></div></div></div>",
			"keyword": [
				"Boundary",
				"Boundaries",
				"New zealand",
				"Statistics New Zealand",
				"StatsNZ",
				"Eagle technology",
				"Nz",
				"Content",
				"Kiwi",
				"eaglegis"
			],
			"issued": "2023-01-18T00:34:49.000Z",
			"modified": "2025-12-19T00:25:56.706Z",
			"publisher": {
				"name": "Eagle Technology Group Ltd"
			},
			"contactPoint": {
				"@type": "vcard:Contact",
				"fn": "eaglegis",
				"hasEmail": "mailto:ts@eaglegis.co.nz"
			},
			"accessLevel": "public",
			"spatial": "166.2620,-47.2230,-177.6189,-33.7734",
			"license": "https://creativecommons.org/licenses/by/4.0",
			"distribution": [
				{
					"@type": "dcat:Distribution",
					"title": "ArcGIS Hub Dataset",
					"format": "Web Page",
					"mediaType": "text/html",
					"accessURL": "https://www.pacificgeoportal.com/datasets/eaglegis::nz-māori-constituencies-archive"
				},
				{
					"@type": "dcat:Distribution",
					"title": "ArcGIS GeoService",
					"format": "ArcGIS GeoServices REST API",
					"mediaType": "application/json",
					"accessURL": "https://services.arcgis.com/XTtANUDT8Va4DLwI/arcgis/rest/services/nz_maori_constituencies_archive/FeatureServer/0"
				},
				{
					"@type": "dcat:Distribution",
					"title": "CSV",
					"format": "CSV",
					"mediaType": "text/csv",
					"accessURL": "https://www.pacificgeoportal.com/api/download/v1/items/8d442899956446188be600fbaa8ad6dc/csv?layers=0"
				},
				{
					"@type": "dcat:Distribution",
					"title": "Shapefile",
					"format": "ZIP",
					"mediaType": "application/zip",
					"accessURL": "https://www.pacificgeoportal.com/api/download/v1/items/8d442899956446188be600fbaa8ad6dc/shapefile?layers=0"
				},
				{
					"@type": "dcat:Distribution",
					"title": "GeoJSON",
					"format": "GeoJSON",
					"mediaType": "application/vnd.geo+json",
					"accessURL": "https://www.pacificgeoportal.com/api/download/v1/items/8d442899956446188be600fbaa8ad6dc/geojson?layers=0"
				},
				{
					"@type": "dcat:Distribution",
					"title": "KML",
					"format": "KML",
					"mediaType": "application/vnd.google-earth.kml+xml",
					"accessURL": "https://www.pacificgeoportal.com/api/download/v1/items/8d442899956446188be600fbaa8ad6dc/kml?layers=0"
				},
				{
					"@type": "dcat:Distribution",
					"title": "File Geodatabase",
					"format": "ZIP",
					"mediaType": "application/zip",
					"accessURL": "https://www.pacificgeoportal.com/api/download/v1/items/8d442899956446188be600fbaa8ad6dc/filegdb?layers=0"
				},
				{
					"@type": "dcat:Distribution",
					"title": "Feature Collection",
					"format": "TXT",
					"mediaType": "text/plain",
					"accessURL": "https://www.pacificgeoportal.com/api/download/v1/items/8d442899956446188be600fbaa8ad6dc/featureCollection?layers=0"
				},
				{
					"@type": "dcat:Distribution",
					"title": "Excel",
					"format": "XLSX",
					"mediaType": "application/vnd.ms-excel",
					"accessURL": "https://www.pacificgeoportal.com/api/download/v1/items/8d442899956446188be600fbaa8ad6dc/excel?layers=0"
				},
				{
					"@type": "dcat:Distribution",
					"title": "GeoPackage",
					"format": "GPKG",
					"mediaType": "application/geopackage+sqlite3",
					"accessURL": "https://www.pacificgeoportal.com/api/download/v1/items/8d442899956446188be600fbaa8ad6dc/geoPackage?layers=0"
				},
				{
					"@type": "dcat:Distribution",
					"title": "SQLite Geodatabase",
					"format": "GDB",
					"mediaType": "application/geopackage+sqlite3",
					"accessURL": "https://www.pacificgeoportal.com/api/download/v1/items/8d442899956446188be600fbaa8ad6dc/sqlite?layers=0"
				}
			],
			"theme": [
				"geospatial"
			]
		},
		{
			"@type": "dcat:Dataset",
			"identifier": "https://www.arcgis.com/home/item.html?id=5f373fde10f8442f81c4a3ef8a47961e&sublayer=0",
			"landingPage": "https://www.pacificgeoportal.com/datasets/eaglegis::nz-constituencies-archive",
			"title": "NZ Constituencies - Archive",
			"description": "<p><span style='font-size:medium;'><font style='font-family:&quot;Avenir Next W01&quot;, &quot;Avenir Next W00&quot;, &quot;Avenir Next&quot;, Avenir, &quot;Helvetica Neue&quot;, Helvetica, Arial, sans-serif !important;'>Topicality:&nbsp;01-01-2026</font></span></p><div><p><span style='font-family:&quot;Avenir Next W01&quot;, &quot;Avenir Next W00&quot;, &quot;Avenir Next&quot;, Avenir, &quot;Helvetica Neue&quot;, Helvetica, Arial, sans-serif; font-size:medium;'>Projection: New Zealand Transverse Mercator (NZTM)</span></p><div><div style='font-family:&quot;Avenir Next W01&quot;, &quot;Avenir Next W00&quot;, &quot;Avenir Next&quot;, Avenir, &quot;Helvetica Neue&quot;, Helvetica, Arial, sans-serif !important;'><span style='font-family:Avenir Next W01, Avenir Next W00, Avenir Next, Avenir, Helvetica Neue, Helvetica, Arial, sans-serif; font-size:medium;'>This layer contains the archive of</span><span style='font-size:medium;'> regional council constituency boundaries for 2021 as defined by the regional councils and Local Government Commission but maintained by Stats NZ (the custodian).</span><span style='font-family:Avenir Next W01, Avenir Next W00, Avenir Next, Avenir, Helvetica Neue, Helvetica, Arial, sans-serif; font-size:medium;'>&nbsp;</span></div><div><div>&nbsp;</div><div><div><span style='font-family:Avenir Next W01, Avenir Next W00, Avenir Next, Avenir, Helvetica Neue, Helvetica, Arial, sans-serif; font-size:medium;'>Constituencies are established under the Local Electoral Act 2001 and result from the division of a region for electoral purposes. If a regional council decides to have a Māori constituency, the constituencies within the council are known as general constituencies and Māori constituencies.&nbsp;&nbsp;</span></div><div>&nbsp;</div><div><span style='font-family:Avenir Next W01, Avenir Next W00, Avenir Next, Avenir, Helvetica Neue, Helvetica, Arial, sans-serif; font-size:medium;'>Constituencies are divisions of regional council areas. They are defined at meshblock level, and do not coincide with the statistical area 1 (SA1) geography or the statistical area 2 (SA2) geography. They are created, based on population, to be the voting areas within councils. Constituencies are required to reflect communities of interest. Their boundaries, so far as is practicable, coincide with those of territorial authorities or wards. The boundaries of constituencies may be reviewed before each three-yearly local government election. Regional councils must review their representation arrangements at least once every six years. The provisions for such reviews are in the Local Government Act 2002.&nbsp;</span></div><div>&nbsp;</div><div><span style='font-family:Avenir Next W01, Avenir Next W00, Avenir Next, Avenir, Helvetica Neue, Helvetica, Arial, sans-serif; font-size:medium;'>Constituencies are numbered based on their corresponding regional council. Each constituency has a unique four-digit code. The first two digits represent the regional council that the constituency lies within. The last two digits are sequential and represent the number of constituencies within a regional council. For example, the West Coast Regional Council (12) contains three constituencies, which are coded 1201, 1202, and 1203.</span></div></div></div><div style='font-family:&quot;Avenir Next W01&quot;, &quot;Avenir Next W00&quot;, &quot;Avenir Next&quot;, Avenir, &quot;Helvetica Neue&quot;, Helvetica, Arial, sans-serif !important;'><br />&nbsp;</div><p><span style='font-family:Avenir Next W01, Avenir Next W00, Avenir Next, Avenir, Helvetica Neue, Helvetica, Arial, sans-serif; font-size:medium;'>This layer get updated yearly with the latest boundary data.<font style='font-family:&quot;Avenir Next W01&quot;, &quot;Avenir Next W00&quot;, &quot;Avenir Next&quot;, Avenir, &quot;Helvetica Neue&quot;, Helvetica, Arial, sans-serif;'> You can use this layer when you need any year of boundary data in your map. By setting a filter on the dataset year you can filter on specific year of the dataset.</font></span></p><div><span style='font-family:Avenir Next W01, Avenir Next W00, Avenir Next, Avenir, Helvetica Neue, Helvetica, Arial, sans-serif; font-size:medium;'>For information about the fields in this dataset go to the Data tab.</span></div><div>&nbsp;</div><div><span style='font-family:Avenir Next W01, Avenir Next W00, Avenir Next, Avenir, Helvetica Neue, Helvetica, Arial, sans-serif; font-size:medium;'>The layer is further generalised by Eagle Technology for improved performance on the web,&nbsp;</span><span style='font-family:&quot;Avenir Next W01&quot;, &quot;Avenir Next W00&quot;, &quot;Avenir Next&quot;, Avenir, &quot;Helvetica Neue&quot;, sans-serif; font-size:medium;'>therefore it doesn't fully represent the official boundaries.</span></div><div>&nbsp;</div><div><span style='font-family:Avenir Next W01, Avenir Next W00, Avenir Next, Avenir, Helvetica Neue, Helvetica, Arial, sans-serif; font-size:medium;'><font style='font-family:&quot;Avenir Next W01&quot;, &quot;Avenir Next W00&quot;, &quot;Avenir Next&quot;, Avenir, &quot;Helvetica Neue&quot;, Helvetica, Arial, sans-serif;'>If you only need the latest boundary data in your map you can use the </font></span><a target='_blank' href='https://www.arcgis.com/home/item.html?id=6712602ebaa54b60a421fe7ac73eb7aa' rel='nofollow ugc noopener noreferrer'><span style='font-family:Avenir Next W01, Avenir Next W00, Avenir Next, Avenir, Helvetica Neue, Helvetica, Arial, sans-serif; font-size:medium;'>current version</span></a><span style='font-family:Avenir Next W01, Avenir Next W00, Avenir Next, Avenir, Helvetica Neue, Helvetica, Arial, sans-serif; font-size:medium;'><font style='font-family:&quot;Avenir Next W01&quot;, &quot;Avenir Next W00&quot;, &quot;Avenir Next&quot;, Avenir, &quot;Helvetica Neue&quot;, Helvetica, Arial, sans-serif;'> of this dataset. All the current versions of Stats NZ Boundary layers can be found </font></span><a target='_blank' href='https://www.arcgis.com/home/group.html?id=b22e4f0012a8426dac21cd3d02f25c67' rel='nofollow ugc noopener noreferrer'><span style='font-family:Avenir Next W01, Avenir Next W00, Avenir Next, Avenir, Helvetica Neue, Helvetica, Arial, sans-serif; font-size:medium;'><font style='font-family:&quot;Avenir Next W01&quot;, &quot;Avenir Next W00&quot;, &quot;Avenir Next&quot;, Avenir, &quot;Helvetica Neue&quot;, Helvetica, Arial, sans-serif;'>here</font></span></a><span style='font-family:Avenir Next W01, Avenir Next W00, Avenir Next, Avenir, Helvetica Neue, Helvetica, Arial, sans-serif; font-size:medium;'><font style='font-family:&quot;Avenir Next W01&quot;, &quot;Avenir Next W00&quot;, &quot;Avenir Next&quot;, Avenir, &quot;Helvetica Neue&quot;, Helvetica, Arial, sans-serif;'>.</font></span></div><div>&nbsp;</div><div><span style='font-family:Avenir Next W01, Avenir Next W00, Avenir Next, Avenir, Helvetica Neue, Helvetica, Arial, sans-serif; font-size:medium;'><font style='font-family:&quot;Avenir Next W01&quot;, &quot;Avenir Next W00&quot;, &quot;Avenir Next&quot;, Avenir, &quot;Helvetica Neue&quot;, Helvetica, Arial, sans-serif;'>The official dataset can be found on&nbsp;</font></span><a target='_blank' href='https://datafinder.stats.govt.nz/data/category/annual-boundaries/2022/' rel='nofollow ugc noopener noreferrer'><span style='font-family:Avenir Next W01, Avenir Next W00, Avenir Next, Avenir, Helvetica Neue, Helvetica, Arial, sans-serif; font-size:medium;'>https://datafinder.stats.govt.nz.</span></a></div><div style='font-family:&quot;Avenir Next W01&quot;, &quot;Avenir Next W00&quot;, &quot;Avenir Next&quot;, Avenir, &quot;Helvetica Neue&quot;, Helvetica, Arial, sans-serif !important;'>&nbsp;</div><div style='font-family:&quot;Avenir Next W01&quot;, &quot;Avenir Next W00&quot;, &quot;Avenir Next&quot;, Avenir, &quot;Helvetica Neue&quot;, Helvetica, Arial, sans-serif !important;'><div><span style='color:#2f4f4f; font-size:medium;'>This layer is offered by Eagle Technology (Official Esri Distributor). Eagle Technology offers services that can be used in the ArcGIS platform. The Content team at Eagle Technology updates the layers on a regular basis and regularly adds new content to the Living Atlas. By using this content and combining it with other data you can create new information products quickly and easily.</span></div><div>&nbsp;</div><div><span style='color:#2f4f4f; font-size:medium;'>If you have any questions or comments about the content, please let us now&nbsp; at&nbsp;</span><a style='color:rgb(0, 121, 193); text-decoration-line:none;' href='mailto:livingatlas@eagle.co.nz' target='_blank' rel='nofollow ugc noopener noreferrer'><span style='font-size:medium;'>livingatlas@eagle.co.nz</span></a></div></div></div></div>",
			"keyword": [
				"Boundary",
				"Boundaries",
				"New zealand",
				"Statistics New Zealand",
				"StatsNZ",
				"Eagle technology",
				"Nz",
				"Content",
				"Kiwi",
				"eaglegis"
			],
			"issued": "2023-01-18T00:33:46.000Z",
			"modified": "2025-12-19T00:25:52.373Z",
			"publisher": {
				"name": "Eagle Technology Group Ltd"
			},
			"contactPoint": {
				"@type": "vcard:Contact",
				"fn": "eaglegis",
				"hasEmail": "mailto:ts@eaglegis.co.nz"
			},
			"accessLevel": "public",
			"spatial": "166.2620,-47.2230,-177.6189,-33.7734",
			"license": "https://creativecommons.org/licenses/by/4.0",
			"distribution": [
				{
					"@type": "dcat:Distribution",
					"title": "ArcGIS Hub Dataset",
					"format": "Web Page",
					"mediaType": "text/html",
					"accessURL": "https://www.pacificgeoportal.com/datasets/eaglegis::nz-constituencies-archive"
				},
				{
					"@type": "dcat:Distribution",
					"title": "ArcGIS GeoService",
					"format": "ArcGIS GeoServices REST API",
					"mediaType": "application/json",
					"accessURL": "https://services.arcgis.com/XTtANUDT8Va4DLwI/arcgis/rest/services/nz_constituencies_archive/FeatureServer/0"
				},
				{
					"@type": "dcat:Distribution",
					"title": "CSV",
					"format": "CSV",
					"mediaType": "text/csv",
					"accessURL": "https://www.pacificgeoportal.com/api/download/v1/items/5f373fde10f8442f81c4a3ef8a47961e/csv?layers=0"
				},
				{
					"@type": "dcat:Distribution",
					"title": "Shapefile",
					"format": "ZIP",
					"mediaType": "application/zip",
					"accessURL": "https://www.pacificgeoportal.com/api/download/v1/items/5f373fde10f8442f81c4a3ef8a47961e/shapefile?layers=0"
				},
				{
					"@type": "dcat:Distribution",
					"title": "GeoJSON",
					"format": "GeoJSON",
					"mediaType": "application/vnd.geo+json",
					"accessURL": "https://www.pacificgeoportal.com/api/download/v1/items/5f373fde10f8442f81c4a3ef8a47961e/geojson?layers=0"
				},
				{
					"@type": "dcat:Distribution",
					"title": "KML",
					"format": "KML",
					"mediaType": "application/vnd.google-earth.kml+xml",
					"accessURL": "https://www.pacificgeoportal.com/api/download/v1/items/5f373fde10f8442f81c4a3ef8a47961e/kml?layers=0"
				},
				{
					"@type": "dcat:Distribution",
					"title": "File Geodatabase",
					"format": "ZIP",
					"mediaType": "application/zip",
					"accessURL": "https://www.pacificgeoportal.com/api/download/v1/items/5f373fde10f8442f81c4a3ef8a47961e/filegdb?layers=0"
				},
				{
					"@type": "dcat:Distribution",
					"title": "Feature Collection",
					"format": "TXT",
					"mediaType": "text/plain",
					"accessURL": "https://www.pacificgeoportal.com/api/download/v1/items/5f373fde10f8442f81c4a3ef8a47961e/featureCollection?layers=0"
				},
				{
					"@type": "dcat:Distribution",
					"title": "Excel",
					"format": "XLSX",
					"mediaType": "application/vnd.ms-excel",
					"accessURL": "https://www.pacificgeoportal.com/api/download/v1/items/5f373fde10f8442f81c4a3ef8a47961e/excel?layers=0"
				},
				{
					"@type": "dcat:Distribution",
					"title": "GeoPackage",
					"format": "GPKG",
					"mediaType": "application/geopackage+sqlite3",
					"accessURL": "https://www.pacificgeoportal.com/api/download/v1/items/5f373fde10f8442f81c4a3ef8a47961e/geoPackage?layers=0"
				},
				{
					"@type": "dcat:Distribution",
					"title": "SQLite Geodatabase",
					"format": "GDB",
					"mediaType": "application/geopackage+sqlite3",
					"accessURL": "https://www.pacificgeoportal.com/api/download/v1/items/5f373fde10f8442f81c4a3ef8a47961e/sqlite?layers=0"
				}
			],
			"theme": [
				"geospatial"
			]
		},
		{
			"@type": "dcat:Dataset",
			"identifier": "https://www.arcgis.com/home/item.html?id=c4089e5978944a899679e68aed59ae4d&sublayer=0",
			"landingPage": "https://www.pacificgeoportal.com/datasets/eaglegis::nz-statistical-areas-1-archive",
			"title": "NZ Statistical Areas 1 - Archive",
			"description": "<div style='font-family:&quot;Avenir Next W01&quot;, &quot;Avenir Next W00&quot;, &quot;Avenir Next&quot;, Avenir, &quot;Helvetica Neue&quot;, Helvetica, Arial, sans-serif !important;'><span style='font-size:medium;'>Topicality: 01-01-<font style='font-family:&quot;Avenir Next W01&quot;, &quot;Avenir Next W00&quot;, &quot;Avenir Next&quot;, Avenir, &quot;Helvetica Neue&quot;, Helvetica, Arial, sans-serif !important;'>2026</font></span></div><div style='font-family:&quot;Avenir Next W01&quot;, &quot;Avenir Next W00&quot;, &quot;Avenir Next&quot;, Avenir, &quot;Helvetica Neue&quot;, Helvetica, Arial, sans-serif !important;'><div style='font-size:17px;'><span style='font-size:medium;'>Projection: New Zealand Transverse Mercator (NZTM)</span><br />&nbsp;</div></div><div style='font-family:&quot;Avenir Next W01&quot;, &quot;Avenir Next W00&quot;, &quot;Avenir Next&quot;, Avenir, &quot;Helvetica Neue&quot;, Helvetica, Arial, sans-serif !important;'><span style='font-family:&quot;Avenir Next W01&quot;, &quot;Avenir Next W00&quot;, &quot;Avenir Next&quot;, Avenir, &quot;Helvetica Neue&quot;, sans-serif; font-size:medium;'><font style='font-family:&quot;Avenir Next W01&quot;, &quot;Avenir Next W00&quot;, &quot;Avenir Next&quot;, Avenir, &quot;Helvetica Neue&quot;, Helvetica, Arial, sans-serif !important;'>This layer contains the archive of statistical area 1 (SA1) boundaries maintained by Stats NZ and as defined by Stats NZ.</font>&nbsp;</span><br />&nbsp;</div><p><span style='font-size:medium;'>Statistical area 1 (SA1) is a geography that allows the release of more detailed information about population characteristics than is available at the meshblock level. Built by joining meshblocks, SA1s have an ideal size range of 100–200 residents, and a maximum population of about 500. This is to minimise suppression of population data in multivariate statistics tables.</span></p><p><span style='font-family:Avenir Next W01, Avenir Next W00, Avenir Next, Avenir, Helvetica Neue, Helvetica, Arial, sans-serif; font-size:medium;'>This layer get updated yearly with the latest boundary data.<font style='font-family:&quot;Avenir Next W01&quot;, &quot;Avenir Next W00&quot;, &quot;Avenir Next&quot;, Avenir, &quot;Helvetica Neue&quot;, Helvetica, Arial, sans-serif;'> You can use this layer when you need any year of boundary data in your map. By setting a filter on the dataset year you can filter on specific year of the dataset.</font></span></p><div><span style='font-family:Avenir Next W01, Avenir Next W00, Avenir Next, Avenir, Helvetica Neue, Helvetica, Arial, sans-serif; font-size:medium;'>For information about the fields in this dataset go to the Data tab.</span></div><div>&nbsp;</div><div><span style='font-family:Avenir Next W01, Avenir Next W00, Avenir Next, Avenir, Helvetica Neue, Helvetica, Arial, sans-serif; font-size:medium;'>The layer is further generalised by Eagle Technology for improved performance on the web,&nbsp;</span><span style='font-family:&quot;Avenir Next W01&quot;, &quot;Avenir Next W00&quot;, &quot;Avenir Next&quot;, Avenir, &quot;Helvetica Neue&quot;, sans-serif; font-size:medium;'>therefore it doesn't fully represent the official boundaries.</span></div><div>&nbsp;</div><div><span style='font-family:Avenir Next W01, Avenir Next W00, Avenir Next, Avenir, Helvetica Neue, Helvetica, Arial, sans-serif; font-size:medium;'><font style='font-family:&quot;Avenir Next W01&quot;, &quot;Avenir Next W00&quot;, &quot;Avenir Next&quot;, Avenir, &quot;Helvetica Neue&quot;, Helvetica, Arial, sans-serif;'>If you only need the latest boundary data in your map you can use the </font></span><a target='_blank' href='https://www.arcgis.com/home/item.html?id=e0adfbdcfc714ae2a00c1b78a459bd43' rel='nofollow ugc noopener noreferrer'><span style='font-family:Avenir Next W01, Avenir Next W00, Avenir Next, Avenir, Helvetica Neue, Helvetica, Arial, sans-serif; font-size:medium;'>current version</span></a><span style='font-family:Avenir Next W01, Avenir Next W00, Avenir Next, Avenir, Helvetica Neue, Helvetica, Arial, sans-serif; font-size:medium;'><font style='font-family:&quot;Avenir Next W01&quot;, &quot;Avenir Next W00&quot;, &quot;Avenir Next&quot;, Avenir, &quot;Helvetica Neue&quot;, Helvetica, Arial, sans-serif;'> of this dataset. All the current versions of Stats NZ Boundary layers can be found </font></span><a target='_blank' href='https://www.arcgis.com/home/group.html?id=b22e4f0012a8426dac21cd3d02f25c67' rel='nofollow ugc noopener noreferrer'><span style='font-family:Avenir Next W01, Avenir Next W00, Avenir Next, Avenir, Helvetica Neue, Helvetica, Arial, sans-serif; font-size:medium;'><font style='font-family:&quot;Avenir Next W01&quot;, &quot;Avenir Next W00&quot;, &quot;Avenir Next&quot;, Avenir, &quot;Helvetica Neue&quot;, Helvetica, Arial, sans-serif;'>here</font></span></a><span style='font-family:Avenir Next W01, Avenir Next W00, Avenir Next, Avenir, Helvetica Neue, Helvetica, Arial, sans-serif; font-size:medium;'><font style='font-family:&quot;Avenir Next W01&quot;, &quot;Avenir Next W00&quot;, &quot;Avenir Next&quot;, Avenir, &quot;Helvetica Neue&quot;, Helvetica, Arial, sans-serif;'>.</font></span></div><div>&nbsp;</div><div><span style='font-family:Avenir Next W01, Avenir Next W00, Avenir Next, Avenir, Helvetica Neue, Helvetica, Arial, sans-serif; font-size:medium;'><font style='font-family:&quot;Avenir Next W01&quot;, &quot;Avenir Next W00&quot;, &quot;Avenir Next&quot;, Avenir, &quot;Helvetica Neue&quot;, Helvetica, Arial, sans-serif;'>The official dataset can be found on&nbsp;</font></span><a target='_blank' href='https://datafinder.stats.govt.nz/data/category/annual-boundaries/2022/' rel='nofollow ugc noopener noreferrer'><span style='font-family:Avenir Next W01, Avenir Next W00, Avenir Next, Avenir, Helvetica Neue, Helvetica, Arial, sans-serif; font-size:medium;'>https://datafinder.stats.govt.nz.</span></a></div><div style='font-family:&quot;Avenir Next W01&quot;, &quot;Avenir Next W00&quot;, &quot;Avenir Next&quot;, Avenir, &quot;Helvetica Neue&quot;, Helvetica, Arial, sans-serif !important;'>&nbsp;</div><div style='font-family:&quot;Avenir Next W01&quot;, &quot;Avenir Next W00&quot;, &quot;Avenir Next&quot;, Avenir, &quot;Helvetica Neue&quot;, Helvetica, Arial, sans-serif !important;'><div><span style='color:#2f4f4f; font-size:medium;'>This layer is offered by Eagle Technology (Official Esri Distributor). Eagle Technology offers services that can be used in the ArcGIS platform. The Content team at Eagle Technology updates the layers on a regular basis and regularly adds new content to the Living Atlas. By using this content and combining it with other data you can create new information products quickly and easily.</span></div><div>&nbsp;</div><div><span style='color:#2f4f4f; font-size:medium;'>If you have any questions or comments about the content, please let us now&nbsp; at&nbsp;</span><a style='color:rgb(0, 121, 193); text-decoration-line:none;' href='mailto:livingatlas@eagle.co.nz' target='_blank' rel='nofollow ugc noopener noreferrer'><span style='font-size:medium;'>livingatlas@eagle.co.nz</span></a><span style='font-size:medium;'>.</span></div></div>",
			"keyword": [
				"Boundary",
				"Boundaries",
				"New zealand",
				"Statistics New Zealand",
				"StatsNZ",
				"Eagle technology",
				"Nz",
				"Content",
				"Kiwi",
				"eaglegis"
			],
			"issued": "2023-01-18T00:49:04.000Z",
			"modified": "2025-12-19T00:26:09.401Z",
			"publisher": {
				"name": "Eagle Technology Group Ltd"
			},
			"contactPoint": {
				"@type": "vcard:Contact",
				"fn": "eaglegis",
				"hasEmail": "mailto:ts@eaglegis.co.nz"
			},
			"accessLevel": "public",
			"spatial": "166.2620,-47.2230,-177.6190,-33.7734",
			"license": "https://creativecommons.org/licenses/by/4.0",
			"distribution": [
				{
					"@type": "dcat:Distribution",
					"title": "ArcGIS Hub Dataset",
					"format": "Web Page",
					"mediaType": "text/html",
					"accessURL": "https://www.pacificgeoportal.com/datasets/eaglegis::nz-statistical-areas-1-archive"
				},
				{
					"@type": "dcat:Distribution",
					"title": "ArcGIS GeoService",
					"format": "ArcGIS GeoServices REST API",
					"mediaType": "application/json",
					"accessURL": "https://services.arcgis.com/XTtANUDT8Va4DLwI/arcgis/rest/services/nz_statistical_areas_1_archive/FeatureServer/0"
				},
				{
					"@type": "dcat:Distribution",
					"title": "CSV",
					"format": "CSV",
					"mediaType": "text/csv",
					"accessURL": "https://www.pacificgeoportal.com/api/download/v1/items/c4089e5978944a899679e68aed59ae4d/csv?layers=0"
				},
				{
					"@type": "dcat:Distribution",
					"title": "Shapefile",
					"format": "ZIP",
					"mediaType": "application/zip",
					"accessURL": "https://www.pacificgeoportal.com/api/download/v1/items/c4089e5978944a899679e68aed59ae4d/shapefile?layers=0"
				},
				{
					"@type": "dcat:Distribution",
					"title": "GeoJSON",
					"format": "GeoJSON",
					"mediaType": "application/vnd.geo+json",
					"accessURL": "https://www.pacificgeoportal.com/api/download/v1/items/c4089e5978944a899679e68aed59ae4d/geojson?layers=0"
				},
				{
					"@type": "dcat:Distribution",
					"title": "KML",
					"format": "KML",
					"mediaType": "application/vnd.google-earth.kml+xml",
					"accessURL": "https://www.pacificgeoportal.com/api/download/v1/items/c4089e5978944a899679e68aed59ae4d/kml?layers=0"
				},
				{
					"@type": "dcat:Distribution",
					"title": "File Geodatabase",
					"format": "ZIP",
					"mediaType": "application/zip",
					"accessURL": "https://www.pacificgeoportal.com/api/download/v1/items/c4089e5978944a899679e68aed59ae4d/filegdb?layers=0"
				},
				{
					"@type": "dcat:Distribution",
					"title": "Feature Collection",
					"format": "TXT",
					"mediaType": "text/plain",
					"accessURL": "https://www.pacificgeoportal.com/api/download/v1/items/c4089e5978944a899679e68aed59ae4d/featureCollection?layers=0"
				},
				{
					"@type": "dcat:Distribution",
					"title": "Excel",
					"format": "XLSX",
					"mediaType": "application/vnd.ms-excel",
					"accessURL": "https://www.pacificgeoportal.com/api/download/v1/items/c4089e5978944a899679e68aed59ae4d/excel?layers=0"
				},
				{
					"@type": "dcat:Distribution",
					"title": "GeoPackage",
					"format": "GPKG",
					"mediaType": "application/geopackage+sqlite3",
					"accessURL": "https://www.pacificgeoportal.com/api/download/v1/items/c4089e5978944a899679e68aed59ae4d/geoPackage?layers=0"
				},
				{
					"@type": "dcat:Distribution",
					"title": "SQLite Geodatabase",
					"format": "GDB",
					"mediaType": "application/geopackage+sqlite3",
					"accessURL": "https://www.pacificgeoportal.com/api/download/v1/items/c4089e5978944a899679e68aed59ae4d/sqlite?layers=0"
				}
			],
			"theme": [
				"geospatial"
			]
		},
		{
			"@type": "dcat:Dataset",
			"identifier": "https://www.arcgis.com/home/item.html?id=145414c973944521ab244f2ba54420c8&sublayer=0",
			"landingPage": "https://www.pacificgeoportal.com/datasets/eaglegis::nz-statistical-areas-3-archive",
			"title": "NZ Statistical Areas 3 - Archive",
			"description": "<div style='font-family:&quot;Avenir Next W01&quot;, &quot;Avenir Next W00&quot;, &quot;Avenir Next&quot;, Avenir, &quot;Helvetica Neue&quot;, Helvetica, Arial, sans-serif !important; font-size:17px;'><span style='font-size:medium;'>Topicality: 01-01-<font style='font-family:&quot;Avenir Next W01&quot;, &quot;Avenir Next W00&quot;, &quot;Avenir Next&quot;, Avenir, &quot;Helvetica Neue&quot;, Helvetica, Arial, sans-serif !important;'>2026</font></span></div><div style='font-family:&quot;Avenir Next W01&quot;, &quot;Avenir Next W00&quot;, &quot;Avenir Next&quot;, Avenir, &quot;Helvetica Neue&quot;, Helvetica, Arial, sans-serif !important; font-size:17px;'><div><span style='font-size:medium;'>Projection: New Zealand Transverse Mercator (NZTM)</span><br />&nbsp;</div></div><div style='font-family:&quot;Avenir Next W01&quot;, &quot;Avenir Next W00&quot;, &quot;Avenir Next&quot;, Avenir, &quot;Helvetica Neue&quot;, Helvetica, Arial, sans-serif !important; font-size:17px;'><div style='font-family:&quot;Avenir Next W01&quot;, &quot;Avenir Next W00&quot;, &quot;Avenir Next&quot;, Avenir, &quot;Helvetica Neue&quot;, Helvetica, Arial, sans-serif !important; font-size:17px;'><span style='font-family:&quot;Avenir Next W01&quot;, &quot;Avenir Next W00&quot;, &quot;Avenir Next&quot;, Avenir, &quot;Helvetica Neue&quot;, sans-serif; font-size:medium;'><font style='font-family:&quot;Avenir Next W01&quot;, &quot;Avenir Next W00&quot;, &quot;Avenir Next&quot;, Avenir, &quot;Helvetica Neue&quot;, Helvetica, Arial, sans-serif !important;'>This layer contains the archive of statistical area 3 (SA3) boundaries maintained by Stats NZ and as defined by Stats NZ.</font>&nbsp;</span><br />&nbsp;</div><div style='font-family:&quot;Avenir Next W01&quot;, &quot;Avenir Next W00&quot;, &quot;Avenir Next&quot;, Avenir, &quot;Helvetica Neue&quot;, Helvetica, Arial, sans-serif !important; font-size:17px;'><span style='font-size:medium;'>Statistical area 3 (SA3) is a new output geography, introduced in 2023 that allows aggregations of population data between the SA2 and territorial authority geography.</span><br />&nbsp;</div></div><div style='font-family:&quot;Avenir Next W01&quot;, &quot;Avenir Next W00&quot;, &quot;Avenir Next&quot;, Avenir, &quot;Helvetica Neue&quot;, Helvetica, Arial, sans-serif !important; font-size:17px;'><p><span style='font-size:medium;'>The SA3 geography aims to meet three purposes:</span></p><ol><li><span style='font-size:medium;'>approximate suburbs in major, large, and medium urban areas,</span></li><li><span style='font-size:medium;'>in predominantly rural areas, provide geographical areas that are larger in area and population size than SA2s but smaller than territorial authorities,</span></li><li><span style='font-size:medium;'>minimise data suppression.</span></li></ol></div><p><span style='font-family:Avenir Next W01, Avenir Next W00, Avenir Next, Avenir, Helvetica Neue, Helvetica, Arial, sans-serif; font-size:medium;'>This layer get updated yearly with the latest boundary data.<font style='font-family:&quot;Avenir Next W01&quot;, &quot;Avenir Next W00&quot;, &quot;Avenir Next&quot;, Avenir, &quot;Helvetica Neue&quot;, Helvetica, Arial, sans-serif;'> You can use this layer when you need any year of boundary data in your map. By setting a filter on the dataset year you can filter on specific year of the dataset.</font></span></p><div><span style='font-family:Avenir Next W01, Avenir Next W00, Avenir Next, Avenir, Helvetica Neue, Helvetica, Arial, sans-serif; font-size:medium;'>For information about the fields in this dataset go to the Data tab.</span></div><div>&nbsp;</div><div><span style='font-family:Avenir Next W01, Avenir Next W00, Avenir Next, Avenir, Helvetica Neue, Helvetica, Arial, sans-serif; font-size:medium;'>The layer is further generalised by Eagle Technology for improved performance on the web,&nbsp;</span><span style='font-family:&quot;Avenir Next W01&quot;, &quot;Avenir Next W00&quot;, &quot;Avenir Next&quot;, Avenir, &quot;Helvetica Neue&quot;, sans-serif; font-size:medium;'>therefore it doesn't fully represent the official boundaries.</span><br />&nbsp;</div><div><span style='font-family:Avenir Next W01, Avenir Next W00, Avenir Next, Avenir, Helvetica Neue, Helvetica, Arial, sans-serif; font-size:medium;'><font style='font-family:&quot;Avenir Next W01&quot;, &quot;Avenir Next W00&quot;, &quot;Avenir Next&quot;, Avenir, &quot;Helvetica Neue&quot;, Helvetica, Arial, sans-serif;'>If you only need the latest boundary data in your map you can use the </font></span><a target='_blank' href='https://www.arcgis.com/home/item.html?id=2755ebaa5e1d462da7265a7c268e222b' rel='nofollow ugc noopener noreferrer'><span style='font-family:Avenir Next W01, Avenir Next W00, Avenir Next, Avenir, Helvetica Neue, Helvetica, Arial, sans-serif; font-size:medium;'>current version</span></a><span style='font-family:Avenir Next W01, Avenir Next W00, Avenir Next, Avenir, Helvetica Neue, Helvetica, Arial, sans-serif; font-size:medium;'><font style='font-family:&quot;Avenir Next W01&quot;, &quot;Avenir Next W00&quot;, &quot;Avenir Next&quot;, Avenir, &quot;Helvetica Neue&quot;, Helvetica, Arial, sans-serif;'> of this dataset. All the current versions of Stats NZ Boundary layers can be found </font></span><a target='_blank' href='https://www.arcgis.com/home/group.html?id=b22e4f0012a8426dac21cd3d02f25c67' rel='nofollow ugc noopener noreferrer'><span style='font-family:Avenir Next W01, Avenir Next W00, Avenir Next, Avenir, Helvetica Neue, Helvetica, Arial, sans-serif; font-size:medium;'><font style='font-family:&quot;Avenir Next W01&quot;, &quot;Avenir Next W00&quot;, &quot;Avenir Next&quot;, Avenir, &quot;Helvetica Neue&quot;, Helvetica, Arial, sans-serif;'>here</font></span></a><span style='font-family:Avenir Next W01, Avenir Next W00, Avenir Next, Avenir, Helvetica Neue, Helvetica, Arial, sans-serif; font-size:medium;'><font style='font-family:&quot;Avenir Next W01&quot;, &quot;Avenir Next W00&quot;, &quot;Avenir Next&quot;, Avenir, &quot;Helvetica Neue&quot;, Helvetica, Arial, sans-serif;'>.</font></span><br />&nbsp;</div><div><span style='font-family:Avenir Next W01, Avenir Next W00, Avenir Next, Avenir, Helvetica Neue, Helvetica, Arial, sans-serif; font-size:medium;'><font style='font-family:&quot;Avenir Next W01&quot;, &quot;Avenir Next W00&quot;, &quot;Avenir Next&quot;, Avenir, &quot;Helvetica Neue&quot;, Helvetica, Arial, sans-serif;'>The official dataset can be found on&nbsp;</font></span><a target='_blank' href='https://datafinder.stats.govt.nz/data/category/annual-boundaries/2022/' rel='nofollow ugc noopener noreferrer'><span style='font-family:Avenir Next W01, Avenir Next W00, Avenir Next, Avenir, Helvetica Neue, Helvetica, Arial, sans-serif; font-size:medium;'>https://datafinder.stats.govt.nz.</span></a></div><div style='font-family:&quot;Avenir Next W01&quot;, &quot;Avenir Next W00&quot;, &quot;Avenir Next&quot;, Avenir, &quot;Helvetica Neue&quot;, Helvetica, Arial, sans-serif !important; font-size:17px;'>&nbsp;</div><div style='font-family:&quot;Avenir Next W01&quot;, &quot;Avenir Next W00&quot;, &quot;Avenir Next&quot;, Avenir, &quot;Helvetica Neue&quot;, Helvetica, Arial, sans-serif !important; font-size:17px;'><div><span style='color:#2f4f4f; font-size:medium;'>This layer is offered by Eagle Technology (Official Esri Distributor). Eagle Technology offers services that can be used in the ArcGIS platform. The Content team at Eagle Technology updates the layers on a regular basis and regularly adds new content to the Living Atlas. By using this content and combining it with other data you can create new information products quickly and easily.</span></div><div>&nbsp;</div><div><span style='color:#2f4f4f; font-size:medium;'>If you have any questions or comments about the content, please let us now&nbsp; at&nbsp;</span><a style='color:rgb(0, 121, 193); text-decoration-line:none;' href='mailto:livingatlas@eagle.co.nz' target='_blank' rel='nofollow ugc noopener noreferrer'><span style='font-size:medium;'>livingatlas@eagle.co.nz</span></a><span style='font-size:medium;'>.</span></div></div>",
			"keyword": [
				"Boundary",
				"Boundaries",
				"New zealand",
				"Statistics New Zealand",
				"StatsNZ",
				"Eagle technology",
				"Nz",
				"Content",
				"Kiwi",
				"eaglegis"
			],
			"issued": "2023-04-05T05:07:08.000Z",
			"modified": "2025-12-19T00:26:34.025Z",
			"publisher": {
				"name": "Eagle Technology Group Ltd"
			},
			"contactPoint": {
				"@type": "vcard:Contact",
				"fn": "eaglegis",
				"hasEmail": "mailto:ts@eaglegis.co.nz"
			},
			"accessLevel": "public",
			"spatial": "166.2620,-47.2230,-177.6189,-33.7734",
			"license": "https://creativecommons.org/licenses/by/4.0",
			"distribution": [
				{
					"@type": "dcat:Distribution",
					"title": "ArcGIS Hub Dataset",
					"format": "Web Page",
					"mediaType": "text/html",
					"accessURL": "https://www.pacificgeoportal.com/datasets/eaglegis::nz-statistical-areas-3-archive"
				},
				{
					"@type": "dcat:Distribution",
					"title": "ArcGIS GeoService",
					"format": "ArcGIS GeoServices REST API",
					"mediaType": "application/json",
					"accessURL": "https://services.arcgis.com/XTtANUDT8Va4DLwI/arcgis/rest/services/nz_statistical_areas_3_archive/FeatureServer/0"
				},
				{
					"@type": "dcat:Distribution",
					"title": "CSV",
					"format": "CSV",
					"mediaType": "text/csv",
					"accessURL": "https://www.pacificgeoportal.com/api/download/v1/items/145414c973944521ab244f2ba54420c8/csv?layers=0"
				},
				{
					"@type": "dcat:Distribution",
					"title": "Shapefile",
					"format": "ZIP",
					"mediaType": "application/zip",
					"accessURL": "https://www.pacificgeoportal.com/api/download/v1/items/145414c973944521ab244f2ba54420c8/shapefile?layers=0"
				},
				{
					"@type": "dcat:Distribution",
					"title": "GeoJSON",
					"format": "GeoJSON",
					"mediaType": "application/vnd.geo+json",
					"accessURL": "https://www.pacificgeoportal.com/api/download/v1/items/145414c973944521ab244f2ba54420c8/geojson?layers=0"
				},
				{
					"@type": "dcat:Distribution",
					"title": "KML",
					"format": "KML",
					"mediaType": "application/vnd.google-earth.kml+xml",
					"accessURL": "https://www.pacificgeoportal.com/api/download/v1/items/145414c973944521ab244f2ba54420c8/kml?layers=0"
				},
				{
					"@type": "dcat:Distribution",
					"title": "File Geodatabase",
					"format": "ZIP",
					"mediaType": "application/zip",
					"accessURL": "https://www.pacificgeoportal.com/api/download/v1/items/145414c973944521ab244f2ba54420c8/filegdb?layers=0"
				},
				{
					"@type": "dcat:Distribution",
					"title": "Feature Collection",
					"format": "TXT",
					"mediaType": "text/plain",
					"accessURL": "https://www.pacificgeoportal.com/api/download/v1/items/145414c973944521ab244f2ba54420c8/featureCollection?layers=0"
				},
				{
					"@type": "dcat:Distribution",
					"title": "Excel",
					"format": "XLSX",
					"mediaType": "application/vnd.ms-excel",
					"accessURL": "https://www.pacificgeoportal.com/api/download/v1/items/145414c973944521ab244f2ba54420c8/excel?layers=0"
				},
				{
					"@type": "dcat:Distribution",
					"title": "GeoPackage",
					"format": "GPKG",
					"mediaType": "application/geopackage+sqlite3",
					"accessURL": "https://www.pacificgeoportal.com/api/download/v1/items/145414c973944521ab244f2ba54420c8/geoPackage?layers=0"
				},
				{
					"@type": "dcat:Distribution",
					"title": "SQLite Geodatabase",
					"format": "GDB",
					"mediaType": "application/geopackage+sqlite3",
					"accessURL": "https://www.pacificgeoportal.com/api/download/v1/items/145414c973944521ab244f2ba54420c8/sqlite?layers=0"
				}
			],
			"theme": [
				"geospatial"
			]
		},
		{
			"@type": "dcat:Dataset",
			"identifier": "https://www.arcgis.com/home/item.html?id=debfba9824d04bfabedc0216ed74b687",
			"landingPage": "https://www.pacificgeoportal.com/datasets/esri::global-solar-atlas",
			"title": "Global Solar Atlas",
			"description": "<div>The <a href='https://globalsolaratlas.info/support/about' rel='nofollow ugc' target='_blank'>Global Solar Atlas</a> provide relevant information of solar power potential for energy generation. It is a project administered by the <a href='https://www.worldbank.org/en/topic/energy' rel='nofollow ugc' target='_blank'>World Bank Group</a> as part of the Energy Sector Assistance Program (<a href='https://www.esmap.org/re_mapping' rel='nofollow ugc' target='_blank'>ESMAP</a>). The Global Solar Atlas was implemented by <a href='https://solargis.com/' rel='nofollow ugc' target='_blank'>Solargis</a>. The goal of the atlas is to expose solar resource and photovoltaic power potential data.</div><div><br /></div><div><font size='4'>Output variables as processing templates:</font><br /></div><div><div><ul><li><b>PV electricity output</b>: Total electrical energy produced per capacity installed (kWh/kWp) per year</li><li><b>Monthly PV electricity output (12 layers)</b>: Average monthly electrical energy produced per capacity installed (x1,000 kWh/kWp) per day.</li><li><b>Direct normal irradiation</b>: Amount of solar energy per unit area (kWh/m2) coming from a direct (i.e. perpendicular) path</li><li><b>Diffuse horizontal irradiation</b>: Amount of solar energy per unit area (kWh/m2) received from scattered sources (e.g. clouds)</li><li><b>Global horizontal irradiation</b>: Amount of solar radiation received (kWh/m2) at a theoretical plane horizontal to the ground</li><li><b>Global tilted irradiation at optimum angle</b>: Largest amount of solar radiation that can be received (kWh/m2) at the ground at the optimum angle (i.e. OPTA)</li><li><b>Optimum tilt of PV modules</b>: Optimal angle (segrees) of a plane that receives the highest solar radiation.</li><li><b>Air temperature</b>: Annual average of air temperature (°C) at 2m from the ground</li><li><b>Elevation</b>: Elevation (m) above mean sea level.</li></ul></div></div><div><font size='4'>What can you do with this layer?</font><br /></div><div><font size='4'><br /></font></div><div><font size='3'>This layer can be used to primarily to estimate the total energy yield of a PV system and its inter-annual variation or compare energy yield between sites. The layer can also be used to determine the optimal angle of PV panels and quantify the gap between received radiation at a horizontal plane against the radiation received in a plane tilted at the optimal angle. This layer can also be used to quantify the difference between direct and diffuse irradiation for a given location. Additionally, the layer provides information on the mean air temperature and elevation used in the model.</font><br /></div><div><font size='3'><br /></font></div><div><font size='4'>Associated web maps</font><br /></div><div><ul><li><a href='https://www.arcgis.com/home/item.html?id=a1d765ba08b543c5a0ecacf24ae7ff15' rel='nofollow ugc' target='_blank'>PV electricity output</a><br /></li><li><a href='https://www.arcgis.com/home/item.html?id=f589564ae8d64ecba49bf2b486cfebfd' rel='nofollow ugc' target='_blank'>Horizontal and tilted irradiations</a><br /></li><li><a href='https://www.arcgis.com/home/item.html?id=5d7f7be285ce4a2c8b5c325c4d9a8270' rel='nofollow ugc' target='_blank'>Direct and diffuse irradiations</a></li></ul><div><b>Cell Size</b>: 30 arc-seconds</div><div><b>Source Type</b>: Continous</div><div><b>Pixel Type</b>: Integer</div><div><b>Projection</b>: GCS WGS84</div><div><b>Extent</b>: Global</div><div><b>Source</b>: Global Solar Atlas</div><div><b>ArcGIS Server URL</b>: https://earthobs3.arcgis.com/arcgis</div></div>",
			"keyword": [
				"esri_environment",
				"environment",
				"earthobs3",
				"Solar",
				"Radiation",
				"Energy",
				"Environment",
				"Irradiance",
				"PV electricity output"
			],
			"issued": "2020-03-19T02:52:53.000Z",
			"modified": "2022-03-16T00:57:36.000Z",
			"publisher": {
				"name": "Esri"
			},
			"contactPoint": {
				"@type": "vcard:Contact",
				"fn": "esri_observations",
				"hasEmail": "{{orgContactEmail}}"
			},
			"accessLevel": "public",
			"spatial": "-180.0000,-55.0000,180.0000,60.0000",
			"license": "<img src='https://downloads.esri.com/blogs/arcgisonline/esrilogo_new.png' />This work is licensed under the Esri Master License Agreement. <br /><div><a href='https://goto.arcgis.com/termsofuse/viewsummary' rel='nofollow ugc' target='_blank'><b>View Summary</b></a> | <a href='https://goto.arcgis.com/termsofuse/viewtermsofuse' rel='nofollow ugc' target='_blank'><b>View Terms of Use</b></a> </div><div><span><br /></span></div><div><font color='#b22222'>Important Note:</font> This item requires an ArcGIS Online organizational subscription or an ArcGIS Developer account and does not consume credits. To access this item, you'll need to do one of the following: </div><div><ul><li>Sign in with an account that is a member of an organizational subscription </li><li>Sign in with a developer account </li><li><a href='https://goto.arcgis.com/termsofuse/registeranapplication' rel='nofollow ugc' target='_blank'>Register an application</a> and use your application's credentials.</li></ul>If you don't have an account, you can sign up for a <a href='https://goto.arcgis.com/features/trial' rel='nofollow ugc' target='_blank'>free trial of ArcGIS</a> or a <a href='https://goto.arcgis.com/developers/signup' rel='nofollow ugc' target='_blank'>free ArcGIS Developer account</a>.</div>",
			"distribution": [
				{
					"@type": "dcat:Distribution",
					"title": "ArcGIS Hub Dataset",
					"format": "Web Page",
					"mediaType": "text/html",
					"accessURL": "https://www.pacificgeoportal.com/datasets/esri::global-solar-atlas"
				},
				{
					"@type": "dcat:Distribution",
					"title": "ArcGIS GeoService",
					"format": "ArcGIS GeoServices REST API",
					"mediaType": "application/json",
					"accessURL": "https://earthobs3.arcgis.com/arcgis/rest/services/GlobalSolarAtlas/ImageServer"
				}
			],
			"theme": [
				"geospatial"
			]
		},
		{
			"@type": "dcat:Dataset",
			"identifier": "https://www.arcgis.com/home/item.html?id=f0ceb8af000a4ffbae75d742538c548b",
			"landingPage": "https://www.pacificgeoportal.com/maps/esri::world-administrative-divisions-2",
			"title": "World Administrative Divisions",
			"description": "<p>World Administrative Divisions is a detailed dataset of country first level administrative boundaries which can be used at both large and small scales.  It has been designed to be used as a basemap that can be easily edited to fit a users needs and view of the political world.  Included are attributes for name and ISO codes, along with notes identifying disputed boundaries and continent information.  Particularly useful are the Land_Type and Land_Rank fields which separate polygons based on their areal size. These attributes are useful for rendering at different scales by providing the ability to turn off small islands which may clutter small scale views.<br /></p><p><span style='display:inline-block; clear:both;'><font size='3'>Layers</font></span><span style='display:block;'><span style='padding:0.3em 0px; display:block;'><a href='https://services.arcgis.com/P3ePLMYs2RVChkJx/arcgis/rest/services/World_Administrative_Divisions/FeatureServer/0?token=Ujq72kP1ED9pLQenB2rSKdGJ_T21N5J1wulxDE1dtCbVO9se5yfOh_7zBLV-u-oM5buCtlRMAaSrzgdp5imfle9Ie4kxXIRwJz6JWpykGG-fkjXBL7cQn0sTqDluZCmNaK5Fsh_aejlZLt7yMjix7fgawQMiJZQJVkXXJZK0Gt8oRZl4r7H6VicfbrSw7ZT6' target='_blank' rel='nofollow ugc noopener noreferrer'>World_Administrative_Divisions</a></span></span></p>",
			"keyword": [
				"world",
				"map",
				"administrative divisions",
				"first-order admin",
				"states",
				"provinces",
				"boundaries"
			],
			"issued": "2014-06-20T13:00:48.000Z",
			"modified": "2025-11-19T07:24:42.000Z",
			"publisher": {
				"name": "Esri"
			},
			"contactPoint": {
				"@type": "vcard:Contact",
				"fn": "esri_basemaps",
				"hasEmail": "{{orgContactEmail}}"
			},
			"accessLevel": "public",
			"spatial": "-30.4981,7.0271,99.3163,62.0691",
			"license": "<img src='https://downloads.esri.com/blogs/arcgisonline/esrilogo_new.png' /> This work is licensed under the Esri Master License Agreement.<br /><div><a href='https://goto.arcgis.com/termsofuse/viewsummary' rel='nofollow ugc' target='_blank'><b>View Summary</b></a> | <a href='https://goto.arcgis.com/termsofuse/viewtermsofuse' rel='nofollow ugc' target='_blank'><b>View Terms of Use</b></a></div>",
			"distribution": [
				{
					"@type": "dcat:Distribution",
					"title": "ArcGIS Hub Dataset",
					"format": "Web Page",
					"mediaType": "text/html",
					"accessURL": "https://www.pacificgeoportal.com/maps/esri::world-administrative-divisions-2"
				}
			],
			"theme": [
				"geospatial"
			]
		},
		{
			"@type": "dcat:Dataset",
			"identifier": "https://www.arcgis.com/home/item.html?id=2babc25943a141b88bdb8fd6d7a44868",
			"landingPage": "https://www.pacificgeoportal.com/maps/esri::purchasing-power-per-capita-in-new-zealand",
			"title": "Purchasing Power per Capita in New Zealand",
			"description": "<p>\n    <span style='color:#b22222;'><strong>Retirement Notice:</strong></span><strong>&nbsp;This item is in&nbsp;</strong><a target='_blank' href='https://goto.arcgisonline.com/lifecycle/content' rel='nofollow ugc noopener noreferrer'><strong>mature support</strong></a><strong>&nbsp;as of November 2025 and will be retired in December 2026.</strong> A replacement item has not been identified at this time. Esri recommends updating your maps and apps to phase out use of this item.\n</p><div style='margin: 0px; padding: 0px;'>This map shows the purchasing power per capita in New Zealand in 2021, in a multiscale map (Country, Region, Territorial Authority, and Statistical Area). Nationally, the purchasing power per capita is <b>36,747 New Zealand dollar</b>. Purchasing Power describes the disposable income (income without taxes and social security contributions, including received transfer payments) of a certain area's population. The figures are in New Zealand dollar (NZD) per capita.<br /></div><div style='margin: 0px; padding: 0px;'><div style='margin: 0px; padding: 0px;'><br /></div><div style='margin: 0px; padding: 0px;'>The pop-up is configured to show the following information at each geography level:</div><div style='margin: 0px; padding: 0px;'><ul><li>Purchasing power per capita</li><li>Purchasing power per capita by various categories</li></ul><div style='margin: 0px; padding: 0px;'>The source of this data is <a href='https://www.mb-research.de/' style='outline: none !important;' target='_blank' rel='nofollow ugc noopener noreferrer'>Michael Bauer Research</a>. The vintage of the data is 2021. This item was last updated in November, 2022 and is updated every 12-18 months as new annual figures are offered.<br /></div></div><div style='margin: 0px; padding: 0px;'><br /></div><div style='margin: 0px; padding: 0px;'><div style='margin: 0px; padding: 0px;'>Additional Esri Resources:<br /></div><div style='margin: 0px; padding: 0px;'><ul><li><a href='https://doc.arcgis.com/en/esri-demographics/' style='outline: none !important;' target='_blank' rel='nofollow ugc noopener noreferrer'>Esri Demographics</a></li></ul><div>This item is for visualization purposes only and cannot be exported or used in analysis.</div><div><br /></div></div></div>We would love to hear from you. If you have any feedback regarding this item or Esri Demographics, <a href='mailto:jholtzclaw@esri.com;scleary@esri.com subject=Esri Demographics Feedback' rel='nofollow ugc'>please let us know</a>.<br /></div><div><br /></div></div></div></div><div style='margin: 0px; padding: 0px;'><font size='small'><b>Permitted use of this data is covered in the DATA section of the <a href='https://www.esri.com/en-us/legal/terms/master-agreement-product' style='' rel='nofollow ugc'>Esri Master Agreement (E204CW)</a> and these <a href='https://www.esri.com/en-us/legal/terms/data-attributions' style='' rel='nofollow ugc'>supplemental terms</a>.</b></font></div>",
			"keyword": [
				"New Zealand Dollar",
				"spending",
				"demographics",
				"NZD",
				"census",
				"Purchasing Power",
				"maps",
				"KeyFacts",
				"New Zealand dollar",
				"Oceania",
				"purchasing power per capita",
				"income",
				"New Zealand",
				"NZL",
				"household",
				"population",
				"retiring-2026-12"
			],
			"issued": "2013-07-10T23:34:00.000Z",
			"modified": "2025-11-12T23:43:42.000Z",
			"publisher": {
				"name": "Esri"
			},
			"contactPoint": {
				"@type": "vcard:Contact",
				"fn": "esri_demographics",
				"hasEmail": "{{orgContactEmail}}"
			},
			"accessLevel": "public",
			"spatial": "174.6370,-41.3377,174.8906,-41.2298",
			"license": "<img alt='' src='https://downloads.esri.com/blogs/arcgisonline/esrilogo_new.png' />This work is licensed under the Esri Master License Agreement. <br /><div><a href='https://goto.arcgis.com/termsofuse/viewsummary' target='_blank' rel='nofollow ugc noopener noreferrer'><b>View Summary</b></a> | <a href='https://goto.arcgis.com/termsofuse/viewtermsofuse' target='_blank' rel='nofollow ugc noopener noreferrer'><b>View Terms of Use</b></a> </div><div><br /></div><b>Permitted use of this data is covered in the DATA section of the <a href='https://www.esri.com/en-us/legal/terms/master-agreement-product' style='' rel='nofollow ugc'>Esri Master Agreement (E204CW)</a> and these <a href='https://www.esri.com/en-us/legal/terms/data-attributions' style='' rel='nofollow ugc'>supplemental terms</a>.</b><br /><br /><div><font color='#b22222'>Important Note:</font> This item requires an ArcGIS Online organizational subscription or an ArcGIS Developer account and <a href='https://goto.arcgis.com/features/credits' target='_blank' rel='nofollow ugc noopener noreferrer'>consumes credits</a>. To access this item, you'll need to do one of the following: </div><div><ul><li>Sign in with an account that is a member of an organizational subscription </li><li>Sign in with a developer account </li><li><a href='https://goto.arcgis.com/termsofuse/registeranapplication' target='_blank' rel='nofollow ugc noopener noreferrer'>Register an application</a> and use your application's credentials.</li></ul>If you don't have an account, you can sign up for a <a href='https://goto.arcgis.com/features/trial' target='_blank' rel='nofollow ugc noopener noreferrer'>free trial of ArcGIS</a> or a <a href='https://goto.arcgis.com/developers/signup' target='_blank' rel='nofollow ugc noopener noreferrer'>free ArcGIS Developer account</a>.</div>",
			"distribution": [
				{
					"@type": "dcat:Distribution",
					"title": "ArcGIS Hub Dataset",
					"format": "Web Page",
					"mediaType": "text/html",
					"accessURL": "https://www.pacificgeoportal.com/maps/esri::purchasing-power-per-capita-in-new-zealand"
				}
			],
			"theme": [
				"geospatial"
			]
		},
		{
			"@type": "dcat:Dataset",
			"identifier": "https://www.arcgis.com/home/item.html?id=042df78bdf4848c1bd937252c6b3fd5e",
			"landingPage": "https://www.pacificgeoportal.com/maps/esri::purchasing-power-per-capita-in-malaysia",
			"title": "Purchasing Power per Capita in Malaysia",
			"description": "<p>\n    <span style='color:#b22222;'><strong>Retirement Notice:</strong></span><strong>&nbsp;This item is in&nbsp;</strong><a target='_blank' href='https://goto.arcgisonline.com/lifecycle/content' rel='nofollow ugc noopener noreferrer'><strong>mature support</strong></a><strong>&nbsp;as of November 2025 and will be retired in December 2026.</strong> A replacement item has not been identified at this time. Esri recommends updating your maps and apps to phase out use of this item.\n</p><div style='margin: 0px; padding: 0px;'>This map shows the purchasing power per capita in Malaysia in 2022, in a multiscale map (Country, State, District, and Subdistrict). Nationally, the purchasing power per capita is <b>23,837 Malaysian ringgit</b>. Purchasing Power describes the disposable income (income without taxes and social security contributions, including received transfer payments) of a certain area's population. The figures are in Malaysian ringgit (MYR) per capita.<br /></div><div style='margin: 0px; padding: 0px;'><div style='margin: 0px; padding: 0px;'><br /></div><div style='margin: 0px; padding: 0px;'>The pop-up is configured to show the following information at each geography level:</div><div><ul><li>Purchasing power per capita</li><li>Purchasing power for various goods and services</li></ul></div><div><div>The source of this data is <a href='https://www.mb-research.de/' style='outline: none !important;' target='_blank' rel='nofollow ugc noopener noreferrer'>Michael Bauer Research</a>. The vintage of the data is 2022. This item was last updated in November, 2022 and is updated every 12-18 months as new annual figures are offered.<br /></div></div><div style='margin: 0px; padding: 0px;'><br /></div><div style='margin: 0px; padding: 0px;'><div style='margin: 0px; padding: 0px;'>Additional Esri Resources:<br /></div><div style='margin: 0px; padding: 0px;'><ul><li><a href='https://doc.arcgis.com/en/esri-demographics/' style='outline: none !important;' target='_blank' rel='nofollow ugc noopener noreferrer'>Esri Demographics</a></li></ul><div>This item is for visualization purposes only and cannot be exported or used in analysis.</div><div><br /></div></div></div>We would love to hear from you. If you have any feedback regarding this item or Esri Demographics, <a href='mailto:jholtzclaw@esri.com;scleary@esri.com subject=Esri Demographics Feedback' rel='nofollow ugc'>please let us know</a>.<br /></div><div><br /></div></div></div></div><div style='margin: 0px; padding: 0px;'><font size='small'><b>Permitted use of this data is covered in the DATA section of the <a href='https://www.esri.com/en-us/legal/terms/master-agreement-product' style='' rel='nofollow ugc'>Esri Master Agreement (E204CW)</a> and these <a href='https://www.esri.com/en-us/legal/terms/data-attributions' style='' rel='nofollow ugc'>supplemental terms</a>.</b></font></div>",
			"keyword": [
				"population",
				"census",
				"MYS",
				"maps",
				"spending",
				"ringgit",
				"demographics",
				"MYR",
				"Asia",
				"Purchasing Power",
				"Malaysia",
				"KeyFacts",
				"purchasing power per capita",
				"National",
				"income",
				"Malaysian ringgit",
				"Malaysian Ringgit",
				"age",
				"household",
				"age increments",
				"retiring-2026-12"
			],
			"issued": "2013-07-10T23:04:08.000Z",
			"modified": "2025-11-12T23:43:22.000Z",
			"publisher": {
				"name": "Esri"
			},
			"contactPoint": {
				"@type": "vcard:Contact",
				"fn": "esri_demographics",
				"hasEmail": "{{orgContactEmail}}"
			},
			"accessLevel": "public",
			"spatial": "101.2664,2.8636,102.2805,3.4306",
			"license": "<img alt='' src='https://downloads.esri.com/blogs/arcgisonline/esrilogo_new.png' />This work is licensed under the Esri Master License Agreement. <br /><div><a href='https://goto.arcgis.com/termsofuse/viewsummary' target='_blank' rel='nofollow ugc noopener noreferrer'><b>View Summary</b></a> | <a href='https://goto.arcgis.com/termsofuse/viewtermsofuse' target='_blank' rel='nofollow ugc noopener noreferrer'><b>View Terms of Use</b></a> </div><div><br /></div><b>Permitted use of this data is covered in the DATA section of the <a href='https://www.esri.com/en-us/legal/terms/master-agreement-product' style='' rel='nofollow ugc'>Esri Master Agreement (E204CW)</a> and these <a href='https://www.esri.com/en-us/legal/terms/data-attributions' style='' rel='nofollow ugc'>supplemental terms</a>.</b><br /><br /><div><font color='#b22222'>Important Note:</font> This item requires an ArcGIS Online organizational subscription or an ArcGIS Developer account and <a href='https://goto.arcgis.com/features/credits' target='_blank' rel='nofollow ugc noopener noreferrer'>consumes credits</a>. To access this item, you'll need to do one of the following: </div><div><ul><li>Sign in with an account that is a member of an organizational subscription </li><li>Sign in with a developer account </li><li><a href='https://goto.arcgis.com/termsofuse/registeranapplication' target='_blank' rel='nofollow ugc noopener noreferrer'>Register an application</a> and use your application's credentials.</li></ul>If you don't have an account, you can sign up for a <a href='https://goto.arcgis.com/features/trial' target='_blank' rel='nofollow ugc noopener noreferrer'>free trial of ArcGIS</a> or a <a href='https://goto.arcgis.com/developers/signup' target='_blank' rel='nofollow ugc noopener noreferrer'>free ArcGIS Developer account</a>.</div>",
			"distribution": [
				{
					"@type": "dcat:Distribution",
					"title": "ArcGIS Hub Dataset",
					"format": "Web Page",
					"mediaType": "text/html",
					"accessURL": "https://www.pacificgeoportal.com/maps/esri::purchasing-power-per-capita-in-malaysia"
				}
			],
			"theme": [
				"geospatial"
			]
		},
		{
			"@type": "dcat:Dataset",
			"identifier": "https://www.arcgis.com/home/item.html?id=1a0bf8be90f14c65b59fbb432b196079",
			"landingPage": "https://www.pacificgeoportal.com/maps/esri::purchasing-power-per-capita-in-indonesia",
			"title": "Purchasing Power per Capita in Indonesia",
			"description": "<p>\n    <span style='color:#b22222;'><strong>Retirement Notice:</strong></span><strong>&nbsp;This item is in&nbsp;</strong><a target='_blank' href='https://goto.arcgisonline.com/lifecycle/content' rel='nofollow ugc noopener noreferrer'><strong>mature support</strong></a><strong>&nbsp;as of November 2025 and will be retired in December 2026.</strong> A replacement item has not been identified at this time. Esri recommends updating your maps and apps to phase out use of this item.\n</p><div style='margin:0px; padding:0px;'>This map shows the purchasing power per capita in Indonesia in 2022, in a multiscale map (Country, Province, County, District, and Subdistrict). Nationally, the purchasing power per capita is <b>36,387,408 Indonesian rupiah</b>. Purchasing Power describes the disposable income (income without taxes and social security contributions, including received transfer payments) of a certain area's population. The figures are in Indonesian rupiah (IDR) per capita.<br /></div><div style='margin:0px; padding:0px;'><div style='margin:0px; padding:0px;'><br /></div><div style='margin:0px; padding:0px;'>The pop-up is configured to show the following information at each geography level:</div><div style='margin:0px; padding:0px;'><ul><li>Purchasing power per capita</li><li><span style='margin:0px; padding:0px;'>Purchasing power per capita index</span></li><li>Counts of population by education level</li></ul><div style='margin:0px; padding:0px;'>The Purchasing Power Index compares the demand for a specific purchasing category in an area, with the national demand for that product or service. The index values at the national level are 100, representing average demand for the country. A value of more than 100 represents higher demand than the national average, and a value of less than 100 represents lower demand than the national average. For example, an index of 120 implies that demand in the area is 20 percent higher than the national average; an index of 80 implies that demand is 20 percent lower than the national average.</div><div style='margin:0px; padding:0px;'><br /></div><div style='margin:0px; padding:0px;'>The source of this data is <a href='https://www.mb-research.de/' target='_blank' rel='nofollow ugc noopener noreferrer'>Michael Bauer Research</a>. The vintage of the data is 2022. This item was last updated in November, 2022 and is updated every 12-18 months as new annual figures are offered.<br /></div></div><div style='margin:0px; padding:0px;'><br /></div><div style='margin:0px; padding:0px;'><div style='margin:0px; padding:0px;'>Additional Esri Resources:<br /></div><div style='margin:0px; padding:0px;'><ul><li><a href='https://doc.arcgis.com/en/esri-demographics/' target='_blank' rel='nofollow ugc noopener noreferrer'>Esri Demographics</a></li></ul><div>This item is for visualization purposes only and cannot be exported or used in analysis.</div><div><br /></div></div></div>We would love to hear from you. If you have any feedback regarding this item or Esri Demographics, <a href='mailto:jholtzclaw@esri.com;scleary@esri.com subject=Esri Demographics Feedback' rel='nofollow ugc'>please let us know</a>.<br /></div><div><br /></div><div style='margin:0px; padding:0px;'><font size='small'><b>Permitted use of this data is covered in the DATA section of the <a href='https://www.esri.com/en-us/legal/terms/master-agreement-product' rel='nofollow ugc'>Esri Master Agreement (E204CW)</a> and these <a href='https://www.esri.com/en-us/legal/terms/data-attributions' rel='nofollow ugc'>supplemental terms</a>.</b></font></div>",
			"keyword": [
				"education",
				"Indonesian Rupiah",
				"spending",
				"demographics",
				"Indonesia",
				"IDR",
				"Asia",
				"IDN",
				"KeyFacts",
				"purchasing power per capita",
				"income",
				"Indonesian rupiah",
				"Rupiah",
				"retiring-2026-12"
			],
			"issued": "2013-07-05T22:06:51.000Z",
			"modified": "2025-11-12T23:42:55.000Z",
			"publisher": {
				"name": "Esri"
			},
			"contactPoint": {
				"@type": "vcard:Contact",
				"fn": "esri_demographics",
				"hasEmail": "{{orgContactEmail}}"
			},
			"accessLevel": "public",
			"spatial": "105.7412,-6.7671,107.7696,-5.6038",
			"license": "<img alt='' src='https://downloads.esri.com/blogs/arcgisonline/esrilogo_new.png' />This work is licensed under the Esri Master License Agreement. <br /><div><a href='https://goto.arcgis.com/termsofuse/viewsummary' target='_blank' rel='nofollow ugc noopener noreferrer'><b>View Summary</b></a> | <a href='https://goto.arcgis.com/termsofuse/viewtermsofuse' target='_blank' rel='nofollow ugc noopener noreferrer'><b>View Terms of Use</b></a> </div><div><br /></div><b>Permitted use of this data is covered in the DATA section of the <a href='https://www.esri.com/en-us/legal/terms/master-agreement-product' style='' rel='nofollow ugc'>Esri Master Agreement (E204CW)</a> and these <a href='https://www.esri.com/en-us/legal/terms/data-attributions' style='' rel='nofollow ugc'>supplemental terms</a>.</b><br /><br /><div><font color='#b22222'>Important Note:</font> This item requires an ArcGIS Online organizational subscription or an ArcGIS Developer account and <a href='https://goto.arcgis.com/features/credits' target='_blank' rel='nofollow ugc noopener noreferrer'>consumes credits</a>. To access this item, you'll need to do one of the following: </div><div><ul><li>Sign in with an account that is a member of an organizational subscription </li><li>Sign in with a developer account </li><li><a href='https://goto.arcgis.com/termsofuse/registeranapplication' target='_blank' rel='nofollow ugc noopener noreferrer'>Register an application</a> and use your application's credentials.</li></ul>If you don't have an account, you can sign up for a <a href='https://goto.arcgis.com/features/trial' target='_blank' rel='nofollow ugc noopener noreferrer'>free trial of ArcGIS</a> or a <a href='https://goto.arcgis.com/developers/signup' target='_blank' rel='nofollow ugc noopener noreferrer'>free ArcGIS Developer account</a>.</div>",
			"distribution": [
				{
					"@type": "dcat:Distribution",
					"title": "ArcGIS Hub Dataset",
					"format": "Web Page",
					"mediaType": "text/html",
					"accessURL": "https://www.pacificgeoportal.com/maps/esri::purchasing-power-per-capita-in-indonesia"
				}
			],
			"theme": [
				"geospatial"
			]
		},
		{
			"@type": "dcat:Dataset",
			"identifier": "https://www.arcgis.com/home/item.html?id=649dbc3989fc4f37862a9cd1de8e6bf7",
			"landingPage": "https://www.pacificgeoportal.com/maps/esri::purchasing-power-per-capita-in-australia",
			"title": "Purchasing Power per Capita in Australia",
			"description": "<p>\n    <span style='color:#b22222;'><strong>Retirement Notice:</strong></span><strong>&nbsp;This item is in&nbsp;</strong><a target='_blank' href='https://goto.arcgisonline.com/lifecycle/content' rel='nofollow ugc noopener noreferrer'><strong>mature support</strong></a><strong>&nbsp;as of November 2025 and will be retired in December 2026.</strong> A replacement item has not been identified at this time. Esri recommends updating your maps and apps to phase out use of this item.\n</p><div style='margin: 0px; padding: 0px;'>This map shows the purchasing power per capita in Australia in 2021, in a multiscale map (Country, State, Statistical Area Level 4, Statistical Area Level 3, Local Government Area, Statistical Area Level 2, and Statistical Area Level 1). Nationally, the purchasing power per capita is <b>46,706 Australian dollar</b>. Purchasing Power describes the disposable income (income without taxes and social security contributions, including received transfer payments) of a certain area's population. The figures are in Australian dollar (AUD) per capita.<br /></div><div style='margin: 0px; padding: 0px;'><div style='margin: 0px; padding: 0px;'><br /></div><div style='margin: 0px; padding: 0px;'>The pop-up is configured to show the following information at each geography level:</div><div><ul><li>Purchasing power per capita</li><li>Purchasing power for various goods and services</li><li>Counts of households by income quintiles<br /></li></ul><div>The source of this data is <a href='https://www.mb-research.de/' style='outline: none !important;' target='_blank' rel='nofollow ugc noopener noreferrer'>Michael Bauer Research</a>. The vintage of the data is 2021. This item was last updated in November, 2022 and is updated every 12-18 months as new annual figures are offered.<br /></div></div><div style='margin: 0px; padding: 0px;'><br /></div><div style='margin: 0px; padding: 0px;'><div style='margin: 0px; padding: 0px;'>Additional Esri Resources:<br /></div><div style='margin: 0px; padding: 0px;'><ul><li><a href='https://doc.arcgis.com/en/esri-demographics/' style='outline: none !important;' target='_blank' rel='nofollow ugc noopener noreferrer'>Esri Demographics</a></li></ul><div>This item is for visualization purposes only and cannot be exported or used in analysis.</div><div><br /></div></div></div>We would love to hear from you. If you have any feedback regarding this item or Esri Demographics, <a href='mailto:jholtzclaw@esri.com;scleary@esri.com subject=Esri Demographics Feedback' rel='nofollow ugc'>please let us know</a>.<br /></div><div><br /></div></div></div></div><div style='margin: 0px; padding: 0px;'><font size='small'><b>Permitted use of this data is covered in the DATA section of the <a href='https://www.esri.com/en-us/legal/terms/master-agreement-product' style='' rel='nofollow ugc'>Esri Master Agreement (E204CW)</a> and these <a href='https://www.esri.com/en-us/legal/terms/data-attributions' style='' rel='nofollow ugc'>supplemental terms</a>.</b></font></div>",
			"keyword": [
				"Australia",
				"AUD",
				"Australian Dollar",
				"spending",
				"household",
				"Australian dollar",
				"AUS",
				"KeyFacts",
				"census",
				"Oceania",
				"purchasing power per capita",
				"income",
				"population",
				"demographics",
				"size",
				"retiring-2026-12"
			],
			"issued": "2013-07-06T06:35:09.000Z",
			"modified": "2025-11-12T23:41:50.000Z",
			"publisher": {
				"name": "Esri"
			},
			"contactPoint": {
				"@type": "vcard:Contact",
				"fn": "esri_demographics",
				"hasEmail": "{{orgContactEmail}}"
			},
			"accessLevel": "public",
			"spatial": "150.1699,-34.3289,152.1982,-33.3571",
			"license": "<img alt='' src='https://downloads.esri.com/blogs/arcgisonline/esrilogo_new.png' />This work is licensed under the Esri Master License Agreement. <br /><div><a href='https://goto.arcgis.com/termsofuse/viewsummary' target='_blank' rel='nofollow ugc noopener noreferrer'><b>View Summary</b></a> | <a href='https://goto.arcgis.com/termsofuse/viewtermsofuse' target='_blank' rel='nofollow ugc noopener noreferrer'><b>View Terms of Use</b></a> </div><div><br /></div><b>Permitted use of this data is covered in the DATA section of the <a href='https://www.esri.com/en-us/legal/terms/master-agreement-product' style='' rel='nofollow ugc'>Esri Master Agreement (E204CW)</a> and these <a href='https://www.esri.com/en-us/legal/terms/data-attributions' style='' rel='nofollow ugc'>supplemental terms</a>.</b><br /><br /><div><font color='#b22222'>Important Note:</font> This item requires an ArcGIS Online organizational subscription or an ArcGIS Developer account and <a href='https://goto.arcgis.com/features/credits' target='_blank' rel='nofollow ugc noopener noreferrer'>consumes credits</a>. To access this item, you'll need to do one of the following: </div><div><ul><li>Sign in with an account that is a member of an organizational subscription </li><li>Sign in with a developer account </li><li><a href='https://goto.arcgis.com/termsofuse/registeranapplication' target='_blank' rel='nofollow ugc noopener noreferrer'>Register an application</a> and use your application's credentials.</li></ul>If you don't have an account, you can sign up for a <a href='https://goto.arcgis.com/features/trial' target='_blank' rel='nofollow ugc noopener noreferrer'>free trial of ArcGIS</a> or a <a href='https://goto.arcgis.com/developers/signup' target='_blank' rel='nofollow ugc noopener noreferrer'>free ArcGIS Developer account</a>.</div>",
			"distribution": [
				{
					"@type": "dcat:Distribution",
					"title": "ArcGIS Hub Dataset",
					"format": "Web Page",
					"mediaType": "text/html",
					"accessURL": "https://www.pacificgeoportal.com/maps/esri::purchasing-power-per-capita-in-australia"
				}
			],
			"theme": [
				"geospatial"
			]
		},
		{
			"@type": "dcat:Dataset",
			"identifier": "https://www.arcgis.com/home/item.html?id=f8090b9e464d4bab8be1c65a44105105",
			"landingPage": "https://www.pacificgeoportal.com/maps/esri::new-zealand-purchasing-power-per-capita",
			"title": "New Zealand Purchasing Power per Capita",
			"description": "<p>\n    <span style='color:#b22222;'><strong>Retirement Notice:</strong></span><strong>&nbsp;This item is in&nbsp;</strong><a target='_blank' href='https://goto.arcgisonline.com/lifecycle/content' rel='nofollow ugc noopener noreferrer'><strong>mature support</strong></a><strong>&nbsp;as of November 2025 and will be retired in December 2026.</strong> A replacement item has not been identified at this time. Esri recommends updating your maps and apps to phase out use of this item.\n</p><div style='margin: 0px; padding: 0px;'>This layer shows the purchasing power per capita in New Zealand in 2021, in a multiscale map (Country, Region, Territorial Authority, and Statistical Area). Nationally, the purchasing power per capita is <b>36,747 New Zealand dollar</b>. Purchasing Power describes the disposable income (income without taxes and social security contributions, including received transfer payments) of a certain area's population. The figures are in New Zealand dollar (NZD) per capita.<br /></div><div style='margin: 0px; padding: 0px;'><div style='margin: 0px; padding: 0px;'><br /></div><div style='margin: 0px; padding: 0px;'>The pop-up is configured to show the following information at each geography level:</div><div style='margin: 0px; padding: 0px;'><ul><li>Purchasing power per capita</li><li>Purchasing power per capita by various categories</li></ul><div style='margin: 0px; padding: 0px;'>The source of this data is <a href='https://www.mb-research.de/' style='outline: none !important;' target='_blank' rel='nofollow ugc noopener noreferrer'>Michael Bauer Research</a>. The vintage of the data is 2021. This item was last updated in November, 2022 and is updated every 12-18 months as new annual figures are offered.<br /></div></div><div style='margin: 0px; padding: 0px;'><br /></div><div style='margin: 0px; padding: 0px;'><div style='margin: 0px; padding: 0px;'>Additional Esri Resources:<br /></div><div style='margin: 0px; padding: 0px;'><ul><li><a href='https://doc.arcgis.com/en/esri-demographics/' style='outline: none !important;' target='_blank' rel='nofollow ugc noopener noreferrer'>Esri Demographics</a></li></ul><div>This item is for visualization purposes only and cannot be exported or used in analysis.</div><div><br /></div></div></div>We would love to hear from you. If you have any feedback regarding this item or Esri Demographics, <a href='mailto:jholtzclaw@esri.com;scleary@esri.com?subject=Esri Demographics Feedback' rel='nofollow ugc'>please let us know</a>.<br /></div><div><br /></div></div></div></div><div style='margin: 0px; padding: 0px;'><font size='small'><b>Permitted use of this data is covered in the DATA section of the <a href='https://www.esri.com/en-us/legal/terms/master-agreement-product' style='' rel='nofollow ugc'>Esri Master Agreement (E204CW)</a> and these <a href='https://www.esri.com/en-us/legal/terms/data-attributions' style='' rel='nofollow ugc'>supplemental terms</a>.</b></font></div>",
			"keyword": [
				"New Zealand Dollar",
				"spending",
				"demographics",
				"NZD",
				"census",
				"Purchasing Power",
				"maps",
				"KeyFacts",
				"New Zealand dollar",
				"Oceania",
				"purchasing power per capita",
				"income",
				"New Zealand",
				"NZL",
				"household",
				"population",
				"retiring-2026-12"
			],
			"issued": "2013-07-10T23:31:04.000Z",
			"modified": "2025-11-12T21:54:42.000Z",
			"publisher": {
				"name": "Esri"
			},
			"contactPoint": {
				"@type": "vcard:Contact",
				"fn": "esri_demographics",
				"hasEmail": "{{orgContactEmail}}"
			},
			"accessLevel": "public",
			"spatial": "166.4261,-47.2915,178.5770,-34.3945",
			"license": "<img alt='' src='https://downloads.esri.com/blogs/arcgisonline/esrilogo_new.png' />This work is licensed under the Esri Master License Agreement. <br /><div><a href='https://goto.arcgis.com/termsofuse/viewsummary' target='_blank' rel='nofollow ugc noopener noreferrer'><b>View Summary</b></a> | <a href='https://goto.arcgis.com/termsofuse/viewtermsofuse' target='_blank' rel='nofollow ugc noopener noreferrer'><b>View Terms of Use</b></a> </div><div><br /></div><b>Permitted use of this data is covered in the DATA section of the <a href='https://www.esri.com/en-us/legal/terms/master-agreement-product' style='' rel='nofollow ugc'>Esri Master Agreement (E204CW)</a> and these <a href='https://www.esri.com/en-us/legal/terms/data-attributions' style='' rel='nofollow ugc'>supplemental terms</a>.</b><br /><br /><div><font color='#b22222'>Important Note:</font> This item requires an ArcGIS Online organizational subscription or an ArcGIS Developer account and <a href='https://goto.arcgis.com/features/credits' target='_blank' rel='nofollow ugc noopener noreferrer'>consumes credits</a>. To access this item, you'll need to do one of the following: </div><div><ul><li>Sign in with an account that is a member of an organizational subscription </li><li>Sign in with a developer account </li><li><a href='https://goto.arcgis.com/termsofuse/registeranapplication' target='_blank' rel='nofollow ugc noopener noreferrer'>Register an application</a> and use your application's credentials.</li></ul>If you don't have an account, you can sign up for a <a href='https://goto.arcgis.com/features/trial' target='_blank' rel='nofollow ugc noopener noreferrer'>free trial of ArcGIS</a> or a <a href='https://goto.arcgis.com/developers/signup' target='_blank' rel='nofollow ugc noopener noreferrer'>free ArcGIS Developer account</a>.</div>",
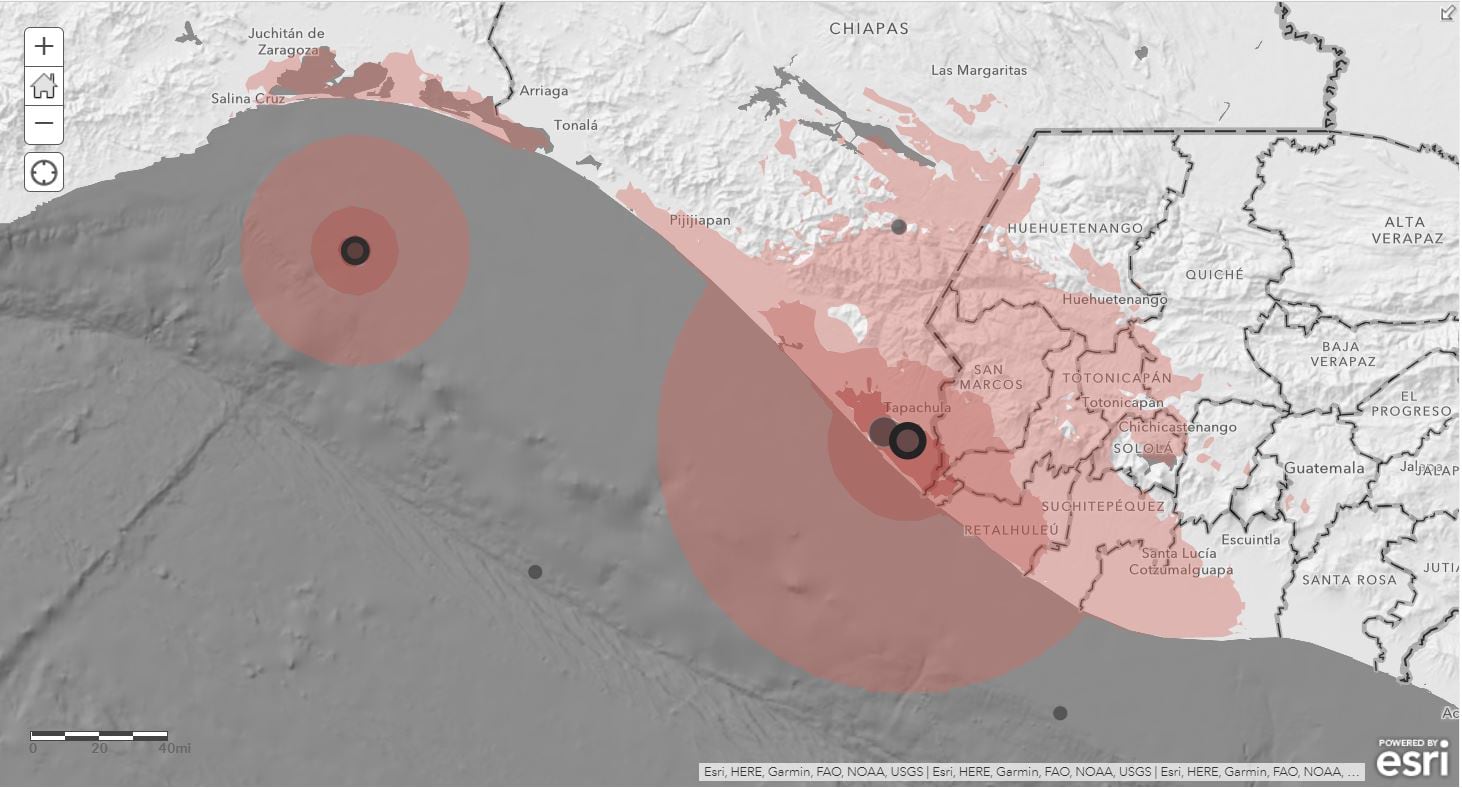
			"distribution": [
				{
					"@type": "dcat:Distribution",
					"title": "ArcGIS Hub Dataset",
					"format": "Web Page",
					"mediaType": "text/html",
					"accessURL": "https://www.pacificgeoportal.com/maps/esri::new-zealand-purchasing-power-per-capita"
				},
				{
					"@type": "dcat:Distribution",
					"title": "ArcGIS GeoService",
					"format": "ArcGIS GeoServices REST API",
					"mediaType": "application/json",
					"accessURL": "https://demographics1.arcgis.com/arcgis/rest/services/NZL_Demographics_and_Boundaries/MapServer?ts=1373499064218"
				}
			],
			"theme": [
				"geospatial"
			]
		},
		{
			"@type": "dcat:Dataset",
			"identifier": "https://www.arcgis.com/home/item.html?id=eacd43a8b6794f30a433072bbbed0b78",
			"landingPage": "https://www.pacificgeoportal.com/maps/esri::new-zealand-average-household-size",
			"title": "New Zealand Average Household Size",
			"description": "<p>\n    <span style='color:#b22222;'><strong>Retirement Notice:</strong></span><strong>&nbsp;This item is in&nbsp;</strong><a target='_blank' href='https://goto.arcgisonline.com/lifecycle/content' rel='nofollow ugc noopener noreferrer'><strong>mature support</strong></a><strong>&nbsp;as of November 2025 and will be retired in December 2026.</strong> A replacement item has not been identified at this time. Esri recommends updating your maps and apps to phase out use of this item.\n</p>This layer shows the average household size in New Zealand in 2021, in a multiscale map (Country, Region, Territorial Authority, and Statistical Area). Nationally, the average household size is <b>2.7 people per household</b>. It is calculated by dividing the household population by total households.<div style='margin: 0px; padding: 0px;'><br /></div><div style='margin: 0px; padding: 0px;'>The pop-up is configured to show the following information at each geography level:</div><div style='margin: 0px; padding: 0px;'><ul><li>Average household size (people per household)</li><li>Total population</li><li>Total households</li><li>Count of population by marital status</li><li>Count of households by type</li><li>Count of population by 15-year age increments</li></ul></div></div><div style='margin: 0px; padding: 0px;'><ul> </ul><div style='margin: 0px; padding: 0px;'>The source of this data is <a href='https://www.mb-research.de/' style='outline: none !important;' target='_blank' rel='nofollow ugc noopener noreferrer'>Michael Bauer Research</a>. The vintage of the data is 2021. This item was last updated in November, 2022 and is updated every 12-18 months as new annual figures are offered.<br /></div></div><div style='margin: 0px; padding: 0px;'><br /></div><div><div style='margin: 0px; padding: 0px;'>Additional Esri Resources:<br /></div><div style='margin: 0px; padding: 0px;'><ul><li><a href='https://doc.arcgis.com/en/esri-demographics/' style='outline: none !important;' target='_blank' rel='nofollow ugc noopener noreferrer'>Esri Demographics</a></li></ul><div>This item is for visualization purposes only and cannot be exported or used in analysis.</div><div><br /></div></div></div>We would love to hear from you. If you have any feedback regarding this item or Esri Demographics, <a href='mailto:jholtzclaw@esri.com;scleary@esri.com?subject=Esri Demographics Feedback' rel='nofollow ugc'>please let us know</a>.<br /></div><div><br /></div></div></div></div><div style='margin: 0px; padding: 0px;'><font size='small'><b>Permitted use of this data is covered in the DATA section of the <a href='https://www.esri.com/en-us/legal/terms/master-agreement-product' style='' rel='nofollow ugc'>Esri Master Agreement (E204CW)</a> and these <a href='https://www.esri.com/en-us/legal/terms/data-attributions' style='' rel='nofollow ugc'>supplemental terms</a>.</b></font></div>",
			"keyword": [
				"size",
				"average household size",
				"demographics",
				"age increments",
				"marital status",
				"maps",
				"KeyFacts",
				"Oceania",
				"census",
				"household type",
				"New Zealand",
				"NZL",
				"age",
				"household",
				"population",
				"retiring-2026-12"
			],
			"issued": "2013-07-04T05:09:11.000Z",
			"modified": "2025-11-12T21:54:40.000Z",
			"publisher": {
				"name": "Esri"
			},
			"contactPoint": {
				"@type": "vcard:Contact",
				"fn": "esri_demographics",
				"hasEmail": "{{orgContactEmail}}"
			},
			"accessLevel": "public",
			"spatial": "166.4261,-47.2915,178.5770,-34.3945",
			"license": "<img alt='' src='https://downloads.esri.com/blogs/arcgisonline/esrilogo_new.png' />This work is licensed under the Esri Master License Agreement. <br /><div><a href='https://goto.arcgis.com/termsofuse/viewsummary' target='_blank' rel='nofollow ugc noopener noreferrer'><b>View Summary</b></a> | <a href='https://goto.arcgis.com/termsofuse/viewtermsofuse' target='_blank' rel='nofollow ugc noopener noreferrer'><b>View Terms of Use</b></a> </div><div><br /></div><b>Permitted use of this data is covered in the DATA section of the <a href='https://www.esri.com/en-us/legal/terms/master-agreement-product' style='' rel='nofollow ugc'>Esri Master Agreement (E204CW)</a> and these <a href='https://www.esri.com/en-us/legal/terms/data-attributions' style='' rel='nofollow ugc'>supplemental terms</a>.</b><br /><br /><div><font color='#b22222'>Important Note:</font> This item requires an ArcGIS Online organizational subscription or an ArcGIS Developer account and <a href='https://goto.arcgis.com/features/credits' target='_blank' rel='nofollow ugc noopener noreferrer'>consumes credits</a>. To access this item, you'll need to do one of the following: </div><div><ul><li>Sign in with an account that is a member of an organizational subscription </li><li>Sign in with a developer account </li><li><a href='https://goto.arcgis.com/termsofuse/registeranapplication' target='_blank' rel='nofollow ugc noopener noreferrer'>Register an application</a> and use your application's credentials.</li></ul>If you don't have an account, you can sign up for a <a href='https://goto.arcgis.com/features/trial' target='_blank' rel='nofollow ugc noopener noreferrer'>free trial of ArcGIS</a> or a <a href='https://goto.arcgis.com/developers/signup' target='_blank' rel='nofollow ugc noopener noreferrer'>free ArcGIS Developer account</a>.</div>",
			"distribution": [
				{
					"@type": "dcat:Distribution",
					"title": "ArcGIS Hub Dataset",
					"format": "Web Page",
					"mediaType": "text/html",
					"accessURL": "https://www.pacificgeoportal.com/maps/esri::new-zealand-average-household-size"
				},
				{
					"@type": "dcat:Distribution",
					"title": "ArcGIS GeoService",
					"format": "ArcGIS GeoServices REST API",
					"mediaType": "application/json",
					"accessURL": "https://demographics1.arcgis.com/arcgis/rest/services/NZL_Demographics_and_Boundaries/MapServer?ts=1372914550877"
				}
			],
			"theme": [
				"geospatial"
			]
		},
		{
			"@type": "dcat:Dataset",
			"identifier": "https://www.arcgis.com/home/item.html?id=6f2cc4f03fd74e699ec885c4f2214df9",
			"landingPage": "https://www.pacificgeoportal.com/maps/esri::malaysia-purchasing-power-per-capita",
			"title": "Malaysia Purchasing Power per Capita",
			"description": "<p>\n    <span style='color:#b22222;'><strong>Retirement Notice:</strong></span><strong>&nbsp;This item is in&nbsp;</strong><a target='_blank' href='https://goto.arcgisonline.com/lifecycle/content' rel='nofollow ugc noopener noreferrer'><strong>mature support</strong></a><strong>&nbsp;as of November 2025 and will be retired in December 2026.</strong> A replacement item has not been identified at this time. Esri recommends updating your maps and apps to phase out use of this item.\n</p><div style='margin: 0px; padding: 0px;'>This layer shows the purchasing power per capita in Malaysia in 2022, in a multiscale map (Country, State, District, and Subdistrict). Nationally, the purchasing power per capita is <b>23,837 Malaysian ringgit</b>. Purchasing Power describes the disposable income (income without taxes and social security contributions, including received transfer payments) of a certain area's population. The figures are in Malaysian ringgit (MYR) per capita.<br /></div><div style='margin: 0px; padding: 0px;'><div style='margin: 0px; padding: 0px;'><br /></div><div style='margin: 0px; padding: 0px;'>The pop-up is configured to show the following information at each geography level:</div><div><ul><li>Purchasing power per capita</li><li>Purchasing power for various goods and services</li></ul></div><div><div>The source of this data is <a href='https://www.mb-research.de/' style='outline: none !important;' target='_blank' rel='nofollow ugc noopener noreferrer'>Michael Bauer Research</a>. The vintage of the data is 2022. This item was last updated in November, 2022 and is updated every 12-18 months as new annual figures are offered.<br /></div></div><div style='margin: 0px; padding: 0px;'><br /></div><div style='margin: 0px; padding: 0px;'><div style='margin: 0px; padding: 0px;'>Additional Esri Resources:<br /></div><div style='margin: 0px; padding: 0px;'><ul><li><a href='https://doc.arcgis.com/en/esri-demographics/' style='outline: none !important;' target='_blank' rel='nofollow ugc noopener noreferrer'>Esri Demographics</a></li></ul><div>This item is for visualization purposes only and cannot be exported or used in analysis.</div><div><br /></div></div></div>We would love to hear from you. If you have any feedback regarding this item or Esri Demographics, <a href='mailto:jholtzclaw@esri.com;scleary@esri.com?subject=Esri Demographics Feedback' rel='nofollow ugc'>please let us know</a>.<br /></div><div><br /></div></div></div></div><div style='margin: 0px; padding: 0px;'><font size='small'><b>Permitted use of this data is covered in the DATA section of the <a href='https://www.esri.com/en-us/legal/terms/master-agreement-product' style='' rel='nofollow ugc'>Esri Master Agreement (E204CW)</a> and these <a href='https://www.esri.com/en-us/legal/terms/data-attributions' style='' rel='nofollow ugc'>supplemental terms</a>.</b></font></div>",
			"keyword": [
				"population",
				"census",
				"MYS",
				"maps",
				"spending",
				"ringgit",
				"demographics",
				"MYR",
				"Asia",
				"Purchasing Power",
				"Malaysia",
				"KeyFacts",
				"purchasing power per capita",
				"National",
				"income",
				"Malaysian ringgit",
				"Malaysian Ringgit",
				"age",
				"household",
				"age increments",
				"retiring-2026-12"
			],
			"issued": "2013-07-10T22:56:27.000Z",
			"modified": "2025-11-12T21:53:37.000Z",
			"publisher": {
				"name": "Esri"
			},
			"contactPoint": {
				"@type": "vcard:Contact",
				"fn": "esri_demographics",
				"hasEmail": "{{orgContactEmail}}"
			},
			"accessLevel": "public",
			"spatial": "99.6407,0.8550,119.2697,7.3633",
			"license": "<img alt='' src='https://downloads.esri.com/blogs/arcgisonline/esrilogo_new.png' />This work is licensed under the Esri Master License Agreement. <br /><div><a href='https://goto.arcgis.com/termsofuse/viewsummary' target='_blank' rel='nofollow ugc noopener noreferrer'><b>View Summary</b></a> | <a href='https://goto.arcgis.com/termsofuse/viewtermsofuse' target='_blank' rel='nofollow ugc noopener noreferrer'><b>View Terms of Use</b></a> </div><div><br /></div><b>Permitted use of this data is covered in the DATA section of the <a href='https://www.esri.com/en-us/legal/terms/master-agreement-product' style='' rel='nofollow ugc'>Esri Master Agreement (E204CW)</a> and these <a href='https://www.esri.com/en-us/legal/terms/data-attributions' style='' rel='nofollow ugc'>supplemental terms</a>.</b><br /><br /><div><font color='#b22222'>Important Note:</font> This item requires an ArcGIS Online organizational subscription or an ArcGIS Developer account and <a href='https://goto.arcgis.com/features/credits' target='_blank' rel='nofollow ugc noopener noreferrer'>consumes credits</a>. To access this item, you'll need to do one of the following: </div><div><ul><li>Sign in with an account that is a member of an organizational subscription </li><li>Sign in with a developer account </li><li><a href='https://goto.arcgis.com/termsofuse/registeranapplication' target='_blank' rel='nofollow ugc noopener noreferrer'>Register an application</a> and use your application's credentials.</li></ul>If you don't have an account, you can sign up for a <a href='https://goto.arcgis.com/features/trial' target='_blank' rel='nofollow ugc noopener noreferrer'>free trial of ArcGIS</a> or a <a href='https://goto.arcgis.com/developers/signup' target='_blank' rel='nofollow ugc noopener noreferrer'>free ArcGIS Developer account</a>.</div>",
			"distribution": [
				{
					"@type": "dcat:Distribution",
					"title": "ArcGIS Hub Dataset",
					"format": "Web Page",
					"mediaType": "text/html",
					"accessURL": "https://www.pacificgeoportal.com/maps/esri::malaysia-purchasing-power-per-capita"
				},
				{
					"@type": "dcat:Distribution",
					"title": "ArcGIS GeoService",
					"format": "ArcGIS GeoServices REST API",
					"mediaType": "application/json",
					"accessURL": "https://demographics1.arcgis.com/arcgis/rest/services/MYS_Demographics_and_Boundaries/MapServer?ts=1373496987114"
				}
			],
			"theme": [
				"geospatial"
			]
		},
		{
			"@type": "dcat:Dataset",
			"identifier": "https://www.arcgis.com/home/item.html?id=69f2d666483f4bf79e3e7b9c42a12d39",
			"landingPage": "https://www.pacificgeoportal.com/maps/esri::malaysia-average-household-size",
			"title": "Malaysia Average Household Size",
			"description": "<p>\n    <span style='color:#b22222;'><strong>Retirement Notice:</strong></span><strong>&nbsp;This item is in&nbsp;</strong><a target='_blank' href='https://goto.arcgisonline.com/lifecycle/content' rel='nofollow ugc noopener noreferrer'><strong>mature support</strong></a><strong>&nbsp;as of November 2025 and will be retired in December 2026.</strong> A replacement item has not been identified at this time. Esri recommends updating your maps and apps to phase out use of this item.\n</p>This layer shows the average household size in Malaysia in 2022, in a multiscale map (Country, State, District, and Subdistrict). Nationally, the average household size is <b>3.9 people per household</b>. It is calculated by dividing the household population by total households.<div style='margin: 0px; padding: 0px;'><br /></div><div style='margin: 0px; padding: 0px;'>The pop-up is configured to show the following information at each geography level:</div><div style='margin:0px; padding:0px;'><ul><li>Average household size (people per household)</li><li>Total population</li><li>Total households</li><li>Count of population by 15-year age increments</li></ul><div style='margin:0px; padding:0px;'>The source of this data is <a href='https://www.mb-research.de/' style='outline: none !important;' target='_blank' rel='nofollow ugc noopener noreferrer'>Michael Bauer Research</a>. The vintage of the data is 2022. This item was last updated in November, 2022 and is updated every 12-18 months as new annual figures are offered.<br /></div></div><div style='margin: 0px; padding: 0px;'><br /></div><div><div style='margin: 0px; padding: 0px;'>Additional Esri Resources:<br /></div><div style='margin: 0px; padding: 0px;'><ul><li><a href='https://doc.arcgis.com/en/esri-demographics/' style='outline: none !important;' target='_blank' rel='nofollow ugc noopener noreferrer'>Esri Demographics</a></li></ul><div>This item is for visualization purposes only and cannot be exported or used in analysis.</div><div><br /></div></div></div>We would love to hear from you. If you have any feedback regarding this item or Esri Demographics, <a href='mailto:jholtzclaw@esri.com;scleary@esri.com?subject=Esri Demographics Feedback' rel='nofollow ugc'>please let us know</a>.<br /></div><div><br /></div></div></div></div><div style='margin: 0px; padding: 0px;'><font size='small'><b>Permitted use of this data is covered in the DATA section of the <a href='https://www.esri.com/en-us/legal/terms/master-agreement-product' style='' rel='nofollow ugc'>Esri Master Agreement (E204CW)</a> and these <a href='https://www.esri.com/en-us/legal/terms/data-attributions' style='' rel='nofollow ugc'>supplemental terms</a>.</b></font></div>",
			"keyword": [
				"census",
				"MYS",
				"Malaysia",
				"demographics",
				"Asia",
				"age increments",
				"maps",
				"KeyFacts",
				"Average Household Size",
				"population",
				"average household size",
				"age",
				"household",
				"size",
				"retiring-2026-12"
			],
			"issued": "2013-07-04T20:34:34.000Z",
			"modified": "2025-11-12T21:53:35.000Z",
			"publisher": {
				"name": "Esri"
			},
			"contactPoint": {
				"@type": "vcard:Contact",
				"fn": "esri_demographics",
				"hasEmail": "{{orgContactEmail}}"
			},
			"accessLevel": "public",
			"spatial": "99.6407,0.8550,119.2697,7.3633",
			"license": "<img alt='' src='https://downloads.esri.com/blogs/arcgisonline/esrilogo_new.png' />This work is licensed under the Esri Master License Agreement. <br /><div><a href='https://goto.arcgis.com/termsofuse/viewsummary' target='_blank' rel='nofollow ugc noopener noreferrer'><b>View Summary</b></a> | <a href='https://goto.arcgis.com/termsofuse/viewtermsofuse' target='_blank' rel='nofollow ugc noopener noreferrer'><b>View Terms of Use</b></a> </div><div><br /></div><b>Permitted use of this data is covered in the DATA section of the <a href='https://www.esri.com/en-us/legal/terms/master-agreement-product' style='' rel='nofollow ugc'>Esri Master Agreement (E204CW)</a> and these <a href='https://www.esri.com/en-us/legal/terms/data-attributions' style='' rel='nofollow ugc'>supplemental terms</a>.</b><br /><br /><div><font color='#b22222'>Important Note:</font> This item requires an ArcGIS Online organizational subscription or an ArcGIS Developer account and <a href='https://goto.arcgis.com/features/credits' target='_blank' rel='nofollow ugc noopener noreferrer'>consumes credits</a>. To access this item, you'll need to do one of the following: </div><div><ul><li>Sign in with an account that is a member of an organizational subscription </li><li>Sign in with a developer account </li><li><a href='https://goto.arcgis.com/termsofuse/registeranapplication' target='_blank' rel='nofollow ugc noopener noreferrer'>Register an application</a> and use your application's credentials.</li></ul>If you don't have an account, you can sign up for a <a href='https://goto.arcgis.com/features/trial' target='_blank' rel='nofollow ugc noopener noreferrer'>free trial of ArcGIS</a> or a <a href='https://goto.arcgis.com/developers/signup' target='_blank' rel='nofollow ugc noopener noreferrer'>free ArcGIS Developer account</a>.</div>",
			"distribution": [
				{
					"@type": "dcat:Distribution",
					"title": "ArcGIS Hub Dataset",
					"format": "Web Page",
					"mediaType": "text/html",
					"accessURL": "https://www.pacificgeoportal.com/maps/esri::malaysia-average-household-size"
				},
				{
					"@type": "dcat:Distribution",
					"title": "ArcGIS GeoService",
					"format": "ArcGIS GeoServices REST API",
					"mediaType": "application/json",
					"accessURL": "https://demographics1.arcgis.com/arcgis/rest/services/MYS_Demographics_and_Boundaries/MapServer?ts=1372970073735"
				}
			],
			"theme": [
				"geospatial"
			]
		},
		{
			"@type": "dcat:Dataset",
			"identifier": "https://www.arcgis.com/home/item.html?id=9c1a8824f948426ea4864b78d46b1333",
			"landingPage": "https://www.pacificgeoportal.com/maps/esri::indonesia-purchasing-power-per-capita",
			"title": "Indonesia Purchasing Power per Capita",
			"description": "<p>\n    <span style='color:#b22222;'><strong>Retirement Notice:</strong></span><strong>&nbsp;This item is in&nbsp;</strong><a target='_blank' href='https://goto.arcgisonline.com/lifecycle/content' rel='nofollow ugc noopener noreferrer'><strong>mature support</strong></a><strong>&nbsp;as of November 2025 and will be retired in December 2026.</strong> A replacement item has not been identified at this time. Esri recommends updating your maps and apps to phase out use of this item.\n</p><div style='margin:0px; padding:0px;'>This layer shows the purchasing power per capita in Indonesia in 2022, in a multiscale map (Country, Province, County, District, and Subdistrict). Nationally, the purchasing power per capita is <b>36,387,408 Indonesian rupiah</b>. Purchasing Power describes the disposable income (income without taxes and social security contributions, including received transfer payments) of a certain area's population. The figures are in Indonesian rupiah (IDR) per capita.<br /></div><div style='margin:0px; padding:0px;'><div style='margin:0px; padding:0px;'><br /></div><div style='margin:0px; padding:0px;'>The pop-up is configured to show the following information at each geography level:</div><div style='margin:0px; padding:0px;'><ul><li>Purchasing power per capita</li><li><span style='margin:0px; padding:0px;'>Purchasing power per capita index</span></li><li>Counts of population by education level</li></ul><div style='margin:0px; padding:0px;'>The Purchasing Power Index compares the demand for a specific purchasing category in an area, with the national demand for that product or service. The index values at the national level are 100, representing average demand for the country. A value of more than 100 represents higher demand than the national average, and a value of less than 100 represents lower demand than the national average. For example, an index of 120 implies that demand in the area is 20 percent higher than the national average; an index of 80 implies that demand is 20 percent lower than the national average.</div><div style='margin:0px; padding:0px;'><br /></div><div style='margin:0px; padding:0px;'>The source of this data is <a href='https://www.mb-research.de/' target='_blank' rel='nofollow ugc noopener noreferrer'>Michael Bauer Research</a>. The vintage of the data is 2022. This item was last updated in November, 2022 and is updated every 12-18 months as new annual figures are offered.<br /></div></div><div style='margin:0px; padding:0px;'><br /></div><div style='margin:0px; padding:0px;'><div style='margin:0px; padding:0px;'>Additional Esri Resources:<br /></div><div style='margin:0px; padding:0px;'><ul><li><a href='https://doc.arcgis.com/en/esri-demographics/' target='_blank' rel='nofollow ugc noopener noreferrer'>Esri Demographics</a></li></ul><div>This item is for visualization purposes only and cannot be exported or used in analysis.</div><div><br /></div></div></div>We would love to hear from you. If you have any feedback regarding this item or Esri Demographics, <a href='mailto:jholtzclaw@esri.com;scleary@esri.com?subject=Esri Demographics Feedback' rel='nofollow ugc'>please let us know</a>.<br /></div><div><br /></div><div style='margin:0px; padding:0px;'><font size='small'><b>Permitted use of this data is covered in the DATA section of the <a href='https://www.esri.com/en-us/legal/terms/master-agreement-product' rel='nofollow ugc'>Esri Master Agreement (E204CW)</a> and these <a href='https://www.esri.com/en-us/legal/terms/data-attributions' rel='nofollow ugc'>supplemental terms</a>.</b></font></div>",
			"keyword": [
				"education",
				"Indonesian Rupiah",
				"spending",
				"demographics",
				"Indonesia",
				"IDR",
				"Asia",
				"IDN",
				"KeyFacts",
				"purchasing power per capita",
				"income",
				"Indonesian rupiah",
				"Rupiah",
				"retiring-2026-12"
			],
			"issued": "2013-07-05T21:57:02.000Z",
			"modified": "2025-11-12T21:52:23.000Z",
			"publisher": {
				"name": "Esri"
			},
			"contactPoint": {
				"@type": "vcard:Contact",
				"fn": "esri_demographics",
				"hasEmail": "{{orgContactEmail}}"
			},
			"accessLevel": "public",
			"spatial": "94.9723,-11.0097,141.0118,6.0772",
			"license": "<img alt='' src='https://downloads.esri.com/blogs/arcgisonline/esrilogo_new.png' />This work is licensed under the Esri Master License Agreement. <br /><div><a href='https://goto.arcgis.com/termsofuse/viewsummary' target='_blank' rel='nofollow ugc noopener noreferrer'><b>View Summary</b></a> | <a href='https://goto.arcgis.com/termsofuse/viewtermsofuse' target='_blank' rel='nofollow ugc noopener noreferrer'><b>View Terms of Use</b></a> </div><div><br /></div><b>Permitted use of this data is covered in the DATA section of the <a href='https://www.esri.com/en-us/legal/terms/master-agreement-product' style='' rel='nofollow ugc'>Esri Master Agreement (E204CW)</a> and these <a href='https://www.esri.com/en-us/legal/terms/data-attributions' style='' rel='nofollow ugc'>supplemental terms</a>.</b><br /><br /><div><font color='#b22222'>Important Note:</font> This item requires an ArcGIS Online organizational subscription or an ArcGIS Developer account and <a href='https://goto.arcgis.com/features/credits' target='_blank' rel='nofollow ugc noopener noreferrer'>consumes credits</a>. To access this item, you'll need to do one of the following: </div><div><ul><li>Sign in with an account that is a member of an organizational subscription </li><li>Sign in with a developer account </li><li><a href='https://goto.arcgis.com/termsofuse/registeranapplication' target='_blank' rel='nofollow ugc noopener noreferrer'>Register an application</a> and use your application's credentials.</li></ul>If you don't have an account, you can sign up for a <a href='https://goto.arcgis.com/features/trial' target='_blank' rel='nofollow ugc noopener noreferrer'>free trial of ArcGIS</a> or a <a href='https://goto.arcgis.com/developers/signup' target='_blank' rel='nofollow ugc noopener noreferrer'>free ArcGIS Developer account</a>.</div>",
			"distribution": [
				{
					"@type": "dcat:Distribution",
					"title": "ArcGIS Hub Dataset",
					"format": "Web Page",
					"mediaType": "text/html",
					"accessURL": "https://www.pacificgeoportal.com/maps/esri::indonesia-purchasing-power-per-capita"
				},
				{
					"@type": "dcat:Distribution",
					"title": "ArcGIS GeoService",
					"format": "ArcGIS GeoServices REST API",
					"mediaType": "application/json",
					"accessURL": "https://demographics1.arcgis.com/arcgis/rest/services/IDN_Demographics_and_Boundaries/MapServer?ts=1373061421740"
				}
			],
			"theme": [
				"geospatial"
			]
		},
		{
			"@type": "dcat:Dataset",
			"identifier": "https://www.arcgis.com/home/item.html?id=33ad793233cd47d885f8c126b51389af",
			"landingPage": "https://www.pacificgeoportal.com/maps/esri::indonesia-average-household-size",
			"title": "Indonesia Average Household Size",
			"description": "<p>\n    <span style='color:#b22222;'><strong>Retirement Notice:</strong></span><strong>&nbsp;This item is in&nbsp;</strong><a target='_blank' href='https://goto.arcgisonline.com/lifecycle/content' rel='nofollow ugc noopener noreferrer'><strong>mature support</strong></a><strong>&nbsp;as of November 2025 and will be retired in December 2026.</strong> A replacement item has not been identified at this time. Esri recommends updating your maps and apps to phase out use of this item.\n</p>This layer shows the average household size in Indonesia in 2022, in a multiscale map (Country, Province, County, District, and Subdistrict). Nationally, the average household size is <b>3.8 people per household</b>. It is calculated by dividing the household population by total households.<div style='margin: 0px; padding: 0px;'><br /></div><div style='margin: 0px; padding: 0px;'>The pop-up is configured to show the following information at each geography level:</div><div style='margin: 0px; padding: 0px;'><ul><li>Average household size (people per household)</li><li>Total population</li><li>Total households</li><li>Count of population by 15-year age increments</li><li>Count of population by marital status</li> </ul><div style='margin: 0px; padding: 0px;'>The source of this data is <a href='https://www.mb-research.de/' style='outline: none !important;' target='_blank' rel='nofollow ugc noopener noreferrer'>Michael Bauer Research</a>. The vintage of the data is 2022. This item was last updated in November, 2022 and is updated every 12-18 months as new annual figures are offered.<br /></div></div><div style='margin: 0px; padding: 0px;'><br /></div><div><div style='margin: 0px; padding: 0px;'>Additional Esri Resources:<br /></div><div style='margin: 0px; padding: 0px;'><ul><li><a href='https://doc.arcgis.com/en/esri-demographics/' style='outline: none !important;' target='_blank' rel='nofollow ugc noopener noreferrer'>Esri Demographics</a></li></ul><div>This item is for visualization purposes only and cannot be exported or used in analysis.</div><div><br /></div></div></div>We would love to hear from you. If you have any feedback regarding this item or Esri Demographics, <a href='mailto:jholtzclaw@esri.com;scleary@esri.com?subject=Esri Demographics Feedback' rel='nofollow ugc'>please let us know</a>.<br /></div><div><br /></div></div></div></div><div style='margin: 0px; padding: 0px;'><font size='small'><b>Permitted use of this data is covered in the DATA section of the <a href='https://www.esri.com/en-us/legal/terms/master-agreement-product' style='' rel='nofollow ugc'>Esri Master Agreement (E204CW)</a> and these <a href='https://www.esri.com/en-us/legal/terms/data-attributions' style='' rel='nofollow ugc'>supplemental terms</a>.</b></font></div>",
			"keyword": [
				"average household size",
				"demographics",
				"Indonesia",
				"Asia",
				"IDN",
				"KeyFacts",
				"population",
				"retiring-2026-12"
			],
			"issued": "2013-07-04T21:28:32.000Z",
			"modified": "2025-11-12T21:52:21.000Z",
			"publisher": {
				"name": "Esri"
			},
			"contactPoint": {
				"@type": "vcard:Contact",
				"fn": "esri_demographics",
				"hasEmail": "{{orgContactEmail}}"
			},
			"accessLevel": "public",
			"spatial": "92.6800,-13.2730,143.6560,8.2000",
			"license": "<img alt='' src='https://downloads.esri.com/blogs/arcgisonline/esrilogo_new.png' />This work is licensed under the Esri Master License Agreement. <br /><div><a href='https://goto.arcgis.com/termsofuse/viewsummary' target='_blank' rel='nofollow ugc noopener noreferrer'><b>View Summary</b></a> | <a href='https://goto.arcgis.com/termsofuse/viewtermsofuse' target='_blank' rel='nofollow ugc noopener noreferrer'><b>View Terms of Use</b></a> </div><div><br /></div><b>Permitted use of this data is covered in the DATA section of the <a href='https://www.esri.com/en-us/legal/terms/master-agreement-product' style='' rel='nofollow ugc'>Esri Master Agreement (E204CW)</a> and these <a href='https://www.esri.com/en-us/legal/terms/data-attributions' style='' rel='nofollow ugc'>supplemental terms</a>.</b><br /><br /><div><font color='#b22222'>Important Note:</font> This item requires an ArcGIS Online organizational subscription or an ArcGIS Developer account and <a href='https://goto.arcgis.com/features/credits' target='_blank' rel='nofollow ugc noopener noreferrer'>consumes credits</a>. To access this item, you'll need to do one of the following: </div><div><ul><li>Sign in with an account that is a member of an organizational subscription </li><li>Sign in with a developer account </li><li><a href='https://goto.arcgis.com/termsofuse/registeranapplication' target='_blank' rel='nofollow ugc noopener noreferrer'>Register an application</a> and use your application's credentials.</li></ul>If you don't have an account, you can sign up for a <a href='https://goto.arcgis.com/features/trial' target='_blank' rel='nofollow ugc noopener noreferrer'>free trial of ArcGIS</a> or a <a href='https://goto.arcgis.com/developers/signup' target='_blank' rel='nofollow ugc noopener noreferrer'>free ArcGIS Developer account</a>.</div>",
			"distribution": [
				{
					"@type": "dcat:Distribution",
					"title": "ArcGIS Hub Dataset",
					"format": "Web Page",
					"mediaType": "text/html",
					"accessURL": "https://www.pacificgeoportal.com/maps/esri::indonesia-average-household-size"
				},
				{
					"@type": "dcat:Distribution",
					"title": "ArcGIS GeoService",
					"format": "ArcGIS GeoServices REST API",
					"mediaType": "application/json",
					"accessURL": "https://demographics1.arcgis.com/arcgis/rest/services/IDN_Demographics_and_Boundaries/MapServer?ts=1372973310890"
				}
			],
			"theme": [
				"geospatial"
			]
		},
		{
			"@type": "dcat:Dataset",
			"identifier": "https://www.arcgis.com/home/item.html?id=56633b40c1744109a265af1dba673535&sublayer=0",
			"landingPage": "https://www.pacificgeoportal.com/datasets/esri::world-administrative-divisions",
			"title": "World Administrative Divisions",
			"description": "<div style='text-align:Left;'><div><div><p><span>World Administrative Divisions represents the boundaries for the first-level administrative divisions of the world in December 2022. Examples of first-level administrative divisions (sometimes referred to as “Admin 1”) are states, provinces, and regions.</span><br /><br /><span>Included are fields for name and International Organization for Standardization (ISO) codes, along with notes identifying disputed boundaries and continent information. Particularly useful are the fields LAND_TYPE and LAND_RANK that separate polygons based on their size. These fields are helpful for rendering at different scales by providing the ability to turn off small islands that may clutter small-scale (zoomed out) views.</span></p><p><span>The source of this dataset is&nbsp;</span><a target='_blank' href='https://www.garmin.com/en-US/' rel='nofollow ugc noopener noreferrer'>Garmin International, Inc.</a><span> It was published in October 2023. This layer is updated every 12-18 months or as significant changes occur.</span></p></div></div></div>",
			"keyword": [
				"layer",
				"polygon",
				"administrative divisions",
				"subdivisions",
				"first-level admin",
				"states",
				"provinces",
				"countries",
				"ISO codes",
				"disputes",
				"claims",
				"descriptions",
				"types",
				"autonomous",
				"coastlines",
				"boundaries",
				"society",
				"World",
				"2022",
				"2021"
			],
			"issued": "2013-06-29T23:14:20.000Z",
			"modified": "2024-09-30T19:01:34.164Z",
			"publisher": {
				"name": "Esri"
			},
			"contactPoint": {
				"@type": "vcard:Contact",
				"fn": "esri_dm",
				"hasEmail": "{{orgContactEmail}}"
			},
			"accessLevel": "public",
			"spatial": "-180.0000,-89.0000,180.0000,83.6655",
			"license": "<div style='text-align:Left;'><div><div><div><div style='text-align:Left;'><div><div><div><img src='https://downloads.esri.com/blogs/arcgisonline/esrilogo_new.png' /> This work is licensed under the Esri Master License Agreement.<br /><div><a href='https://goto.arcgis.com/termsofuse/viewsummary' target='_blank' rel='nofollow ugc noopener noreferrer'><b>View Summary</b></a> | <b><a href='https://goto.arcgis.com/termsofuse/viewtermsofuse' target='_blank' rel='nofollow ugc noopener noreferrer'>View Terms of Use</a></b></div></div></div></div></div></div></div></div></div>",
			"distribution": [
				{
					"@type": "dcat:Distribution",
					"title": "ArcGIS Hub Dataset",
					"format": "Web Page",
					"mediaType": "text/html",
					"accessURL": "https://www.pacificgeoportal.com/datasets/esri::world-administrative-divisions"
				},
				{
					"@type": "dcat:Distribution",
					"title": "ArcGIS GeoService",
					"format": "ArcGIS GeoServices REST API",
					"mediaType": "application/json",
					"accessURL": "https://services.arcgis.com/P3ePLMYs2RVChkJx/arcgis/rest/services/World_Administrative_Divisions/FeatureServer/0"
				},
				{
					"@type": "dcat:Distribution",
					"title": "CSV",
					"format": "CSV",
					"mediaType": "text/csv",
					"accessURL": "https://www.pacificgeoportal.com/api/download/v1/items/56633b40c1744109a265af1dba673535/csv?layers=0"
				},
				{
					"@type": "dcat:Distribution",
					"title": "Shapefile",
					"format": "ZIP",
					"mediaType": "application/zip",
					"accessURL": "https://www.pacificgeoportal.com/api/download/v1/items/56633b40c1744109a265af1dba673535/shapefile?layers=0"
				},
				{
					"@type": "dcat:Distribution",
					"title": "GeoJSON",
					"format": "GeoJSON",
					"mediaType": "application/vnd.geo+json",
					"accessURL": "https://www.pacificgeoportal.com/api/download/v1/items/56633b40c1744109a265af1dba673535/geojson?layers=0"
				},
				{
					"@type": "dcat:Distribution",
					"title": "KML",
					"format": "KML",
					"mediaType": "application/vnd.google-earth.kml+xml",
					"accessURL": "https://www.pacificgeoportal.com/api/download/v1/items/56633b40c1744109a265af1dba673535/kml?layers=0"
				}
			],
			"theme": [
				"geospatial"
			]
		},
		{
			"@type": "dcat:Dataset",
			"identifier": "https://www.arcgis.com/home/item.html?id=f758990071b04cc8b55f1a5a49c4a89d",
			"landingPage": "https://www.pacificgeoportal.com/maps/esri::terrain-elevation-tinted-hillshade",
			"title": "Terrain - Elevation Tinted Hillshade",
			"description": "This web map provides an elevation tinted hillshade surface generated dynamically using a chain of server-side functions on a <a href='https://www.arcgis.com/home/item.html?id=58a541efc59545e6b7137f961d7de883' rel='nofollow ugc' target='_blank'>Terrain layer</a>. A tinted hillshade is a combination of a hillshade applied to the Terrain, fused to a colormap applied to the same Terrain to represent elevation. The hillshading is based on a solar altitude angle of 45 degrees, and solar aspect angle of 315 degrees.  The z factor is varied based on scale so that a suitable hillshade is visible at all scales. <div><br /></div><div><img src='https://downloads.esri.com/esri_content_doc/landscape/DTMElevTintLegend_V8_wCorrectLabel.png' /><br /><div><br /></div><div><div><font size='4'>What can you do with this layer?</font></div><div><b><br /></b></div><div><b>Use for Visualization:</b>  Yes. This is appropriate for visualizing the shape and height of the terrain at a range of map scales.  The image service can be added to applications or maps to enhance a users’ contextual understanding.  </div><div><br /></div><div><b>Use for Analysis:</b>  No. </div><div><br /></div><div>To learn more about the technique used in this map to fuse the elevation tint with hillshade, refer <a href='https://www.cartogis.org/docs/proceedings/2012/Nagi_AutoCarto2012.pdf' rel='nofollow ugc' target='_blank'>NAGI fusion method</a>.</div><div><br /></div><div>For more details such as Data Sources, Mosaic method used in this layer, please see the <a href='https://www.arcgis.com/home/item.html?id=58a541efc59545e6b7137f961d7de883' rel='nofollow ugc' target='_blank'>Terrain layer</a>.<br /></div></div></div>",
			"keyword": [
				"Tinted Hillshade",
				"DEM",
				"Elevation",
				"land",
				"landscape",
				"esri_elevation",
				"topography",
				"topographic",
				"elevation tinted hillshade",
				"NAGI Fusion",
				"world elevation",
				"world_elevation"
			],
			"issued": "2013-09-24T23:35:36.000Z",
			"modified": "2025-10-23T22:58:06.000Z",
			"publisher": {
				"name": "Esri"
			},
			"contactPoint": {
				"@type": "vcard:Contact",
				"fn": "esri_elevation",
				"hasEmail": "{{orgContactEmail}}"
			},
			"accessLevel": "public",
			"spatial": "-60.7019,-29.1396,146.3684,60.8091",
			"license": "<img alt='' src='https://downloads.esri.com/blogs/arcgisonline/esrilogo_new.png' />This work is licensed under the Esri Master License Agreement. <br /><div><a href='https://goto.arcgis.com/termsofuse/viewsummary' target='_blank'><b>View Summary</b></a> | <a href='https://goto.arcgis.com/termsofuse/viewtermsofuse' target='_blank'><b>View Terms of Use</b></a></div><div><span style='line-height: 16.05px;'><br /></span></div><div><font color='#b22222'>Important Note:</font> This item requires an ArcGIS Online organizational subscription or an ArcGIS Developer account and does not consume credits. To access this item, you'll need to do one of the following:</div><div><ul><li>Sign in with an account that is a member of an organizational subscription</li><li>Sign in with a developer account</li><li><a href='https://goto.arcgis.com/termsofuse/registeranapplication' target='_blank'>Register an application</a> and use your application's credentials.</li></ul>If you don't have an account, you can sign up for a <a href='https://goto.arcgis.com/features/trial' target='_blank'>free trial of ArcGIS</a> or a <a href='https://goto.arcgis.com/developers/signup' target='_blank'>free ArcGIS Developer account</a>.</div>",
			"distribution": [
				{
					"@type": "dcat:Distribution",
					"title": "ArcGIS Hub Dataset",
					"format": "Web Page",
					"mediaType": "text/html",
					"accessURL": "https://www.pacificgeoportal.com/maps/esri::terrain-elevation-tinted-hillshade"
				}
			],
			"theme": [
				"geospatial"
			]
		},
		{
			"@type": "dcat:Dataset",
			"identifier": "https://www.arcgis.com/home/item.html?id=17ab27e414ad495c976209b20239d227",
			"landingPage": "https://www.pacificgeoportal.com/maps/17ab27e414ad495c976209b20239d227",
			"title": "{{name}}",
			"description": "{{description}}",
			"keyword": [
				"polygon",
				"boundary",
				"boundaries",
				"administrative division",
				"analysis ready",
				"Malaysia",
				"MY",
				"MYS",
				"MYS_Boundaries_2022",
				"retiring-2027-12"
			],
			"issued": "2022-11-30T02:13:36.000Z",
			"modified": "{{modified:toISO}}",
			"publisher": {
				"name": "{{source}}"
			},
			"contactPoint": {
				"@type": "vcard:Contact",
				"fn": "esri_dm",
				"hasEmail": "{{orgContactEmail}}"
			},
			"accessLevel": "public",
			"spatial": "",
			"license": "<figure><figure><p><img style='aspect-ratio:113/43;width:9.65%;' src='https://content.esri.com/blogs/arcgisonline/esrilogo_new.png' width='113' height='43' /> &nbsp;This work is licensed under the Esri Master License Agreement.<br /><a target='_blank' href='https://goto.arcgis.com/termsofuse/viewsummary' rel='nofollow ugc noopener noreferrer'><strong>View Summary</strong></a> | <a target='_blank' href='https://goto.arcgis.com/termsofuse/viewtermsofuse' rel='nofollow ugc noopener noreferrer'><strong>View Terms of Use</strong></a></p></figure><p><span style='color:#ff0000;'>Important Note:</span> This layer is intended to support online visualization and analysis. Users are <strong><u>not permitted to export data</u></strong> for offline use.</p><p><span style='color:#ff0000;'>Important Note:</span> This item requires an ArcGIS Online organizational subscription or an ArcGIS Developer account and does not consume credits. To access this item, you'll need to do one of the following:</p><ul><li>Sign in with an account that is a member of an oranizational subscription</li><li>Sign in with a developer account</li><li><a target='_blank' href='https://goto.arcgis.com/termsofuse/registeranapplication' rel='nofollow ugc noopener noreferrer'>Register an application</a> and use your application's credentials</li></ul><p><br />If you don't have an account, you can sign up for a <a target='_blank' href='https://goto.arcgis.com/features/trial' rel='nofollow ugc noopener noreferrer'>free trial of ArcGIS</a> or a <a target='_blank' href='https://goto.arcgis.com/developers/signup' rel='nofollow ugc noopener noreferrer'>free ArcGIS Developer account</a>.</p></figure>",
			"distribution": [
				{
					"@type": "dcat:Distribution",
					"title": "ArcGIS Hub Dataset",
					"format": "Web Page",
					"mediaType": "text/html",
					"accessURL": "https://www.pacificgeoportal.com/maps/17ab27e414ad495c976209b20239d227"
				}
			],
			"theme": ""
		},
		{
			"@type": "dcat:Dataset",
			"identifier": "https://www.arcgis.com/home/item.html?id=a8c332faf073415eafed96b41fee186a",
			"landingPage": "https://www.pacificgeoportal.com/maps/a8c332faf073415eafed96b41fee186a",
			"title": "{{name}}",
			"description": "{{description}}",
			"keyword": [
				"polygon",
				"boundary",
				"boundaries",
				"administrative division",
				"analysis ready",
				"Malaysia",
				"MY",
				"MYS",
				"MYS_Boundaries_2022",
				"retiring-2027-12"
			],
			"issued": "2022-11-30T02:13:33.000Z",
			"modified": "{{modified:toISO}}",
			"publisher": {
				"name": "{{source}}"
			},
			"contactPoint": {
				"@type": "vcard:Contact",
				"fn": "esri_dm",
				"hasEmail": "{{orgContactEmail}}"
			},
			"accessLevel": "public",
			"spatial": "",
			"license": "<figure><figure><p><img style='aspect-ratio:113/43;width:9.65%;' src='https://content.esri.com/blogs/arcgisonline/esrilogo_new.png' width='113' height='43' /> &nbsp;This work is licensed under the Esri Master License Agreement.<br /><a target='_blank' href='https://goto.arcgis.com/termsofuse/viewsummary' rel='nofollow ugc noopener noreferrer'><strong>View Summary</strong></a> | <a target='_blank' href='https://goto.arcgis.com/termsofuse/viewtermsofuse' rel='nofollow ugc noopener noreferrer'><strong>View Terms of Use</strong></a></p></figure><p><span style='color:#ff0000;'>Important Note:</span> This layer is intended to support online visualization and analysis. Users are <strong><u>not permitted to export data</u></strong> for offline use.</p><p><span style='color:#ff0000;'>Important Note:</span> This item requires an ArcGIS Online organizational subscription or an ArcGIS Developer account and does not consume credits. To access this item, you'll need to do one of the following:</p><ul><li>Sign in with an account that is a member of an oranizational subscription</li><li>Sign in with a developer account</li><li><a target='_blank' href='https://goto.arcgis.com/termsofuse/registeranapplication' rel='nofollow ugc noopener noreferrer'>Register an application</a> and use your application's credentials</li></ul><p><br />If you don't have an account, you can sign up for a <a target='_blank' href='https://goto.arcgis.com/features/trial' rel='nofollow ugc noopener noreferrer'>free trial of ArcGIS</a> or a <a target='_blank' href='https://goto.arcgis.com/developers/signup' rel='nofollow ugc noopener noreferrer'>free ArcGIS Developer account</a>.</p></figure>",
			"distribution": [
				{
					"@type": "dcat:Distribution",
					"title": "ArcGIS Hub Dataset",
					"format": "Web Page",
					"mediaType": "text/html",
					"accessURL": "https://www.pacificgeoportal.com/maps/a8c332faf073415eafed96b41fee186a"
				}
			],
			"theme": ""
		},
		{
			"@type": "dcat:Dataset",
			"identifier": "https://www.arcgis.com/home/item.html?id=703190512d884aa3b294344518fb9c83",
			"landingPage": "https://www.pacificgeoportal.com/maps/703190512d884aa3b294344518fb9c83",
			"title": "{{name}}",
			"description": "{{description}}",
			"keyword": [
				"polygon",
				"boundary",
				"boundaries",
				"administrative division",
				"analysis ready",
				"Malaysia",
				"MY",
				"MYS",
				"MYS_Boundaries_2022",
				"retiring-2027-12"
			],
			"issued": "2022-11-30T02:13:30.000Z",
			"modified": "{{modified:toISO}}",
			"publisher": {
				"name": "{{source}}"
			},
			"contactPoint": {
				"@type": "vcard:Contact",
				"fn": "esri_dm",
				"hasEmail": "{{orgContactEmail}}"
			},
			"accessLevel": "public",
			"spatial": "",
			"license": "<figure><figure><p><img style='aspect-ratio:113/43;width:9.65%;' src='https://content.esri.com/blogs/arcgisonline/esrilogo_new.png' width='113' height='43' /> &nbsp;This work is licensed under the Esri Master License Agreement.<br /><a target='_blank' href='https://goto.arcgis.com/termsofuse/viewsummary' rel='nofollow ugc noopener noreferrer'><strong>View Summary</strong></a> | <a target='_blank' href='https://goto.arcgis.com/termsofuse/viewtermsofuse' rel='nofollow ugc noopener noreferrer'><strong>View Terms of Use</strong></a></p></figure><p><span style='color:#ff0000;'>Important Note:</span> This layer is intended to support online visualization and analysis. Users are <strong><u>not permitted to export data</u></strong> for offline use.</p><p><span style='color:#ff0000;'>Important Note:</span> This item requires an ArcGIS Online organizational subscription or an ArcGIS Developer account and does not consume credits. To access this item, you'll need to do one of the following:</p><ul><li>Sign in with an account that is a member of an oranizational subscription</li><li>Sign in with a developer account</li><li><a target='_blank' href='https://goto.arcgis.com/termsofuse/registeranapplication' rel='nofollow ugc noopener noreferrer'>Register an application</a> and use your application's credentials</li></ul><p><br />If you don't have an account, you can sign up for a <a target='_blank' href='https://goto.arcgis.com/features/trial' rel='nofollow ugc noopener noreferrer'>free trial of ArcGIS</a> or a <a target='_blank' href='https://goto.arcgis.com/developers/signup' rel='nofollow ugc noopener noreferrer'>free ArcGIS Developer account</a>.</p></figure>",
			"distribution": [
				{
					"@type": "dcat:Distribution",
					"title": "ArcGIS Hub Dataset",
					"format": "Web Page",
					"mediaType": "text/html",
					"accessURL": "https://www.pacificgeoportal.com/maps/703190512d884aa3b294344518fb9c83"
				}
			],
			"theme": ""
		},
		{
			"@type": "dcat:Dataset",
			"identifier": "https://www.arcgis.com/home/item.html?id=0e61d2469f404a3784712ea862c88d24",
			"landingPage": "https://www.pacificgeoportal.com/maps/0e61d2469f404a3784712ea862c88d24",
			"title": "{{name}}",
			"description": "{{description}}",
			"keyword": [
				"polygon",
				"boundary",
				"boundaries",
				"administrative division",
				"analysis ready",
				"ID",
				"IDN",
				"Indonesia",
				"IDN_Boundaries_2022",
				"retiring-2027-12"
			],
			"issued": "2022-11-29T23:56:18.000Z",
			"modified": "{{modified:toISO}}",
			"publisher": {
				"name": "{{source}}"
			},
			"contactPoint": {
				"@type": "vcard:Contact",
				"fn": "esri_dm",
				"hasEmail": "{{orgContactEmail}}"
			},
			"accessLevel": "public",
			"spatial": "",
			"license": "<figure><figure><p><img style='aspect-ratio:113/43;width:9.65%;' src='https://content.esri.com/blogs/arcgisonline/esrilogo_new.png' width='113' height='43' /> &nbsp;This work is licensed under the Esri Master License Agreement.<br /><a target='_blank' href='https://goto.arcgis.com/termsofuse/viewsummary' rel='nofollow ugc noopener noreferrer'><strong>View Summary</strong></a> | <a target='_blank' href='https://goto.arcgis.com/termsofuse/viewtermsofuse' rel='nofollow ugc noopener noreferrer'><strong>View Terms of Use</strong></a></p></figure><p><span style='color:#ff0000;'>Important Note:</span> This layer is intended to support online visualization and analysis. Users are <strong><u>not permitted to export data</u></strong> for offline use.</p><p><span style='color:#ff0000;'>Important Note:</span> This item requires an ArcGIS Online organizational subscription or an ArcGIS Developer account and does not consume credits. To access this item, you'll need to do one of the following:</p><ul><li>Sign in with an account that is a member of an oranizational subscription</li><li>Sign in with a developer account</li><li><a target='_blank' href='https://goto.arcgis.com/termsofuse/registeranapplication' rel='nofollow ugc noopener noreferrer'>Register an application</a> and use your application's credentials</li></ul><p><br />If you don't have an account, you can sign up for a <a target='_blank' href='https://goto.arcgis.com/features/trial' rel='nofollow ugc noopener noreferrer'>free trial of ArcGIS</a> or a <a target='_blank' href='https://goto.arcgis.com/developers/signup' rel='nofollow ugc noopener noreferrer'>free ArcGIS Developer account</a>.</p></figure>",
			"distribution": [
				{
					"@type": "dcat:Distribution",
					"title": "ArcGIS Hub Dataset",
					"format": "Web Page",
					"mediaType": "text/html",
					"accessURL": "https://www.pacificgeoportal.com/maps/0e61d2469f404a3784712ea862c88d24"
				}
			],
			"theme": ""
		},
		{
			"@type": "dcat:Dataset",
			"identifier": "https://www.arcgis.com/home/item.html?id=ea6514e3d87d44848bf89112583caf54",
			"landingPage": "https://www.pacificgeoportal.com/maps/ea6514e3d87d44848bf89112583caf54",
			"title": "{{name}}",
			"description": "{{description}}",
			"keyword": [
				"polygon",
				"boundary",
				"boundaries",
				"administrative division",
				"analysis ready",
				"ID",
				"IDN",
				"Indonesia",
				"IDN_Boundaries_2022",
				"retiring-2027-12"
			],
			"issued": "2022-11-29T23:56:13.000Z",
			"modified": "{{modified:toISO}}",
			"publisher": {
				"name": "{{source}}"
			},
			"contactPoint": {
				"@type": "vcard:Contact",
				"fn": "esri_dm",
				"hasEmail": "{{orgContactEmail}}"
			},
			"accessLevel": "public",
			"spatial": "",
			"license": "<figure><figure><p><img style='aspect-ratio:113/43;width:9.65%;' src='https://content.esri.com/blogs/arcgisonline/esrilogo_new.png' width='113' height='43' /> &nbsp;This work is licensed under the Esri Master License Agreement.<br /><a target='_blank' href='https://goto.arcgis.com/termsofuse/viewsummary' rel='nofollow ugc noopener noreferrer'><strong>View Summary</strong></a> | <a target='_blank' href='https://goto.arcgis.com/termsofuse/viewtermsofuse' rel='nofollow ugc noopener noreferrer'><strong>View Terms of Use</strong></a></p></figure><p><span style='color:#ff0000;'>Important Note:</span> This layer is intended to support online visualization and analysis. Users are <strong><u>not permitted to export data</u></strong> for offline use.</p><p><span style='color:#ff0000;'>Important Note:</span> This item requires an ArcGIS Online organizational subscription or an ArcGIS Developer account and does not consume credits. To access this item, you'll need to do one of the following:</p><ul><li>Sign in with an account that is a member of an oranizational subscription</li><li>Sign in with a developer account</li><li><a target='_blank' href='https://goto.arcgis.com/termsofuse/registeranapplication' rel='nofollow ugc noopener noreferrer'>Register an application</a> and use your application's credentials</li></ul><p><br />If you don't have an account, you can sign up for a <a target='_blank' href='https://goto.arcgis.com/features/trial' rel='nofollow ugc noopener noreferrer'>free trial of ArcGIS</a> or a <a target='_blank' href='https://goto.arcgis.com/developers/signup' rel='nofollow ugc noopener noreferrer'>free ArcGIS Developer account</a>.</p></figure>",
			"distribution": [
				{
					"@type": "dcat:Distribution",
					"title": "ArcGIS Hub Dataset",
					"format": "Web Page",
					"mediaType": "text/html",
					"accessURL": "https://www.pacificgeoportal.com/maps/ea6514e3d87d44848bf89112583caf54"
				}
			],
			"theme": ""
		},
		{
			"@type": "dcat:Dataset",
			"identifier": "https://www.arcgis.com/home/item.html?id=021e90c74b5d4501849eea0686154987",
			"landingPage": "https://www.pacificgeoportal.com/maps/021e90c74b5d4501849eea0686154987",
			"title": "{{name}}",
			"description": "{{description}}",
			"keyword": [
				"polygon",
				"boundary",
				"boundaries",
				"administrative division",
				"analysis ready",
				"ID",
				"IDN",
				"Indonesia",
				"IDN_Boundaries_2022",
				"retiring-2027-12"
			],
			"issued": "2022-11-29T23:56:10.000Z",
			"modified": "{{modified:toISO}}",
			"publisher": {
				"name": "{{source}}"
			},
			"contactPoint": {
				"@type": "vcard:Contact",
				"fn": "esri_dm",
				"hasEmail": "{{orgContactEmail}}"
			},
			"accessLevel": "public",
			"spatial": "",
			"license": "<figure><figure><p><img style='aspect-ratio:113/43;width:9.65%;' src='https://content.esri.com/blogs/arcgisonline/esrilogo_new.png' width='113' height='43' /> &nbsp;This work is licensed under the Esri Master License Agreement.<br /><a target='_blank' href='https://goto.arcgis.com/termsofuse/viewsummary' rel='nofollow ugc noopener noreferrer'><strong>View Summary</strong></a> | <a target='_blank' href='https://goto.arcgis.com/termsofuse/viewtermsofuse' rel='nofollow ugc noopener noreferrer'><strong>View Terms of Use</strong></a></p></figure><p><span style='color:#ff0000;'>Important Note:</span> This layer is intended to support online visualization and analysis. Users are <strong><u>not permitted to export data</u></strong> for offline use.</p><p><span style='color:#ff0000;'>Important Note:</span> This item requires an ArcGIS Online organizational subscription or an ArcGIS Developer account and does not consume credits. To access this item, you'll need to do one of the following:</p><ul><li>Sign in with an account that is a member of an oranizational subscription</li><li>Sign in with a developer account</li><li><a target='_blank' href='https://goto.arcgis.com/termsofuse/registeranapplication' rel='nofollow ugc noopener noreferrer'>Register an application</a> and use your application's credentials</li></ul><p><br />If you don't have an account, you can sign up for a <a target='_blank' href='https://goto.arcgis.com/features/trial' rel='nofollow ugc noopener noreferrer'>free trial of ArcGIS</a> or a <a target='_blank' href='https://goto.arcgis.com/developers/signup' rel='nofollow ugc noopener noreferrer'>free ArcGIS Developer account</a>.</p></figure>",
			"distribution": [
				{
					"@type": "dcat:Distribution",
					"title": "ArcGIS Hub Dataset",
					"format": "Web Page",
					"mediaType": "text/html",
					"accessURL": "https://www.pacificgeoportal.com/maps/021e90c74b5d4501849eea0686154987"
				}
			],
			"theme": ""
		},
		{
			"@type": "dcat:Dataset",
			"identifier": "https://www.arcgis.com/home/item.html?id=6a323f3f120447caac91532d0a964ac3",
			"landingPage": "https://www.pacificgeoportal.com/maps/6a323f3f120447caac91532d0a964ac3",
			"title": "{{name}}",
			"description": "{{description}}",
			"keyword": [
				"polygon",
				"boundary",
				"boundaries",
				"administrative division",
				"analysis ready",
				"ID",
				"IDN",
				"Indonesia",
				"IDN_Boundaries_2022",
				"retiring-2027-12"
			],
			"issued": "2022-11-29T23:56:07.000Z",
			"modified": "{{modified:toISO}}",
			"publisher": {
				"name": "{{source}}"
			},
			"contactPoint": {
				"@type": "vcard:Contact",
				"fn": "esri_dm",
				"hasEmail": "{{orgContactEmail}}"
			},
			"accessLevel": "public",
			"spatial": "",
			"license": "<figure><figure><p><img style='aspect-ratio:113/43;width:9.65%;' src='https://content.esri.com/blogs/arcgisonline/esrilogo_new.png' width='113' height='43' /> &nbsp;This work is licensed under the Esri Master License Agreement.<br /><a target='_blank' href='https://goto.arcgis.com/termsofuse/viewsummary' rel='nofollow ugc noopener noreferrer'><strong>View Summary</strong></a> | <a target='_blank' href='https://goto.arcgis.com/termsofuse/viewtermsofuse' rel='nofollow ugc noopener noreferrer'><strong>View Terms of Use</strong></a></p></figure><p><span style='color:#ff0000;'>Important Note:</span> This layer is intended to support online visualization and analysis. Users are <strong><u>not permitted to export data</u></strong> for offline use.</p><p><span style='color:#ff0000;'>Important Note:</span> This item requires an ArcGIS Online organizational subscription or an ArcGIS Developer account and does not consume credits. To access this item, you'll need to do one of the following:</p><ul><li>Sign in with an account that is a member of an oranizational subscription</li><li>Sign in with a developer account</li><li><a target='_blank' href='https://goto.arcgis.com/termsofuse/registeranapplication' rel='nofollow ugc noopener noreferrer'>Register an application</a> and use your application's credentials</li></ul><p><br />If you don't have an account, you can sign up for a <a target='_blank' href='https://goto.arcgis.com/features/trial' rel='nofollow ugc noopener noreferrer'>free trial of ArcGIS</a> or a <a target='_blank' href='https://goto.arcgis.com/developers/signup' rel='nofollow ugc noopener noreferrer'>free ArcGIS Developer account</a>.</p></figure>",
			"distribution": [
				{
					"@type": "dcat:Distribution",
					"title": "ArcGIS Hub Dataset",
					"format": "Web Page",
					"mediaType": "text/html",
					"accessURL": "https://www.pacificgeoportal.com/maps/6a323f3f120447caac91532d0a964ac3"
				}
			],
			"theme": ""
		},
		{
			"@type": "dcat:Dataset",
			"identifier": "https://www.arcgis.com/home/item.html?id=ac4aba03c4dc40e09817a38443fbc8a2",
			"landingPage": "https://www.pacificgeoportal.com/maps/ac4aba03c4dc40e09817a38443fbc8a2",
			"title": "{{name}}",
			"description": "{{description}}",
			"keyword": [
				"polygon",
				"boundary",
				"boundaries",
				"administrative",
				"division",
				"analysis",
				"ready",
				"NZL",
				"NZ",
				"NZL_Boundaries_2021",
				"New Zealand",
				"retiring-2027-12"
			],
			"issued": "2022-09-30T00:20:24.000Z",
			"modified": "{{modified:toISO}}",
			"publisher": {
				"name": "{{source}}"
			},
			"contactPoint": {
				"@type": "vcard:Contact",
				"fn": "esri_dm",
				"hasEmail": "{{orgContactEmail}}"
			},
			"accessLevel": "public",
			"spatial": "",
			"license": "<figure><figure><p><img style='aspect-ratio:113/43;width:9.65%;' src='https://content.esri.com/blogs/arcgisonline/esrilogo_new.png' width='113' height='43' /> &nbsp;This work is licensed under the Esri Master License Agreement.<br /><a target='_blank' href='https://goto.arcgis.com/termsofuse/viewsummary' rel='nofollow ugc noopener noreferrer'><strong>View Summary</strong></a> | <a target='_blank' href='https://goto.arcgis.com/termsofuse/viewtermsofuse' rel='nofollow ugc noopener noreferrer'><strong>View Terms of Use</strong></a></p></figure><p><span style='color:#ff0000;'>Important Note:</span> This layer is intended to support online visualization and analysis. Users are <strong><u>not permitted to export data</u></strong> for offline use.</p><p><span style='color:#ff0000;'>Important Note:</span> This item requires an ArcGIS Online organizational subscription or an ArcGIS Developer account and does not consume credits. To access this item, you'll need to do one of the following:</p><ul><li>Sign in with an account that is a member of an oranizational subscription</li><li>Sign in with a developer account</li><li><a target='_blank' href='https://goto.arcgis.com/termsofuse/registeranapplication' rel='nofollow ugc noopener noreferrer'>Register an application</a> and use your application's credentials</li></ul><p><br />If you don't have an account, you can sign up for a <a target='_blank' href='https://goto.arcgis.com/features/trial' rel='nofollow ugc noopener noreferrer'>free trial of ArcGIS</a> or a <a target='_blank' href='https://goto.arcgis.com/developers/signup' rel='nofollow ugc noopener noreferrer'>free ArcGIS Developer account</a>.</p></figure>",
			"distribution": [
				{
					"@type": "dcat:Distribution",
					"title": "ArcGIS Hub Dataset",
					"format": "Web Page",
					"mediaType": "text/html",
					"accessURL": "https://www.pacificgeoportal.com/maps/ac4aba03c4dc40e09817a38443fbc8a2"
				}
			],
			"theme": ""
		},
		{
			"@type": "dcat:Dataset",
			"identifier": "https://www.arcgis.com/home/item.html?id=5182ded5f7e04de1987b9f36e50de8f1",
			"landingPage": "https://www.pacificgeoportal.com/maps/5182ded5f7e04de1987b9f36e50de8f1",
			"title": "{{name}}",
			"description": "{{description}}",
			"keyword": [
				"polygon",
				"boundary",
				"boundaries",
				"administrative",
				"division",
				"analysis",
				"ready",
				"NZL",
				"NZ",
				"NZL_Boundaries_2021",
				"New Zealand",
				"retiring-2027-12"
			],
			"issued": "2022-09-30T00:20:27.000Z",
			"modified": "{{modified:toISO}}",
			"publisher": {
				"name": "{{source}}"
			},
			"contactPoint": {
				"@type": "vcard:Contact",
				"fn": "esri_dm",
				"hasEmail": "{{orgContactEmail}}"
			},
			"accessLevel": "public",
			"spatial": "",
			"license": "<figure><figure><p><img style='aspect-ratio:113/43;width:9.65%;' src='https://content.esri.com/blogs/arcgisonline/esrilogo_new.png' width='113' height='43' /> &nbsp;This work is licensed under the Esri Master License Agreement.<br /><a target='_blank' href='https://goto.arcgis.com/termsofuse/viewsummary' rel='nofollow ugc noopener noreferrer'><strong>View Summary</strong></a> | <a target='_blank' href='https://goto.arcgis.com/termsofuse/viewtermsofuse' rel='nofollow ugc noopener noreferrer'><strong>View Terms of Use</strong></a></p></figure><p><span style='color:#ff0000;'>Important Note:</span> This layer is intended to support online visualization and analysis. Users are <strong><u>not permitted to export data</u></strong> for offline use.</p><p><span style='color:#ff0000;'>Important Note:</span> This item requires an ArcGIS Online organizational subscription or an ArcGIS Developer account and does not consume credits. To access this item, you'll need to do one of the following:</p><ul><li>Sign in with an account that is a member of an oranizational subscription</li><li>Sign in with a developer account</li><li><a target='_blank' href='https://goto.arcgis.com/termsofuse/registeranapplication' rel='nofollow ugc noopener noreferrer'>Register an application</a> and use your application's credentials</li></ul><p><br />If you don't have an account, you can sign up for a <a target='_blank' href='https://goto.arcgis.com/features/trial' rel='nofollow ugc noopener noreferrer'>free trial of ArcGIS</a> or a <a target='_blank' href='https://goto.arcgis.com/developers/signup' rel='nofollow ugc noopener noreferrer'>free ArcGIS Developer account</a>.</p></figure>",
			"distribution": [
				{
					"@type": "dcat:Distribution",
					"title": "ArcGIS Hub Dataset",
					"format": "Web Page",
					"mediaType": "text/html",
					"accessURL": "https://www.pacificgeoportal.com/maps/5182ded5f7e04de1987b9f36e50de8f1"
				}
			],
			"theme": ""
		},
		{
			"@type": "dcat:Dataset",
			"identifier": "https://www.arcgis.com/home/item.html?id=bd74eef7694c41e8821a6bcd64317d09",
			"landingPage": "https://www.pacificgeoportal.com/maps/bd74eef7694c41e8821a6bcd64317d09",
			"title": "{{name}}",
			"description": "{{description}}",
			"keyword": [
				"polygon",
				"boundary",
				"boundaries",
				"administrative",
				"division",
				"analysis",
				"ready",
				"NZL",
				"NZ",
				"NZL_Boundaries_2021",
				"New Zealand",
				"retiring-2027-12"
			],
			"issued": "2022-09-30T00:20:21.000Z",
			"modified": "{{modified:toISO}}",
			"publisher": {
				"name": "{{source}}"
			},
			"contactPoint": {
				"@type": "vcard:Contact",
				"fn": "esri_dm",
				"hasEmail": "{{orgContactEmail}}"
			},
			"accessLevel": "public",
			"spatial": "",
			"license": "<figure><figure><p><img style='aspect-ratio:113/43;width:9.65%;' src='https://content.esri.com/blogs/arcgisonline/esrilogo_new.png' width='113' height='43' /> &nbsp;This work is licensed under the Esri Master License Agreement.<br /><a target='_blank' href='https://goto.arcgis.com/termsofuse/viewsummary' rel='nofollow ugc noopener noreferrer'><strong>View Summary</strong></a> | <a target='_blank' href='https://goto.arcgis.com/termsofuse/viewtermsofuse' rel='nofollow ugc noopener noreferrer'><strong>View Terms of Use</strong></a></p></figure><p><span style='color:#ff0000;'>Important Note:</span> This layer is intended to support online visualization and analysis. Users are <strong><u>not permitted to export data</u></strong> for offline use.</p><p><span style='color:#ff0000;'>Important Note:</span> This item requires an ArcGIS Online organizational subscription or an ArcGIS Developer account and does not consume credits. To access this item, you'll need to do one of the following:</p><ul><li>Sign in with an account that is a member of an oranizational subscription</li><li>Sign in with a developer account</li><li><a target='_blank' href='https://goto.arcgis.com/termsofuse/registeranapplication' rel='nofollow ugc noopener noreferrer'>Register an application</a> and use your application's credentials</li></ul><p><br />If you don't have an account, you can sign up for a <a target='_blank' href='https://goto.arcgis.com/features/trial' rel='nofollow ugc noopener noreferrer'>free trial of ArcGIS</a> or a <a target='_blank' href='https://goto.arcgis.com/developers/signup' rel='nofollow ugc noopener noreferrer'>free ArcGIS Developer account</a>.</p></figure>",
			"distribution": [
				{
					"@type": "dcat:Distribution",
					"title": "ArcGIS Hub Dataset",
					"format": "Web Page",
					"mediaType": "text/html",
					"accessURL": "https://www.pacificgeoportal.com/maps/bd74eef7694c41e8821a6bcd64317d09"
				}
			],
			"theme": ""
		},
		{
			"@type": "dcat:Dataset",
			"identifier": "https://www.arcgis.com/home/item.html?id=05b933369c7a43e18640d8fa287f325a",
			"landingPage": "https://www.pacificgeoportal.com/maps/05b933369c7a43e18640d8fa287f325a",
			"title": "{{name}}",
			"description": "{{description}}",
			"keyword": [
				"polygon",
				"boundary",
				"boundaries",
				"administrative",
				"division",
				"analysis",
				"ready",
				"NZL",
				"NZ",
				"NZL_Boundaries_2021",
				"New Zealand",
				"retiring-2027-12"
			],
			"issued": "2022-09-30T00:20:18.000Z",
			"modified": "{{modified:toISO}}",
			"publisher": {
				"name": "{{source}}"
			},
			"contactPoint": {
				"@type": "vcard:Contact",
				"fn": "esri_dm",
				"hasEmail": "{{orgContactEmail}}"
			},
			"accessLevel": "public",
			"spatial": "",
			"license": "<figure><figure><p><img style='aspect-ratio:113/43;width:9.65%;' src='https://content.esri.com/blogs/arcgisonline/esrilogo_new.png' width='113' height='43' /> &nbsp;This work is licensed under the Esri Master License Agreement.<br /><a target='_blank' href='https://goto.arcgis.com/termsofuse/viewsummary' rel='nofollow ugc noopener noreferrer'><strong>View Summary</strong></a> | <a target='_blank' href='https://goto.arcgis.com/termsofuse/viewtermsofuse' rel='nofollow ugc noopener noreferrer'><strong>View Terms of Use</strong></a></p></figure><p><span style='color:#ff0000;'>Important Note:</span> This layer is intended to support online visualization and analysis. Users are <strong><u>not permitted to export data</u></strong> for offline use.</p><p><span style='color:#ff0000;'>Important Note:</span> This item requires an ArcGIS Online organizational subscription or an ArcGIS Developer account and does not consume credits. To access this item, you'll need to do one of the following:</p><ul><li>Sign in with an account that is a member of an oranizational subscription</li><li>Sign in with a developer account</li><li><a target='_blank' href='https://goto.arcgis.com/termsofuse/registeranapplication' rel='nofollow ugc noopener noreferrer'>Register an application</a> and use your application's credentials</li></ul><p><br />If you don't have an account, you can sign up for a <a target='_blank' href='https://goto.arcgis.com/features/trial' rel='nofollow ugc noopener noreferrer'>free trial of ArcGIS</a> or a <a target='_blank' href='https://goto.arcgis.com/developers/signup' rel='nofollow ugc noopener noreferrer'>free ArcGIS Developer account</a>.</p></figure>",
			"distribution": [
				{
					"@type": "dcat:Distribution",
					"title": "ArcGIS Hub Dataset",
					"format": "Web Page",
					"mediaType": "text/html",
					"accessURL": "https://www.pacificgeoportal.com/maps/05b933369c7a43e18640d8fa287f325a"
				}
			],
			"theme": ""
		},
		{
			"@type": "dcat:Dataset",
			"identifier": "https://www.arcgis.com/home/item.html?id=1599a8c9a738473b84223020fc4039a2",
			"landingPage": "https://www.pacificgeoportal.com/maps/1599a8c9a738473b84223020fc4039a2",
			"title": "{{name}}",
			"description": "{{description}}",
			"keyword": [
				"polygon",
				"boundary",
				"boundaries",
				"administrative",
				"division",
				"analysis",
				"ready",
				"FJ",
				"Fiji",
				"FJI",
				"FJI_Boundaries_2021",
				"retiring-2027-12"
			],
			"issued": "2022-09-29T23:50:09.000Z",
			"modified": "{{modified:toISO}}",
			"publisher": {
				"name": "{{source}}"
			},
			"contactPoint": {
				"@type": "vcard:Contact",
				"fn": "esri_dm",
				"hasEmail": "{{orgContactEmail}}"
			},
			"accessLevel": "public",
			"spatial": "",
			"license": "<figure><figure><p><img style='aspect-ratio:113/43;width:9.65%;' src='https://content.esri.com/blogs/arcgisonline/esrilogo_new.png' width='113' height='43' /> &nbsp;This work is licensed under the Esri Master License Agreement.<br /><a target='_blank' href='https://goto.arcgis.com/termsofuse/viewsummary' rel='nofollow ugc noopener noreferrer'><strong>View Summary</strong></a> | <a target='_blank' href='https://goto.arcgis.com/termsofuse/viewtermsofuse' rel='nofollow ugc noopener noreferrer'><strong>View Terms of Use</strong></a></p></figure><p><span style='color:#ff0000;'>Important Note:</span> This layer is intended to support online visualization and analysis. Users are <strong><u>not permitted to export data</u></strong> for offline use.</p><p><span style='color:#ff0000;'>Important Note:</span> This item requires an ArcGIS Online organizational subscription or an ArcGIS Developer account and does not consume credits. To access this item, you'll need to do one of the following:</p><ul><li>Sign in with an account that is a member of an oranizational subscription</li><li>Sign in with a developer account</li><li><a target='_blank' href='https://goto.arcgis.com/termsofuse/registeranapplication' rel='nofollow ugc noopener noreferrer'>Register an application</a> and use your application's credentials</li></ul><p><br />If you don't have an account, you can sign up for a <a target='_blank' href='https://goto.arcgis.com/features/trial' rel='nofollow ugc noopener noreferrer'>free trial of ArcGIS</a> or a <a target='_blank' href='https://goto.arcgis.com/developers/signup' rel='nofollow ugc noopener noreferrer'>free ArcGIS Developer account</a>.</p></figure>",
			"distribution": [
				{
					"@type": "dcat:Distribution",
					"title": "ArcGIS Hub Dataset",
					"format": "Web Page",
					"mediaType": "text/html",
					"accessURL": "https://www.pacificgeoportal.com/maps/1599a8c9a738473b84223020fc4039a2"
				}
			],
			"theme": ""
		},
		{
			"@type": "dcat:Dataset",
			"identifier": "https://www.arcgis.com/home/item.html?id=d9f9ad69570d42a8975797e0f63e477c",
			"landingPage": "https://www.pacificgeoportal.com/maps/d9f9ad69570d42a8975797e0f63e477c",
			"title": "{{name}}",
			"description": "{{description}}",
			"keyword": [
				"polygon",
				"boundary",
				"boundaries",
				"administrative",
				"division",
				"analysis",
				"ready",
				"FJ",
				"Fiji",
				"FJI",
				"FJI_Boundaries_2021",
				"retiring-2027-12"
			],
			"issued": "2022-09-29T23:50:06.000Z",
			"modified": "{{modified:toISO}}",
			"publisher": {
				"name": "{{source}}"
			},
			"contactPoint": {
				"@type": "vcard:Contact",
				"fn": "esri_dm",
				"hasEmail": "{{orgContactEmail}}"
			},
			"accessLevel": "public",
			"spatial": "",
			"license": "<figure><figure><p><img style='aspect-ratio:113/43;width:9.65%;' src='https://content.esri.com/blogs/arcgisonline/esrilogo_new.png' width='113' height='43' /> &nbsp;This work is licensed under the Esri Master License Agreement.<br /><a target='_blank' href='https://goto.arcgis.com/termsofuse/viewsummary' rel='nofollow ugc noopener noreferrer'><strong>View Summary</strong></a> | <a target='_blank' href='https://goto.arcgis.com/termsofuse/viewtermsofuse' rel='nofollow ugc noopener noreferrer'><strong>View Terms of Use</strong></a></p></figure><p><span style='color:#ff0000;'>Important Note:</span> This layer is intended to support online visualization and analysis. Users are <strong><u>not permitted to export data</u></strong> for offline use.</p><p><span style='color:#ff0000;'>Important Note:</span> This item requires an ArcGIS Online organizational subscription or an ArcGIS Developer account and does not consume credits. To access this item, you'll need to do one of the following:</p><ul><li>Sign in with an account that is a member of an oranizational subscription</li><li>Sign in with a developer account</li><li><a target='_blank' href='https://goto.arcgis.com/termsofuse/registeranapplication' rel='nofollow ugc noopener noreferrer'>Register an application</a> and use your application's credentials</li></ul><p><br />If you don't have an account, you can sign up for a <a target='_blank' href='https://goto.arcgis.com/features/trial' rel='nofollow ugc noopener noreferrer'>free trial of ArcGIS</a> or a <a target='_blank' href='https://goto.arcgis.com/developers/signup' rel='nofollow ugc noopener noreferrer'>free ArcGIS Developer account</a>.</p></figure>",
			"distribution": [
				{
					"@type": "dcat:Distribution",
					"title": "ArcGIS Hub Dataset",
					"format": "Web Page",
					"mediaType": "text/html",
					"accessURL": "https://www.pacificgeoportal.com/maps/d9f9ad69570d42a8975797e0f63e477c"
				}
			],
			"theme": ""
		},
		{
			"@type": "dcat:Dataset",
			"identifier": "https://www.arcgis.com/home/item.html?id=a6de61e920f745fb9a35504384ce3587",
			"landingPage": "https://www.pacificgeoportal.com/maps/a6de61e920f745fb9a35504384ce3587",
			"title": "{{name}}",
			"description": "{{description}}",
			"keyword": [
				"polygon",
				"boundary",
				"boundaries",
				"administrative",
				"division",
				"analysis",
				"ready",
				"FJ",
				"Fiji",
				"FJI",
				"FJI_Boundaries_2021",
				"retiring-2027-12"
			],
			"issued": "2022-09-29T23:50:02.000Z",
			"modified": "{{modified:toISO}}",
			"publisher": {
				"name": "{{source}}"
			},
			"contactPoint": {
				"@type": "vcard:Contact",
				"fn": "esri_dm",
				"hasEmail": "{{orgContactEmail}}"
			},
			"accessLevel": "public",
			"spatial": "",
			"license": "<figure><figure><p><img style='aspect-ratio:113/43;width:9.65%;' src='https://content.esri.com/blogs/arcgisonline/esrilogo_new.png' width='113' height='43' /> &nbsp;This work is licensed under the Esri Master License Agreement.<br /><a target='_blank' href='https://goto.arcgis.com/termsofuse/viewsummary' rel='nofollow ugc noopener noreferrer'><strong>View Summary</strong></a> | <a target='_blank' href='https://goto.arcgis.com/termsofuse/viewtermsofuse' rel='nofollow ugc noopener noreferrer'><strong>View Terms of Use</strong></a></p></figure><p><span style='color:#ff0000;'>Important Note:</span> This layer is intended to support online visualization and analysis. Users are <strong><u>not permitted to export data</u></strong> for offline use.</p><p><span style='color:#ff0000;'>Important Note:</span> This item requires an ArcGIS Online organizational subscription or an ArcGIS Developer account and does not consume credits. To access this item, you'll need to do one of the following:</p><ul><li>Sign in with an account that is a member of an oranizational subscription</li><li>Sign in with a developer account</li><li><a target='_blank' href='https://goto.arcgis.com/termsofuse/registeranapplication' rel='nofollow ugc noopener noreferrer'>Register an application</a> and use your application's credentials</li></ul><p><br />If you don't have an account, you can sign up for a <a target='_blank' href='https://goto.arcgis.com/features/trial' rel='nofollow ugc noopener noreferrer'>free trial of ArcGIS</a> or a <a target='_blank' href='https://goto.arcgis.com/developers/signup' rel='nofollow ugc noopener noreferrer'>free ArcGIS Developer account</a>.</p></figure>",
			"distribution": [
				{
					"@type": "dcat:Distribution",
					"title": "ArcGIS Hub Dataset",
					"format": "Web Page",
					"mediaType": "text/html",
					"accessURL": "https://www.pacificgeoportal.com/maps/a6de61e920f745fb9a35504384ce3587"
				}
			],
			"theme": ""
		},
		{
			"@type": "dcat:Dataset",
			"identifier": "https://www.arcgis.com/home/item.html?id=3d58e866fd31441a8c57d13a2e028392",
			"landingPage": "https://www.pacificgeoportal.com/maps/eaglegis::nz-linz-topographic",
			"title": "NZ LINZ Topographic",
			"description": "<div><strong>Projection</strong>: New Zealand Transverse Mercator 2000 (NZTM2000).</div><div>&nbsp;</div><div>See <a target='_blank' href='https://www.arcgis.com/home/item.html?id=85027f060e2b47249a508ada6f44403d' rel='nofollow ugc noopener noreferrer'>layer</a> for more information</div><p><br /><strong>Projection</strong><br />New Zealand Transverse Mercator 2000 (NZTM2000).<br /><br /><strong>Scale/zoom levels</strong><br />&nbsp;</p><div style='margin-left:40px;'><span style='font-size:medium;'><u>Available scale levels</u></span><br />&nbsp;</div><div style='margin-left:40px;'><span style='font-size:medium;'>Level 0 - 23 (1:591,657,527 - 1:70)</span></div><div style='margin-left:40px;'><br />&nbsp;</div><div style='margin-left:40px;'><span style='font-size:medium;'><u>Cached scale levels</u></span></div><div style='margin-left:40px;'><span style='font-size:medium;'>Level 0 to level 16 (1:591,657,527 - 1:9027)</span></div><div style='margin-left:40px;'><br />&nbsp;</div><div style='margin-left:40px;'><span style='font-size:medium;'><u>Resampled scale levels</u></span><br />&nbsp;</div><div style='margin-left:40px;'><span style='font-size:medium;'>Resampling is being used for the levels that aren't cached.</span></div><div><br />&nbsp;</div><div style='margin-left:40px;'><span style='font-size:medium;'><u>Tiling Scheme</u></span><br />&nbsp;</div><div style='margin-left:40px;'><span style='font-size:medium;'>The tiling scheme used for this service can be found </span><a target='_blank' href='https://www.arcgis.com/home/item.html?id=75d8c2aec505409ead3c07f6e89f56fb' rel='nofollow ugc noopener noreferrer'><span style='font-size:medium;'>here</span></a><span style='font-size:medium;'>.</span></div><div><br />&nbsp;</div><div><span style='font-size:medium;'><strong>About</strong></span><br />&nbsp;</div><p><span style='font-size:medium;'>NZ Topographic Basemap provides a contextual background to your geographic data. It features the georeferenced LINZ Topo250 &amp; Topo50 maps series for the New Zealand mainland, the Chatham Islands, and offshore islands.</span><br /><br /><span style='font-size:medium;'>This layer is offered by Eagle Technology (Official Esri Distributor). Eagle Technology offers services that can be used in the ArcGIS platform. The Content team at Eagle Technology updates the layers on a regular basis and re</span>gularly adds new content to the Living Atlas. By using this content and combining it with other data you can create new information products quickly and easily.<br /><br />If you have any questions or remarks about the content, please let us now at <a href='mailto:livingatlas@eagle.co.nz' target='_blank' rel='nofollow ugc noopener noreferrer'>livingatlas@eagle.co.nz</a></p>",
			"keyword": [
				"basemap",
				"topo",
				"topographic",
				"linz",
				"nz",
				"new zealand",
				"esri_basemap",
				"elevation",
				"landscape",
				"landcover",
				"hazards",
				"earth observations",
				"public",
				"urban",
				"accessibility",
				"transportation",
				"infrastructure",
				"places",
				"boundaries",
				"Topo50",
				"Topo250",
				"New Zealand",
				"Basemap",
				"NZ",
				"Map",
				"Background",
				"Layer",
				"topography",
				"content",
				"living atlas",
				"basemaps",
				"esri_basemaps",
				"detailed",
				"digital map",
				"Linz",
				"current",
				"open data",
				"data sets",
				"eaglegis"
			],
			"issued": "2020-03-24T22:49:22.000Z",
			"modified": "2025-01-10T04:25:08.000Z",
			"publisher": {
				"name": "Eagle Technology Group Ltd"
			},
			"contactPoint": {
				"@type": "vcard:Contact",
				"fn": "eaglegis",
				"hasEmail": "mailto:ts@eaglegis.co.nz"
			},
			"accessLevel": "public",
			"spatial": "157.7975,-46.2244,180.0000,-33.2498",
			"license": "https://creativecommons.org/licenses/by/4.0",
			"distribution": [
				{
					"@type": "dcat:Distribution",
					"title": "ArcGIS Hub Dataset",
					"format": "Web Page",
					"mediaType": "text/html",
					"accessURL": "https://www.pacificgeoportal.com/maps/eaglegis::nz-linz-topographic"
				}
			],
			"theme": [
				"geospatial"
			]
		},
		{
			"@type": "dcat:Dataset",
			"identifier": "https://www.arcgis.com/home/item.html?id=3e1a00aeae81496587988075fe529f71",
			"landingPage": "https://www.pacificgeoportal.com/maps/esri::openstreetmap-1",
			"title": "OpenStreetMap",
			"description": "<div><div style='margin-bottom:3rem;'><div style='display:inherit; max-width:100%;'><span style='color:#b22222;'><font style='font-family:&quot;Avenir Next W01&quot;, &quot;Avenir Next W00&quot;, &quot;Avenir Next&quot;, Avenir, &quot;Helvetica Neue&quot;, sans-serif; font-size:16px;'><strong>Mature Support Notice:&nbsp;</strong></font></span><strong>This item is in&nbsp;</strong><a style='color:rgb(0, 97, 155); font-family:&quot;Avenir Next W01&quot;, &quot;Avenir Next W00&quot;, &quot;Avenir Next&quot;, Avenir, &quot;Helvetica Neue&quot;, sans-serif; font-size:16px; text-decoration-line:none;' target='_blank' href='https://goto.arcgis.com/lifecycle/content' rel='nofollow ugc noopener noreferrer'><strong>mature support</strong></a><strong>&nbsp;as of December 2024. A&nbsp;</strong><a style='background-color:rgb(255, 255, 255); border:0px solid currentcolor; box-sizing:border-box; color:rgb(0, 97, 155); font-family:&quot;Avenir Next&quot;, Avenir, &quot;Helvetica Neue&quot;, sans-serif; font-size:16px; font-style:normal; font-variant-caps:normal; font-variant-ligatures:normal; font-weight:400; letter-spacing:normal; line-height:1.5; text-align:start; text-decoration:none; text-indent:0px; text-transform:none; word-spacing:0px;' target='_blank' href='https://www.arcgis.com/home/item.html?id=aa809b0ba7a14c61a3a25a6d1df3e6af' rel='nofollow ugc noopener noreferrer'><strong>new version of this item</strong></a><strong>&nbsp;is available for your use. </strong>Esri recommends updating your maps and apps to use the new version. <span style='font-family:&quot;Avenir Next W01&quot;, &quot;Avenir Next W00&quot;, &quot;Avenir Next&quot;, Avenir, &quot;Helvetica Neue&quot;, sans-serif; font-size:16px;'>See&nbsp;</span><a style='color:rgb(0, 97, 155); font-family:&quot;Avenir Next W01&quot;, &quot;Avenir Next W00&quot;, &quot;Avenir Next&quot;, Avenir, &quot;Helvetica Neue&quot;, sans-serif; font-size:16px; text-decoration-line:none;' target='_blank' href='https://goto.arcgis.com/blogs/osmmaturesupport' rel='nofollow ugc noopener noreferrer'>blog</a><span style='font-family:inherit; font-size:14px;'>&nbsp;</span><span style='font-family:&quot;Avenir Next W01&quot;, &quot;Avenir Next W00&quot;, &quot;Avenir Next&quot;, Avenir, &quot;Helvetica Neue&quot;, sans-serif; font-size:16px;'>for more information.</span></div><div style='display:inherit; max-width:100%;'>&nbsp;</div><div style='display:inherit; max-width:100%;'><p>This tile layer presents a world basemap of OpenStreetMap (OSM) data hosted by Esri. This version of the map is rendered using OSM cartography. C<span style='font-family:&quot;Avenir Next W01&quot;, &quot;Avenir Next W00&quot;, &quot;Avenir Next&quot;, Avenir, &quot;Helvetica Neue&quot;, sans-serif; font-size:16px;'>reated from the&nbsp;</span><a style='color:rgb(0, 97, 155); font-family:&quot;Avenir Next W01&quot;, &quot;Avenir Next W00&quot;, &quot;Avenir Next&quot;, Avenir, &quot;Helvetica Neue&quot;, sans-serif; font-size:16px; text-decoration-line:none;' target='_blank' href='https://daylightmap.org/2024/05/03/sunsetting-daylight.html' rel='nofollow ugc noopener noreferrer'>sunsetted Daylight map distribution</a><span style='font-family:&quot;Avenir Next W01&quot;, &quot;Avenir Next W00&quot;, &quot;Avenir Next&quot;, Avenir, &quot;Helvetica Neue&quot;, sans-serif; font-size:16px;'>, data updates supporting this layer are no longer available.</span></p><div><div><div style='margin-bottom:3rem;'><div><div style='display:inherit; max-width:100%; overflow:auto; padding-bottom:0.375rem;'><div><div>OpenStreetMap is an open collaborative project to create a free editable map of the world. Volunteers gather location data using GPS, local knowledge, and other free sources of information and upload it. The resulting free map can be viewed and downloaded from the OpenStreetMap site: www.OpenStreetMap.org. Esri is a supporter of the OSM project.&nbsp;</div></div></div></div></div></div></div></div></div></div>",
			"keyword": [
				"basemap",
				"OpenStreetMap",
				"OSM",
				"osmOpenstreetmap",
				"wma",
				"vector"
			],
			"issued": "2018-07-05T19:33:43.000Z",
			"modified": "2025-09-04T20:03:53.000Z",
			"publisher": {
				"name": "Esri"
			},
			"contactPoint": {
				"@type": "vcard:Contact",
				"fn": "esri_vector",
				"hasEmail": "{{orgContactEmail}}"
			},
			"accessLevel": "public",
			"spatial": "-140.0000,-60.0000,140.0000,60.0000",
			"license": "<p><img style='font-family:&quot;Avenir Next W01&quot;, &quot;Avenir Next W00&quot;, &quot;Avenir Next&quot;, Avenir, &quot;Helvetica Neue&quot;, sans-serif; font-size:16px; height:auto; max-width:100%;' src='https://downloads.esri.com/blogs/arcgisonline/esrilogo_new.png' /><span style='font-family:&quot;Avenir Next W01&quot;, &quot;Avenir Next W00&quot;, &quot;Avenir Next&quot;, Avenir, &quot;Helvetica Neue&quot;, sans-serif; font-size:16px;'> &nbsp;This work is licensed under the Esri Master License Agreement.</span></p><div style='font-family:&quot;Avenir Next W01&quot;, &quot;Avenir Next W00&quot;, &quot;Avenir Next&quot;, Avenir, &quot;Helvetica Neue&quot;, sans-serif; font-size:16px;'><a style='color:rgb(0, 121, 193); text-decoration-line:none;' target='_blank' href='https://goto.arcgis.com/termsofuse/viewsummary' rel='nofollow ugc noopener noreferrer'><strong>View Summary</strong></a><strong>&nbsp;|&nbsp;</strong><a style='color:rgb(0, 121, 193); text-decoration-line:none;' target='_blank' href='https://goto.arcgis.com/termsofuse/viewtermsofuse' rel='nofollow ugc noopener noreferrer'><strong>View Terms of Use</strong></a></div>",
			"distribution": [
				{
					"@type": "dcat:Distribution",
					"title": "ArcGIS Hub Dataset",
					"format": "Web Page",
					"mediaType": "text/html",
					"accessURL": "https://www.pacificgeoportal.com/maps/esri::openstreetmap-1"
				},
				{
					"@type": "dcat:Distribution",
					"title": "ArcGIS GeoService",
					"format": "ArcGIS GeoServices REST API",
					"mediaType": "application/json",
					"accessURL": "https://basemaps.arcgis.com/arcgis/rest/services/OpenStreetMap_v2/VectorTileServer"
				}
			],
			"theme": [
				"geospatial"
			]
		},
		{
			"@type": "dcat:Dataset",
			"identifier": "https://www.arcgis.com/home/item.html?id=265ffc95d7f74280b6952752244b8f81",
			"landingPage": "https://www.pacificgeoportal.com/datasets/esri::world-biomass-mature-support",
			"title": "World Biomass (Mature Support)",
			"description": "<font color='#dc143c'>Important Note:</font> <b>This item is in </b><a href='https://goto.arcgis.com/lifecycle/content' target='_blank' rel='nofollow ugc noopener noreferrer'><b>mature support</b></a><b> as of April 2024 and will be retired in December 2026.</b>  A <a href='https://www.arcgis.com/home/item.html?id=f797683411784e73975736cf4d1f3f22' target='_blank' rel='nofollow ugc noopener noreferrer'>new version of this item</a> is available for your use. Esri recommends updating your maps and apps to use the new version.<div>   <div>Plants play a central role in the <a href='https://en.wikipedia.org/wiki/Carbon_cycle' target='_blank' rel='nofollow ugc noopener noreferrer'>carbon cycle</a> by absorbing carbon dioxide from the atmosphere and incorporating it in the structure of the plant. Globally living plants contain 500 billion metric tons of carbon, more than 60 times the amount of carbon released to the atmosphere by humans each year. Understanding the distribution of the carbon stored in living plants, known as <a href='https://en.wikipedia.org/wiki/Biomass_(ecology)' target='_blank' rel='nofollow ugc noopener noreferrer'>biomass</a>, is key to estimating the effects of land use change on the climate.<br /></div><div><br /></div><div><font size='4'>Dataset Summary</font></div><div><br /></div><div>This layer provides access to a 1-km cell-sized raster with data on the density of carbon stored in living plants in metric tons per hectare for the year 2000. It was published by the Oak Ridge National Laboratory Carbon Dioxide Information Analysis Center in 2008.</div><div><br /></div><div>The authors of these data request that they be cited as:</div><div>Ruesch, Aaron, and Holly K. Gibbs. 2008. New IPCC Tier-1 Global Biomass Carbon Map For the Year 2000. Available online from the Carbon Dioxide Information Analysis Center, Oak Ridge National Laboratory, Oak Ridge, Tennessee.</div><div><p><font size='4'>What can you do with this layer?</font></p><p><span>This layer is suitable for both visualization and analysis. It can be used in ArcGIS Online in web maps and applications and can be used in ArcGIS Desktop.</span></p><div style='margin:0px; padding:0px;'>This layer has <a href='https://resources.arcgis.com/en/help/main/10.2/index.html#//00sp00000007000000' target='_blank' rel='nofollow ugc noopener noreferrer'>query</a>, <a href='https://resources.arcgis.com/en/help/main/10.2/index.html#//00s500000010000000' target='_blank' rel='nofollow ugc noopener noreferrer'>identify</a>, and <a href='https://resources.arcgis.com/en/help/main/10.2/index.html#/Downloading_data_from_an_image_service/00sp00000016000000/' target='_blank' rel='nofollow ugc noopener noreferrer'>export</a> image services available. This layer is restricted to a maximum area of 16,000 x 16,000 pixels - an area 4,000 kilometers on a side or an area approximately the size of Europe. </div><div style='margin:0px; padding:0px;'><div style='margin:0px; padding:0px;'><br /></div><div style='margin:0px; padding:0px;'>The <a href='https://goto.arcgisonline.com/arcgis/Ecological_Land_Units/RolloutBlog' target='_blank' rel='nofollow ugc noopener noreferrer'>Esri Insider Blog</a> provides an introduction to the Ecophysiographic Mapping project.</div></div></div></div>",
			"keyword": [
				"landscape6",
				"retiring-2026-12"
			],
			"issued": "2014-12-03T19:05:10.000Z",
			"modified": "2024-04-26T03:45:29.000Z",
			"publisher": {
				"name": "Esri"
			},
			"contactPoint": {
				"@type": "vcard:Contact",
				"fn": "esri_landscape2",
				"hasEmail": "{{orgContactEmail}}"
			},
			"accessLevel": "public",
			"spatial": "-180.0000,-89.0000,180.0000,89.0000",
			"license": "<p><img src='https://downloads.esri.com/blogs/arcgisonline/esrilogo_new.png' />This work is licensed under the Esri Master License Agreement.&nbsp;</p><div><a target='_blank' href='https://goto.arcgis.com/termsofuse/viewsummary' rel='nofollow ugc noopener noreferrer'>View Summary</a> | <a target='_blank' href='https://goto.arcgis.com/termsofuse/viewtermsofuse' rel='nofollow ugc noopener noreferrer'>View Terms of Use</a></div><div>&nbsp;</div><div><span style='color:#dc143c;'>Important Note:</span> This item requires an ArcGIS Online organizational subscription or an ArcGIS Developer account and does not consume credits. To access this item, you'll need to do one of the following:</div><div><ul><li>Sign in with an account that is a member of an organizational subscription</li><li>Sign in with a developer account</li><li><a target='_blank' href='https://goto.arcgis.com/termsofuse/registeranapplication' rel='nofollow ugc noopener noreferrer'>Register an application</a> and use your application's credentials.<br />&nbsp;</li></ul><p>If you don't have an account, you can sign up for a <a target='_blank' href='https://goto.arcgis.com/features/trial' rel='nofollow ugc noopener noreferrer'>free trial of ArcGIS</a> or a <a target='_blank' href='https://goto.arcgis.com/developers/signup' rel='nofollow ugc noopener noreferrer'>free ArcGIS Developer account</a>.</p></div>",
			"distribution": [
				{
					"@type": "dcat:Distribution",
					"title": "ArcGIS Hub Dataset",
					"format": "Web Page",
					"mediaType": "text/html",
					"accessURL": "https://www.pacificgeoportal.com/datasets/esri::world-biomass-mature-support"
				},
				{
					"@type": "dcat:Distribution",
					"title": "ArcGIS GeoService",
					"format": "ArcGIS GeoServices REST API",
					"mediaType": "application/json",
					"accessURL": "https://landscape6.arcgis.com/arcgis/rest/services/World_Biomass/ImageServer"
				}
			],
			"theme": [
				"geospatial"
			]
		},
		{
			"@type": "dcat:Dataset",
			"identifier": "https://www.arcgis.com/home/item.html?id=7b421e42c17b43f8ad7222b8f71d09e7",
			"landingPage": "https://www.pacificgeoportal.com/datasets/esri::sea-surface-temperature-c-mature-support",
			"title": "Sea Surface Temperature (C) (Mature Support)",
			"description": "<font color='#dc143c'>Important Note:</font> <b>This item is in </b><a href='https://goto.arcgis.com/lifecycle/content' target='_blank' rel='nofollow ugc noopener noreferrer'><b>mature support</b></a><b> as of April 2024 and will be retired in December 2026.</b>  A <a href='https://www.arcgis.com/home/item.html?id=100a26c4d15445ffadab0d04e536b9c1' target='_blank' rel='nofollow ugc noopener noreferrer'>new version of this item</a> is available for your use. Esri recommends updating your maps and apps to use the new version.\n\n<p><font><font><span>Sea Surface Temperature is a key climate and weather measurement used for weather prediction, ocean forecasts, tropical cyclone forecasts, and in coastal applications such as fisheries, pollution monitoring and tourism. El Ni</span></font><span>ñ</span><span>o and La Ni</span><span>ñ</span><font><span>a are two examples of climate events which are </span><span>forecast </span><span>through the use of sea surface temperature maps. </span></font></font></p><p><font>The Naval Oceanographic Office sea surface temperature dataset is calculated from satellite-based <span>microwave and infrared imagery. These data are optimally interpolated to provide a daily, global map of the </span>midday (12:00 pm)<span> sea surface temperature</span><span>. </span></font></p><p><font><font><span>Learn more about the </span></font></font><a href='https://podaac.jpl.nasa.gov/dataset/NAVO-L4HR1m-GLOB-K10_SST' target='_blank' rel='nofollow ugc noopener noreferrer'>source data</a><font><font><span>.</span></font><b> </b><br /></font></p><div><div><font><b>Phenomenon Mapped: </b>Sea Surface Temperature</font></div><div><font><b>Units:</b> Degrees Celsius</font></div><div><div><font><b>Time Interval: </b><span>Daily</span><br /></font></div><div><font><b>Time Extent: </b><span>2008/04/01 12:00:00 UTC</span><span> to present</span></font></div></div><div><font><b>Cell Size:</b> 11 km</font></div><div><font><b>Source Type: </b>Continuous</font></div><div><font><b>Pixel Type: </b>Floating Point</font></div><div><font><b>Data Projection: </b>GCS WGS84</font></div><div><span><font><b>Mosaic Projection: </b>Web Mercator Auxiliary Sphere</font></span></div><div><span><font><b>Extent:</b> Global Oceans</font></span></div><div><font><b>Source:</b> Naval Oceanographic Office</font></div></div><div><font><b>Update Cycle: </b>Sporadic</font></div><div><font><b>ArcGIS Server URL:</b><span> https://earthobs2.arcgis.com/arcgis</span></font></div><div><span><font><br /></font></span></div><div><font><b>Time:</b><span> This is a time-enabled layer. It shows the average sea surface temperature during the map's time extent, or if time animation is disabled, a time range can be set using the layer's multidimensional settings. The map shows the average of all days in the time extent. Minimum temporal resolution is one day; maximum is one month.</span><span><br /></span></font></div><div><span><font><br /></font></span></div><div><span><font size='3'>What can you do with this layer?</font></span></div><div><span><font size='3'><br /></font></span></div><div><div><font><span><b>Visualization:</b> This layer can be used for visualization online in web maps and in ArcGIS Desktop.</span></font></div><div><font><span><br /></span></font></div><div><font><font><b>Analysis:</b><span> This layer can be used as an input to geoprocessing tools and model builder. Units are in degrees Celsius, and there is a processing template to convert pixels to Fahrenheit. D</span></font><font><span>o not use this layer for analysis while the Cartographic Renderer processing template is applied.</span></font></font></div></div><div><font><br /></font></div><div><div><div><div><font>This layer is part of the </font><a href='https://livingatlas.arcgis.com' target='_blank' rel='nofollow ugc noopener noreferrer'>Living Atlas of the World</a><font> that provides an easy way to explore the earth observation layers and many other beautiful and authoritative maps on hundreds of topics.</font></div></div></div></div>",
			"keyword": [
				"earthobs2",
				"retiring-2026-12"
			],
			"issued": "2015-10-29T00:46:24.000Z",
			"modified": "2024-04-26T03:46:36.000Z",
			"publisher": {
				"name": "Esri"
			},
			"contactPoint": {
				"@type": "vcard:Contact",
				"fn": "esri_observations",
				"hasEmail": "{{orgContactEmail}}"
			},
			"accessLevel": "public",
			"spatial": "-180.0000,-90.0000,180.0000,90.0000",
			"license": "<p><img src='https://downloads.esri.com/blogs/arcgisonline/esrilogo_new.png' />This work is licensed under the Esri Master License Agreement.&nbsp;</p><div><a target='_blank' href='https://goto.arcgis.com/termsofuse/viewsummary' rel='nofollow ugc noopener noreferrer'>View Summary</a> | <a target='_blank' href='https://goto.arcgis.com/termsofuse/viewtermsofuse' rel='nofollow ugc noopener noreferrer'>View Terms of Use</a></div><div><br />&nbsp;</div><div><span style='color:#dc143c;'>Important Note:</span> This item requires an ArcGIS Online organizational subscription or an ArcGIS Developer account and does not consume credits. To access this item, you'll need to do one of the following:</div><div><ul><li>Sign in with an account that is a member of an organizational subscription</li><li>Sign in with a developer account</li><li><a target='_blank' href='https://goto.arcgis.com/termsofuse/registeranapplication' rel='nofollow ugc noopener noreferrer'>Register an application</a> and use your application's credentials.<br />&nbsp;</li></ul><p>If you don't have an account, you can sign up for a <a target='_blank' href='https://goto.arcgis.com/features/trial' rel='nofollow ugc noopener noreferrer'>free trial of ArcGIS</a> or a <a target='_blank' href='https://goto.arcgis.com/developers/signup' rel='nofollow ugc noopener noreferrer'>free ArcGIS Developer account</a>.</p></div>",
			"distribution": [
				{
					"@type": "dcat:Distribution",
					"title": "ArcGIS Hub Dataset",
					"format": "Web Page",
					"mediaType": "text/html",
					"accessURL": "https://www.pacificgeoportal.com/datasets/esri::sea-surface-temperature-c-mature-support"
				},
				{
					"@type": "dcat:Distribution",
					"title": "ArcGIS GeoService",
					"format": "ArcGIS GeoServices REST API",
					"mediaType": "application/json",
					"accessURL": "https://earthobs2.arcgis.com/arcgis/rest/services/REMSS_SeaSurfaceTemp/ImageServer"
				}
			],
			"theme": [
				"geospatial"
			]
		},
		{
			"@type": "dcat:Dataset",
			"identifier": "https://www.arcgis.com/home/item.html?id=143a93fb58d6497ba559c6a9d893b181",
			"landingPage": "https://www.pacificgeoportal.com/datasets/esri::hycom-sea-water-temperature-contours",
			"title": "HYCOM - Sea Water Temperature Contours",
			"description": "<div>The HYbrid Coordinate Ocean Model (HYCOM) is a product from the <a href='https://hycom.org' target='_blank'>HYCOM</a> Consortium that forecasts global ocean conditions.  The <a href='https://hycom.org/data/glby0pt08/expt-93pt0' target='_blank'>HYCOM + NCODA Global 1/12° Analysis (GLBy0.08/expt_93.0)</a> provides five variables including Sea Surface Height as well as eastward velocity, northward velocity, in-situ temperature, and salinity at 40 vertical depth levels ranging from 0 m at the ocean surface to 5,000 m.<br /></div><div><br /></div><div>The ocean prediction system runs daily at the Navy DoD Supercomputing Resource Center. Upon completion, these data are made available on HYCOM.org servers. Daily data is typically accessible within 48-hrs of the initial runtime.</div><div><font size='4'><br /></font></div><div><font size='4'>What can you do with this layer?</font></div><div><font size='4'><br /></font></div><div>Identify features by clicking on the map to reveal the pre-configured pop-ups.  View the time enabled data using the time slider, which is set to three hour intervals by default, by Enabling Time Animation.  View the depth enabled data using the depth slider.  Switch between processing templates to view the different variables available. This Image Service is designed for full analysis within ArcGIS Pro and ArcMap. </div>",
			"keyword": [
				"oceans4",
				"retiring-2026-12"
			],
			"issued": "2017-10-20T15:06:19.000Z",
			"modified": "2019-09-27T03:30:36.000Z",
			"publisher": {
				"name": "Esri"
			},
			"contactPoint": {
				"@type": "vcard:Contact",
				"fn": "esri_oceans",
				"hasEmail": "{{orgContactEmail}}"
			},
			"accessLevel": "public",
			"spatial": "-180.0000,-90.0000,180.0000,90.0000",
			"license": "<p><img src='https://downloads.esri.com/blogs/arcgisonline/esrilogo_new.png' />This work is licensed under the Esri Master License Agreement.&nbsp;</p><div><a target='_blank' href='https://goto.arcgis.com/termsofuse/viewsummary' rel='nofollow ugc noopener noreferrer'>View Summary</a> | <a target='_blank' href='https://goto.arcgis.com/termsofuse/viewtermsofuse' rel='nofollow ugc noopener noreferrer'>View Terms of Use</a><br />&nbsp;</div><div><span style='color:#dc143c;'>Important Note:</span> This item requires an ArcGIS Online organizational subscription or an ArcGIS Developer account and does not consume credits. To access this item, you'll need to do one of the following:</div><div><ul><li>Sign in with an account that is a member of an organizational subscription</li><li>Sign in with a developer account</li><li><a target='_blank' href='https://goto.arcgis.com/termsofuse/registeranapplication' rel='nofollow ugc noopener noreferrer'>Register an application</a> and use your application's credentials.<br />&nbsp;</li></ul><p>If you don't have an account, you can sign up for a <a target='_blank' href='https://goto.arcgis.com/features/trial' rel='nofollow ugc noopener noreferrer'>free trial of ArcGIS</a> or a <a target='_blank' href='https://goto.arcgis.com/developers/signup' rel='nofollow ugc noopener noreferrer'>free ArcGIS Developer account</a>.<br />&nbsp;</p></div>",
			"distribution": [
				{
					"@type": "dcat:Distribution",
					"title": "ArcGIS Hub Dataset",
					"format": "Web Page",
					"mediaType": "text/html",
					"accessURL": "https://www.pacificgeoportal.com/datasets/esri::hycom-sea-water-temperature-contours"
				},
				{
					"@type": "dcat:Distribution",
					"title": "ArcGIS GeoService",
					"format": "ArcGIS GeoServices REST API",
					"mediaType": "application/json",
					"accessURL": "https://oceans4.arcgis.com/arcgis/rest/services/HYCOM/ImageServer"
				}
			],
			"theme": [
				"geospatial"
			]
		},
		{
			"@type": "dcat:Dataset",
			"identifier": "https://www.arcgis.com/home/item.html?id=9890130e6c9d430a88c3905947e8a867",
			"landingPage": "https://www.pacificgeoportal.com/datasets/esri::hycom-sea-water-temperature",
			"title": "HYCOM - Sea Water Temperature",
			"description": "<div>The HYbrid Coordinate Ocean Model (HYCOM) is a product from the <a href='https://hycom.org' target='_blank'>HYCOM</a> Consortium that forecasts global ocean conditions.  The <a href='https://hycom.org/data/glby0pt08/expt-93pt0' target='_blank'>HYCOM + NCODA Global 1/12° Analysis (GLBy0.08/expt_93.0)</a> provides five variables including Sea Surface Height as well as eastward velocity, northward velocity, in-situ temperature, and salinity at 40 vertical depth levels ranging from 0 m at the ocean surface to 5,000 m.<br /></div><div><br /></div><div>The ocean prediction system runs daily at the Navy DoD Supercomputing Resource Center. Upon completion, these data are made available on HYCOM.org servers. Daily data is typically accessible within 48-hrs of the initial runtime.</div><div><font size='4'><br /></font></div><div><span style='font-size: large;'>What can you do with this layer?</span><br /></div><div><font size='4'><br /></font></div><div>Identify features by clicking on the map to reveal the pre-configured pop-ups.  View the time enabled data using the time slider, which is set to three hour intervals by default, by Enabling Time Animation.  View the depth enabled data using the depth slider.  Switch between processing templates to view the different variables available. This Image Service is designed for full analysis within ArcGIS Pro and ArcMap. </div>",
			"keyword": [
				"oceans4",
				"retiring-2026-12"
			],
			"issued": "2017-06-08T15:33:27.000Z",
			"modified": "2020-10-13T15:41:36.000Z",
			"publisher": {
				"name": "Esri"
			},
			"contactPoint": {
				"@type": "vcard:Contact",
				"fn": "esri_oceans",
				"hasEmail": "{{orgContactEmail}}"
			},
			"accessLevel": "public",
			"spatial": "-180.0000,-90.0000,180.0000,90.0000",
			"license": "<p><img src='https://downloads.esri.com/blogs/arcgisonline/esrilogo_new.png' />This work is licensed under the Esri Master License Agreement.&nbsp;</p><div><a target='_blank' href='https://goto.arcgis.com/termsofuse/viewsummary' rel='nofollow ugc noopener noreferrer'>View Summary</a> | <a target='_blank' href='https://goto.arcgis.com/termsofuse/viewtermsofuse' rel='nofollow ugc noopener noreferrer'>View Terms of Use</a></div><div>&nbsp;</div><div><span style='color:#dc143c;'>Important Note:</span> This item requires an ArcGIS Online organizational subscription or an ArcGIS Developer account and does not consume credits. To access this item, you'll need to do one of the following:</div><div><ul><li>Sign in with an account that is a member of an organizational subscription</li><li>Sign in with a developer account</li><li><a target='_blank' href='https://goto.arcgis.com/termsofuse/registeranapplication' rel='nofollow ugc noopener noreferrer'>Register an application</a> and use your application's credentials.<br />&nbsp;</li></ul><p>If you don't have an account, you can sign up for a <a target='_blank' href='https://goto.arcgis.com/features/trial' rel='nofollow ugc noopener noreferrer'>free trial of ArcGIS</a> or a <a target='_blank' href='https://goto.arcgis.com/developers/signup' rel='nofollow ugc noopener noreferrer'>free ArcGIS Developer account</a>.<br />&nbsp;</p></div>",
			"distribution": [
				{
					"@type": "dcat:Distribution",
					"title": "ArcGIS Hub Dataset",
					"format": "Web Page",
					"mediaType": "text/html",
					"accessURL": "https://www.pacificgeoportal.com/datasets/esri::hycom-sea-water-temperature"
				},
				{
					"@type": "dcat:Distribution",
					"title": "ArcGIS GeoService",
					"format": "ArcGIS GeoServices REST API",
					"mediaType": "application/json",
					"accessURL": "https://oceans4.arcgis.com/arcgis/rest/services/HYCOM/ImageServer"
				}
			],
			"theme": [
				"geospatial"
			]
		},
		{
			"@type": "dcat:Dataset",
			"identifier": "https://www.arcgis.com/home/item.html?id=da070ef9b4e64acaae0bcfad0ef85813",
			"landingPage": "https://www.pacificgeoportal.com/datasets/esri::hycom-sea-water-salinity",
			"title": "HYCOM - Sea Water Salinity",
			"description": "<div>The HYbrid Coordinate Ocean Model (HYCOM) is a product from the <a href='https://hycom.org' target='_blank'>HYCOM</a> Consortium that forecasts global ocean conditions.  The <a href='https://hycom.org/data/glby0pt08/expt-93pt0' target='_blank'>HYCOM + NCODA Global 1/12° Analysis (GLBy0.08/expt_93.0)</a> provides five variables including Sea Surface Height as well as eastward velocity, northward velocity, in-situ temperature, and salinity at 40 vertical depth levels ranging from 0 m at the ocean surface to 5,000 m.<br /></div><div><br /></div><div>The ocean prediction system runs daily at the Navy DoD Supercomputing Resource Center. Upon completion, these data are made available on HYCOM.org servers. Daily data is typically accessible within 48-hrs of the initial runtime.</div><div><font size='4'><br /></font></div><div><span style='font-size: large;'>What can you do with this layer?</span><br /></div><div><font size='4'><br /></font></div><div>Identify features by clicking on the map to reveal the pre-configured pop-ups.  View the time enabled data using the time slider, which is set to three hour intervals by default, by Enabling Time Animation.  View the depth enabled data using the depth slider.  Switch between processing templates to view the different variables available. This Image Service is designed for full analysis within ArcGIS Pro and ArcMap. </div>",
			"keyword": [
				"oceans4",
				"retiring-2026-12"
			],
			"issued": "2017-06-08T15:33:25.000Z",
			"modified": "2019-09-27T03:31:50.000Z",
			"publisher": {
				"name": "Esri"
			},
			"contactPoint": {
				"@type": "vcard:Contact",
				"fn": "esri_oceans",
				"hasEmail": "{{orgContactEmail}}"
			},
			"accessLevel": "public",
			"spatial": "-180.0000,-90.0000,180.0000,90.0000",
			"license": "<p><img src='https://downloads.esri.com/blogs/arcgisonline/esrilogo_new.png' />This work is licensed under the Esri Master License Agreement.&nbsp;</p><div><a target='_blank' href='https://goto.arcgis.com/termsofuse/viewsummary' rel='nofollow ugc noopener noreferrer'>View Summary</a> | <a target='_blank' href='https://goto.arcgis.com/termsofuse/viewtermsofuse' rel='nofollow ugc noopener noreferrer'>View Terms of Use</a><br />&nbsp;</div><div><span style='color:#dc143c;'>Important Note:</span> This item requires an ArcGIS Online organizational subscription or an ArcGIS Developer account and does not consume credits. To access this item, you'll need to do one of the following:</div><div><ul><li>Sign in with an account that is a member of an organizational subscription</li><li>Sign in with a developer account</li><li><a target='_blank' href='https://goto.arcgis.com/termsofuse/registeranapplication' rel='nofollow ugc noopener noreferrer'>Register an application</a> and use your application's credentials.<br />&nbsp;</li></ul><p>If you don't have an account, you can sign up for a <a target='_blank' href='https://goto.arcgis.com/features/trial' rel='nofollow ugc noopener noreferrer'>free trial of ArcGIS</a> or a <a target='_blank' href='https://goto.arcgis.com/developers/signup' rel='nofollow ugc noopener noreferrer'>free ArcGIS Developer account</a>.<br />&nbsp;</p></div>",
			"distribution": [
				{
					"@type": "dcat:Distribution",
					"title": "ArcGIS Hub Dataset",
					"format": "Web Page",
					"mediaType": "text/html",
					"accessURL": "https://www.pacificgeoportal.com/datasets/esri::hycom-sea-water-salinity"
				},
				{
					"@type": "dcat:Distribution",
					"title": "ArcGIS GeoService",
					"format": "ArcGIS GeoServices REST API",
					"mediaType": "application/json",
					"accessURL": "https://oceans4.arcgis.com/arcgis/rest/services/HYCOM/ImageServer"
				}
			],
			"theme": [
				"geospatial"
			]
		},
		{
			"@type": "dcat:Dataset",
			"identifier": "https://www.arcgis.com/home/item.html?id=c452d81b9f2942e386ff91b0ae48280e",
			"landingPage": "https://www.pacificgeoportal.com/datasets/esri::hycom-sea-surface-height-contours",
			"title": "HYCOM - Sea Surface Height Contours",
			"description": "<div>The HYbrid Coordinate Ocean Model (HYCOM) is a product from the <a href='https://hycom.org' target='_blank'>HYCOM</a> Consortium that forecasts global ocean conditions.  The <a href='https://hycom.org/data/glby0pt08/expt-93pt0' target='_blank'>HYCOM + NCODA Global 1/12° Analysis (GLBy0.08/expt_93.0)</a> provides five variables including Sea Surface Height as well as eastward velocity, northward velocity, in-situ temperature, and salinity at 40 vertical depth levels ranging from 0 m at the ocean surface to 5,000 m.<br /></div><div><br /></div><div>The ocean prediction system runs daily at the Navy DoD Supercomputing Resource Center. Upon completion, these data are made available on HYCOM.org servers. Daily data is typically accessible within 48-hrs of the initial runtime.</div><div><br /></div><div><font size='4'>What can you do with this layer?</font></div><div><font size='4'><br /></font></div><div>Identify features by clicking on the map to reveal the pre-configured pop-ups.  View the time enabled data using the time slider, which is set to three hour intervals by default, by Enabling Time Animation.  View the depth enabled data using the depth slider.  Switch between processing templates to view the different variables available. This Image Service is designed for full analysis within ArcGIS Pro and ArcMap.</div>",
			"keyword": [
				"oceans4",
				"retiring-2026-12"
			],
			"issued": "2017-10-20T15:06:12.000Z",
			"modified": "2019-09-27T03:29:59.000Z",
			"publisher": {
				"name": "Esri"
			},
			"contactPoint": {
				"@type": "vcard:Contact",
				"fn": "esri_oceans",
				"hasEmail": "{{orgContactEmail}}"
			},
			"accessLevel": "public",
			"spatial": "-180.0000,-90.0000,180.0000,90.0000",
			"license": "<p><img src='https://downloads.esri.com/blogs/arcgisonline/esrilogo_new.png' />This work is licensed under the Esri Master License Agreement.&nbsp;</p><div><a target='_blank' href='https://goto.arcgis.com/termsofuse/viewsummary' rel='nofollow ugc noopener noreferrer'>View Summary</a> | <a target='_blank' href='https://goto.arcgis.com/termsofuse/viewtermsofuse' rel='nofollow ugc noopener noreferrer'>View Terms of Use</a><br />&nbsp;</div><div><span style='color:#dc143c;'>Important Note:</span> This item requires an ArcGIS Online organizational subscription or an ArcGIS Developer account and does not consume credits. To access this item, you'll need to do one of the following:</div><div><ul><li>Sign in with an account that is a member of an organizational subscription</li><li>Sign in with a developer account</li><li><a target='_blank' href='https://goto.arcgis.com/termsofuse/registeranapplication' rel='nofollow ugc noopener noreferrer'>Register an application</a> and use your application's credentials.<br />&nbsp;</li></ul><p>If you don't have an account, you can sign up for a <a target='_blank' href='https://goto.arcgis.com/features/trial' rel='nofollow ugc noopener noreferrer'>free trial of ArcGIS</a> or a <a target='_blank' href='https://goto.arcgis.com/developers/signup' rel='nofollow ugc noopener noreferrer'>free ArcGIS Developer account</a>.<br />&nbsp;</p></div>",
			"distribution": [
				{
					"@type": "dcat:Distribution",
					"title": "ArcGIS Hub Dataset",
					"format": "Web Page",
					"mediaType": "text/html",
					"accessURL": "https://www.pacificgeoportal.com/datasets/esri::hycom-sea-surface-height-contours"
				},
				{
					"@type": "dcat:Distribution",
					"title": "ArcGIS GeoService",
					"format": "ArcGIS GeoServices REST API",
					"mediaType": "application/json",
					"accessURL": "https://oceans4.arcgis.com/arcgis/rest/services/HYCOM/ImageServer"
				}
			],
			"theme": [
				"geospatial"
			]
		},
		{
			"@type": "dcat:Dataset",
			"identifier": "https://www.arcgis.com/home/item.html?id=a6f2ca97544b45f69daea38668ccbdcf",
			"landingPage": "https://www.pacificgeoportal.com/datasets/esri::hycom-ocean-current-vectors",
			"title": "HYCOM - Ocean Current Vectors",
			"description": "<div><div>The HYbrid Coordinate Ocean Model (HYCOM) is a product from the <a href='https://hycom.org' target='_blank'>HYCOM</a> Consortium that forecasts global ocean conditions.  The <a href='https://hycom.org/data/glby0pt08/expt-93pt0' target='_blank'>HYCOM + NCODA Global 1/12° Analysis (GLBy0.08/expt_93.0)</a> provides five variables including Sea Surface Height as well as eastward velocity, northward velocity, in-situ temperature, and salinity at 40 vertical depth levels ranging from 0 m at the ocean surface to 5,000 m.<br /></div><div><br /></div><div>The ocean prediction system runs daily at the Navy DoD Supercomputing Resource Center. Upon completion, these data are made available on HYCOM.org servers. Daily data is typically accessible within 48-hrs of the initial runtime.</div><div><br /></div><div><font size='4'>What can you do with this layer?</font></div><div><font size='4'><br /></font></div><div>Identify features by clicking on the map to reveal the pre-configured pop-ups.  View the time enabled data using the time slider, which is set to three hour intervals by default, by Enabling Time Animation.  View the depth enabled data using the depth slider.  Switch between processing templates to view the different variables available. This Image Service is designed for full analysis within ArcGIS Pro and ArcMap. </div></div>",
			"keyword": [
				"oceans4",
				"retiring-2026-12"
			],
			"issued": "2017-06-08T15:33:20.000Z",
			"modified": "2019-09-27T03:31:14.000Z",
			"publisher": {
				"name": "Esri"
			},
			"contactPoint": {
				"@type": "vcard:Contact",
				"fn": "esri_oceans",
				"hasEmail": "{{orgContactEmail}}"
			},
			"accessLevel": "public",
			"spatial": "-180.0000,-90.0000,180.0000,90.0000",
			"license": "<p><img src='https://downloads.esri.com/blogs/arcgisonline/esrilogo_new.png' width='113' height='43' /> This work is licensed under the Esri Master License Agreement.</p><div><a target='_blank' href='https://goto.arcgis.com/termsofuse/viewsummary' rel='nofollow ugc noopener noreferrer'><strong>View Summary</strong></a> | <a target='_blank' href='https://goto.arcgis.com/termsofuse/viewtermsofuse' rel='nofollow ugc noopener noreferrer'><strong>View Terms of Use</strong></a><br />&nbsp;</div><div><span style='color:#b22222;'>Important Note:</span> This item requires an ArcGIS Online organizational subscription or an ArcGIS Developer account and does not consume credits. To access this item, you'll need to do one of the following:</div><div><ul><li>Sign in with an account that is a member of an organizational subscription</li><li>Sign in with a developer account</li><li><a target='_blank' href='https://goto.arcgis.com/termsofuse/registeranapplication' rel='nofollow ugc noopener noreferrer'>Register an application</a> and use your application's credentials.<br />&nbsp;</li></ul><p>If you don't have an account, you can sign up for a <a target='_blank' href='https://goto.arcgis.com/features/trial' rel='nofollow ugc noopener noreferrer'>free trial of ArcGIS</a> or a <a target='_blank' href='https://goto.arcgis.com/developers/signup' rel='nofollow ugc noopener noreferrer'>free ArcGIS Developer account</a>.</p></div>",
			"distribution": [
				{
					"@type": "dcat:Distribution",
					"title": "ArcGIS Hub Dataset",
					"format": "Web Page",
					"mediaType": "text/html",
					"accessURL": "https://www.pacificgeoportal.com/datasets/esri::hycom-ocean-current-vectors"
				},
				{
					"@type": "dcat:Distribution",
					"title": "ArcGIS GeoService",
					"format": "ArcGIS GeoServices REST API",
					"mediaType": "application/json",
					"accessURL": "https://oceans4.arcgis.com/arcgis/rest/services/HYCOM_UV/ImageServer"
				}
			],
			"theme": [
				"geospatial"
			]
		},
		{
			"@type": "dcat:Dataset",
			"identifier": "https://www.arcgis.com/home/item.html?id=5c2e6d2137bb4d2187db387979db2f31&sublayer=0",
			"landingPage": "https://www.pacificgeoportal.com/datasets/esri::geoglows-ecmwf-streamflow-system-6-day-forecast",
			"title": "GEOGloWS ECMWF Streamflow System (6 Day Forecast)",
			"description": "<p><span style='color:#b22222;'><strong>Retirement Notice:</strong></span><strong>&nbsp;This item is in </strong><a target='_blank' href='https://goto.arcgis.com/lifecycle/content' rel='nofollow ugc noopener noreferrer'><strong>mature support</strong></a><strong> as of June 2024 and will be retired in December 2026. A&nbsp;</strong><a target='_blank' href='https://www.arcgis.com/home/item.html?id=8f0573e0c0b9491dbeafde9c72ccf02b' rel='nofollow ugc noopener noreferrer'><strong>new version of this item</strong></a><strong>&nbsp;is available for your use.</strong> Esri recommends updating your maps and apps to use the new version.</p><div><p>The <a target='_blank' href='https://geoglows.ecmwf.int/' rel='nofollow ugc noopener noreferrer'>GEOGloWS ECMWF Streamflow System</a> represents a daily 51-member ensemble streamflow forecast for over 1 million reaches across the globe. Gridded surface runoff, provided by the European Centre for Medium-range Weather Forecasting (ECMWF), is downscaled and routed to the streams using the Routing Application for Parallel computation of Discharge (RAPID). This animation layer shows the first 6-days of a 15-day forecast at 3-hr intervals. Additionally, a 40-yr historical simulation was produced based on ECMWF’s ERA5 dataset. From this historical simulation , return periods for each reach are calculated and used to color the stream segments when/where events exceed these thresholds.</p><p><strong>Credits</strong>: This <a target='_blank' href='https://geoglows.ecmwf.int/' rel='nofollow ugc noopener noreferrer'>forecast model</a> was produced as part of the GEOGloWS Partnership with collaboration from BYU, ECMWF, esri, NOAA, NASA, SERVIR, USAID, ICIMOD, JRC, Copernicus, World Bank, and Microsoft Azure.</p><div><div>&nbsp;</div><div><span style='font-size:medium;'>What can you do with this layer?</span></div><div>&nbsp;</div><div>This map service is designed for fast data visualization. Identify features by clicking on the map to reveal the pre-configured pop-ups. View the forecast data sequentially&nbsp;using the time slider, which is set to three hour intervals by default by Enabling Time Animation. This layer type is not recommended for use in analysis.</div><div>&nbsp;</div><div><div><div><div><span style='font-size:x-large;'>Revisions:</span></div><ul><li><strong>Dec 15, 2020</strong>: Updated '<strong>flowstyle</strong>' field values from color names: 'blue', 'yellow', 'purple', ... to Return Period values. This now reports '0', '2', '5', '10', '25', '50', and '100' indicating the forecasted return period. The symbology has also been extended to better depict the relevant state of each reach using these periods.<br />&nbsp;</li></ul></div></div></div></div></div>",
			"keyword": [
				"livefeeds2",
				"GlobalWaterModel_Medium",
				"retiring-2026-12"
			],
			"issued": "2019-11-14T03:50:13.000Z",
			"modified": "2025-09-02T20:50:10.000Z",
			"publisher": {
				"name": "Esri"
			},
			"contactPoint": {
				"@type": "vcard:Contact",
				"fn": "esri_livefeeds",
				"hasEmail": "{{orgContactEmail}}"
			},
			"accessLevel": "public",
			"spatial": "-138.1779,-55.4771,179.8450,59.9954",
			"license": "<p><img src='https://downloads.esri.com/blogs/arcgisonline/esrilogo_new.png' />This work is licensed under the Esri Master License Agreement.&nbsp;</p><div><a target='_blank' href='https://goto.arcgis.com/termsofuse/viewsummary' rel='nofollow ugc noopener noreferrer'>View Summary</a> | <a target='_blank' href='https://goto.arcgis.com/termsofuse/viewtermsofuse' rel='nofollow ugc noopener noreferrer'>View Terms of Use</a></div>",
			"distribution": [
				{
					"@type": "dcat:Distribution",
					"title": "ArcGIS Hub Dataset",
					"format": "Web Page",
					"mediaType": "text/html",
					"accessURL": "https://www.pacificgeoportal.com/datasets/esri::geoglows-ecmwf-streamflow-system-6-day-forecast"
				},
				{
					"@type": "dcat:Distribution",
					"title": "ArcGIS GeoService",
					"format": "ArcGIS GeoServices REST API",
					"mediaType": "application/json",
					"accessURL": "https://livefeeds2.arcgis.com/arcgis/rest/services/GEOGLOWS/GlobalWaterModel_Medium/MapServer/0"
				},
				{
					"@type": "dcat:Distribution",
					"title": "CSV",
					"format": "CSV",
					"mediaType": "text/csv",
					"accessURL": "https://www.pacificgeoportal.com/api/download/v1/items/5c2e6d2137bb4d2187db387979db2f31/csv?layers=0"
				},
				{
					"@type": "dcat:Distribution",
					"title": "Shapefile",
					"format": "ZIP",
					"mediaType": "application/zip",
					"accessURL": "https://www.pacificgeoportal.com/api/download/v1/items/5c2e6d2137bb4d2187db387979db2f31/shapefile?layers=0"
				},
				{
					"@type": "dcat:Distribution",
					"title": "GeoJSON",
					"format": "GeoJSON",
					"mediaType": "application/vnd.geo+json",
					"accessURL": "https://www.pacificgeoportal.com/api/download/v1/items/5c2e6d2137bb4d2187db387979db2f31/geojson?layers=0"
				},
				{
					"@type": "dcat:Distribution",
					"title": "KML",
					"format": "KML",
					"mediaType": "application/vnd.google-earth.kml+xml",
					"accessURL": "https://www.pacificgeoportal.com/api/download/v1/items/5c2e6d2137bb4d2187db387979db2f31/kml?layers=0"
				}
			],
			"theme": [
				"geospatial"
			]
		},
		{
			"@type": "dcat:Dataset",
			"identifier": "https://www.arcgis.com/home/item.html?id=e28b7e1da5414010ba4f47dd5a3c3ebb",
			"landingPage": "https://www.pacificgeoportal.com/content/esri::european-space-agency-worldcover-2020-land-cover",
			"title": "European Space Agency WorldCover 2020 Land Cover",
			"description": "<p><span style='color:#b22222;'><strong>Retirement Notice:&nbsp;</strong></span><strong>This item is in </strong><a target='_blank' href='https://goto.arcgis.com/lifecycle/content' rel='nofollow ugc noopener noreferrer'><strong>mature support</strong></a><strong> as of June 2024 and will be retired in December 2026. A&nbsp;</strong><a target='_blank' href='https://www.arcgis.com/home/item.html?id=7bec35d76dd54ea584f98d286571eb84' rel='nofollow ugc noopener noreferrer'><strong>new version of this item</strong></a><strong>&nbsp;is available for your use. </strong>Esri recommends updating your maps and apps to use the new version.</p><div><div>WorldCover provides a new baseline global land cover product at 10 m resolution for 2020 based on Sentinel-1 and 2 data. It was developed and validated in almost near-real time and at the same time maximizes the impact and uptake for the end users.<br /><br /><strong>Variable mapped: </strong>11 land cover classes<br /><strong>Data Projection:</strong> WGS84 (WKID 4326)<br /><strong>Mosaic Projection:</strong> Web Mercator (WKID3857)<br /><strong>Extent:</strong> World<br /><strong>Cell Size:</strong> 8.33333333333333E-05 degrees (10m)<br /><strong>Source Type:</strong> 8 bit unsigned<br /><strong>Visible Scale:</strong> All scales are visible<br /><strong>Source:</strong> ESA (European Space Agency)<br /><strong>Publication Date:</strong> October 20, 2021<br /><br />More Details from the WorldCover consortium:&nbsp;<a target='_blank' href='https://esa-worldcover.org/en' rel='nofollow ugc noopener noreferrer'>https://esa-worldcover.org/en</a></div><div>&nbsp;</div><div><span style='font-size:x-large;'>Classes</span></div><div>&nbsp;</div><div><strong>10. Tree Cover</strong><br />This class includes any geographic area dominated by trees with a cover of 10% or more. Other land cover classes (shrubs and/or herbs in the understorey, built-up, permanent water bodies, …) can be present below the canopy, even with a density higher than trees. Areas planted with trees for afforestation purposes and plantations (e.g. oil palm, olive trees) are included in this class. This class also includes tree covered areas seasonally or permanently flooded with fresh water except for mangroves.<br /><br /><strong>20. Shrubland</strong><br />This class includes any geographic area dominated by natural shrubs having a cover of 10% or more. Shrubs are defined as woody perennial plants with persistent and woody stems and without any defined main stem being less than 5 m tall. Trees can be present in scattered form if their cover is less than 10%. Herbaceous plants can also be present at any density. The shrub foliage can be either evergreen or deciduous.<br /><br /><strong>30. Grassland</strong><br />This class includes any geographic area dominated by natural herbaceous plants (Plants without persistent stem or shoots above ground and lacking definite firm structure): (grasslands, prairies, steppes, savannahs, pastures) with a cover of 10% or more, irrespective of different human and/or animal activities, such as: grazing, selective fire management etc. Woody plants (trees and/or shrubs) can be present assuming their cover is less than 10%. It may also contain uncultivated cropland areas (without harvest/ bare soil period) in the reference year.<br /><br /><strong>40. Cropland</strong><br />Land covered with annual cropland that is sowed/planted and harvestable at least once within the 12 months after the<br />sowing/planting date. The annual cropland produces an herbaceous cover and is sometimes combined with some tree or woody&nbsp;<br />vegetation. Note that perennial woody crops will be classified as the appropriate tree cover or shrub land cover type. Greenhouses are considered as built-up.<br /><br /><strong>50. Built-up</strong><br />Land covered by buildings, roads and other man-made structures such as railroads. Buildings include both residential and industrial building. Urban green (parks, sport facilities) is not included in this class. Waste dump deposits and extraction sites are considered as bare.<br /><br /><strong>60. Bare or sparse vegetation</strong><br />Lands with exposed soil, sand, or rocks and never has more than 10 % vegetated cover during any time of the year.<br /><br /><strong>70. Snow and Ice</strong><br />This class includes any geographic area covered by snow or glaciers persistently.<br /><br /><strong>80. Permanent water bodies</strong><br />This class includes any geographic area covered for most of the year (more than 9 months) by water bodies: lakes, reservoirs, and rivers. Can be either fresh or salt-water bodies. In some cases the water can be frozen for part of the year (less than 9 months).<br /><br /><strong>90. Herbaceous wetland</strong><br />Land dominated by natural herbaceous vegetation (cover of 10% or more) that is permanently or regularly flooded by fresh, brackish or salt water. It excludes unvegetated sediment (see 60), swamp forests (classified as tree cover) and mangroves see 95).<br /><br /><strong>95. Mangroves</strong><br />Taxonomically diverse, salt-tolerant tree and other plant species which thrive in intertidal zones of sheltered tropical shores,&nbsp;<br />\"overwash\" islands, and estuaries.<br /><br /><strong>100. Moss and lichen</strong><br />Land covered with lichens and/or mosses. Lichens are composite organisms formed from the symbiotic association of fungi and algae. Mosses contain photo-autotrophic land plants without true leaves, stems, roots but with leaf-and stemlike organs.<br />&nbsp;</div></div>",
			"keyword": [
				"esri_environment",
				"hosted",
				"retiring-2026-12"
			],
			"issued": "2022-02-23T02:41:01.000Z",
			"modified": "2025-09-02T20:25:59.000Z",
			"publisher": {
				"name": "Esri"
			},
			"contactPoint": {
				"@type": "vcard:Contact",
				"fn": "esri_environment",
				"hasEmail": "{{orgContactEmail}}"
			},
			"accessLevel": "public",
			"spatial": "-180.0000,-60.0000,180.0000,84.0000",
			"license": "<p><img src='https://downloads.esri.com/blogs/arcgisonline/esrilogo_new.png' />This work is licensed under the Esri Master License Agreement.&nbsp;</p><div><a target='_blank' href='https://goto.arcgis.com/termsofuse/viewsummary' rel='nofollow ugc noopener noreferrer'>View Summary</a> | <a target='_blank' href='https://goto.arcgis.com/termsofuse/viewtermsofuse' rel='nofollow ugc noopener noreferrer'>View Terms of Use</a></div>",
			"distribution": [
				{
					"@type": "dcat:Distribution",
					"title": "ArcGIS Hub Dataset",
					"format": "Web Page",
					"mediaType": "text/html",
					"accessURL": "https://www.pacificgeoportal.com/content/esri::european-space-agency-worldcover-2020-land-cover"
				},
				{
					"@type": "dcat:Distribution",
					"title": "ArcGIS GeoService",
					"format": "ArcGIS GeoServices REST API",
					"mediaType": "application/json",
					"accessURL": "https://tiledimageservices.arcgis.com/P3ePLMYs2RVChkJx/arcgis/rest/services/European_Space_Agency_WorldCover_2020_Land_Cover_220202a/ImageServer"
				}
			],
			"theme": [
				"geospatial"
			]
		},
		{
			"@type": "dcat:Dataset",
			"identifier": "https://www.arcgis.com/home/item.html?id=fd61b9e0c69c4e14bebd50a9a968348c",
			"landingPage": "https://www.pacificgeoportal.com/datasets/esri::sentinel-2-views",
			"title": "Sentinel-2 Views",
			"description": "<p><span style='font-size:medium;'>Sentinel-2 Level-1C imagery with on-the-fly renderings for visualization. This imagery layer pulls directly from the </span><a target='_blank' href='https://registry.opendata.aws/sentinel-2/' rel='nofollow ugc noopener noreferrer'><span style='font-size:medium;'>Sentinel-2 on AWS</span></a><span style='font-size:medium;'> collection and is updated daily with new imagery.</span></p><p><span style='font-size:medium;'>Sentinel-2 imagery can be applied across a number of industries, scientific disciplines, and management practices. Some applications include, but are not limited to, land cover and environmental monitoring, climate change, deforestation, disaster and emergency management, national security, plant health and precision agriculture, forest monitoring, watershed analysis and runoff predictions, land-use planning, tracking urban expansion, highlighting burned areas and estimating fire severity.</span></p><p><span style='font-size:medium;'>Geographic Coverage</span></p><ul><li><span style='font-size:medium;'>Global</span></li><li><span style='font-size:medium;'>Continental land masses from 65.4° South to 72.1° North, with these special guidelines:</span><ul><li><span style='font-size:medium;'>All coastal waters up to 20 km from the shore</span></li><li><span style='font-size:medium;'>All islands greater than 100 km2</span></li><li><span style='font-size:medium;'>All EU islands</span></li><li><span style='font-size:medium;'>All closed seas (e.g. Caspian Sea)</span></li><li><span style='font-size:medium;'>The Mediterranean Sea</span><br />&nbsp;</li></ul></li></ul><p><span style='font-size:medium;'>Temporal Coverage</span></p><ul><li><span style='font-size:medium;'>This layer includes a rolling collection of Sentinel-2 imagery acquired within the past 14 months.</span></li><li><span style='font-size:medium;'>This layer is updated daily with new imagery.</span></li><li><span style='font-size:medium;'>The revisit time for each point on Earth is every 5 days.</span></li><li><span style='font-size:medium;'>The number of images available will vary depending on location.</span><br />&nbsp;</li></ul><p><span style='font-size:medium;'>Product Level</span></p><ul><li><span style='font-size:medium;'>This service provides Level-1C Top of Atmosphere imagery.</span></li><li><span style='font-size:medium;'>Alternatively, </span><a target='_blank' href='https://www.arcgis.com/home/item.html?id=255af1ceee844d6da8ef8440c8f90d00' rel='nofollow ugc noopener noreferrer'>Sentinel-2 Level-2A</a><span style='font-size:medium;'> is also available.</span><br />&nbsp;</li></ul><p><span style='font-size:medium;'>Image Selection/Filtering</span></p><ul><li><span style='font-size:medium;'>The most recent and cloud free images are displayed by default.</span></li><li><span style='font-size:medium;'>Any image available within the past 14 months can be displayed via custom filtering.</span></li><li><span style='font-size:medium;'>Filtering can be done based on attributes such as Acquisition Date, Estimated Cloud Cover, and Tile ID.</span></li><li><span style='font-size:medium;'>Tile_ID is computed as [year][month][day]T[hours][minutes][seconds]_<span style='background-attachment:initial; background-clip:initial; background-image:initial; background-origin:initial; background-position:initial; background-repeat:initial; background-size:initial;'>[UTMcode][latitudeband][square]_[sequence]</span>.</span><a target='_blank' href='https://sentinel-pds.s3-website.eu-central-1.amazonaws.com/' rel='nofollow ugc noopener noreferrer'><span style='font-size:medium;'> More…</span></a><br />&nbsp;</li></ul><p><span style='font-size:medium;'>Visual Rendering</span></p><ul><li><span style='font-size:medium;'>Default rendering is Natural Color (bands 4,3,2) with Dynamic Range Adjustment (DRA).</span></li><li><span style='font-size:medium;'>The DRA version of each layer enables visualization of the full dynamic range of the images.</span></li><li><span style='font-size:medium;'>Rendering (or display) of band combinations and calculated indices is done on-the-fly from the source images via Raster Functions.</span></li><li><span style='font-size:medium;'>Various pre-defined Raster Functions can be selected or custom functions created.</span></li><li><span style='font-size:medium;'>Available renderings include: </span><a target='_blank' href='https://www.arcgis.com/home/item.html?id=1f650908c00c42338aa3da3d654dfe59' rel='nofollow ugc noopener noreferrer'><span style='font-size:medium;'>Agriculture with DRA</span></a><span style='font-size:medium;'>,</span><a target='_blank' href='https://www.arcgis.com/home/item.html?id=5ff454d2e9ea420ba1f810076ce70ec2' rel='nofollow ugc noopener noreferrer'><span style='font-size:medium;'> Bathymetric with DRA</span></a><span style='font-size:medium;'>,</span><a target='_blank' href='https://www.arcgis.com/home/item.html?id=2658178ff00e440aae303452bfcec6cf' rel='nofollow ugc noopener noreferrer'><span style='font-size:medium;'> Color-Infrared with DRA</span></a><span style='font-size:medium;'>,</span><a target='_blank' href='https://www.arcgis.com/home/item.html?id=41c1069f84eb40ff90940c0299f31c77' rel='nofollow ugc noopener noreferrer'><span style='font-size:medium;'> Natural Color with DRA</span></a><span style='font-size:medium;'>, </span><a target='_blank' href='https://www.arcgis.com/home/item.html?id=972c8f73028a4a358160e449d458bdf7' rel='nofollow ugc noopener noreferrer'><span style='font-size:medium;'>Short-wave Infrared with DRA</span></a><span style='font-size:medium;'>, </span><a target='_blank' href='https://www.arcgis.com/home/item.html?id=b9701ce2f0184c058ad132d28f0495b9' rel='nofollow ugc noopener noreferrer'><span style='font-size:medium;'>Geology with DRA</span></a><span style='font-size:medium;'>, </span><a target='_blank' href='https://www.arcgis.com/home/item.html?id=c9fe8496820442c08a531fb20c0cded6' rel='nofollow ugc noopener noreferrer'><span style='font-size:medium;'>NDMI Colorized</span></a><span style='font-size:medium;'>, </span><a target='_blank' href='https://www.arcgis.com/home/item.html?id=3cf4e98f035e47279091dc74d43392a5' rel='nofollow ugc noopener noreferrer'><span style='font-size:medium;'>Normalized Difference Built-Up Index (NDBI)</span></a><span style='font-size:medium;'>, </span><a target='_blank' href='https://www.arcgis.com/home/item.html?id=112db40d3640473aacb0d1f891462496' rel='nofollow ugc noopener noreferrer'><span style='font-size:medium;'>NDWI Raw</span></a><span style='font-size:medium;'>, </span><a target='_blank' href='https://www.arcgis.com/home/item.html?id=69478c5dc15a4b128d36de858602e275' rel='nofollow ugc noopener noreferrer'><span style='font-size:medium;'>NDWI - with VRE Raw</span></a><span style='font-size:medium;'>, </span><a target='_blank' href='https://www.arcgis.com/home/item.html?id=807d13b07c95425a99b9559d7c6d8579' rel='nofollow ugc noopener noreferrer'><span style='font-size:medium;'>NDVI – with VRE Raw (NDRE)</span></a><span style='font-size:medium;'>,</span><a target='_blank' href='https://www.arcgis.com/home/item.html?id=d74d10dc48444cf5bbbc48faecd65442' rel='nofollow ugc noopener noreferrer'><span style='font-size:medium;'> NDVI - VRE only Raw</span></a><span style='font-size:medium;'>, </span><a target='_blank' href='https://www.arcgis.com/home/item.html?id=1e5fe250cdb8444c9d8b16bb14bd1140' rel='nofollow ugc noopener noreferrer'><span style='font-size:medium;'>NDVI Raw</span></a><span style='font-size:medium;'>, </span><a target='_blank' href='https://www.arcgis.com/home/item.html?id=5cbafcf777e845129771e601701aaae7' rel='nofollow ugc noopener noreferrer'><span style='font-size:medium;'>Normalized Burn Ratio</span></a><span style='font-size:medium;'>, </span><a target='_blank' href='https://www.arcgis.com/home/item.html?id=dccafe125bbe4e2bb3315393acbd4701' rel='nofollow ugc noopener noreferrer'><span style='font-size:medium;'>NDVI Colormap</span></a><span style='font-size:medium;'>.</span><br />&nbsp;</li></ul><p><span style='font-size:medium;'>Multispectral Bands</span></p><figure><figure><figure><figure><figure><figure><figure><figure><figure><table style='border-collapse:collapse;' width='708' cellpadding='0' cellspacing='0' border='1'><tbody><tr style='height:15pt;'><td style='border:1pt solid windowtext; height:15pt; padding:0in 5.4pt;'><p style='margin-bottom:0.0001pt; text-align:center;'><span style='font-size:medium;'>Band</span></p></td><td style='border-bottom:1pt solid windowtext; border-image:initial; border-left-style:none; border-right:1pt solid windowtext; border-top:1pt solid windowtext; height:15pt; padding:0in 5.4pt; width:249.6pt;' width='333'><p style='margin-bottom:0.0001pt; text-align:center;'><span style='font-size:medium;'>Description</span></p></td><td style='border-bottom:1pt solid windowtext; border-image:initial; border-left-style:none; border-right:1pt solid windowtext; border-top:1pt solid windowtext; height:15pt; padding:0in 5.4pt; width:2in;' width='192'><p style='margin-bottom:0.0001pt; text-align:center;'><span style='font-size:medium;'>Wavelength (µm)</span></p></td><td style='border-bottom:1pt solid windowtext; border-image:initial; border-left-style:none; border-right:1pt solid windowtext; border-top:1pt solid windowtext; height:15pt; padding:0in 5.4pt; width:103.5pt;' width='138'><p style='margin-bottom:0.0001pt; text-align:center;'><span style='font-size:medium;'>Resolution (m)</span></p></td></tr><tr style='height:15pt;'><td style='border-bottom:1pt solid windowtext; border-image:initial; border-left:1pt solid windowtext; border-right:1pt solid windowtext; border-top-style:none; height:15pt; padding:0in 5.4pt;'><p style='margin-bottom:0.0001pt; text-align:center;'><span style='font-size:medium;'>1</span></p></td><td style='border-bottom:1pt solid windowtext; border-left-style:none; border-right:1pt solid windowtext; border-top-style:none; height:15pt; padding:0in 5.4pt; width:249.6pt;' width='333'><p style='margin-bottom:0.0001pt;'><span style='font-size:medium;'>Coastal aerosol</span></p></td><td style='border-bottom:1pt solid windowtext; border-left-style:none; border-right:1pt solid windowtext; border-top-style:none; height:15pt; padding:0in 5.4pt; width:2in;' width='192'><p style='margin-bottom:0.0001pt; text-align:center;'><span style='font-size:medium;'>0.433 - 0.453</span></p></td><td style='border-bottom:1pt solid windowtext; border-left-style:none; border-right:1pt solid windowtext; border-top-style:none; height:15pt; padding:0in 5.4pt; width:103.5pt;' width='138'><p style='margin-bottom:0.0001pt; text-align:center;'><span style='font-size:medium;'>60</span></p></td></tr><tr style='height:15pt;'><td style='border-bottom:1pt solid windowtext; border-image:initial; border-left:1pt solid windowtext; border-right:1pt solid windowtext; border-top-style:none; height:15pt; padding:0in 5.4pt;'><p style='margin-bottom:0.0001pt; text-align:center;'><span style='font-size:medium;'>2</span></p></td><td style='border-bottom:1pt solid windowtext; border-left-style:none; border-right:1pt solid windowtext; border-top-style:none; height:15pt; padding:0in 5.4pt; width:249.6pt;' width='333'><p style='margin-bottom:0.0001pt;'><span style='font-size:medium;'>Blue</span></p></td><td style='border-bottom:1pt solid windowtext; border-left-style:none; border-right:1pt solid windowtext; border-top-style:none; height:15pt; padding:0in 5.4pt; width:2in;' width='192'><p style='margin-bottom:0.0001pt; text-align:center;'><span style='font-size:medium;'>0.458 - 0.523</span></p></td><td style='border-bottom:1pt solid windowtext; border-left-style:none; border-right:1pt solid windowtext; border-top-style:none; height:15pt; padding:0in 5.4pt; width:103.5pt;' width='138'><p style='margin-bottom:0.0001pt; text-align:center;'><span style='font-size:medium;'>10</span></p></td></tr><tr style='height:15pt;'><td style='border-bottom:1pt solid windowtext; border-image:initial; border-left:1pt solid windowtext; border-right:1pt solid windowtext; border-top-style:none; height:15pt; padding:0in 5.4pt;'><p style='margin-bottom:0.0001pt; text-align:center;'><span style='font-size:medium;'>3</span></p></td><td style='border-bottom:1pt solid windowtext; border-left-style:none; border-right:1pt solid windowtext; border-top-style:none; height:15pt; padding:0in 5.4pt; width:249.6pt;' width='333'><p style='margin-bottom:0.0001pt;'><span style='font-size:medium;'>Green</span></p></td><td style='border-bottom:1pt solid windowtext; border-left-style:none; border-right:1pt solid windowtext; border-top-style:none; height:15pt; padding:0in 5.4pt; width:2in;' width='192'><p style='margin-bottom:0.0001pt; text-align:center;'><span style='font-size:medium;'>0.543 - 0.578</span></p></td><td style='border-bottom:1pt solid windowtext; border-left-style:none; border-right:1pt solid windowtext; border-top-style:none; height:15pt; padding:0in 5.4pt; width:103.5pt;' width='138'><p style='margin-bottom:0.0001pt; text-align:center;'><span style='font-size:medium;'>10</span></p></td></tr><tr style='height:15pt;'><td style='border-bottom:1pt solid windowtext; border-image:initial; border-left:1pt solid windowtext; border-right:1pt solid windowtext; border-top-style:none; height:15pt; padding:0in 5.4pt;'><p style='margin-bottom:0.0001pt; text-align:center;'><span style='font-size:medium;'>4</span></p></td><td style='border-bottom:1pt solid windowtext; border-left-style:none; border-right:1pt solid windowtext; border-top-style:none; height:15pt; padding:0in 5.4pt; width:249.6pt;' width='333'><p style='margin-bottom:0.0001pt;'><span style='font-size:medium;'>Red</span></p></td><td style='border-bottom:1pt solid windowtext; border-left-style:none; border-right:1pt solid windowtext; border-top-style:none; height:15pt; padding:0in 5.4pt; width:2in;' width='192'><p style='margin-bottom:0.0001pt; text-align:center;'><span style='font-size:medium;'>0.650 - 0.680</span></p></td><td style='border-bottom:1pt solid windowtext; border-left-style:none; border-right:1pt solid windowtext; border-top-style:none; height:15pt; padding:0in 5.4pt; width:103.5pt;' width='138'><p style='margin-bottom:0.0001pt; text-align:center;'><span style='font-size:medium;'>10</span></p></td></tr><tr style='height:15pt;'><td style='border-bottom:1pt solid windowtext; border-image:initial; border-left:1pt solid windowtext; border-right:1pt solid windowtext; border-top-style:none; height:15pt; padding:0in 5.4pt;'><p style='margin-bottom:0.0001pt; text-align:center;'><span style='font-size:medium;'>5</span></p></td><td style='border-bottom:1pt solid windowtext; border-left-style:none; border-right:1pt solid windowtext; border-top-style:none; height:15pt; padding:0in 5.4pt; width:249.6pt;' width='333'><p style='margin-bottom:0.0001pt;'><span style='font-size:medium;'>Vegetation Red Edge</span></p></td><td style='border-bottom:1pt solid windowtext; border-left-style:none; border-right:1pt solid windowtext; border-top-style:none; height:15pt; padding:0in 5.4pt; width:2in;' width='192'><p style='margin-bottom:0.0001pt; text-align:center;'><span style='font-size:medium;'>0.698 - 0.713</span></p></td><td style='border-bottom:1pt solid windowtext; border-left-style:none; border-right:1pt solid windowtext; border-top-style:none; height:15pt; padding:0in 5.4pt; width:103.5pt;' width='138'><p style='margin-bottom:0.0001pt; text-align:center;'><span style='font-size:medium;'>20</span></p></td></tr><tr style='height:15pt;'><td style='border-bottom:1pt solid windowtext; border-image:initial; border-left:1pt solid windowtext; border-right:1pt solid windowtext; border-top-style:none; height:15pt; padding:0in 5.4pt;'><p style='margin-bottom:0.0001pt; text-align:center;'><span style='font-size:medium;'>6</span></p></td><td style='border-bottom:1pt solid windowtext; border-left-style:none; border-right:1pt solid windowtext; border-top-style:none; height:15pt; padding:0in 5.4pt; width:249.6pt;' width='333'><p style='margin-bottom:0.0001pt;'><span style='font-size:medium;'>Vegetation Red Edge</span></p></td><td style='border-bottom:1pt solid windowtext; border-left-style:none; border-right:1pt solid windowtext; border-top-style:none; height:15pt; padding:0in 5.4pt; width:2in;' width='192'><p style='margin-bottom:0.0001pt; text-align:center;'><span style='font-size:medium;'>0.733 - 0.748</span></p></td><td style='border-bottom:1pt solid windowtext; border-left-style:none; border-right:1pt solid windowtext; border-top-style:none; height:15pt; padding:0in 5.4pt; width:103.5pt;' width='138'><p style='margin-bottom:0.0001pt; text-align:center;'><span style='font-size:medium;'>20</span></p></td></tr><tr style='height:15pt;'><td style='border-bottom:1pt solid windowtext; border-image:initial; border-left:1pt solid windowtext; border-right:1pt solid windowtext; border-top-style:none; height:15pt; padding:0in 5.4pt;'><p style='margin-bottom:0.0001pt; text-align:center;'><span style='font-size:medium;'>7</span></p></td><td style='border-bottom:1pt solid windowtext; border-left-style:none; border-right:1pt solid windowtext; border-top-style:none; height:15pt; padding:0in 5.4pt; width:249.6pt;' width='333'><p style='margin-bottom:0.0001pt;'><span style='font-size:medium;'>Vegetation Red Edge</span></p></td><td style='border-bottom:1pt solid windowtext; border-left-style:none; border-right:1pt solid windowtext; border-top-style:none; height:15pt; padding:0in 5.4pt; width:2in;' width='192'><p style='margin-bottom:0.0001pt; text-align:center;'><span style='font-size:medium;'>0.773 - 0.793</span></p></td><td style='border-bottom:1pt solid windowtext; border-left-style:none; border-right:1pt solid windowtext; border-top-style:none; height:15pt; padding:0in 5.4pt; width:103.5pt;' width='138'><p style='margin-bottom:0.0001pt; text-align:center;'><span style='font-size:medium;'>20</span></p></td></tr><tr style='height:15pt;'><td style='border-bottom:1pt solid windowtext; border-image:initial; border-left:1pt solid windowtext; border-right:1pt solid windowtext; border-top-style:none; height:15pt; padding:0in 5.4pt;'><p style='margin-bottom:0.0001pt; text-align:center;'><span style='font-size:medium;'>8</span></p></td><td style='border-bottom:1pt solid windowtext; border-left-style:none; border-right:1pt solid windowtext; border-top-style:none; height:15pt; padding:0in 5.4pt; width:249.6pt;' width='333'><p style='margin-bottom:0.0001pt;'><span style='font-size:medium;'>NIR</span></p></td><td style='border-bottom:1pt solid windowtext; border-left-style:none; border-right:1pt solid windowtext; border-top-style:none; height:15pt; padding:0in 5.4pt; width:2in;' width='192'><p style='margin-bottom:0.0001pt; text-align:center;'><span style='font-size:medium;'>0.785 - 0.900</span></p></td><td style='border-bottom:1pt solid windowtext; border-left-style:none; border-right:1pt solid windowtext; border-top-style:none; height:15pt; padding:0in 5.4pt; width:103.5pt;' width='138'><p style='margin-bottom:0.0001pt; text-align:center;'><span style='font-size:medium;'>10</span></p></td></tr><tr style='height:15pt;'><td style='border-bottom:1pt solid windowtext; border-image:initial; border-left:1pt solid windowtext; border-right:1pt solid windowtext; border-top-style:none; height:15pt; padding:0in 5.4pt;'><p style='margin-bottom:0.0001pt; text-align:center;'><span style='font-size:medium;'>8A</span></p></td><td style='border-bottom:1pt solid windowtext; border-left-style:none; border-right:1pt solid windowtext; border-top-style:none; height:15pt; padding:0in 5.4pt; width:249.6pt;' width='333'><p style='margin-bottom:0.0001pt;'><span style='font-size:medium;'>Narrow NIR</span></p></td><td style='border-bottom:1pt solid windowtext; border-left-style:none; border-right:1pt solid windowtext; border-top-style:none; height:15pt; padding:0in 5.4pt; width:2in;' width='192'><p style='margin-bottom:0.0001pt; text-align:center;'><span style='font-size:medium;'>0.855 - 0.875</span></p></td><td style='border-bottom:1pt solid windowtext; border-left-style:none; border-right:1pt solid windowtext; border-top-style:none; height:15pt; padding:0in 5.4pt; width:103.5pt;' width='138'><p style='margin-bottom:0.0001pt; text-align:center;'><span style='font-size:medium;'>20</span></p></td></tr><tr style='height:15pt;'><td style='border-bottom:1pt solid windowtext; border-image:initial; border-left:1pt solid windowtext; border-right:1pt solid windowtext; border-top-style:none; height:15pt; padding:0in 5.4pt;'><p style='margin-bottom:0.0001pt; text-align:center;'><span style='font-size:medium;'>9</span></p></td><td style='border-bottom:1pt solid windowtext; border-left-style:none; border-right:1pt solid windowtext; border-top-style:none; height:15pt; padding:0in 5.4pt; width:249.6pt;' width='333'><p style='margin-bottom:0.0001pt;'><span style='font-size:medium;'>Water vapour</span></p></td><td style='border-bottom:1pt solid windowtext; border-left-style:none; border-right:1pt solid windowtext; border-top-style:none; height:15pt; padding:0in 5.4pt; width:2in;' width='192'><p style='margin-bottom:0.0001pt; text-align:center;'><span style='font-size:medium;'>0.935 - 0.955</span></p></td><td style='border-bottom:1pt solid windowtext; border-left-style:none; border-right:1pt solid windowtext; border-top-style:none; height:15pt; padding:0in 5.4pt; width:103.5pt;' width='138'><p style='margin-bottom:0.0001pt; text-align:center;'><span style='font-size:medium;'>60</span></p></td></tr><tr style='height:15pt;'><td style='border-bottom:1pt solid windowtext; border-image:initial; border-left:1pt solid windowtext; border-right:1pt solid windowtext; border-top-style:none; height:15pt; padding:0in 5.4pt;'><p style='margin-bottom:0.0001pt; text-align:center;'><span style='font-size:medium;'>10</span></p></td><td style='border-bottom:1pt solid windowtext; border-left-style:none; border-right:1pt solid windowtext; border-top-style:none; height:15pt; padding:0in 5.4pt; width:249.6pt;' width='333'><p style='margin-bottom:0.0001pt;'><span style='font-size:medium;'>SWIR – Cirrus</span></p></td><td style='border-bottom:1pt solid windowtext; border-left-style:none; border-right:1pt solid windowtext; border-top-style:none; height:15pt; padding:0in 5.4pt; width:2in;' width='192'><p style='margin-bottom:0.0001pt; text-align:center;'><span style='font-size:medium;'>1.365 - 1.385</span></p></td><td style='border-bottom:1pt solid windowtext; border-left-style:none; border-right:1pt solid windowtext; border-top-style:none; height:15pt; padding:0in 5.4pt; width:103.5pt;' width='138'><p style='margin-bottom:0.0001pt; text-align:center;'><span style='font-size:medium;'>60</span></p></td></tr><tr style='height:15pt;'><td style='border-bottom:1pt solid windowtext; border-image:initial; border-left:1pt solid windowtext; border-right:1pt solid windowtext; border-top-style:none; height:15pt; padding:0in 5.4pt;'><p style='margin-bottom:0.0001pt; text-align:center;'><span style='font-size:medium;'>11</span></p></td><td style='border-bottom:1pt solid windowtext; border-left-style:none; border-right:1pt solid windowtext; border-top-style:none; height:15pt; padding:0in 5.4pt; width:249.6pt;' width='333'><p style='margin-bottom:0.0001pt;'><span style='font-size:medium;'>SWIR-1</span></p></td><td style='border-bottom:1pt solid windowtext; border-left-style:none; border-right:1pt solid windowtext; border-top-style:none; height:15pt; padding:0in 5.4pt; width:2in;' width='192'><p style='margin-bottom:0.0001pt; text-align:center;'><span style='font-size:medium;'>1.565 - 1.655</span></p></td><td style='border-bottom:1pt solid windowtext; border-left-style:none; border-right:1pt solid windowtext; border-top-style:none; height:15pt; padding:0in 5.4pt; width:103.5pt;' width='138'><p style='margin-bottom:0.0001pt; text-align:center;'><span style='font-size:medium;'>20</span></p></td></tr><tr style='height:15pt;'><td style='border-bottom:1pt solid windowtext; border-image:initial; border-left:1pt solid windowtext; border-right:1pt solid windowtext; border-top-style:none; height:15pt; padding:0in 5.4pt;'><p style='margin-bottom:0.0001pt; text-align:center;'><span style='font-size:medium;'>12</span></p></td><td style='border-bottom:1pt solid windowtext; border-left-style:none; border-right:1pt solid windowtext; border-top-style:none; height:15pt; padding:0in 5.4pt; width:249.6pt;' width='333'><p style='margin-bottom:0.0001pt;'><span style='font-size:medium;'>SWIR-2</span></p></td><td style='border-bottom:1pt solid windowtext; border-left-style:none; border-right:1pt solid windowtext; border-top-style:none; height:15pt; padding:0in 5.4pt; width:2in;' width='192'><p style='margin-bottom:0.0001pt; text-align:center;'><span style='font-size:medium;'>2.100 - 2.280</span></p></td><td style='border-bottom:1pt solid windowtext; border-left-style:none; border-right:1pt solid windowtext; border-top-style:none; height:15pt; padding:0in 5.4pt; width:103.5pt;' width='138'><p style='margin-bottom:0.0001pt; text-align:center;'><span style='font-size:medium;'>20</span></p></td></tr></tbody></table></figure></figure></figure></figure></figure></figure></figure></figure></figure><p><span style='font-size:medium;'>Additional Notes</span></p><ul><li><span style='font-size:medium;'>Overviews exist with a spatial resolution of 150m and are updated every quarter based on the best and latest imagery available at that time.</span></li><li><span style='font-size:medium;'>To work with source images at all scales, the ‘Lock Raster’ functionality is available.</span>&nbsp;<ul><li><span style='font-size:medium;'>NOTE: ‘Lock Raster’ should only be used on the layer for short periods of time, as the imagery and associated record Object IDs may change daily.</span></li></ul></li><li><span style='font-size:medium;'>This ArcGIS Server dynamic imagery layer can be used in Web Maps and ArcGIS Desktop as well as Web and Mobile applications using the REST based Image services API.</span></li><li><span style='font-size:medium;'>Images can be exported up to a maximum of 4,000 columns x 4,000 rows per request.</span><br />&nbsp;</li></ul><p><span style='font-size:medium;'>Data Source</span></p><p><span style='font-size:medium;'>Sentinel-2 imagery is the result of close collaboration between the (European Space Agency) ESA, the European Commission and USGS. Data is hosted by the Amazon Web Services as part of their </span><a target='_blank' href='https://registry.opendata.aws/' rel='nofollow ugc noopener noreferrer'><span style='font-size:medium;'>Registry of Open Data</span></a><span style='font-size:medium;'>. Users can access the imagery from</span><a target='_blank' href='https://registry.opendata.aws/sentinel-2/' rel='nofollow ugc noopener noreferrer'><span style='font-size:medium;'> Sentinel-2 on AWS</span></a><span style='font-size:medium;'>, or alternatively access </span><a target='_blank' href='https://earthexplorer.usgs.gov/' rel='nofollow ugc noopener noreferrer'><span style='font-size:medium;'>EarthExplorer</span></a><span style='font-size:medium;'> or the </span><a target='_blank' href='https://dataspace.copernicus.eu/' rel='nofollow ugc noopener noreferrer'>Copernicus Data Space Ecosystem </a><span style='font-size:medium;'>to download the scenes.</span></p><p><span style='font-size:medium;'>For information on Sentinel-2 imagery, see</span><a target='_blank' href='https://sentinel.esa.int/web/sentinel/missions/sentinel-2' rel='nofollow ugc noopener noreferrer'><span style='font-size:medium;'> Sentinel-2</span></a><span style='font-size:medium;'>.</span></p>",
			"keyword": [
				"sentinel",
				"imagery",
				"multispectral",
				"temporal",
				"amazon",
				"MS",
				"esa",
				"sentinel on aws",
				"sentinel2",
				"sentinel2 on aws",
				"sentinel2 views",
				"sentinel-2"
			],
			"issued": "2018-05-02T15:47:29.000Z",
			"modified": "2025-09-02T18:15:06.000Z",
			"publisher": {
				"name": "Esri"
			},
			"contactPoint": {
				"@type": "vcard:Contact",
				"fn": "esri_imagery",
				"hasEmail": "{{orgContactEmail}}"
			},
			"accessLevel": "public",
			"spatial": "-179.9973,-66.8050,179.9973,72.9957",
			"license": "<div><p><img src='https://downloads.esri.com/blogs/arcgisonline/esrilogo_new.png' /> This work is licensed under the Esri Master License Agreement.</p><div><a target='_blank' href='https://goto.arcgis.com/termsofuse/viewsummary' rel='nofollow ugc noopener noreferrer'><strong>View Summary</strong></a>&nbsp;|&nbsp;<a target='_blank' href='https://goto.arcgis.com/termsofuse/viewtermsofuse' rel='nofollow ugc noopener noreferrer'><strong>View Terms of Use</strong></a></div></div><div>&nbsp;</div><div>&nbsp;</div>",
			"distribution": [
				{
					"@type": "dcat:Distribution",
					"title": "ArcGIS Hub Dataset",
					"format": "Web Page",
					"mediaType": "text/html",
					"accessURL": "https://www.pacificgeoportal.com/datasets/esri::sentinel-2-views"
				},
				{
					"@type": "dcat:Distribution",
					"title": "ArcGIS GeoService",
					"format": "ArcGIS GeoServices REST API",
					"mediaType": "application/json",
					"accessURL": "https://sentinel.arcgis.com/arcgis/rest/services/Sentinel2/ImageServer"
				}
			],
			"theme": [
				"geospatial"
			]
		},
		{
			"@type": "dcat:Dataset",
			"identifier": "https://www.arcgis.com/home/item.html?id=1324c4e0c86a40e9b7529e91c6bdf220",
			"landingPage": "https://www.pacificgeoportal.com/content/esri::bioclimate-projections-16-precipitation-of-wettest-quarter",
			"title": "Bioclimate Projections: (16) Precipitation of Wettest Quarter",
			"description": "<p><span style='color:#dc143c;'><strong>Retirement Notice:</strong></span><strong>&nbsp;This item is in </strong><a target='_blank' href='https://goto.arcgis.com/lifecycle/content' rel='nofollow ugc noopener noreferrer'><strong>mature support</strong></a><strong> as of&nbsp;June 2025 and will be retired in December 2026. A</strong><a target='_blank' href='https://www.arcgis.com/home/item.html?id=bd8ec0b138754391abd6fff12875eb2d' rel='nofollow ugc noopener noreferrer'><strong> new version of this item</strong></a><strong>&nbsp;is available for your use. </strong>Esri recommends updating your maps and apps to use the new version.</p><div><p><span style='background-attachment:initial; background-clip:initial; background-image:initial; background-origin:initial; background-position:initial; background-repeat:initial; background-size:initial;'>This layer represents CMIP6 future projections of total precipitation during the three wettest months of the year. This layer can be used to compare with recent climate histories to better understand the potential impacts of future climate change.</span></p><p><a target='_blank' href='https://worldclim.org/' rel='nofollow ugc noopener noreferrer'><span style='background-attachment:initial; background-clip:initial; background-image:initial; background-origin:initial; background-position:initial; background-repeat:initial; background-size:initial;'>WorldClim</span></a><span style='background-attachment:initial; background-clip:initial; background-image:initial; background-origin:initial; background-position:initial; background-repeat:initial; background-size:initial;'>&nbsp;produced this projection as part of a series of&nbsp;</span><a target='_blank' href='https://pubs.usgs.gov/ds/691/ds691.pdf' rel='nofollow ugc noopener noreferrer'><span style='background-attachment:initial; background-clip:initial; background-image:initial; background-origin:initial; background-position:initial; background-repeat:initial; background-size:initial;'>19 bioclimate variables identified by the USGS</span></a><span style='background-attachment:initial; background-clip:initial; background-image:initial; background-origin:initial; background-position:initial; background-repeat:initial; background-size:initial;'>&nbsp;and provides this description:</span><br /><br /><i>\"Bioclimatic variables are derived from the monthly temperature and rainfall values in order to generate more biologically meaningful variables. These are often used in species distribution modeling and related ecological modeling techniques. The bioclimatic variables represent annual trends (e.g., mean annual temperature, annual precipitation) seasonality (e.g., annual range in temperature and precipitation) and extreme or limiting environmental factors (e.g., temperature of the coldest and warmest month, and precipitation of the wet and dry quarters). A quarter is a period of three months (1/4 of the year).\"</i></p><p style='background-attachment:initial; background-clip:initial; background-image:initial; background-origin:initial; background-position:initial; background-repeat:initial; background-size:initial; margin-bottom:0in;'><strong>Time Extent:</strong>&nbsp;averages from 2021-2040, 2041-2060, 2061-2080, 2081-2100<br /><strong>Units:</strong>&nbsp;mm<br /><strong>Cell Size:</strong> 2.5 minutes (~5 km)<br /><strong>Source Type:</strong> Stretched<br /><strong>Pixel Type:</strong> 32 Bit Float<br /><strong>Data Projection:</strong> GCS WGS84<br /><strong>Mosaic Projection:</strong> GCS WGS84<br /><strong>Extent:</strong> Global<br /><strong>Source:</strong> <a target='_blank' href='https://worldclim.org/data/cmip6/cmip6_clim2.5m.html' rel='nofollow ugc noopener noreferrer'>WorldClim CMIP6 Bioclimate</a></p><p>&nbsp;</p><p><strong>Climate Scenarios</strong></p><p>The CMIP6 climate experiments use&nbsp;<a target='_blank' href='https://www.carbonbrief.org/explainer-how-shared-socioeconomic-pathways-explore-future-climate-change/' rel='nofollow ugc noopener noreferrer'>Shared Socioeconomic Pathways (SSPs)</a>&nbsp;to model future climate scenarios. Each SSP pairs a human/community behavior component with the traditional RCP greenhouse gas forcing from the previous CMIP5. Three SSPs were chosen by Esri to be included in the service based on user requests: SSP2 4.5, SSP3 7.0 and SSP5 8.5.</p><figure style='width:637.65pt;'><figure><table style='background-color:rgb(248, 249, 250); border-collapse:collapse;' width='850' cellpadding='0' cellspacing='0' border='1'><tbody><tr><td style='background-color:rgb(234, 236, 240); border:1pt solid rgb(162, 169, 177); padding:2.4pt 4.8pt;'><p style='margin:12pt 0in; text-align:center;'><span style='color:rgb(32,33,34); font-family:Arial, sans-serif; font-size:10.5pt;'><strong>SSP</strong></span></p></td><td style='background-color:rgb(234, 236, 240); border-bottom:1pt solid rgb(162, 169, 177); border-image:initial; border-left-style:none; border-right:1pt solid rgb(162, 169, 177); border-top:1pt solid rgb(162, 169, 177); padding:2.4pt 4.8pt;'><p style='margin:12pt 0in; text-align:center;'><span style='color:rgb(32,33,34); font-family:Arial, sans-serif; font-size:10.5pt;'><strong>Scenario</strong></span></p></td><td style='background-color:rgb(234, 236, 240); border-bottom:1pt solid rgb(162, 169, 177); border-image:initial; border-left-style:none; border-right:1pt solid rgb(162, 169, 177); border-top:1pt solid rgb(162, 169, 177); padding:2.4pt 4.8pt;'><p style='margin:12pt 0in; text-align:center;'><span style='color:rgb(32,33,34); font-family:Arial, sans-serif; font-size:10.5pt;'><strong>Estimated warming</strong></span><br /><span style='color:rgb(32,33,34); font-family:Arial, sans-serif; font-size:10.5pt;'><strong>(2041–2060)</strong></span></p></td><td style='background-color:rgb(234, 236, 240); border-bottom:1pt solid rgb(162, 169, 177); border-image:initial; border-left-style:none; border-right:1pt solid rgb(162, 169, 177); border-top:1pt solid rgb(162, 169, 177); padding:2.4pt 4.8pt;'><p style='margin:12pt 0in; text-align:center;'><span style='color:rgb(32,33,34); font-family:Arial, sans-serif; font-size:10.5pt;'><strong>Estimated warming</strong></span><br /><span style='color:rgb(32,33,34); font-family:Arial, sans-serif; font-size:10.5pt;'><strong>(2081–2100)</strong></span></p></td><td style='background-color:rgb(234, 236, 240); border-bottom:1pt solid rgb(162, 169, 177); border-image:initial; border-left-style:none; border-right:1pt solid rgb(162, 169, 177); border-top:1pt solid rgb(162, 169, 177); padding:2.4pt 4.8pt;'><p style='margin:12pt 0in; text-align:center;'><span style='color:rgb(32,33,34); font-family:Arial, sans-serif; font-size:10.5pt;'><strong>Very likely range in °C</strong></span><br /><span style='color:rgb(32,33,34); font-family:Arial, sans-serif; font-size:10.5pt;'><strong>(2081–2100)</strong></span></p></td></tr><tr><td style='border-bottom:1pt solid rgb(162, 169, 177); border-image:initial; border-left:1pt solid rgb(162, 169, 177); border-right:1pt solid rgb(162, 169, 177); border-top-style:none; padding:2.4pt 4.8pt;'><p style='margin:12pt 0in; text-align:center;'><span style='color:rgb(32,33,34); font-family:Arial, sans-serif; font-size:10.5pt;'>SSP2-4.5</span></p></td><td style='border-bottom:1pt solid rgb(162, 169, 177); border-left-style:none; border-right:1pt solid rgb(162, 169, 177); border-top-style:none; padding:2.4pt 4.8pt;'><p style='margin:12pt 0in; text-align:center;'><span style='color:rgb(32,33,34); font-family:Arial, sans-serif; font-size:10.5pt;'>intermediate GHG emissions:</span><br /><span style='color:rgb(32,33,34); font-family:Arial, sans-serif; font-size:10.5pt;'>CO</span><span style='color:rgb(32,33,34); font-family:Arial, sans-serif; font-size:8.5pt;'><sub>2</sub></span><span style='color:rgb(32,33,34); font-family:Arial, sans-serif; font-size:10.5pt;'>&nbsp;emissions around current levels until 2050, then falling but not reaching net zero by 2100</span></p></td><td style='border-bottom:1pt solid rgb(162, 169, 177); border-left-style:none; border-right:1pt solid rgb(162, 169, 177); border-top-style:none; padding:2.4pt 4.8pt;'><p style='margin:12pt 0in; text-align:center;'><span style='color:rgb(32,33,34); font-family:Arial, sans-serif; font-size:10.5pt;'>2.0 °C</span></p></td><td style='border-bottom:1pt solid rgb(162, 169, 177); border-left-style:none; border-right:1pt solid rgb(162, 169, 177); border-top-style:none; padding:2.4pt 4.8pt;'><p style='margin:12pt 0in; text-align:center;'><span style='color:rgb(32,33,34); font-family:Arial, sans-serif; font-size:10.5pt;'>2.7 °C</span></p></td><td style='border-bottom:1pt solid rgb(162, 169, 177); border-left-style:none; border-right:1pt solid rgb(162, 169, 177); border-top-style:none; padding:2.4pt 4.8pt;'><p style='margin:12pt 0in; text-align:center;'><span style='color:rgb(32,33,34); font-family:Arial, sans-serif; font-size:10.5pt;'>2.1 – 3.5</span></p></td></tr><tr><td style='border-bottom:1pt solid rgb(162, 169, 177); border-image:initial; border-left:1pt solid rgb(162, 169, 177); border-right:1pt solid rgb(162, 169, 177); border-top-style:none; padding:2.4pt 4.8pt;'><p style='margin:12pt 0in; text-align:center;'><span style='color:rgb(32,33,34); font-family:Arial, sans-serif; font-size:10.5pt;'>SSP3-7.0</span></p></td><td style='border-bottom:1pt solid rgb(162, 169, 177); border-left-style:none; border-right:1pt solid rgb(162, 169, 177); border-top-style:none; padding:2.4pt 4.8pt;'><p style='margin:12pt 0in; text-align:center;'><span style='color:rgb(32,33,34); font-family:Arial, sans-serif; font-size:10.5pt;'>high GHG emissions:</span><br /><span style='color:rgb(32,33,34); font-family:Arial, sans-serif; font-size:10.5pt;'>CO</span><span style='color:rgb(32,33,34); font-family:Arial, sans-serif; font-size:8.5pt;'><sub>2</sub></span><span style='color:rgb(32,33,34); font-family:Arial, sans-serif; font-size:10.5pt;'>&nbsp;emissions double by 2100</span></p></td><td style='border-bottom:1pt solid rgb(162, 169, 177); border-left-style:none; border-right:1pt solid rgb(162, 169, 177); border-top-style:none; padding:2.4pt 4.8pt;'><p style='margin:12pt 0in; text-align:center;'><span style='color:rgb(32,33,34); font-family:Arial, sans-serif; font-size:10.5pt;'>2.1 °C</span></p></td><td style='border-bottom:1pt solid rgb(162, 169, 177); border-left-style:none; border-right:1pt solid rgb(162, 169, 177); border-top-style:none; padding:2.4pt 4.8pt;'><p style='margin:12pt 0in; text-align:center;'><span style='color:rgb(32,33,34); font-family:Arial, sans-serif; font-size:10.5pt;'>3.6 °C</span></p></td><td style='border-bottom:1pt solid rgb(162, 169, 177); border-left-style:none; border-right:1pt solid rgb(162, 169, 177); border-top-style:none; padding:2.4pt 4.8pt;'><p style='margin:12pt 0in; text-align:center;'><span style='color:rgb(32,33,34); font-family:Arial, sans-serif; font-size:10.5pt;'>2.8 – 4.6</span></p></td></tr><tr><td style='border-bottom:1pt solid rgb(162, 169, 177); border-image:initial; border-left:1pt solid rgb(162, 169, 177); border-right:1pt solid rgb(162, 169, 177); border-top-style:none; padding:2.4pt 4.8pt;'><p style='margin:12pt 0in; text-align:center;'><span style='color:rgb(32,33,34); font-family:Arial, sans-serif; font-size:10.5pt;'>SSP5-8.5</span></p></td><td style='border-bottom:1pt solid rgb(162, 169, 177); border-left-style:none; border-right:1pt solid rgb(162, 169, 177); border-top-style:none; padding:2.4pt 4.8pt;'><p style='margin:12pt 0in; text-align:center;'><span style='color:rgb(32,33,34); font-family:Arial, sans-serif; font-size:10.5pt;'>very high GHG emissions:</span><br /><span style='color:rgb(32,33,34); font-family:Arial, sans-serif; font-size:10.5pt;'>CO</span><span style='color:rgb(32,33,34); font-family:Arial, sans-serif; font-size:8.5pt;'><sub>2</sub></span><span style='color:rgb(32,33,34); font-family:Arial, sans-serif; font-size:10.5pt;'>&nbsp;emissions triple by 2075</span></p></td><td style='border-bottom:1pt solid rgb(162, 169, 177); border-left-style:none; border-right:1pt solid rgb(162, 169, 177); border-top-style:none; padding:2.4pt 4.8pt;'><p style='margin:12pt 0in; text-align:center;'><span style='color:rgb(32,33,34); font-family:Arial, sans-serif; font-size:10.5pt;'>2.4 °C</span></p></td><td style='border-bottom:1pt solid rgb(162, 169, 177); border-left-style:none; border-right:1pt solid rgb(162, 169, 177); border-top-style:none; padding:2.4pt 4.8pt;'><p style='margin:12pt 0in; text-align:center;'><span style='color:rgb(32,33,34); font-family:Arial, sans-serif; font-size:10.5pt;'>4.4 °C</span></p></td><td style='border-bottom:1pt solid rgb(162, 169, 177); border-left-style:none; border-right:1pt solid rgb(162, 169, 177); border-top-style:none; padding:2.4pt 4.8pt;'><p style='margin:12pt 0in; text-align:center;'><span style='color:rgb(32,33,34); font-family:Arial, sans-serif; font-size:10.5pt;'>3.3 – 5.7</span></p></td></tr></tbody></table></figure></figure><p>While the 8.5 scenario is no longer generally considered likely, SSP3 7.0 has been included and is considered the high end of possibilities. SSP5 8.5 has been retained since many organizations report to this threshold. The warming associated with SSP2 4.5 is equivalent to the global targets set at the 2021 United Nations COP26 meetings in Glasgow.&nbsp;</p><p><strong>Processing the Climate Data</strong></p><p>WorldClim provides 20-year averaged outputs for the various SSPs from 24 global climate models. A selection of 13 models were averaged for each variable and time based on&nbsp;<a target='_blank' href='https://rmets.onlinelibrary.wiley.com/doi/full/10.1002/joc.7566' rel='nofollow ugc noopener noreferrer'>Mahony et al 2022</a>. These models included ACCESS-ESM1-5, BCC-CSM2-MR, CanESM5, CNRM-ESM2-1, EC-Earth3-Veg, GFDL-ESM4, GISS-E2-1-G, INM-CM5-0,&nbsp;&nbsp;IPSL-CM6A-LR, MIROC6, MPI-ESM1-2-HR, MRI-ESM2-0, UKESM1-0-LL. GFDL-ESM4 was not available for SSP2 4.5 or SSP5 8.5.&nbsp;</p><p><strong>Accessing the Multidimensional Information</strong></p><p>The time and SSP scenario are built into the layer using a multidimensional raster. Enable the time slider to move across the 20-year average periods. In ArcGIS Online and Pro, use the Multidimensional Filter to select the SSP (SSP2 4.5 is the default).&nbsp;<br /><br /><strong>What can you do with this layer?</strong></p><p>These multidimensional imagery tiles support analysis using ArcGIS Online or Pro. Use the&nbsp;<a target='_blank' href='https://arcgis.com/home/item.html?id=e56c9cb70aa949adb791c4311003d9ae' rel='nofollow ugc noopener noreferrer'>Bioclimate Baseline layer</a>&nbsp;to see the difference in pixels and calculate change from the historic period into the future. Use the&nbsp;<a target='_blank' href='https://pro.arcgis.com/en/pro-app/latest/help/data/imagery/an-overview-of-multidimensional-raster-data.htm' rel='nofollow ugc noopener noreferrer'>Multidimensional&nbsp;</a>tab in ArcGIS Pro to access a variety of useful tools. Each layer or variable can be styled using the Image Display options.&nbsp;</p><p><strong>Known Quality Issues</strong></p><p>Each model is downscaled from ~100km resolution to ~5km resolution by WorldClim. Some artifacts are inevitable, especially at a global scale. Some variables have distinct transitions, especially in Greenland. Also, SSP2 4.5 has missing data for several variables in Antarctica.<br />&nbsp;</p><p><strong>Related Layers</strong></p><p><a target='_blank' href='https://arcgis.com/home/item.html?id=fdaa1b7912e440efb9e29cf5d6156bb0' rel='nofollow ugc noopener noreferrer'>Bioclimate 1&nbsp;&nbsp;Annual Mean Temperature</a><br /><a target='_blank' href='https://arcgis.com/home/item.html?id=8012b34e8c854d6fbcfe4eab437ea397' rel='nofollow ugc noopener noreferrer'>Bioclimate 2&nbsp;&nbsp;Mean Diurnal Range</a><br /><a target='_blank' href='https://arcgis.com/home/item.html?id=ef9f5d6a16ca41ada0c0075a8da46d48' rel='nofollow ugc noopener noreferrer'>Bioclimate 3&nbsp;&nbsp;Isothermality</a><br /><a target='_blank' href='https://arcgis.com/home/item.html?id=64799fea8774463aad909020b6590dc8' rel='nofollow ugc noopener noreferrer'>Bioclimate 4&nbsp;&nbsp;Temperature Seasonality</a><br /><a target='_blank' href='https://arcgis.com/home/item.html?id=8433250e0a4148f5a3889c66e78abdf1' rel='nofollow ugc noopener noreferrer'>Bioclimate 5&nbsp;&nbsp;Max Temperature of Warmest Month</a><br /><a target='_blank' href='https://arcgis.com/home/item.html?id=c531d32ab5d746b88a884b6e54f3216e' rel='nofollow ugc noopener noreferrer'>Bioclimate 6&nbsp;&nbsp;Min Temperature Of Coldest Month</a><br /><a target='_blank' href='https://arcgis.com/home/item.html?id=808cfb3ab1614f8ab7e364de737e9e98' rel='nofollow ugc noopener noreferrer'>Bioclimate 7&nbsp;&nbsp;Temperature Annual Range</a><br /><a target='_blank' href='https://arcgis.com/home/item.html?id=b5990aa16fd94bb691a09449716ed7e5' rel='nofollow ugc noopener noreferrer'>Bioclimate 8&nbsp;&nbsp;Mean Temperature Of Wettest Quarter</a><br /><a target='_blank' href='https://arcgis.com/home/item.html?id=231770161a46467e8de9fdd9fd92dad7' rel='nofollow ugc noopener noreferrer'>Bioclimate 9&nbsp;&nbsp;Mean Temperature Of Driest Quarter</a><br /><a target='_blank' href='https://arcgis.com/home/item.html?id=3b98ddf1c78d4f0c88bd297f85847c68' rel='nofollow ugc noopener noreferrer'>Bioclimate 10&nbsp;&nbsp;Mean Temperature Of Warmest Quarter</a><br /><a target='_blank' href='https://arcgis.com/home/item.html?id=1a96d928c93c4e8fbc6a2391afd1da2f' rel='nofollow ugc noopener noreferrer'>Bioclimate 11&nbsp;&nbsp;Mean Temperature Of Coldest Quarter</a><br /><a target='_blank' href='https://arcgis.com/home/item.html?id=7bc0b8c75b0244b7a8128ae1f398bfc0' rel='nofollow ugc noopener noreferrer'>Bioclimate 12&nbsp;&nbsp;Annual Precipitation</a><br /><a target='_blank' href='https://arcgis.com/home/item.html?id=36fde801c8124f93b46b727b9873c993' rel='nofollow ugc noopener noreferrer'>Bioclimate 13&nbsp;&nbsp;Precipitation Of Wettest Month</a><br /><a target='_blank' href='https://arcgis.com/home/item.html?id=e26b01e4fa0a4aec9c5db991467b31a7' rel='nofollow ugc noopener noreferrer'>Bioclimate 14&nbsp;&nbsp;Precipitation Of Driest Month</a><br /><a target='_blank' href='https://arcgis.com/home/item.html?id=33558b5fef8642338f33918d498f41cf' rel='nofollow ugc noopener noreferrer'>Bioclimate 15&nbsp;&nbsp;Precipitation Seasonality</a><br /><a target='_blank' href='https://arcgis.com/home/item.html?id=1324c4e0c86a40e9b7529e91c6bdf220' rel='nofollow ugc noopener noreferrer'>Bioclimate 16&nbsp;&nbsp;Precipitation Of Wettest Quarter</a><br /><a target='_blank' href='https://arcgis.com/home/item.html?id=86fe2a87fe9144f9a5c330a3b5890df0' rel='nofollow ugc noopener noreferrer'>Bioclimate 17&nbsp;&nbsp;Precipitation Of Driest Quarter</a><br /><a target='_blank' href='https://arcgis.com/home/item.html?id=eb8227050ac24b3bb4a47abb924fbc56' rel='nofollow ugc noopener noreferrer'>Bioclimate 18&nbsp;&nbsp;Precipitation Of Warmest Quarter</a><br /><a target='_blank' href='https://arcgis.com/home/item.html?id=ec067623611d40d086193b21a3a4fce1' rel='nofollow ugc noopener noreferrer'>Bioclimate 19&nbsp;&nbsp;Precipitation Of Coldest Quarter</a><br /><a target='_blank' href='https://arcgis.com/home/item.html?id=e56c9cb70aa949adb791c4311003d9ae' rel='nofollow ugc noopener noreferrer'>Bioclimate Baseline 1970-2000</a></p></div>",
			"keyword": [
				"esri_environment",
				"retiring-2026-12"
			],
			"issued": "2022-05-12T14:43:33.000Z",
			"modified": "2025-08-30T23:15:57.000Z",
			"publisher": {
				"name": "Esri"
			},
			"contactPoint": {
				"@type": "vcard:Contact",
				"fn": "esri_environment",
				"hasEmail": "{{orgContactEmail}}"
			},
			"accessLevel": "public",
			"spatial": "-180.0000,-90.0000,180.0000,90.0000",
			"license": "<p><img src='https://downloads.esri.com/blogs/arcgisonline/esrilogo_new.png' width='113' height='43' /> This work is licensed under the Esri Master License Agreement.&nbsp;</p><p><a target='_blank' href='https://goto.arcgis.com/termsofuse/viewsummary' rel='nofollow ugc noopener noreferrer'>View Summary</a> | <a target='_blank' href='https://goto.arcgis.com/termsofuse/viewtermsofuse' rel='nofollow ugc noopener noreferrer'>View Terms of Use</a></p>",
			"distribution": [
				{
					"@type": "dcat:Distribution",
					"title": "ArcGIS Hub Dataset",
					"format": "Web Page",
					"mediaType": "text/html",
					"accessURL": "https://www.pacificgeoportal.com/content/esri::bioclimate-projections-16-precipitation-of-wettest-quarter"
				},
				{
					"@type": "dcat:Distribution",
					"title": "ArcGIS GeoService",
					"format": "ArcGIS GeoServices REST API",
					"mediaType": "application/json",
					"accessURL": "https://tiledimageservices.arcgis.com/P3ePLMYs2RVChkJx/arcgis/rest/services/Bioclimate_Projections__Precipitation_of_Wettest_Quarter/ImageServer"
				}
			],
			"theme": [
				"geospatial"
			]
		},
		{
			"@type": "dcat:Dataset",
			"identifier": "https://www.arcgis.com/home/item.html?id=fae788aa91e54244b161b59725dcbb2a",
			"landingPage": "https://www.pacificgeoportal.com/maps/esri::openstreetmap-2",
			"title": "OpenStreetMap",
			"description": "<div><div style='margin-bottom:3.1rem;'><div style='display:inherit; max-width:100%;'><p style='margin-bottom:1.55rem; margin-top:0px;'><span style='color:#b22222;'><font style='font-family:&quot;Avenir Next W01&quot;, &quot;Avenir Next W00&quot;, &quot;Avenir Next&quot;, Avenir, &quot;Helvetica Neue&quot;, sans-serif; font-size:16px;'><strong>Mature Support Notice:</strong></font></span><span style='color:#dc143c;'><font style='font-family:&quot;Avenir Next W01&quot;, &quot;Avenir Next W00&quot;, &quot;Avenir Next&quot;, Avenir, &quot;Helvetica Neue&quot;, sans-serif; font-size:16px;'><strong>&nbsp;</strong></font></span><span style='font-family:&quot;Avenir Next W01&quot;, &quot;Avenir Next W00&quot;, &quot;Avenir Next&quot;, Avenir, &quot;Helvetica Neue&quot;, sans-serif; font-size:16px;'><strong>This item is in&nbsp;</strong></span><a style='color:rgb(0, 97, 155); font-family:&quot;Avenir Next W01&quot;, &quot;Avenir Next W00&quot;, &quot;Avenir Next&quot;, Avenir, &quot;Helvetica Neue&quot;, sans-serif; font-size:16px; text-decoration-line:none;' target='_blank' href='https://goto.arcgis.com/lifecycle/content' rel='nofollow ugc noopener noreferrer'><strong>mature support</strong></a><span style='font-family:&quot;Avenir Next W01&quot;, &quot;Avenir Next W00&quot;, &quot;Avenir Next&quot;, Avenir, &quot;Helvetica Neue&quot;, sans-serif; font-size:16px;'><strong>&nbsp;as of December 2024. </strong></span><span style='background-color:rgb(255,255,255); color:rgb(74,74,74); font-family:&quot;Avenir Next W01&quot;, &quot;Avenir Next W00&quot;, &quot;Avenir Next&quot;, Avenir, &quot;Helvetica Neue&quot;, sans-serif; font-size:16px;'><span style='border:0px solid currentcolor; box-sizing:border-box; font-style:normal; font-variant-caps:normal; font-variant-ligatures:normal; font-weight:400; letter-spacing:normal; line-height:1.5; text-align:start; text-decoration-color:initial; text-decoration-style:initial; text-indent:0px; text-transform:none; word-spacing:0px;'><strong>A&nbsp;</strong></span></span><a style='background-color:rgb(255, 255, 255); border:0px solid currentcolor; box-sizing:border-box; color:rgb(0, 97, 155); font-family:&quot;Avenir Next&quot;, Avenir, &quot;Helvetica Neue&quot;, sans-serif; font-size:16px; font-style:normal; font-variant-caps:normal; font-variant-ligatures:normal; font-weight:400; letter-spacing:normal; line-height:1.5; text-align:start; text-decoration:none; text-indent:0px; text-transform:none; word-spacing:0px;' target='_blank' href='https://www.arcgis.com/home/item.html?id=afa007556f2e4d66831d1e9b693e023e' rel='nofollow ugc noopener noreferrer'><strong>new version of this item</strong></a><span style='background-color:rgb(255,255,255); color:rgb(74,74,74); font-family:&quot;Avenir Next W01&quot;, &quot;Avenir Next W00&quot;, &quot;Avenir Next&quot;, Avenir, &quot;Helvetica Neue&quot;, sans-serif; font-size:16px;'><span style='border:0px solid currentcolor; box-sizing:border-box; font-style:normal; font-variant-caps:normal; font-variant-ligatures:normal; font-weight:400; letter-spacing:normal; line-height:1.5; text-align:start; text-decoration-color:initial; text-decoration-style:initial; text-indent:0px; text-transform:none; word-spacing:0px;'><strong>&nbsp;is available for your use. </strong>Esri recommends updating your maps and apps to use the new version. </span></span><span style='font-family:&quot;Avenir Next W01&quot;, &quot;Avenir Next W00&quot;, &quot;Avenir Next&quot;, Avenir, &quot;Helvetica Neue&quot;, sans-serif; font-size:16px;'>See&nbsp;</span><a style='color:rgb(0, 97, 155); font-family:&quot;Avenir Next W01&quot;, &quot;Avenir Next W00&quot;, &quot;Avenir Next&quot;, Avenir, &quot;Helvetica Neue&quot;, sans-serif; font-size:16px; text-decoration-line:none;' target='_blank' href='https://goto.arcgis.com/blogs/osmmaturesupport' rel='nofollow ugc noopener noreferrer'>blog</a><span style='font-family:inherit; font-size:14px;'>&nbsp;</span><span style='font-family:&quot;Avenir Next W01&quot;, &quot;Avenir Next W00&quot;, &quot;Avenir Next&quot;, Avenir, &quot;Helvetica Neue&quot;, sans-serif; font-size:16px;'>for more information.</span></p><p style='margin-bottom:0px; margin-top:10px; padding:0px;'>This world basemap presents OpenStreetMap (OSM) data hosted by Esri. This version of the map is rendered using OSM cartography.&nbsp;<span style='font-family:&quot;Avenir Next W01&quot;, &quot;Avenir Next W00&quot;, &quot;Avenir Next&quot;, Avenir, &quot;Helvetica Neue&quot;, sans-serif; font-size:16px;'>Created from the&nbsp;</span><a style='color:rgb(0, 97, 155); font-family:inherit; font-size:16px; text-decoration-line:none;' target='_blank' href='https://daylightmap.org/2024/05/03/sunsetting-daylight.html' rel='nofollow ugc noopener noreferrer'>sunsetted Daylight map distribution</a><span style='font-family:&quot;Avenir Next W01&quot;, &quot;Avenir Next W00&quot;, &quot;Avenir Next&quot;, Avenir, &quot;Helvetica Neue&quot;, sans-serif; font-size:16px;'>, data updates supporting this layer are no longer available.</span></p><div style='font-family:inherit; font-size:16px;'><div style='font-family:inherit;'>&nbsp;</div><div style='font-family:inherit;'>OpenStreetMap is an open collaborative project to create a free editable map of the world. Volunteers gather location data using GPS, local knowledge, and other free sources of information and upload it. The resulting free map can be viewed and downloaded from the OpenStreetMap site: www.OpenStreetMap.org. Esri is a supporter of the OSM project.&nbsp;</div></div></div></div></div><div style='display:inherit; font-family:&quot;Avenir Next W01&quot;, &quot;Avenir Next W00&quot;, &quot;Avenir Next&quot;, Avenir, &quot;Helvetica Neue&quot;, sans-serif; font-size:17px; margin-bottom:3.1rem;'><div style='display:inherit;'>&nbsp;</div></div>",
			"keyword": [
				"basemap",
				"OpenStreetMap",
				"OSM",
				"osmOpenstreetmap",
				"wma",
				"vector"
			],
			"issued": "2018-06-21T23:52:23.000Z",
			"modified": "2025-08-29T10:21:08.000Z",
			"publisher": {
				"name": "Esri"
			},
			"contactPoint": {
				"@type": "vcard:Contact",
				"fn": "esri_vector",
				"hasEmail": "{{orgContactEmail}}"
			},
			"accessLevel": "public",
			"spatial": "-0.1732,51.4957,-0.1098,51.5180",
			"license": "<p><img style='font-family:&quot;Avenir Next W01&quot;, &quot;Avenir Next W00&quot;, &quot;Avenir Next&quot;, Avenir, &quot;Helvetica Neue&quot;, sans-serif; font-size:16px; height:auto; max-width:100%;' src='https://downloads.esri.com/blogs/arcgisonline/esrilogo_new.png' /><span style='font-family:&quot;Avenir Next W01&quot;, &quot;Avenir Next W00&quot;, &quot;Avenir Next&quot;, Avenir, &quot;Helvetica Neue&quot;, sans-serif; font-size:16px;'> This work is licensed under the Esri Master License Agreement.</span><br /><br /><a style='color:rgb(0, 121, 193); text-decoration-line:none;' target='_blank' href='https://goto.arcgis.com/termsofuse/viewsummary' rel='nofollow ugc noopener noreferrer'><strong>View Summary</strong></a><strong>&nbsp;|&nbsp;</strong><a style='color:rgb(0, 121, 193); text-decoration-line:none;' target='_blank' href='https://goto.arcgis.com/termsofuse/viewtermsofuse' rel='nofollow ugc noopener noreferrer'><strong>View Terms of Use</strong></a></p>",
			"distribution": [
				{
					"@type": "dcat:Distribution",
					"title": "ArcGIS Hub Dataset",
					"format": "Web Page",
					"mediaType": "text/html",
					"accessURL": "https://www.pacificgeoportal.com/maps/esri::openstreetmap-2"
				}
			],
			"theme": [
				"geospatial"
			]
		},
		{
			"@type": "dcat:Dataset",
			"identifier": "https://www.arcgis.com/home/item.html?id=f240fe360b434afc87dd989bf0c0b825",
			"landingPage": "https://www.pacificgeoportal.com/maps/esri::openstreetmap-hybrid-reference",
			"title": "OpenStreetMap Hybrid Reference",
			"description": "<div><p style='margin-bottom:1.55rem; margin-top:0px;'><span style='color:#b22222;'><font style='font-family:&quot;Avenir Next W01&quot;, &quot;Avenir Next W00&quot;, &quot;Avenir Next&quot;, Avenir, &quot;Helvetica Neue&quot;, sans-serif; font-size:16px;'><strong>Mature Support Notice:&nbsp;</strong></font></span><strong>This item is in&nbsp;</strong><a style='color:rgb(0, 97, 155); font-family:&quot;Avenir Next W01&quot;, &quot;Avenir Next W00&quot;, &quot;Avenir Next&quot;, Avenir, &quot;Helvetica Neue&quot;, sans-serif; font-size:16px; text-decoration-line:none;' target='_blank' href='https://goto.arcgis.com/lifecycle/content' rel='nofollow ugc noopener noreferrer'><strong>mature support</strong></a><strong>&nbsp;as of December 2024. A&nbsp;</strong><a style='background-color:rgb(255, 255, 255); border:0px solid currentcolor; box-sizing:border-box; color:rgb(0, 97, 155); font-family:&quot;Avenir Next&quot;, Avenir, &quot;Helvetica Neue&quot;, sans-serif; font-size:16px; font-style:normal; font-variant-caps:normal; font-variant-ligatures:normal; font-weight:400; letter-spacing:normal; line-height:1.5; text-align:start; text-decoration:none; text-indent:0px; text-transform:none; word-spacing:0px;' target='_blank' href='https://www.arcgis.com/home/item.html?id=0769f07cc0c3453faec703e77dbb3459' rel='nofollow ugc noopener noreferrer'><strong>new version of this item</strong></a><strong>&nbsp;is available for your use. </strong>Esri recommends updating your maps and apps to use the new version. <span style='font-family:&quot;Avenir Next W01&quot;, &quot;Avenir Next W00&quot;, &quot;Avenir Next&quot;, Avenir, &quot;Helvetica Neue&quot;, sans-serif; font-size:16px;'>See&nbsp;</span><a style='color:rgb(0, 97, 155); font-family:&quot;Avenir Next W01&quot;, &quot;Avenir Next W00&quot;, &quot;Avenir Next&quot;, Avenir, &quot;Helvetica Neue&quot;, sans-serif; font-size:16px; text-decoration-line:none;' target='_blank' href='https://goto.arcgis.com/blogs/osmmaturesupport' rel='nofollow ugc noopener noreferrer'>blog</a><span style='font-family:inherit; font-size:14px;'>&nbsp;</span><span style='font-family:&quot;Avenir Next W01&quot;, &quot;Avenir Next W00&quot;, &quot;Avenir Next&quot;, Avenir, &quot;Helvetica Neue&quot;, sans-serif; font-size:16px;'>for more information.</span></p></div><div><p>This tile layer presents a vector basemap of OpenStreetMap (OSM) data hosted by Esri. It provides a reference&nbsp;layer featuring map labels, boundary lines, and roads. This layer is designed to be overlaid on imagery.&nbsp;<span style='font-family:&quot;Avenir Next W01&quot;, &quot;Avenir Next W00&quot;, &quot;Avenir Next&quot;, Avenir, &quot;Helvetica Neue&quot;, sans-serif; font-size:16px;'>&nbsp;Created from the&nbsp;</span><a style='color:rgb(0, 97, 155); font-family:inherit; font-size:16px; text-decoration-line:none;' target='_blank' href='https://daylightmap.org/2024/05/03/sunsetting-daylight.html' rel='nofollow ugc noopener noreferrer'>sunsetted Daylight map distribution</a><span style='font-family:&quot;Avenir Next W01&quot;, &quot;Avenir Next W00&quot;, &quot;Avenir Next&quot;, Avenir, &quot;Helvetica Neue&quot;, sans-serif; font-size:16px;'>, data updates supporting this layer are no longer available.</span></p><div style='font-family:inherit; font-size:16px;'><div style='font-family:inherit;'>OpenStreetMap is an open collaborative project to create a free editable map of the world. Volunteers gather location data using GPS, local knowledge, and other free sources of information and upload it. The resulting free map can be viewed and downloaded from the OpenStreetMap site: www.OpenStreetMap.org. Esri is a supporter of the OSM project.</div></div></div>",
			"keyword": [
				"basemap",
				"OpenStreetMap",
				"OSM",
				"Hybrid Reference",
				"osmHybrid",
				"wma",
				"vector"
			],
			"issued": "2019-05-20T16:23:34.000Z",
			"modified": "2025-08-29T10:13:12.000Z",
			"publisher": {
				"name": "Esri"
			},
			"contactPoint": {
				"@type": "vcard:Contact",
				"fn": "esri_vector",
				"hasEmail": "{{orgContactEmail}}"
			},
			"accessLevel": "public",
			"spatial": "-140.0000,-60.0000,140.0000,60.0000",
			"license": "<p><img style='font-family:&quot;Avenir Next W01&quot;, &quot;Avenir Next W00&quot;, &quot;Avenir Next&quot;, Avenir, &quot;Helvetica Neue&quot;, sans-serif; font-size:16px; height:auto; max-width:100%;' src='https://downloads.esri.com/blogs/arcgisonline/esrilogo_new.png' width='113' height='43' /><span style='font-family:&quot;Avenir Next W01&quot;, &quot;Avenir Next W00&quot;, &quot;Avenir Next&quot;, Avenir, &quot;Helvetica Neue&quot;, sans-serif; font-size:16px;'> This work is licensed under the Esri Master License Agreement.</span></p><div style='font-family:&quot;Avenir Next W01&quot;, &quot;Avenir Next W00&quot;, &quot;Avenir Next&quot;, Avenir, &quot;Helvetica Neue&quot;, sans-serif; font-size:16px;'><a style='color:rgb(0, 121, 193); text-decoration-line:none;' target='_blank' href='https://goto.arcgis.com/termsofuse/viewsummary' rel='nofollow ugc noopener noreferrer'><strong>View Summary</strong></a><strong>&nbsp;|&nbsp;</strong><a style='color:rgb(0, 121, 193); text-decoration-line:none;' target='_blank' href='https://goto.arcgis.com/termsofuse/viewtermsofuse' rel='nofollow ugc noopener noreferrer'><strong>View Terms of Use</strong></a></div>",
			"distribution": [
				{
					"@type": "dcat:Distribution",
					"title": "ArcGIS Hub Dataset",
					"format": "Web Page",
					"mediaType": "text/html",
					"accessURL": "https://www.pacificgeoportal.com/maps/esri::openstreetmap-hybrid-reference"
				},
				{
					"@type": "dcat:Distribution",
					"title": "ArcGIS GeoService",
					"format": "ArcGIS GeoServices REST API",
					"mediaType": "application/json",
					"accessURL": "https://basemaps.arcgis.com/arcgis/rest/services/OpenStreetMap_v2/VectorTileServer"
				}
			],
			"theme": [
				"geospatial"
			]
		},
		{
			"@type": "dcat:Dataset",
			"identifier": "https://www.arcgis.com/home/item.html?id=667de8a61b50499f96ae11c3fb7aa6ff",
			"landingPage": "https://www.pacificgeoportal.com/maps/esri::openstreetmap-imagery-hybrid-wgs84",
			"title": "OpenStreetMap (Imagery Hybrid - WGS84)",
			"description": "<p style='margin-bottom:1.55rem; margin-top:0px;'><span style='color:#b22222;'><font style='font-family:&quot;Avenir Next W01&quot;, &quot;Avenir Next W00&quot;, &quot;Avenir Next&quot;, Avenir, &quot;Helvetica Neue&quot;, sans-serif; font-size:16px;'><strong>Mature Support Notice:&nbsp;</strong></font></span><span style='font-family:&quot;Avenir Next W01&quot;, &quot;Avenir Next W00&quot;, &quot;Avenir Next&quot;, Avenir, &quot;Helvetica Neue&quot;, sans-serif; font-size:16px;'><strong>This item is in&nbsp;</strong></span><a style='color:rgb(0, 97, 155); font-family:&quot;Avenir Next W01&quot;, &quot;Avenir Next W00&quot;, &quot;Avenir Next&quot;, Avenir, &quot;Helvetica Neue&quot;, sans-serif; font-size:16px; text-decoration-line:none;' target='_blank' href='https://goto.arcgis.com/lifecycle/content' rel='nofollow ugc noopener noreferrer'><strong>mature support</strong></a><span style='font-family:&quot;Avenir Next W01&quot;, &quot;Avenir Next W00&quot;, &quot;Avenir Next&quot;, Avenir, &quot;Helvetica Neue&quot;, sans-serif; font-size:16px;'><strong>&nbsp;as of December 2024. </strong></span><span style='background-color:rgb(255,255,255); color:rgb(74,74,74); font-family:&quot;Avenir Next W01&quot;, &quot;Avenir Next W00&quot;, &quot;Avenir Next&quot;, Avenir, &quot;Helvetica Neue&quot;, sans-serif; font-size:16px;'><span style='border:0px solid currentcolor; box-sizing:border-box; font-style:normal; font-variant-caps:normal; font-variant-ligatures:normal; font-weight:400; letter-spacing:normal; line-height:1.5; text-align:start; text-decoration-color:initial; text-decoration-style:initial; text-indent:0px; text-transform:none; word-spacing:0px;'><strong>A&nbsp;</strong></span></span><a style='background-color:rgb(255, 255, 255); border:0px solid currentcolor; box-sizing:border-box; color:rgb(0, 97, 155); font-family:&quot;Avenir Next&quot;, Avenir, &quot;Helvetica Neue&quot;, sans-serif; font-size:16px; font-style:normal; font-variant-caps:normal; font-variant-ligatures:normal; font-weight:400; letter-spacing:normal; line-height:1.5; text-align:start; text-decoration:none; text-indent:0px; text-transform:none; word-spacing:0px;' target='_blank' href='https://www.arcgis.com/home/item.html?id=cc75b9f3afdd403b8d8a9de3469b9062' rel='nofollow ugc noopener noreferrer'><strong>new version of this item</strong></a><span style='background-color:rgb(255,255,255); color:rgb(74,74,74); font-family:&quot;Avenir Next W01&quot;, &quot;Avenir Next W00&quot;, &quot;Avenir Next&quot;, Avenir, &quot;Helvetica Neue&quot;, sans-serif; font-size:16px;'><span style='border:0px solid currentcolor; box-sizing:border-box; font-style:normal; font-variant-caps:normal; font-variant-ligatures:normal; font-weight:400; letter-spacing:normal; line-height:1.5; text-align:start; text-decoration-color:initial; text-decoration-style:initial; text-indent:0px; text-transform:none; word-spacing:0px;'><strong>&nbsp;is available for your use. </strong>Esri recommends updating your maps and apps to use the new version.&nbsp;</span></span><span style='font-family:&quot;Avenir Next W01&quot;, &quot;Avenir Next W00&quot;, &quot;Avenir Next&quot;, Avenir, &quot;Helvetica Neue&quot;, sans-serif; font-size:16px;'>See&nbsp;</span><a style='color:rgb(0, 97, 155); font-family:&quot;Avenir Next W01&quot;, &quot;Avenir Next W00&quot;, &quot;Avenir Next&quot;, Avenir, &quot;Helvetica Neue&quot;, sans-serif; font-size:16px; text-decoration-line:none;' target='_blank' href='https://goto.arcgis.com/blogs/osmmaturesupport' rel='nofollow ugc noopener noreferrer'>blog</a><span style='font-family:inherit; font-size:14px;'>&nbsp;</span><span style='font-family:&quot;Avenir Next W01&quot;, &quot;Avenir Next W00&quot;, &quot;Avenir Next&quot;, Avenir, &quot;Helvetica Neue&quot;, sans-serif; font-size:16px;'>for more information.</span></p><p style='margin-bottom:1.55rem; margin-top:0px;'>This web map presents a vector basemap of OpenStreetMap (OSM) data hosted by Esri. It provides a reference&nbsp;layer featuring map labels, boundary lines, and roads and includes imagery.&nbsp;Created from the&nbsp;<a style='color:rgb(0, 97, 155); font-family:inherit; font-size:16px; text-decoration-line:none;' target='_blank' href='https://daylightmap.org/2024/05/03/sunsetting-daylight.html' rel='nofollow ugc noopener noreferrer'>sunsetted Daylight map distribution</a>, data updates supporting this layer are no longer available.</p><div style='font-family:inherit; font-size:16px;'><div style='font-family:inherit;'>OpenStreetMap is an open collaborative project to create a free editable map of the world. Volunteers gather location data using GPS, local knowledge, and other free sources of information and upload it. The resulting free map can be viewed and downloaded from the OpenStreetMap site: www.OpenStreetMap.org. Esri is a supporter of the OSM project.&nbsp;</div><div style='font-family:inherit;'>&nbsp;</div><div style='font-family:inherit;'><strong>Precise Tile Registration:</strong>&nbsp;The web map uses the improved tiling scheme “WGS84 Geographic, Version 2” to ensure proper tile positioning at higher resolutions (neighborhood level and beyond). The new tiling scheme is much more precise than tiling schemes of the legacy basemaps Esri released years ago. We recommend that you start using this new basemap for any new web maps in WGS84 that you plan to author. &nbsp; Due to the number of differences between the old and new tiling schemes, some web clients will not be able to overlay tile layers in the old and new tiling schemes in one web map.</div></div>",
			"keyword": [
				"basemap",
				"OpenStreetMap",
				"OSM",
				"Hybrid Reference",
				"Imagery",
				"osmHybrid",
				"esriImagery",
				"gcs",
				"vector",
				"WGS84"
			],
			"issued": "2019-06-21T17:39:56.000Z",
			"modified": "2025-08-29T10:10:31.000Z",
			"publisher": {
				"name": "Esri"
			},
			"contactPoint": {
				"@type": "vcard:Contact",
				"fn": "esri",
				"hasEmail": "{{orgContactEmail}}"
			},
			"accessLevel": "public",
			"spatial": "-132.8749,-66.9957,98.9806,75.2992",
			"license": "<p><img style='font-family:&quot;Avenir Next W01&quot;, &quot;Avenir Next W00&quot;, &quot;Avenir Next&quot;, Avenir, &quot;Helvetica Neue&quot;, sans-serif; font-size:16px; height:auto; max-width:100%;' src='https://downloads.esri.com/blogs/arcgisonline/esrilogo_new.png' width='113' height='43' /><span style='font-family:&quot;Avenir Next W01&quot;, &quot;Avenir Next W00&quot;, &quot;Avenir Next&quot;, Avenir, &quot;Helvetica Neue&quot;, sans-serif; font-size:16px;'> This work is licensed under the Esri Master License Agreement.</span></p><div style='font-family:&quot;Avenir Next W01&quot;, &quot;Avenir Next W00&quot;, &quot;Avenir Next&quot;, Avenir, &quot;Helvetica Neue&quot;, sans-serif; font-size:16px;'><a style='color:rgb(0, 121, 193); text-decoration-line:none;' target='_blank' href='https://goto.arcgis.com/termsofuse/viewsummary' rel='nofollow ugc noopener noreferrer'><strong>View Summary</strong></a><strong>&nbsp;|&nbsp;</strong><a style='color:rgb(0, 121, 193); text-decoration-line:none;' target='_blank' href='https://goto.arcgis.com/termsofuse/viewtermsofuse' rel='nofollow ugc noopener noreferrer'><strong>View Terms of Use</strong></a></div>",
			"distribution": [
				{
					"@type": "dcat:Distribution",
					"title": "ArcGIS Hub Dataset",
					"format": "Web Page",
					"mediaType": "text/html",
					"accessURL": "https://www.pacificgeoportal.com/maps/esri::openstreetmap-imagery-hybrid-wgs84"
				}
			],
			"theme": [
				"geospatial"
			]
		},
		{
			"@type": "dcat:Dataset",
			"identifier": "https://www.arcgis.com/home/item.html?id=2152397b2b414e6bae096eef297eedd3",
			"landingPage": "https://www.pacificgeoportal.com/maps/esri::openstreetmap-streets-wgs84-1",
			"title": "OpenStreetMap (Streets - WGS84)",
			"description": "<div><span style='color:#b22222;'><font style='font-family:&quot;Avenir Next W01&quot;, &quot;Avenir Next W00&quot;, &quot;Avenir Next&quot;, Avenir, &quot;Helvetica Neue&quot;, sans-serif; font-size:16px;'><strong>Mature Support Notice:&nbsp;</strong></font></span><span style='font-family:&quot;Avenir Next W01&quot;, &quot;Avenir Next W00&quot;, &quot;Avenir Next&quot;, Avenir, &quot;Helvetica Neue&quot;, sans-serif; font-size:16px;'><strong>This item is in&nbsp;</strong></span><a style='color:rgb(0, 97, 155); font-family:&quot;Avenir Next W01&quot;, &quot;Avenir Next W00&quot;, &quot;Avenir Next&quot;, Avenir, &quot;Helvetica Neue&quot;, sans-serif; font-size:16px; text-decoration-line:none;' target='_blank' href='https://goto.arcgis.com/lifecycle/content' rel='nofollow ugc noopener noreferrer'><strong>mature support</strong></a><span style='font-family:&quot;Avenir Next W01&quot;, &quot;Avenir Next W00&quot;, &quot;Avenir Next&quot;, Avenir, &quot;Helvetica Neue&quot;, sans-serif; font-size:16px;'><strong>&nbsp;as of December 2024. </strong></span><span style='background-color:rgb(255,255,255); color:rgb(74,74,74); font-family:&quot;Avenir Next W01&quot;, &quot;Avenir Next W00&quot;, &quot;Avenir Next&quot;, Avenir, &quot;Helvetica Neue&quot;, sans-serif; font-size:16px;'><span style='border:0px solid currentcolor; box-sizing:border-box; font-style:normal; font-variant-caps:normal; font-variant-ligatures:normal; font-weight:400; letter-spacing:normal; line-height:1.5; text-align:start; text-decoration-color:initial; text-decoration-style:initial; text-indent:0px; text-transform:none; word-spacing:0px;'><strong>A&nbsp;</strong></span></span><a style='background-color:rgb(255, 255, 255); border:0px solid currentcolor; box-sizing:border-box; color:rgb(0, 97, 155); font-family:&quot;Avenir Next&quot;, Avenir, &quot;Helvetica Neue&quot;, sans-serif; font-size:16px; font-style:normal; font-variant-caps:normal; font-variant-ligatures:normal; font-weight:400; letter-spacing:normal; line-height:1.5; text-align:start; text-decoration:none; text-indent:0px; text-transform:none; word-spacing:0px;' target='_blank' href='https://www.arcgis.com/home/item.html?id=4f7925196e604445965b3ad61aa34765' rel='nofollow ugc noopener noreferrer'><strong>new version of this item</strong></a><span style='background-color:rgb(255,255,255); color:rgb(74,74,74); font-family:&quot;Avenir Next W01&quot;, &quot;Avenir Next W00&quot;, &quot;Avenir Next&quot;, Avenir, &quot;Helvetica Neue&quot;, sans-serif; font-size:16px;'><span style='border:0px solid currentcolor; box-sizing:border-box; font-style:normal; font-variant-caps:normal; font-variant-ligatures:normal; font-weight:400; letter-spacing:normal; line-height:1.5; text-align:start; text-decoration-color:initial; text-decoration-style:initial; text-indent:0px; text-transform:none; word-spacing:0px;'><strong>&nbsp;is available for your use. </strong>Esri recommends updating your maps and apps to use the new version.&nbsp;</span></span><span style='font-family:&quot;Avenir Next W01&quot;, &quot;Avenir Next W00&quot;, &quot;Avenir Next&quot;, Avenir, &quot;Helvetica Neue&quot;, sans-serif; font-size:16px;'>See&nbsp;</span><a style='color:rgb(0, 97, 155); font-family:&quot;Avenir Next W01&quot;, &quot;Avenir Next W00&quot;, &quot;Avenir Next&quot;, Avenir, &quot;Helvetica Neue&quot;, sans-serif; font-size:16px; text-decoration-line:none;' target='_blank' href='https://goto.arcgis.com/blogs/osmmaturesupport' rel='nofollow ugc noopener noreferrer'>blog</a><span style='font-family:inherit; font-size:14px;'>&nbsp;</span><span style='font-family:&quot;Avenir Next W01&quot;, &quot;Avenir Next W00&quot;, &quot;Avenir Next&quot;, Avenir, &quot;Helvetica Neue&quot;, sans-serif; font-size:16px;'>for more information.</span></div><div><br /><span style='font-family:&quot;Avenir Next W01&quot;, &quot;Avenir Next W00&quot;, &quot;Avenir Next&quot;, Avenir, &quot;Helvetica Neue&quot;, sans-serif; font-size:16px;'>This web map presents a vector basemap of OpenStreetMap (OSM) data hosted by Esri. </span>This version of the map is rendered in a style similar to the Esri Street map.&nbsp;<span style='font-family:&quot;Avenir Next W01&quot;, &quot;Avenir Next W00&quot;, &quot;Avenir Next&quot;, Avenir, &quot;Helvetica Neue&quot;, sans-serif; font-size:16px;'>Created from the&nbsp;</span><a style='color:rgb(0, 97, 155); font-family:inherit; font-size:16px; text-decoration-line:none;' target='_blank' href='https://daylightmap.org/2024/05/03/sunsetting-daylight.html' rel='nofollow ugc noopener noreferrer'>sunsetted Daylight map distribution</a><span style='font-family:&quot;Avenir Next W01&quot;, &quot;Avenir Next W00&quot;, &quot;Avenir Next&quot;, Avenir, &quot;Helvetica Neue&quot;, sans-serif; font-size:16px;'>, data updates supporting this layer are no longer available.</span></div><div style='font-family:inherit; font-size:16px;'><div style='font-family:inherit;'><br />OpenStreetMap is an open collaborative project to create a free editable map of the world. Volunteers gather location data using GPS, local knowledge, and other free sources of information and upload it. The resulting free map can be viewed and downloaded from the OpenStreetMap site: www.OpenStreetMap.org. Esri is a supporter of the OSM project.&nbsp;</div></div><div><div><div>&nbsp;</div><div><strong>Precise Tile Registration:</strong> The web map uses the improved tiling scheme “WGS84 Geographic, Version 2” to ensure proper tile positioning at higher resolutions (neighborhood level and beyond). The new tiling scheme is much more precise than tiling schemes of the legacy basemaps Esri released years ago. We recommend that you start using this new basemap for any new web maps in WGS84 that you plan to author. Due to the number of differences between the old and new tiling schemes, some web clients will not be able to overlay tile layers in the old and new tiling schemes in one web map.</div></div></div>",
			"keyword": [
				"basemap",
				"OpenStreetMap",
				"OSM",
				"Streets",
				"osmStreets",
				"gcs",
				"vector",
				"roads",
				"transportation",
				"WGS84"
			],
			"issued": "2019-06-21T17:39:16.000Z",
			"modified": "2025-08-29T10:09:12.000Z",
			"publisher": {
				"name": "Esri"
			},
			"contactPoint": {
				"@type": "vcard:Contact",
				"fn": "esri",
				"hasEmail": "{{orgContactEmail}}"
			},
			"accessLevel": "public",
			"spatial": "-77.4544,37.5136,-77.3978,37.5483",
			"license": "<p><img style='font-family:&quot;Avenir Next W01&quot;, &quot;Avenir Next W00&quot;, &quot;Avenir Next&quot;, Avenir, &quot;Helvetica Neue&quot;, sans-serif; font-size:16px; height:auto; max-width:100%;' src='https://downloads.esri.com/blogs/arcgisonline/esrilogo_new.png' width='113' height='43' /><span style='font-family:&quot;Avenir Next W01&quot;, &quot;Avenir Next W00&quot;, &quot;Avenir Next&quot;, Avenir, &quot;Helvetica Neue&quot;, sans-serif; font-size:16px;'> This work is licensed under the Esri Master License Agreement.</span></p><div style='font-family:&quot;Avenir Next W01&quot;, &quot;Avenir Next W00&quot;, &quot;Avenir Next&quot;, Avenir, &quot;Helvetica Neue&quot;, sans-serif; font-size:16px;'><a style='color:rgb(0, 121, 193); text-decoration-line:none;' target='_blank' href='https://goto.arcgis.com/termsofuse/viewsummary' rel='nofollow ugc noopener noreferrer'><strong>View Summary</strong></a><strong>&nbsp;|&nbsp;</strong><a style='color:rgb(0, 121, 193); text-decoration-line:none;' target='_blank' href='https://goto.arcgis.com/termsofuse/viewtermsofuse' rel='nofollow ugc noopener noreferrer'><strong>View Terms of Use</strong></a></div>",
			"distribution": [
				{
					"@type": "dcat:Distribution",
					"title": "ArcGIS Hub Dataset",
					"format": "Web Page",
					"mediaType": "text/html",
					"accessURL": "https://www.pacificgeoportal.com/maps/esri::openstreetmap-streets-wgs84-1"
				}
			],
			"theme": [
				"geospatial"
			]
		},
		{
			"@type": "dcat:Dataset",
			"identifier": "https://www.arcgis.com/home/item.html?id=ca0470dbbddb4db28bad74ed39949e25",
			"landingPage": "https://www.pacificgeoportal.com/maps/esri::openstreetmap-3d-buildings",
			"title": "OpenStreetMap 3D Buildings",
			"description": "<div><p style='margin:0in 0in 1.5rem;'><span style='color:#b22222;'><font style='font-family:&quot;Avenir Next W01&quot;, &quot;Avenir Next W00&quot;, &quot;Avenir Next&quot;, Avenir, &quot;Helvetica Neue&quot;, sans-serif; font-size:16px;'><strong>Mature Support Notice:&nbsp;</strong></font></span><strong>This item is in&nbsp;</strong><a style='color:rgb(0, 97, 155); font-family:&quot;Avenir Next W01&quot;, &quot;Avenir Next W00&quot;, &quot;Avenir Next&quot;, Avenir, &quot;Helvetica Neue&quot;, sans-serif; font-size:16px; text-decoration-line:none;' target='_blank' href='https://goto.arcgis.com/lifecycle/content' rel='nofollow ugc noopener noreferrer'><strong>mature support</strong></a><strong>&nbsp;as of December 2024. A&nbsp;</strong><a style='background-color:rgb(255, 255, 255); border:0px solid currentcolor; box-sizing:border-box; color:rgb(0, 97, 155); font-family:&quot;Avenir Next&quot;, Avenir, &quot;Helvetica Neue&quot;, sans-serif; font-size:16px; font-style:normal; font-variant-caps:normal; font-variant-ligatures:normal; font-weight:400; letter-spacing:normal; line-height:1.5; text-align:start; text-decoration:none; text-indent:0px; text-transform:none; word-spacing:0px;' target='_blank' href='https://www.arcgis.com/home/item.html?id=c444b24b184c4523a5dc96248bfea4e1' rel='nofollow ugc noopener noreferrer'><strong>new version of this item</strong></a><strong>&nbsp;is available for your use. </strong>Esri recommends updating your maps and apps to use the new version. See&nbsp;<a target='_blank' href='https://goto.arcgis.com/blogs/osmmaturesupport' rel='nofollow ugc noopener noreferrer'>blog</a>&nbsp;for more information.</p></div><p style='margin:0in 0in 1.5rem;'>This 3D scene layer presents OpenStreetMap (OSM) buildings data hosted by Esri. Esri created&nbsp;<a target='_blank' href='https://esri.maps.arcgis.com/home/group.html?id=337346d491064d7aa7d455cfba5e6a44#overview' rel='nofollow ugc noopener noreferrer'>buildings and trees&nbsp;scene layers</a>&nbsp;from the OSM&nbsp;<a target='_blank' href='https://daylightmap.org/' rel='nofollow ugc noopener noreferrer'>Daylight map distribution</a>, which is supported by Facebook and others. The&nbsp;<a target='_blank' href='https://daylightmap.org/2024/05/03/sunsetting-daylight.html' rel='nofollow ugc noopener noreferrer'>Daylight map distribution has been&nbsp;sunsetted</a>&nbsp;and data updates supporting this layer are no longer available.&nbsp;</p><p style='margin:0in 0in 1.5rem;'>You can visit&nbsp;<a target='_blank' href='https://openstreetmap.maps.arcgis.com/' rel='nofollow ugc noopener noreferrer'>openstreetmap.maps.arcgis.com</a>&nbsp;to explore a collection of&nbsp;<strong>maps</strong>,&nbsp;<strong>scenes</strong>, and&nbsp;<strong>layers&nbsp;</strong>featuring OpenStreetMap data in ArcGIS. You can&nbsp;review the&nbsp;<a target='_blank' href='https://www.arcgis.com/home/item.html?id=cedc8a62b5a6438dbd480d2c584129ce' rel='nofollow ugc noopener noreferrer'>3D Scene Layers Documentation</a>&nbsp;to learn more about how the building and tree features in OSM are modeled and rendered in the 3D scene layers, and see tagging recommendations to get the best results.</p><p style='margin:0in 0in 1.5rem;'>OpenStreetMap is an open collaborative project to create a free editable map of the world. Volunteers gather location data using GPS, local knowledge, and other free sources of information and upload it. The resulting free map can be viewed and downloaded from the OpenStreetMap site:&nbsp;<a target='_blank' href='https://www.openstreetmap.org/' rel='nofollow ugc noopener noreferrer'>www.OpenStreetMap.org</a>. Esri is a supporter of the OSM project.</p><p style='margin:0in 0in 1.5rem;'>Note: This layer is supported in Scene Viewer and ArcGIS Pro 3.0 or higher.</p>",
			"keyword": [
				"baselayer3D",
				"OpenStreetMap",
				"OSM",
				"3D Buildings",
				"osm3dbuildings",
				"I3S"
			],
			"issued": "2022-06-03T19:33:22.000Z",
			"modified": "2025-08-29T09:12:25.000Z",
			"publisher": {
				"name": "Esri"
			},
			"contactPoint": {
				"@type": "vcard:Contact",
				"fn": "esri",
				"hasEmail": "{{orgContactEmail}}"
			},
			"accessLevel": "public",
			"spatial": "",
			"license": "<p><img style='font-family:&quot;Avenir Next W01&quot;, &quot;Avenir Next W00&quot;, &quot;Avenir Next&quot;, Avenir, &quot;Helvetica Neue&quot;, sans-serif; font-size:16px; height:auto; max-width:100%;' src='https://downloads.esri.com/blogs/arcgisonline/esrilogo_new.png' width='113' height='43' /><span style='font-family:&quot;Avenir Next W01&quot;, &quot;Avenir Next W00&quot;, &quot;Avenir Next&quot;, Avenir, &quot;Helvetica Neue&quot;, sans-serif; font-size:16px;'> This work is licensed under the Esri Master License Agreement.</span></p><div style='font-family:&quot;Avenir Next W01&quot;, &quot;Avenir Next W00&quot;, &quot;Avenir Next&quot;, Avenir, &quot;Helvetica Neue&quot;, sans-serif; font-size:16px;'><a style='color:rgb(0, 121, 193); text-decoration-line:none;' target='_blank' href='https://goto.arcgis.com/termsofuse/viewsummary' rel='nofollow ugc noopener noreferrer'><strong>View Summary</strong></a><strong>&nbsp;|&nbsp;</strong><a style='color:rgb(0, 121, 193); text-decoration-line:none;' target='_blank' href='https://goto.arcgis.com/termsofuse/viewtermsofuse' rel='nofollow ugc noopener noreferrer'><strong>View Terms of Use</strong></a></div>",
			"distribution": [
				{
					"@type": "dcat:Distribution",
					"title": "ArcGIS Hub Dataset",
					"format": "Web Page",
					"mediaType": "text/html",
					"accessURL": "https://www.pacificgeoportal.com/maps/esri::openstreetmap-3d-buildings"
				},
				{
					"@type": "dcat:Distribution",
					"title": "ArcGIS GeoService",
					"format": "ArcGIS GeoServices REST API",
					"mediaType": "application/json",
					"accessURL": "https://basemaps3d.arcgis.com/arcgis/rest/services/OpenStreetMap3D_Buildings_v1/SceneServer"
				}
			],
			"theme": ""
		},
		{
			"@type": "dcat:Dataset",
			"identifier": "https://www.arcgis.com/home/item.html?id=d6b18a2e774c4959ba855f6ac90952a2",
			"landingPage": "https://www.pacificgeoportal.com/apps/esri::openstreetmap-vector-basemap-1",
			"title": "OpenStreetMap Vector Basemap",
			"description": "<p style='font-family:&quot;Avenir Next W01&quot;, &quot;Avenir Next W00&quot;, &quot;Avenir Next&quot;, Avenir, &quot;Helvetica Neue&quot;, sans-serif; font-size:16px; margin-bottom:1.55rem; margin-top:0px;'><span style='color:#b22222;'><strong>Mature Support Notice: </strong></span><strong>This item is in&nbsp;</strong><a style='color:rgb(0, 97, 155); text-decoration-line:none;' target='_blank' href='https://goto.arcgis.com/lifecycle/content' rel='nofollow ugc noopener noreferrer'><strong>mature support</strong></a><strong>&nbsp;as of December 2024.</strong> See&nbsp;<a style='color:rgb(0, 97, 155); text-decoration-line:none;' target='_blank' href='https://goto.arcgis.com/blogs/osmmaturesupport' rel='nofollow ugc noopener noreferrer'>blog</a><span style='font-family:inherit; font-size:14px;'>&nbsp;</span>for more information.</p><p style='font-family:&quot;Avenir Next W01&quot;, &quot;Avenir Next W00&quot;, &quot;Avenir Next&quot;, Avenir, &quot;Helvetica Neue&quot;, sans-serif; font-size:16px; margin-bottom:1.55rem; margin-top:0px;'>This app features a vector basemap of OpenStreetMap (OSM) data hosted by Esri. Esri created this vector tile basemap from the&nbsp;<a style='color:rgb(0, 121, 193); font-family:inherit; text-decoration-line:none;' target='_blank' href='https://daylightmap.org/' rel='nofollow ugc noopener noreferrer'>Daylight map distribution</a>&nbsp;of OSM data, which is supported by&nbsp;<strong>Facebook&nbsp;</strong>and supplemented with additional data from&nbsp;<strong>Microsoft</strong>. This version of the map is rendered using OSM cartography.&nbsp;</p><div style='font-family:inherit; font-size:16px;'>OpenStreetMap is an open collaborative project to create a free editable map of the world. Volunteers gather location data using GPS, local knowledge, and other free sources of information and upload it. The resulting free map can be viewed and downloaded from the OpenStreetMap site:&nbsp;<a style='color:rgb(0, 121, 193); font-family:inherit; text-decoration-line:none;' target='_blank' href='https://www.openstreetmap.org/' rel='nofollow ugc noopener noreferrer'>www.OpenStreetMap.org</a>. Esri is a supporter of the OSM project and is excited to make this enhanced vector basemap available to the ArcGIS user and developer communities.</div>",
			"keyword": [
				"world",
				"Open Street Map",
				"OSM",
				"OpenStreetMap",
				"international",
				"road",
				"roads",
				"street",
				"streets",
				"wiki",
				"basemap",
				"current",
				"transportation",
				"partner_basemap",
				"vector",
				"vector tiles",
				"vector basemap",
				"Daylight",
				"Facebook",
				"Microsoft"
			],
			"issued": "2018-07-04T15:23:44.000Z",
			"modified": "2025-08-28T23:45:15.000Z",
			"publisher": {
				"name": "Esri"
			},
			"contactPoint": {
				"@type": "vcard:Contact",
				"fn": "esri_vector",
				"hasEmail": "{{orgContactEmail}}"
			},
			"accessLevel": "public",
			"spatial": "",
			"license": "<p><img style='font-family:&quot;Avenir Next W01&quot;, &quot;Avenir Next W00&quot;, &quot;Avenir Next&quot;, Avenir, &quot;Helvetica Neue&quot;, sans-serif; font-size:16px; height:auto; max-width:100%;' src='https://downloads.esri.com/blogs/arcgisonline/esrilogo_new.png' /><span style='font-family:&quot;Avenir Next W01&quot;, &quot;Avenir Next W00&quot;, &quot;Avenir Next&quot;, Avenir, &quot;Helvetica Neue&quot;, sans-serif; font-size:16px;'> This work is licensed under the Esri Master License Agreement.</span></p><p><a style='color:rgb(0, 121, 193); text-decoration-line:none;' target='_blank' href='https://goto.arcgis.com/termsofuse/viewsummary' rel='nofollow ugc noopener noreferrer'><strong>View Summary</strong></a><strong>&nbsp;|&nbsp;</strong><a style='color:rgb(0, 121, 193); text-decoration-line:none;' target='_blank' href='https://goto.arcgis.com/termsofuse/viewtermsofuse' rel='nofollow ugc noopener noreferrer'><strong>View Terms of Use</strong></a></p>",
			"distribution": [
				{
					"@type": "dcat:Distribution",
					"title": "ArcGIS Hub Dataset",
					"format": "Web Page",
					"mediaType": "text/html",
					"accessURL": "https://www.pacificgeoportal.com/apps/esri::openstreetmap-vector-basemap-1"
				},
				{
					"@type": "dcat:Distribution",
					"title": "ArcGIS GeoService",
					"format": "ArcGIS GeoServices REST API",
					"mediaType": "application/json",
					"accessURL": "https://esri.maps.arcgis.com/apps/View/index.html?appid=d6b18a2e774c4959ba855f6ac90952a2"
				}
			],
			"theme": ""
		},
		{
			"@type": "dcat:Dataset",
			"identifier": "https://www.arcgis.com/home/item.html?id=b8f4033069f141729ffb298b7418b653",
			"landingPage": "https://www.pacificgeoportal.com/maps/esri2::satellite-modis-thermal-hotspots-and-fire-activity",
			"title": "Satellite (MODIS) Thermal Hotspots and Fire Activity",
			"description": "<p>This layer presents detectable thermal activity from MODIS satellites for the last 7 days. <a target='_blank' href='https://earthdata.nasa.gov/earth-observation-data/near-real-time/firms/active-fire-data' rel='nofollow ugc noopener noreferrer'>MODIS Global Fires</a> is a product of NASA’s <a target='_blank' href='https://earthdata.nasa.gov/about' rel='nofollow ugc noopener noreferrer'>Earth Observing System Data and Information System</a> (EOSDIS), part of NASA's <a target='_blank' href='https://science.nasa.gov/earth-science/earth-data/' rel='nofollow ugc noopener noreferrer'>Earth Science Data</a>. EOSDIS integrates remote sensing and GIS technologies to deliver global MODIS hotspot/fire locations to natural resource managers and other stakeholders around the World.<br />&nbsp;</p><div>&nbsp;</div><div><div><p><strong>Consumption Best Practices:</strong></p><ul><li>As a service that is subject to very high usage, ensure peak performance and accessibility of your maps and apps by avoiding the use of non-cacheable relative Date/Time field filters. To accommodate filtering events by Date/Time, we suggest using the included \"Age\" fields that maintain the number of days or hours since a record was created or last modified, compared to the last service update. These queries fully support the ability to cache a response, allowing common query results to be efficiently provided to users in a high demand service environment.</li><li>When ingesting this service in your applications, avoid using <a target='_blank' href='https://en.wikipedia.org/wiki/POST_(HTTP)' rel='nofollow ugc noopener noreferrer'>POST</a> requests whenever possible. These requests can compromise performance and scalability during periods of high usage because they too are not cacheable.</li></ul></div></div><div><strong>Source: </strong>NASA <a target='_blank' href='https://firms.modaps.eosdis.nasa.gov/active_fire/#firms-shapefile' rel='nofollow ugc noopener noreferrer'>FIRMS - Active Fire Data - for World</a></div><p><br />&nbsp;</p><div><strong>Scale/Resolution: </strong>1km</div><p><br />&nbsp;</p><div><strong>Update Frequency: </strong>1/2 Hour (every 30 minutes) using the <a target='_blank' href='https://www.esriurl.com/LiveFeed' rel='nofollow ugc noopener noreferrer'>Aggregated Live Feed Methodology</a></div><p><br /><strong>Area Covered: </strong>World<br /><br /><span style='font-size:large;'>What can I do with this layer?</span><br />The MODIS thermal activity layer can be used to visualize and assess wildfires worldwide. However, it should be noted that this dataset contains many “false positives” (e.g., oil/natural gas wells or volcanoes) since the satellite will detect any large thermal signal.<br /><br />&nbsp;</p><div><span style='font-size:large;'>Additional Information</span></div><div>MODIS stands for <a target='_blank' href='https://earthdata.nasa.gov/earth-observation-data/near-real-time/download-nrt-data/modis-nrt' rel='nofollow ugc noopener noreferrer'>MODerate resolution Imaging Spectroradiometer</a>. The MODIS instrument is on board NASA’s Earth Observing System (EOS) <a target='_blank' href='https://terra.nasa.gov/' rel='nofollow ugc noopener noreferrer'>Terra (EOS AM)</a> and <a target='_blank' href='https://aqua.nasa.gov/' rel='nofollow ugc noopener noreferrer'>Aqua (EOS PM)</a> satellites. The orbit of the Terra satellite goes from north to south across the equator in the morning and Aqua passes south to north over the equator in the afternoon resulting in global coverage every 1 to 2 days. The EOS satellites have a ±55 degree scanning pattern and orbit at 705 km with a 2,330 km swath width.</div><p><br />It takes approximately 2 – 4 hours after satellite overpass for MODIS Rapid Response to process the data, and for the <a target='_blank' href='https://earthdata.nasa.gov/earth-observation-data/near-real-time/firms' rel='nofollow ugc noopener noreferrer'>Fire Information for Resource Management System</a> (FIRMS) to update the website. Occasionally, hardware errors can result in processing delays beyond the 2-4 hour range. Additional information on the MODIS system status can be found at <a target='_blank' href='https://earthdata.nasa.gov/earth-observation-data/near-real-time/rapid-response' rel='nofollow ugc noopener noreferrer'>MODIS Rapid Response</a>.<br /><br /><span style='font-size:large;'>Attribute Information</span><br />&nbsp;</p><ul><li><i>Latitude and Longitude</i>: The center point location of the 1km (approx.) pixel flagged as containing one or more fires/hotspots (fire size is not 1km, but variable). Stored by Point Geometry. See <a target='_blank' href='https://earthdata.nasa.gov/faq/firms-faq#ed-modis-fire-onground' rel='nofollow ugc noopener noreferrer'>What does a hotspot/fire detection mean on the ground?</a></li><li><a target='_blank' href='https://earthdata.nasa.gov/faq/firms-faq#ed-modis-brightness' rel='nofollow ugc noopener noreferrer'><i>Brightness</i></a>: The brightness temperature measured (in Kelvin) using the MODIS channels 21/22 and channel 31.</li><li><a target='_blank' href='https://earthdata.nasa.gov/faq/firms-faq#ed-modis-scan-track' rel='nofollow ugc noopener noreferrer'><i>Scan and Track</i></a>: The actual spatial resolution of the scanned pixel. Although the algorithm works at 1km resolution, the MODIS pixels get bigger toward the edge of the scan. See <a target='_blank' href='https://earthdata.nasa.gov/faq/firms-faq#ed-modis-scan-track' rel='nofollow ugc noopener noreferrer'>What does scan and track mean?</a></li><li><i>Date and Time</i>: Acquisition date of the hotspot/active fire pixel and time of satellite overpass in UTC (client presentation in local time). Stored by Acquisition Date.</li><li><i>Acquisition Date</i>: Derived Date/Time field combining Date and Time attributes.</li><li><a target='_blank' href='https://earthdata.nasa.gov/faq/firms-faq#ed-modis-missing' rel='nofollow ugc noopener noreferrer'><i>Satellite</i></a>: Whether the detection was picked up by the Terra or Aqua satellite.</li><li><a target='_blank' href='https://earthdata.nasa.gov/faq/firms-faq#ed-confidence' rel='nofollow ugc noopener noreferrer'><i>Confidence</i></a>: The detection confidence is a quality flag of the individual hotspot/active fire pixel.</li><li><i>Version</i>: Version refers to the processing collection and source of data. The number before the decimal refers to the <a target='_blank' href='https://earthdata.nasa.gov/faq/firms-faq#ed-modis-collections' rel='nofollow ugc noopener noreferrer'>collection</a> (e.g. MODIS <a target='_blank' href='https://www.earthdata.nasa.gov/s3fs-public/2023-09/MODIS_C6_C6.1_Fire_User_Guide_1.0.pdf' rel='nofollow ugc noopener noreferrer'>Collection 6</a>). The number after the decimal indicates the source of Level 1B data; data processed in near-real time by <a target='_blank' href='https://earthdata.nasa.gov/earth-observation-data/near-real-time/rapid-response' rel='nofollow ugc noopener noreferrer'>MODIS Rapid Response</a> will have the source code “CollectionNumber.0”. Data sourced from MODAPS (with a 2-month lag) and processed by FIRMS using the standard MOD14/MYD14 Thermal Anomalies algorithm will have a source code “CollectionNumber.x”. For example, data with the version listed as 5.0 is collection 5, processed by MRR, data with the version listed as 5.1 is collection 5 data processed by FIRMS using Level 1B data from MODAPS.</li><li><i>Bright.T31</i>: Channel 31 brightness temperature (in Kelvins) of the hotspot/active fire pixel.</li><li><i>FRP</i>: Fire Radiative Power. Depicts the pixel-integrated fire radiative power in MW (MegaWatts). FRP provides information on the measured radiant heat output of detected fires. The amount of radiant heat energy liberated per unit time (the Fire Radiative Power) is thought to be related to the rate at which fuel is being consumed (Wooster et. al. (2005)).</li><li><a target='_blank' href='https://www.earthdata.nasa.gov/faq/firms-faq#ed-nrt-standard' rel='nofollow ugc noopener noreferrer'><i>DayNight</i></a>: The standard processing algorithm uses the solar zenith angle (SZA) to threshold the day/night value; if the SZA exceeds 85 degrees it is assigned a night value. SZA values less than 85 degrees are assigned a day time value. For the NRT algorithm the day/night flag is assigned by ascending (day) vs descending (night) observation. It is expected that the NRT assignment of the day/night flag will be amended to be consistent with the standard processing.</li><li><i>Hours Old</i>: Derived field that provides age of record in hours between Acquisition date/time and latest update date/time. 0 = less than 1 hour ago, 1 = less than 2 hours ago, 2 = less than 3 hours ago, and so on.</li></ul><div><span style='font-size:x-large;'>Revisions</span></div><div><ul><li><strong>June 22, 2022</strong>: Added 'HOURS_OLD' field to enhance Filtering data. Added 'Last 7 days' Layer to extend data to match time range of <a target='_blank' href='https://www.arcgis.com/home/item.html?id=dece90af1a0242dcbf0ca36d30276aa3' rel='nofollow ugc noopener noreferrer'>VIIRS</a> offering. Added Field level descriptions.</li></ul></div><p><span style='background-color:rgb(255,255,255); color:rgb(128,128,128);'>This map is provided for informational purposes and is not monitored 24/7 for accuracy and currency.</span></p><div>&nbsp;</div><p>If you would like to be alerted to potential issues or simply see when this Service will update next, please visit our <a target='_blank' href='https://livingatlas.arcgis.com/livefeeds-status/' rel='nofollow ugc noopener noreferrer'>Live Feed Status</a> Page!</p>",
			"keyword": [
				"  Esri",
				"MODIS",
				"Esri",
				"FIRMS",
				"Hot spots",
				"Wildfire",
				"Live Feed",
				"Risk",
				"Earth Observations",
				"Disturbance",
				"Landscape",
				"Hazards",
				"University of Maryland",
				"Esri_environment",
				"hosted"
			],
			"issued": "2019-06-11T21:50:03.000Z",
			"modified": "2026-11-11T16:16:05.000Z",
			"publisher": {
				"name": "Esri"
			},
			"contactPoint": {
				"@type": "vcard:Contact",
				"fn": "esri_livefeeds2",
				"hasEmail": "{{orgContactEmail}}"
			},
			"accessLevel": "public",
			"spatial": "-164.9496,-42.9962,176.6110,70.9190",
			"license": "<img alt='' src='https://downloads.esri.com/blogs/arcgisonline/esrilogo_new.png' /> This work is licensed under the Esri Master License Agreement.<br /><div><a href='https://goto.arcgis.com/termsofuse/viewsummary' target='_blank' rel='nofollow ugc noopener noreferrer'><b>View Summary</b></a> | <a href='https://goto.arcgis.com/termsofuse/viewtermsofuse' target='_blank' rel='nofollow ugc noopener noreferrer'><b>View Terms of Use</b></a></div>",
			"distribution": [
				{
					"@type": "dcat:Distribution",
					"title": "ArcGIS Hub Dataset",
					"format": "Web Page",
					"mediaType": "text/html",
					"accessURL": "https://www.pacificgeoportal.com/maps/esri2::satellite-modis-thermal-hotspots-and-fire-activity"
				},
				{
					"@type": "dcat:Distribution",
					"title": "ArcGIS GeoService",
					"format": "ArcGIS GeoServices REST API",
					"mediaType": "application/json",
					"accessURL": "https://services9.arcgis.com/RHVPKKiFTONKtxq3/arcgis/rest/services/MODIS_Thermal_v1/FeatureServer"
				}
			],
			"theme": [
				"geospatial"
			]
		},
		{
			"@type": "dcat:Dataset",
			"identifier": "https://www.arcgis.com/home/item.html?id=b8f4033069f141729ffb298b7418b653&sublayer=0",
			"landingPage": "https://www.pacificgeoportal.com/datasets/esri2::modis-thermal-last-48-hours",
			"title": "MODIS Thermal (Last 48 hours)",
			"description": "<p>This layer presents detectable thermal activity from MODIS satellites for the last 7 days. <a target='_blank' href='https://earthdata.nasa.gov/earth-observation-data/near-real-time/firms/active-fire-data' rel='nofollow ugc noopener noreferrer'>MODIS Global Fires</a> is a product of NASA’s <a target='_blank' href='https://earthdata.nasa.gov/about' rel='nofollow ugc noopener noreferrer'>Earth Observing System Data and Information System</a> (EOSDIS), part of NASA's <a target='_blank' href='https://science.nasa.gov/earth-science/earth-data/' rel='nofollow ugc noopener noreferrer'>Earth Science Data</a>. EOSDIS integrates remote sensing and GIS technologies to deliver global MODIS hotspot/fire locations to natural resource managers and other stakeholders around the World.<br />&nbsp;</p><div>&nbsp;</div><div><div><p><strong>Consumption Best Practices:</strong></p><ul><li>As a service that is subject to very high usage, ensure peak performance and accessibility of your maps and apps by avoiding the use of non-cacheable relative Date/Time field filters. To accommodate filtering events by Date/Time, we suggest using the included \"Age\" fields that maintain the number of days or hours since a record was created or last modified, compared to the last service update. These queries fully support the ability to cache a response, allowing common query results to be efficiently provided to users in a high demand service environment.</li><li>When ingesting this service in your applications, avoid using <a target='_blank' href='https://en.wikipedia.org/wiki/POST_(HTTP)' rel='nofollow ugc noopener noreferrer'>POST</a> requests whenever possible. These requests can compromise performance and scalability during periods of high usage because they too are not cacheable.</li></ul></div></div><div><strong>Source: </strong>NASA <a target='_blank' href='https://firms.modaps.eosdis.nasa.gov/active_fire/#firms-shapefile' rel='nofollow ugc noopener noreferrer'>FIRMS - Active Fire Data - for World</a></div><p><br />&nbsp;</p><div><strong>Scale/Resolution: </strong>1km</div><p><br />&nbsp;</p><div><strong>Update Frequency: </strong>1/2 Hour (every 30 minutes) using the <a target='_blank' href='https://www.esriurl.com/LiveFeed' rel='nofollow ugc noopener noreferrer'>Aggregated Live Feed Methodology</a></div><p><br /><strong>Area Covered: </strong>World<br /><br /><span style='font-size:large;'>What can I do with this layer?</span><br />The MODIS thermal activity layer can be used to visualize and assess wildfires worldwide. However, it should be noted that this dataset contains many “false positives” (e.g., oil/natural gas wells or volcanoes) since the satellite will detect any large thermal signal.<br /><br />&nbsp;</p><div><span style='font-size:large;'>Additional Information</span></div><div>MODIS stands for <a target='_blank' href='https://earthdata.nasa.gov/earth-observation-data/near-real-time/download-nrt-data/modis-nrt' rel='nofollow ugc noopener noreferrer'>MODerate resolution Imaging Spectroradiometer</a>. The MODIS instrument is on board NASA’s Earth Observing System (EOS) <a target='_blank' href='https://terra.nasa.gov/' rel='nofollow ugc noopener noreferrer'>Terra (EOS AM)</a> and <a target='_blank' href='https://aqua.nasa.gov/' rel='nofollow ugc noopener noreferrer'>Aqua (EOS PM)</a> satellites. The orbit of the Terra satellite goes from north to south across the equator in the morning and Aqua passes south to north over the equator in the afternoon resulting in global coverage every 1 to 2 days. The EOS satellites have a ±55 degree scanning pattern and orbit at 705 km with a 2,330 km swath width.</div><p><br />It takes approximately 2 – 4 hours after satellite overpass for MODIS Rapid Response to process the data, and for the <a target='_blank' href='https://earthdata.nasa.gov/earth-observation-data/near-real-time/firms' rel='nofollow ugc noopener noreferrer'>Fire Information for Resource Management System</a> (FIRMS) to update the website. Occasionally, hardware errors can result in processing delays beyond the 2-4 hour range. Additional information on the MODIS system status can be found at <a target='_blank' href='https://earthdata.nasa.gov/earth-observation-data/near-real-time/rapid-response' rel='nofollow ugc noopener noreferrer'>MODIS Rapid Response</a>.<br /><br /><span style='font-size:large;'>Attribute Information</span><br />&nbsp;</p><ul><li><i>Latitude and Longitude</i>: The center point location of the 1km (approx.) pixel flagged as containing one or more fires/hotspots (fire size is not 1km, but variable). Stored by Point Geometry. See <a target='_blank' href='https://earthdata.nasa.gov/faq/firms-faq#ed-modis-fire-onground' rel='nofollow ugc noopener noreferrer'>What does a hotspot/fire detection mean on the ground?</a></li><li><a target='_blank' href='https://earthdata.nasa.gov/faq/firms-faq#ed-modis-brightness' rel='nofollow ugc noopener noreferrer'><i>Brightness</i></a>: The brightness temperature measured (in Kelvin) using the MODIS channels 21/22 and channel 31.</li><li><a target='_blank' href='https://earthdata.nasa.gov/faq/firms-faq#ed-modis-scan-track' rel='nofollow ugc noopener noreferrer'><i>Scan and Track</i></a>: The actual spatial resolution of the scanned pixel. Although the algorithm works at 1km resolution, the MODIS pixels get bigger toward the edge of the scan. See <a target='_blank' href='https://earthdata.nasa.gov/faq/firms-faq#ed-modis-scan-track' rel='nofollow ugc noopener noreferrer'>What does scan and track mean?</a></li><li><i>Date and Time</i>: Acquisition date of the hotspot/active fire pixel and time of satellite overpass in UTC (client presentation in local time). Stored by Acquisition Date.</li><li><i>Acquisition Date</i>: Derived Date/Time field combining Date and Time attributes.</li><li><a target='_blank' href='https://earthdata.nasa.gov/faq/firms-faq#ed-modis-missing' rel='nofollow ugc noopener noreferrer'><i>Satellite</i></a>: Whether the detection was picked up by the Terra or Aqua satellite.</li><li><a target='_blank' href='https://earthdata.nasa.gov/faq/firms-faq#ed-confidence' rel='nofollow ugc noopener noreferrer'><i>Confidence</i></a>: The detection confidence is a quality flag of the individual hotspot/active fire pixel.</li><li><i>Version</i>: Version refers to the processing collection and source of data. The number before the decimal refers to the <a target='_blank' href='https://earthdata.nasa.gov/faq/firms-faq#ed-modis-collections' rel='nofollow ugc noopener noreferrer'>collection</a> (e.g. MODIS <a target='_blank' href='https://www.earthdata.nasa.gov/s3fs-public/2023-09/MODIS_C6_C6.1_Fire_User_Guide_1.0.pdf' rel='nofollow ugc noopener noreferrer'>Collection 6</a>). The number after the decimal indicates the source of Level 1B data; data processed in near-real time by <a target='_blank' href='https://earthdata.nasa.gov/earth-observation-data/near-real-time/rapid-response' rel='nofollow ugc noopener noreferrer'>MODIS Rapid Response</a> will have the source code “CollectionNumber.0”. Data sourced from MODAPS (with a 2-month lag) and processed by FIRMS using the standard MOD14/MYD14 Thermal Anomalies algorithm will have a source code “CollectionNumber.x”. For example, data with the version listed as 5.0 is collection 5, processed by MRR, data with the version listed as 5.1 is collection 5 data processed by FIRMS using Level 1B data from MODAPS.</li><li><i>Bright.T31</i>: Channel 31 brightness temperature (in Kelvins) of the hotspot/active fire pixel.</li><li><i>FRP</i>: Fire Radiative Power. Depicts the pixel-integrated fire radiative power in MW (MegaWatts). FRP provides information on the measured radiant heat output of detected fires. The amount of radiant heat energy liberated per unit time (the Fire Radiative Power) is thought to be related to the rate at which fuel is being consumed (Wooster et. al. (2005)).</li><li><a target='_blank' href='https://www.earthdata.nasa.gov/faq/firms-faq#ed-nrt-standard' rel='nofollow ugc noopener noreferrer'><i>DayNight</i></a>: The standard processing algorithm uses the solar zenith angle (SZA) to threshold the day/night value; if the SZA exceeds 85 degrees it is assigned a night value. SZA values less than 85 degrees are assigned a day time value. For the NRT algorithm the day/night flag is assigned by ascending (day) vs descending (night) observation. It is expected that the NRT assignment of the day/night flag will be amended to be consistent with the standard processing.</li><li><i>Hours Old</i>: Derived field that provides age of record in hours between Acquisition date/time and latest update date/time. 0 = less than 1 hour ago, 1 = less than 2 hours ago, 2 = less than 3 hours ago, and so on.</li></ul><div><span style='font-size:x-large;'>Revisions</span></div><div><ul><li><strong>June 22, 2022</strong>: Added 'HOURS_OLD' field to enhance Filtering data. Added 'Last 7 days' Layer to extend data to match time range of <a target='_blank' href='https://www.arcgis.com/home/item.html?id=dece90af1a0242dcbf0ca36d30276aa3' rel='nofollow ugc noopener noreferrer'>VIIRS</a> offering. Added Field level descriptions.</li></ul></div><p><span style='background-color:rgb(255,255,255); color:rgb(128,128,128);'>This map is provided for informational purposes and is not monitored 24/7 for accuracy and currency.</span></p><div>&nbsp;</div><p>If you would like to be alerted to potential issues or simply see when this Service will update next, please visit our <a target='_blank' href='https://livingatlas.arcgis.com/livefeeds-status/' rel='nofollow ugc noopener noreferrer'>Live Feed Status</a> Page!</p>",
			"keyword": [
				"  Esri",
				"MODIS",
				"Esri",
				"FIRMS",
				"Hot spots",
				"Wildfire",
				"Live Feed",
				"Risk",
				"Earth Observations",
				"Disturbance",
				"Landscape",
				"Hazards",
				"University of Maryland",
				"Esri_environment",
				"hosted"
			],
			"issued": "2019-06-11T21:50:03.000Z",
			"modified": "2026-11-11T16:02:15.901Z",
			"publisher": {
				"name": "Esri"
			},
			"contactPoint": {
				"@type": "vcard:Contact",
				"fn": "esri_livefeeds2",
				"hasEmail": "{{orgContactEmail}}"
			},
			"accessLevel": "public",
			"spatial": "-164.9496,-42.9962,176.6110,70.9190",
			"license": "<img alt='' src='https://downloads.esri.com/blogs/arcgisonline/esrilogo_new.png' /> This work is licensed under the Esri Master License Agreement.<br /><div><a href='https://goto.arcgis.com/termsofuse/viewsummary' target='_blank' rel='nofollow ugc noopener noreferrer'><b>View Summary</b></a> | <a href='https://goto.arcgis.com/termsofuse/viewtermsofuse' target='_blank' rel='nofollow ugc noopener noreferrer'><b>View Terms of Use</b></a></div>",
			"distribution": [
				{
					"@type": "dcat:Distribution",
					"title": "ArcGIS Hub Dataset",
					"format": "Web Page",
					"mediaType": "text/html",
					"accessURL": "https://www.pacificgeoportal.com/datasets/esri2::modis-thermal-last-48-hours"
				},
				{
					"@type": "dcat:Distribution",
					"title": "ArcGIS GeoService",
					"format": "ArcGIS GeoServices REST API",
					"mediaType": "application/json",
					"accessURL": "https://services9.arcgis.com/RHVPKKiFTONKtxq3/arcgis/rest/services/MODIS_Thermal_v1/FeatureServer/0"
				},
				{
					"@type": "dcat:Distribution",
					"title": "CSV",
					"format": "CSV",
					"mediaType": "text/csv",
					"accessURL": "https://www.pacificgeoportal.com/api/download/v1/items/b8f4033069f141729ffb298b7418b653/csv?layers=0"
				},
				{
					"@type": "dcat:Distribution",
					"title": "Shapefile",
					"format": "ZIP",
					"mediaType": "application/zip",
					"accessURL": "https://www.pacificgeoportal.com/api/download/v1/items/b8f4033069f141729ffb298b7418b653/shapefile?layers=0"
				},
				{
					"@type": "dcat:Distribution",
					"title": "GeoJSON",
					"format": "GeoJSON",
					"mediaType": "application/vnd.geo+json",
					"accessURL": "https://www.pacificgeoportal.com/api/download/v1/items/b8f4033069f141729ffb298b7418b653/geojson?layers=0"
				},
				{
					"@type": "dcat:Distribution",
					"title": "KML",
					"format": "KML",
					"mediaType": "application/vnd.google-earth.kml+xml",
					"accessURL": "https://www.pacificgeoportal.com/api/download/v1/items/b8f4033069f141729ffb298b7418b653/kml?layers=0"
				}
			],
			"theme": [
				"geospatial"
			]
		},
		{
			"@type": "dcat:Dataset",
			"identifier": "https://www.arcgis.com/home/item.html?id=b8f4033069f141729ffb298b7418b653&sublayer=1",
			"landingPage": "https://www.pacificgeoportal.com/datasets/esri2::modis-thermal-last-7-days",
			"title": "MODIS Thermal (Last 7 days)",
			"description": "<p>This layer presents detectable thermal activity from MODIS satellites for the last 7 days. <a target='_blank' href='https://earthdata.nasa.gov/earth-observation-data/near-real-time/firms/active-fire-data' rel='nofollow ugc noopener noreferrer'>MODIS Global Fires</a> is a product of NASA’s <a target='_blank' href='https://earthdata.nasa.gov/about' rel='nofollow ugc noopener noreferrer'>Earth Observing System Data and Information System</a> (EOSDIS), part of NASA's <a target='_blank' href='https://science.nasa.gov/earth-science/earth-data/' rel='nofollow ugc noopener noreferrer'>Earth Science Data</a>. EOSDIS integrates remote sensing and GIS technologies to deliver global MODIS hotspot/fire locations to natural resource managers and other stakeholders around the World.<br />&nbsp;</p><div>&nbsp;</div><div><div><p><strong>Consumption Best Practices:</strong></p><ul><li>As a service that is subject to very high usage, ensure peak performance and accessibility of your maps and apps by avoiding the use of non-cacheable relative Date/Time field filters. To accommodate filtering events by Date/Time, we suggest using the included \"Age\" fields that maintain the number of days or hours since a record was created or last modified, compared to the last service update. These queries fully support the ability to cache a response, allowing common query results to be efficiently provided to users in a high demand service environment.</li><li>When ingesting this service in your applications, avoid using <a target='_blank' href='https://en.wikipedia.org/wiki/POST_(HTTP)' rel='nofollow ugc noopener noreferrer'>POST</a> requests whenever possible. These requests can compromise performance and scalability during periods of high usage because they too are not cacheable.</li></ul></div></div><div><strong>Source: </strong>NASA <a target='_blank' href='https://firms.modaps.eosdis.nasa.gov/active_fire/#firms-shapefile' rel='nofollow ugc noopener noreferrer'>FIRMS - Active Fire Data - for World</a></div><p><br />&nbsp;</p><div><strong>Scale/Resolution: </strong>1km</div><p><br />&nbsp;</p><div><strong>Update Frequency: </strong>1/2 Hour (every 30 minutes) using the <a target='_blank' href='https://www.esriurl.com/LiveFeed' rel='nofollow ugc noopener noreferrer'>Aggregated Live Feed Methodology</a></div><p><br /><strong>Area Covered: </strong>World<br /><br /><span style='font-size:large;'>What can I do with this layer?</span><br />The MODIS thermal activity layer can be used to visualize and assess wildfires worldwide. However, it should be noted that this dataset contains many “false positives” (e.g., oil/natural gas wells or volcanoes) since the satellite will detect any large thermal signal.<br /><br />&nbsp;</p><div><span style='font-size:large;'>Additional Information</span></div><div>MODIS stands for <a target='_blank' href='https://earthdata.nasa.gov/earth-observation-data/near-real-time/download-nrt-data/modis-nrt' rel='nofollow ugc noopener noreferrer'>MODerate resolution Imaging Spectroradiometer</a>. The MODIS instrument is on board NASA’s Earth Observing System (EOS) <a target='_blank' href='https://terra.nasa.gov/' rel='nofollow ugc noopener noreferrer'>Terra (EOS AM)</a> and <a target='_blank' href='https://aqua.nasa.gov/' rel='nofollow ugc noopener noreferrer'>Aqua (EOS PM)</a> satellites. The orbit of the Terra satellite goes from north to south across the equator in the morning and Aqua passes south to north over the equator in the afternoon resulting in global coverage every 1 to 2 days. The EOS satellites have a ±55 degree scanning pattern and orbit at 705 km with a 2,330 km swath width.</div><p><br />It takes approximately 2 – 4 hours after satellite overpass for MODIS Rapid Response to process the data, and for the <a target='_blank' href='https://earthdata.nasa.gov/earth-observation-data/near-real-time/firms' rel='nofollow ugc noopener noreferrer'>Fire Information for Resource Management System</a> (FIRMS) to update the website. Occasionally, hardware errors can result in processing delays beyond the 2-4 hour range. Additional information on the MODIS system status can be found at <a target='_blank' href='https://earthdata.nasa.gov/earth-observation-data/near-real-time/rapid-response' rel='nofollow ugc noopener noreferrer'>MODIS Rapid Response</a>.<br /><br /><span style='font-size:large;'>Attribute Information</span><br />&nbsp;</p><ul><li><i>Latitude and Longitude</i>: The center point location of the 1km (approx.) pixel flagged as containing one or more fires/hotspots (fire size is not 1km, but variable). Stored by Point Geometry. See <a target='_blank' href='https://earthdata.nasa.gov/faq/firms-faq#ed-modis-fire-onground' rel='nofollow ugc noopener noreferrer'>What does a hotspot/fire detection mean on the ground?</a></li><li><a target='_blank' href='https://earthdata.nasa.gov/faq/firms-faq#ed-modis-brightness' rel='nofollow ugc noopener noreferrer'><i>Brightness</i></a>: The brightness temperature measured (in Kelvin) using the MODIS channels 21/22 and channel 31.</li><li><a target='_blank' href='https://earthdata.nasa.gov/faq/firms-faq#ed-modis-scan-track' rel='nofollow ugc noopener noreferrer'><i>Scan and Track</i></a>: The actual spatial resolution of the scanned pixel. Although the algorithm works at 1km resolution, the MODIS pixels get bigger toward the edge of the scan. See <a target='_blank' href='https://earthdata.nasa.gov/faq/firms-faq#ed-modis-scan-track' rel='nofollow ugc noopener noreferrer'>What does scan and track mean?</a></li><li><i>Date and Time</i>: Acquisition date of the hotspot/active fire pixel and time of satellite overpass in UTC (client presentation in local time). Stored by Acquisition Date.</li><li><i>Acquisition Date</i>: Derived Date/Time field combining Date and Time attributes.</li><li><a target='_blank' href='https://earthdata.nasa.gov/faq/firms-faq#ed-modis-missing' rel='nofollow ugc noopener noreferrer'><i>Satellite</i></a>: Whether the detection was picked up by the Terra or Aqua satellite.</li><li><a target='_blank' href='https://earthdata.nasa.gov/faq/firms-faq#ed-confidence' rel='nofollow ugc noopener noreferrer'><i>Confidence</i></a>: The detection confidence is a quality flag of the individual hotspot/active fire pixel.</li><li><i>Version</i>: Version refers to the processing collection and source of data. The number before the decimal refers to the <a target='_blank' href='https://earthdata.nasa.gov/faq/firms-faq#ed-modis-collections' rel='nofollow ugc noopener noreferrer'>collection</a> (e.g. MODIS <a target='_blank' href='https://www.earthdata.nasa.gov/s3fs-public/2023-09/MODIS_C6_C6.1_Fire_User_Guide_1.0.pdf' rel='nofollow ugc noopener noreferrer'>Collection 6</a>). The number after the decimal indicates the source of Level 1B data; data processed in near-real time by <a target='_blank' href='https://earthdata.nasa.gov/earth-observation-data/near-real-time/rapid-response' rel='nofollow ugc noopener noreferrer'>MODIS Rapid Response</a> will have the source code “CollectionNumber.0”. Data sourced from MODAPS (with a 2-month lag) and processed by FIRMS using the standard MOD14/MYD14 Thermal Anomalies algorithm will have a source code “CollectionNumber.x”. For example, data with the version listed as 5.0 is collection 5, processed by MRR, data with the version listed as 5.1 is collection 5 data processed by FIRMS using Level 1B data from MODAPS.</li><li><i>Bright.T31</i>: Channel 31 brightness temperature (in Kelvins) of the hotspot/active fire pixel.</li><li><i>FRP</i>: Fire Radiative Power. Depicts the pixel-integrated fire radiative power in MW (MegaWatts). FRP provides information on the measured radiant heat output of detected fires. The amount of radiant heat energy liberated per unit time (the Fire Radiative Power) is thought to be related to the rate at which fuel is being consumed (Wooster et. al. (2005)).</li><li><a target='_blank' href='https://www.earthdata.nasa.gov/faq/firms-faq#ed-nrt-standard' rel='nofollow ugc noopener noreferrer'><i>DayNight</i></a>: The standard processing algorithm uses the solar zenith angle (SZA) to threshold the day/night value; if the SZA exceeds 85 degrees it is assigned a night value. SZA values less than 85 degrees are assigned a day time value. For the NRT algorithm the day/night flag is assigned by ascending (day) vs descending (night) observation. It is expected that the NRT assignment of the day/night flag will be amended to be consistent with the standard processing.</li><li><i>Hours Old</i>: Derived field that provides age of record in hours between Acquisition date/time and latest update date/time. 0 = less than 1 hour ago, 1 = less than 2 hours ago, 2 = less than 3 hours ago, and so on.</li></ul><div><span style='font-size:x-large;'>Revisions</span></div><div><ul><li><strong>June 22, 2022</strong>: Added 'HOURS_OLD' field to enhance Filtering data. Added 'Last 7 days' Layer to extend data to match time range of <a target='_blank' href='https://www.arcgis.com/home/item.html?id=dece90af1a0242dcbf0ca36d30276aa3' rel='nofollow ugc noopener noreferrer'>VIIRS</a> offering. Added Field level descriptions.</li></ul></div><p><span style='background-color:rgb(255,255,255); color:rgb(128,128,128);'>This map is provided for informational purposes and is not monitored 24/7 for accuracy and currency.</span></p><div>&nbsp;</div><p>If you would like to be alerted to potential issues or simply see when this Service will update next, please visit our <a target='_blank' href='https://livingatlas.arcgis.com/livefeeds-status/' rel='nofollow ugc noopener noreferrer'>Live Feed Status</a> Page!</p>",
			"keyword": [
				"  Esri",
				"MODIS",
				"Esri",
				"FIRMS",
				"Hot spots",
				"Wildfire",
				"Live Feed",
				"Risk",
				"Earth Observations",
				"Disturbance",
				"Landscape",
				"Hazards",
				"University of Maryland",
				"Esri_environment",
				"hosted"
			],
			"issued": "2019-06-11T21:50:03.000Z",
			"modified": "2026-11-11T16:02:15.901Z",
			"publisher": {
				"name": "Esri"
			},
			"contactPoint": {
				"@type": "vcard:Contact",
				"fn": "esri_livefeeds2",
				"hasEmail": "{{orgContactEmail}}"
			},
			"accessLevel": "public",
			"spatial": "-164.9496,-42.9962,176.6110,70.9190",
			"license": "<img alt='' src='https://downloads.esri.com/blogs/arcgisonline/esrilogo_new.png' /> This work is licensed under the Esri Master License Agreement.<br /><div><a href='https://goto.arcgis.com/termsofuse/viewsummary' target='_blank' rel='nofollow ugc noopener noreferrer'><b>View Summary</b></a> | <a href='https://goto.arcgis.com/termsofuse/viewtermsofuse' target='_blank' rel='nofollow ugc noopener noreferrer'><b>View Terms of Use</b></a></div>",
			"distribution": [
				{
					"@type": "dcat:Distribution",
					"title": "ArcGIS Hub Dataset",
					"format": "Web Page",
					"mediaType": "text/html",
					"accessURL": "https://www.pacificgeoportal.com/datasets/esri2::modis-thermal-last-7-days"
				},
				{
					"@type": "dcat:Distribution",
					"title": "ArcGIS GeoService",
					"format": "ArcGIS GeoServices REST API",
					"mediaType": "application/json",
					"accessURL": "https://services9.arcgis.com/RHVPKKiFTONKtxq3/arcgis/rest/services/MODIS_Thermal_v1/FeatureServer/1"
				},
				{
					"@type": "dcat:Distribution",
					"title": "CSV",
					"format": "CSV",
					"mediaType": "text/csv",
					"accessURL": "https://www.pacificgeoportal.com/api/download/v1/items/b8f4033069f141729ffb298b7418b653/csv?layers=1"
				},
				{
					"@type": "dcat:Distribution",
					"title": "Shapefile",
					"format": "ZIP",
					"mediaType": "application/zip",
					"accessURL": "https://www.pacificgeoportal.com/api/download/v1/items/b8f4033069f141729ffb298b7418b653/shapefile?layers=1"
				},
				{
					"@type": "dcat:Distribution",
					"title": "GeoJSON",
					"format": "GeoJSON",
					"mediaType": "application/vnd.geo+json",
					"accessURL": "https://www.pacificgeoportal.com/api/download/v1/items/b8f4033069f141729ffb298b7418b653/geojson?layers=1"
				},
				{
					"@type": "dcat:Distribution",
					"title": "KML",
					"format": "KML",
					"mediaType": "application/vnd.google-earth.kml+xml",
					"accessURL": "https://www.pacificgeoportal.com/api/download/v1/items/b8f4033069f141729ffb298b7418b653/kml?layers=1"
				}
			],
			"theme": [
				"geospatial"
			]
		},
		{
			"@type": "dcat:Dataset",
			"identifier": "https://www.arcgis.com/home/item.html?id=adfe292a67f8471a9d8230ef93294414",
			"landingPage": "https://www.pacificgeoportal.com/maps/esri2::recent-hurricanes-cyclones-and-typhoons",
			"title": "Recent Hurricanes, Cyclones and Typhoons",
			"description": "<div>This layer features tropical storm (hurricanes, typhoons, cyclones) tracks, positions, and observed wind swaths from the past hurricane season for the Atlantic, Pacific, and Indian Basins. These are products from the&nbsp;<a target='_blank' href='https://www.nhc.noaa.gov/' rel='nofollow ugc noopener noreferrer'>National Hurricane Center</a>&nbsp;(NHC) and&nbsp;<a target='_blank' href='https://www.usno.navy.mil/JTWC/' rel='nofollow ugc noopener noreferrer'>Joint Typhoon Warning Center</a>&nbsp;(JTWC). They are part of an archive of tropical storm data maintained in the <a target='_blank' href='https://www.ncdc.noaa.gov/ibtracs/' rel='nofollow ugc noopener noreferrer'>International Best Track Archive for Climate Stewardship</a> (IBTrACS) database by the <a target='_blank' href='https://www.ncei.noaa.gov/' rel='nofollow ugc noopener noreferrer'>NOAA National Centers for Environmental Information</a>.</div><div>&nbsp;</div><div><strong>Data Source</strong></div><div><ul><li>NOAA National Hurricane Center <a target='_blank' href='https://www.nhc.noaa.gov/gis/archive_besttrack.php' rel='nofollow ugc noopener noreferrer'>tropical cyclone best track archive</a>.</li></ul></div><div>&nbsp;</div><div><strong>Update Frequency</strong></div><div><ul><li>We automatically check these products for updates every 15 minutes from the <a target='_blank' href='https://www.nhc.noaa.gov/gis/' rel='nofollow ugc noopener noreferrer'>NHC GIS Data page</a>.</li><li>The NHC shapefiles are parsed using the <a target='_blank' href='https://www.esriurl.com/LiveFeed' rel='nofollow ugc noopener noreferrer'>Aggregated Live Feeds methodology</a> to take the returned information and serve the data through ArcGIS Server as a map service.</li></ul></div><div>&nbsp;</div><div><strong>Area Covered</strong></div><div><ul><li>World</li></ul></div><div>&nbsp;</div><div><span style='font-size:medium;'><strong>What can you do with this layer?</strong></span></div><div><ul><li>Customize the display of each attribute by using the ‘Change Style’ option for any layer.</li><li>Run a filter to query the layer and display only specific types of storms or areas.</li><li>Add to your map with other weather data layers to provide insight on hazardous weather events.</li><li>Use ArcGIS Online analysis tools like ‘Enrich Data’ on the Observed Wind Swath layer to determine the impact of cyclone events on populations.</li><li>Visualize data in ArcGIS Insights or Operations Dashboards.</li></ul><p>&nbsp;</p><p><span style='color:rgb(128,128,128);'>This map is provided for informational purposes and is not monitored 24/7 for accuracy and currency. Always refer to </span><a target='_blank' href='https://www.nhc.noaa.gov/contact.shtml' rel='nofollow ugc noopener noreferrer'><span style='color:rgb(128,128,128);'>NOAA</span></a><span style='color:rgb(128,128,128);'> or JTWC sources for official guidance.</span></p><p>If you would like to be alerted to potential issues or simply see when this Service will update next, please visit our <a target='_blank' href='https://livingatlas.arcgis.com/livefeeds-status/' rel='nofollow ugc noopener noreferrer'>Live Feed Status</a> Page!</p></div>",
			"keyword": [
				"Esri",
				"NHC",
				"Hurricane",
				"risk",
				"earth observations",
				"climate",
				"hosted",
				"esri_environment",
				"Recent_Hurricanes",
				"Live Feeds",
				"livefeeds",
				"Alvin",
				"Barbara",
				"Cosme",
				"Dalila",
				"Erick",
				"Flossie",
				"Gil",
				"Henriette",
				"Ivo",
				"Juliette",
				"Kiko",
				"Lorena",
				"Mario",
				"Narda",
				"Octave",
				"Priscilla",
				"Raymond",
				"Sonia",
				"Tico",
				"Velma",
				"Wallis",
				"Xina",
				"York",
				"Zelda",
				"Andrea",
				"Barry",
				"Chantal",
				"Dexter",
				"Erin",
				"Fernand",
				"Gabrielle",
				"Humberto",
				"Imelda",
				"Jerry",
				"Karen",
				"Lorenzo",
				"Melissa",
				"Nestor",
				"Olga",
				"Pablo",
				"Rebekah",
				"Sebastien",
				"Tanya",
				"Van",
				"Wendy"
			],
			"issued": "2019-06-11T21:06:24.000Z",
			"modified": "2026-11-11T16:11:00.000Z",
			"publisher": {
				"name": "Esri"
			},
			"contactPoint": {
				"@type": "vcard:Contact",
				"fn": "esri_livefeeds2",
				"hasEmail": "{{orgContactEmail}}"
			},
			"accessLevel": "public",
			"spatial": "-135.5000,-31.8000,178.8000,34.2000",
			"license": "<img alt='' src='https://downloads.esri.com/blogs/arcgisonline/esrilogo_new.png' /> This work is licensed under the Esri Master License Agreement.<br /><div><a href='https://goto.arcgis.com/termsofuse/viewsummary' target='_blank' rel='nofollow ugc noopener noreferrer'><b>View Summary</b></a> | <a href='https://goto.arcgis.com/termsofuse/viewtermsofuse' target='_blank' rel='nofollow ugc noopener noreferrer'><b>View Terms of Use</b></a></div>",
			"distribution": [
				{
					"@type": "dcat:Distribution",
					"title": "ArcGIS Hub Dataset",
					"format": "Web Page",
					"mediaType": "text/html",
					"accessURL": "https://www.pacificgeoportal.com/maps/esri2::recent-hurricanes-cyclones-and-typhoons"
				},
				{
					"@type": "dcat:Distribution",
					"title": "ArcGIS GeoService",
					"format": "ArcGIS GeoServices REST API",
					"mediaType": "application/json",
					"accessURL": "https://services9.arcgis.com/RHVPKKiFTONKtxq3/arcgis/rest/services/Recent_Hurricanes_v1/FeatureServer"
				}
			],
			"theme": [
				"geospatial"
			]
		},
		{
			"@type": "dcat:Dataset",
			"identifier": "https://www.arcgis.com/home/item.html?id=adfe292a67f8471a9d8230ef93294414&sublayer=0",
			"landingPage": "https://www.pacificgeoportal.com/datasets/esri2::observed-position-1",
			"title": "Observed Position",
			"description": "<div>This layer features tropical storm (hurricanes, typhoons, cyclones) tracks, positions, and observed wind swaths from the past hurricane season for the Atlantic, Pacific, and Indian Basins. These are products from the&nbsp;<a target='_blank' href='https://www.nhc.noaa.gov/' rel='nofollow ugc noopener noreferrer'>National Hurricane Center</a>&nbsp;(NHC) and&nbsp;<a target='_blank' href='https://www.usno.navy.mil/JTWC/' rel='nofollow ugc noopener noreferrer'>Joint Typhoon Warning Center</a>&nbsp;(JTWC). They are part of an archive of tropical storm data maintained in the <a target='_blank' href='https://www.ncdc.noaa.gov/ibtracs/' rel='nofollow ugc noopener noreferrer'>International Best Track Archive for Climate Stewardship</a> (IBTrACS) database by the <a target='_blank' href='https://www.ncei.noaa.gov/' rel='nofollow ugc noopener noreferrer'>NOAA National Centers for Environmental Information</a>.</div><div>&nbsp;</div><div><strong>Data Source</strong></div><div><ul><li>NOAA National Hurricane Center <a target='_blank' href='https://www.nhc.noaa.gov/gis/archive_besttrack.php' rel='nofollow ugc noopener noreferrer'>tropical cyclone best track archive</a>.</li></ul></div><div>&nbsp;</div><div><strong>Update Frequency</strong></div><div><ul><li>We automatically check these products for updates every 15 minutes from the <a target='_blank' href='https://www.nhc.noaa.gov/gis/' rel='nofollow ugc noopener noreferrer'>NHC GIS Data page</a>.</li><li>The NHC shapefiles are parsed using the <a target='_blank' href='https://www.esriurl.com/LiveFeed' rel='nofollow ugc noopener noreferrer'>Aggregated Live Feeds methodology</a> to take the returned information and serve the data through ArcGIS Server as a map service.</li></ul></div><div>&nbsp;</div><div><strong>Area Covered</strong></div><div><ul><li>World</li></ul></div><div>&nbsp;</div><div><span style='font-size:medium;'><strong>What can you do with this layer?</strong></span></div><div><ul><li>Customize the display of each attribute by using the ‘Change Style’ option for any layer.</li><li>Run a filter to query the layer and display only specific types of storms or areas.</li><li>Add to your map with other weather data layers to provide insight on hazardous weather events.</li><li>Use ArcGIS Online analysis tools like ‘Enrich Data’ on the Observed Wind Swath layer to determine the impact of cyclone events on populations.</li><li>Visualize data in ArcGIS Insights or Operations Dashboards.</li></ul><p>&nbsp;</p><p><span style='color:rgb(128,128,128);'>This map is provided for informational purposes and is not monitored 24/7 for accuracy and currency. Always refer to </span><a target='_blank' href='https://www.nhc.noaa.gov/contact.shtml' rel='nofollow ugc noopener noreferrer'><span style='color:rgb(128,128,128);'>NOAA</span></a><span style='color:rgb(128,128,128);'> or JTWC sources for official guidance.</span></p><p>If you would like to be alerted to potential issues or simply see when this Service will update next, please visit our <a target='_blank' href='https://livingatlas.arcgis.com/livefeeds-status/' rel='nofollow ugc noopener noreferrer'>Live Feed Status</a> Page!</p></div>",
			"keyword": [
				"Esri",
				"NHC",
				"Hurricane",
				"risk",
				"earth observations",
				"climate",
				"hosted",
				"esri_environment",
				"Recent_Hurricanes",
				"Live Feeds",
				"livefeeds",
				"Alvin",
				"Barbara",
				"Cosme",
				"Dalila",
				"Erick",
				"Flossie",
				"Gil",
				"Henriette",
				"Ivo",
				"Juliette",
				"Kiko",
				"Lorena",
				"Mario",
				"Narda",
				"Octave",
				"Priscilla",
				"Raymond",
				"Sonia",
				"Tico",
				"Velma",
				"Wallis",
				"Xina",
				"York",
				"Zelda",
				"Andrea",
				"Barry",
				"Chantal",
				"Dexter",
				"Erin",
				"Fernand",
				"Gabrielle",
				"Humberto",
				"Imelda",
				"Jerry",
				"Karen",
				"Lorenzo",
				"Melissa",
				"Nestor",
				"Olga",
				"Pablo",
				"Rebekah",
				"Sebastien",
				"Tanya",
				"Van",
				"Wendy"
			],
			"issued": "2019-06-11T21:06:24.000Z",
			"modified": "2026-11-11T15:29:15.954Z",
			"publisher": {
				"name": "Esri"
			},
			"contactPoint": {
				"@type": "vcard:Contact",
				"fn": "esri_livefeeds2",
				"hasEmail": "{{orgContactEmail}}"
			},
			"accessLevel": "public",
			"spatial": "-135.5000,-31.8000,178.8000,34.2000",
			"license": "<img alt='' src='https://downloads.esri.com/blogs/arcgisonline/esrilogo_new.png' /> This work is licensed under the Esri Master License Agreement.<br /><div><a href='https://goto.arcgis.com/termsofuse/viewsummary' target='_blank' rel='nofollow ugc noopener noreferrer'><b>View Summary</b></a> | <a href='https://goto.arcgis.com/termsofuse/viewtermsofuse' target='_blank' rel='nofollow ugc noopener noreferrer'><b>View Terms of Use</b></a></div>",
			"distribution": [
				{
					"@type": "dcat:Distribution",
					"title": "ArcGIS Hub Dataset",
					"format": "Web Page",
					"mediaType": "text/html",
					"accessURL": "https://www.pacificgeoportal.com/datasets/esri2::observed-position-1"
				},
				{
					"@type": "dcat:Distribution",
					"title": "ArcGIS GeoService",
					"format": "ArcGIS GeoServices REST API",
					"mediaType": "application/json",
					"accessURL": "https://services9.arcgis.com/RHVPKKiFTONKtxq3/arcgis/rest/services/Recent_Hurricanes_v1/FeatureServer/0"
				},
				{
					"@type": "dcat:Distribution",
					"title": "CSV",
					"format": "CSV",
					"mediaType": "text/csv",
					"accessURL": "https://www.pacificgeoportal.com/api/download/v1/items/adfe292a67f8471a9d8230ef93294414/csv?layers=0"
				},
				{
					"@type": "dcat:Distribution",
					"title": "Shapefile",
					"format": "ZIP",
					"mediaType": "application/zip",
					"accessURL": "https://www.pacificgeoportal.com/api/download/v1/items/adfe292a67f8471a9d8230ef93294414/shapefile?layers=0"
				},
				{
					"@type": "dcat:Distribution",
					"title": "GeoJSON",
					"format": "GeoJSON",
					"mediaType": "application/vnd.geo+json",
					"accessURL": "https://www.pacificgeoportal.com/api/download/v1/items/adfe292a67f8471a9d8230ef93294414/geojson?layers=0"
				},
				{
					"@type": "dcat:Distribution",
					"title": "KML",
					"format": "KML",
					"mediaType": "application/vnd.google-earth.kml+xml",
					"accessURL": "https://www.pacificgeoportal.com/api/download/v1/items/adfe292a67f8471a9d8230ef93294414/kml?layers=0"
				}
			],
			"theme": [
				"geospatial"
			]
		},
		{
			"@type": "dcat:Dataset",
			"identifier": "https://www.arcgis.com/home/item.html?id=adfe292a67f8471a9d8230ef93294414&sublayer=1",
			"landingPage": "https://www.pacificgeoportal.com/datasets/esri2::observed-track-1",
			"title": "Observed Track",
			"description": "<div>This layer features tropical storm (hurricanes, typhoons, cyclones) tracks, positions, and observed wind swaths from the past hurricane season for the Atlantic, Pacific, and Indian Basins. These are products from the&nbsp;<a target='_blank' href='https://www.nhc.noaa.gov/' rel='nofollow ugc noopener noreferrer'>National Hurricane Center</a>&nbsp;(NHC) and&nbsp;<a target='_blank' href='https://www.usno.navy.mil/JTWC/' rel='nofollow ugc noopener noreferrer'>Joint Typhoon Warning Center</a>&nbsp;(JTWC). They are part of an archive of tropical storm data maintained in the <a target='_blank' href='https://www.ncdc.noaa.gov/ibtracs/' rel='nofollow ugc noopener noreferrer'>International Best Track Archive for Climate Stewardship</a> (IBTrACS) database by the <a target='_blank' href='https://www.ncei.noaa.gov/' rel='nofollow ugc noopener noreferrer'>NOAA National Centers for Environmental Information</a>.</div><div>&nbsp;</div><div><strong>Data Source</strong></div><div><ul><li>NOAA National Hurricane Center <a target='_blank' href='https://www.nhc.noaa.gov/gis/archive_besttrack.php' rel='nofollow ugc noopener noreferrer'>tropical cyclone best track archive</a>.</li></ul></div><div>&nbsp;</div><div><strong>Update Frequency</strong></div><div><ul><li>We automatically check these products for updates every 15 minutes from the <a target='_blank' href='https://www.nhc.noaa.gov/gis/' rel='nofollow ugc noopener noreferrer'>NHC GIS Data page</a>.</li><li>The NHC shapefiles are parsed using the <a target='_blank' href='https://www.esriurl.com/LiveFeed' rel='nofollow ugc noopener noreferrer'>Aggregated Live Feeds methodology</a> to take the returned information and serve the data through ArcGIS Server as a map service.</li></ul></div><div>&nbsp;</div><div><strong>Area Covered</strong></div><div><ul><li>World</li></ul></div><div>&nbsp;</div><div><span style='font-size:medium;'><strong>What can you do with this layer?</strong></span></div><div><ul><li>Customize the display of each attribute by using the ‘Change Style’ option for any layer.</li><li>Run a filter to query the layer and display only specific types of storms or areas.</li><li>Add to your map with other weather data layers to provide insight on hazardous weather events.</li><li>Use ArcGIS Online analysis tools like ‘Enrich Data’ on the Observed Wind Swath layer to determine the impact of cyclone events on populations.</li><li>Visualize data in ArcGIS Insights or Operations Dashboards.</li></ul><p>&nbsp;</p><p><span style='color:rgb(128,128,128);'>This map is provided for informational purposes and is not monitored 24/7 for accuracy and currency. Always refer to </span><a target='_blank' href='https://www.nhc.noaa.gov/contact.shtml' rel='nofollow ugc noopener noreferrer'><span style='color:rgb(128,128,128);'>NOAA</span></a><span style='color:rgb(128,128,128);'> or JTWC sources for official guidance.</span></p><p>If you would like to be alerted to potential issues or simply see when this Service will update next, please visit our <a target='_blank' href='https://livingatlas.arcgis.com/livefeeds-status/' rel='nofollow ugc noopener noreferrer'>Live Feed Status</a> Page!</p></div>",
			"keyword": [
				"Esri",
				"NHC",
				"Hurricane",
				"risk",
				"earth observations",
				"climate",
				"hosted",
				"esri_environment",
				"Recent_Hurricanes",
				"Live Feeds",
				"livefeeds",
				"Alvin",
				"Barbara",
				"Cosme",
				"Dalila",
				"Erick",
				"Flossie",
				"Gil",
				"Henriette",
				"Ivo",
				"Juliette",
				"Kiko",
				"Lorena",
				"Mario",
				"Narda",
				"Octave",
				"Priscilla",
				"Raymond",
				"Sonia",
				"Tico",
				"Velma",
				"Wallis",
				"Xina",
				"York",
				"Zelda",
				"Andrea",
				"Barry",
				"Chantal",
				"Dexter",
				"Erin",
				"Fernand",
				"Gabrielle",
				"Humberto",
				"Imelda",
				"Jerry",
				"Karen",
				"Lorenzo",
				"Melissa",
				"Nestor",
				"Olga",
				"Pablo",
				"Rebekah",
				"Sebastien",
				"Tanya",
				"Van",
				"Wendy"
			],
			"issued": "2019-06-11T21:06:24.000Z",
			"modified": "2026-11-11T15:29:15.954Z",
			"publisher": {
				"name": "Esri"
			},
			"contactPoint": {
				"@type": "vcard:Contact",
				"fn": "esri_livefeeds2",
				"hasEmail": "{{orgContactEmail}}"
			},
			"accessLevel": "public",
			"spatial": "-135.5000,-31.8000,178.8000,34.2000",
			"license": "<img alt='' src='https://downloads.esri.com/blogs/arcgisonline/esrilogo_new.png' /> This work is licensed under the Esri Master License Agreement.<br /><div><a href='https://goto.arcgis.com/termsofuse/viewsummary' target='_blank' rel='nofollow ugc noopener noreferrer'><b>View Summary</b></a> | <a href='https://goto.arcgis.com/termsofuse/viewtermsofuse' target='_blank' rel='nofollow ugc noopener noreferrer'><b>View Terms of Use</b></a></div>",
			"distribution": [
				{
					"@type": "dcat:Distribution",
					"title": "ArcGIS Hub Dataset",
					"format": "Web Page",
					"mediaType": "text/html",
					"accessURL": "https://www.pacificgeoportal.com/datasets/esri2::observed-track-1"
				},
				{
					"@type": "dcat:Distribution",
					"title": "ArcGIS GeoService",
					"format": "ArcGIS GeoServices REST API",
					"mediaType": "application/json",
					"accessURL": "https://services9.arcgis.com/RHVPKKiFTONKtxq3/arcgis/rest/services/Recent_Hurricanes_v1/FeatureServer/1"
				},
				{
					"@type": "dcat:Distribution",
					"title": "CSV",
					"format": "CSV",
					"mediaType": "text/csv",
					"accessURL": "https://www.pacificgeoportal.com/api/download/v1/items/adfe292a67f8471a9d8230ef93294414/csv?layers=1"
				},
				{
					"@type": "dcat:Distribution",
					"title": "Shapefile",
					"format": "ZIP",
					"mediaType": "application/zip",
					"accessURL": "https://www.pacificgeoportal.com/api/download/v1/items/adfe292a67f8471a9d8230ef93294414/shapefile?layers=1"
				},
				{
					"@type": "dcat:Distribution",
					"title": "GeoJSON",
					"format": "GeoJSON",
					"mediaType": "application/vnd.geo+json",
					"accessURL": "https://www.pacificgeoportal.com/api/download/v1/items/adfe292a67f8471a9d8230ef93294414/geojson?layers=1"
				},
				{
					"@type": "dcat:Distribution",
					"title": "KML",
					"format": "KML",
					"mediaType": "application/vnd.google-earth.kml+xml",
					"accessURL": "https://www.pacificgeoportal.com/api/download/v1/items/adfe292a67f8471a9d8230ef93294414/kml?layers=1"
				}
			],
			"theme": [
				"geospatial"
			]
		},
		{
			"@type": "dcat:Dataset",
			"identifier": "https://www.arcgis.com/home/item.html?id=adfe292a67f8471a9d8230ef93294414&sublayer=2",
			"landingPage": "https://www.pacificgeoportal.com/datasets/esri2::observed-wind-swath-1",
			"title": "Observed Wind Swath",
			"description": "<div>This layer features tropical storm (hurricanes, typhoons, cyclones) tracks, positions, and observed wind swaths from the past hurricane season for the Atlantic, Pacific, and Indian Basins. These are products from the&nbsp;<a target='_blank' href='https://www.nhc.noaa.gov/' rel='nofollow ugc noopener noreferrer'>National Hurricane Center</a>&nbsp;(NHC) and&nbsp;<a target='_blank' href='https://www.usno.navy.mil/JTWC/' rel='nofollow ugc noopener noreferrer'>Joint Typhoon Warning Center</a>&nbsp;(JTWC). They are part of an archive of tropical storm data maintained in the <a target='_blank' href='https://www.ncdc.noaa.gov/ibtracs/' rel='nofollow ugc noopener noreferrer'>International Best Track Archive for Climate Stewardship</a> (IBTrACS) database by the <a target='_blank' href='https://www.ncei.noaa.gov/' rel='nofollow ugc noopener noreferrer'>NOAA National Centers for Environmental Information</a>.</div><div>&nbsp;</div><div><strong>Data Source</strong></div><div><ul><li>NOAA National Hurricane Center <a target='_blank' href='https://www.nhc.noaa.gov/gis/archive_besttrack.php' rel='nofollow ugc noopener noreferrer'>tropical cyclone best track archive</a>.</li></ul></div><div>&nbsp;</div><div><strong>Update Frequency</strong></div><div><ul><li>We automatically check these products for updates every 15 minutes from the <a target='_blank' href='https://www.nhc.noaa.gov/gis/' rel='nofollow ugc noopener noreferrer'>NHC GIS Data page</a>.</li><li>The NHC shapefiles are parsed using the <a target='_blank' href='https://www.esriurl.com/LiveFeed' rel='nofollow ugc noopener noreferrer'>Aggregated Live Feeds methodology</a> to take the returned information and serve the data through ArcGIS Server as a map service.</li></ul></div><div>&nbsp;</div><div><strong>Area Covered</strong></div><div><ul><li>World</li></ul></div><div>&nbsp;</div><div><span style='font-size:medium;'><strong>What can you do with this layer?</strong></span></div><div><ul><li>Customize the display of each attribute by using the ‘Change Style’ option for any layer.</li><li>Run a filter to query the layer and display only specific types of storms or areas.</li><li>Add to your map with other weather data layers to provide insight on hazardous weather events.</li><li>Use ArcGIS Online analysis tools like ‘Enrich Data’ on the Observed Wind Swath layer to determine the impact of cyclone events on populations.</li><li>Visualize data in ArcGIS Insights or Operations Dashboards.</li></ul><p>&nbsp;</p><p><span style='color:rgb(128,128,128);'>This map is provided for informational purposes and is not monitored 24/7 for accuracy and currency. Always refer to </span><a target='_blank' href='https://www.nhc.noaa.gov/contact.shtml' rel='nofollow ugc noopener noreferrer'><span style='color:rgb(128,128,128);'>NOAA</span></a><span style='color:rgb(128,128,128);'> or JTWC sources for official guidance.</span></p><p>If you would like to be alerted to potential issues or simply see when this Service will update next, please visit our <a target='_blank' href='https://livingatlas.arcgis.com/livefeeds-status/' rel='nofollow ugc noopener noreferrer'>Live Feed Status</a> Page!</p></div>",
			"keyword": [
				"Esri",
				"NHC",
				"Hurricane",
				"risk",
				"earth observations",
				"climate",
				"hosted",
				"esri_environment",
				"Recent_Hurricanes",
				"Live Feeds",
				"livefeeds",
				"Alvin",
				"Barbara",
				"Cosme",
				"Dalila",
				"Erick",
				"Flossie",
				"Gil",
				"Henriette",
				"Ivo",
				"Juliette",
				"Kiko",
				"Lorena",
				"Mario",
				"Narda",
				"Octave",
				"Priscilla",
				"Raymond",
				"Sonia",
				"Tico",
				"Velma",
				"Wallis",
				"Xina",
				"York",
				"Zelda",
				"Andrea",
				"Barry",
				"Chantal",
				"Dexter",
				"Erin",
				"Fernand",
				"Gabrielle",
				"Humberto",
				"Imelda",
				"Jerry",
				"Karen",
				"Lorenzo",
				"Melissa",
				"Nestor",
				"Olga",
				"Pablo",
				"Rebekah",
				"Sebastien",
				"Tanya",
				"Van",
				"Wendy"
			],
			"issued": "2019-06-11T21:06:24.000Z",
			"modified": "2026-11-11T15:29:15.954Z",
			"publisher": {
				"name": "Esri"
			},
			"contactPoint": {
				"@type": "vcard:Contact",
				"fn": "esri_livefeeds2",
				"hasEmail": "{{orgContactEmail}}"
			},
			"accessLevel": "public",
			"spatial": "-129.7050,14.5583,-92.7439,30.2330",
			"license": "<img alt='' src='https://downloads.esri.com/blogs/arcgisonline/esrilogo_new.png' /> This work is licensed under the Esri Master License Agreement.<br /><div><a href='https://goto.arcgis.com/termsofuse/viewsummary' target='_blank' rel='nofollow ugc noopener noreferrer'><b>View Summary</b></a> | <a href='https://goto.arcgis.com/termsofuse/viewtermsofuse' target='_blank' rel='nofollow ugc noopener noreferrer'><b>View Terms of Use</b></a></div>",
			"distribution": [
				{
					"@type": "dcat:Distribution",
					"title": "ArcGIS Hub Dataset",
					"format": "Web Page",
					"mediaType": "text/html",
					"accessURL": "https://www.pacificgeoportal.com/datasets/esri2::observed-wind-swath-1"
				},
				{
					"@type": "dcat:Distribution",
					"title": "ArcGIS GeoService",
					"format": "ArcGIS GeoServices REST API",
					"mediaType": "application/json",
					"accessURL": "https://services9.arcgis.com/RHVPKKiFTONKtxq3/arcgis/rest/services/Recent_Hurricanes_v1/FeatureServer/2"
				},
				{
					"@type": "dcat:Distribution",
					"title": "CSV",
					"format": "CSV",
					"mediaType": "text/csv",
					"accessURL": "https://www.pacificgeoportal.com/api/download/v1/items/adfe292a67f8471a9d8230ef93294414/csv?layers=2"
				},
				{
					"@type": "dcat:Distribution",
					"title": "Shapefile",
					"format": "ZIP",
					"mediaType": "application/zip",
					"accessURL": "https://www.pacificgeoportal.com/api/download/v1/items/adfe292a67f8471a9d8230ef93294414/shapefile?layers=2"
				},
				{
					"@type": "dcat:Distribution",
					"title": "GeoJSON",
					"format": "GeoJSON",
					"mediaType": "application/vnd.geo+json",
					"accessURL": "https://www.pacificgeoportal.com/api/download/v1/items/adfe292a67f8471a9d8230ef93294414/geojson?layers=2"
				},
				{
					"@type": "dcat:Distribution",
					"title": "KML",
					"format": "KML",
					"mediaType": "application/vnd.google-earth.kml+xml",
					"accessURL": "https://www.pacificgeoportal.com/api/download/v1/items/adfe292a67f8471a9d8230ef93294414/kml?layers=2"
				}
			],
			"theme": [
				"geospatial"
			]
		},
		{
			"@type": "dcat:Dataset",
			"identifier": "https://www.arcgis.com/home/item.html?id=248e7b5827a34b248647afb012c58787",
			"landingPage": "https://www.pacificgeoportal.com/maps/esri2::active-hurricanes-cyclones-and-typhoons",
			"title": "Active Hurricanes, Cyclones and Typhoons",
			"description": "<div>Hurricane tracks and positions provide information on where the storm has been, where it is currently located, and where it is predicted to go. Each storm location is depicted by the sustained wind speed, according to the <a target='_blank' href='https://www.nhc.noaa.gov/aboutsshws.php' rel='nofollow ugc noopener noreferrer'>Saffir-Simpson Scale</a>. It should be noted that the Saffir-Simpson Scale only applies to hurricanes in the Atlantic and Eastern Pacific basins, however all storms are still symbolized using that classification for consistency.</div><div>&nbsp;</div><div><strong>Data Source</strong></div><div><ul><li>This data is provided by <a target='_blank' href='https://www.nhc.noaa.gov/' rel='nofollow ugc noopener noreferrer'>NOAA National Hurricane Center</a> (NHC) for the Central+East Pacific and Atlantic, and the&nbsp;<a target='_blank' href='https://www.metoc.navy.mil/jtwc/jtwc.html' rel='nofollow ugc noopener noreferrer'>Joint Typhoon Warning Center</a>&nbsp;for the West+Central Pacific and Indian basins. For more disaster-related live feeds visit the <a target='_blank' href='https://www.arcgis.com/home/group.html?id=d55ba7a328924596b9fa9d5d1876a970#overview' rel='nofollow ugc noopener noreferrer'>Disaster Web Maps &amp; Feeds ArcGIS Online Group</a>.</li></ul></div><div><strong>Sample Data</strong></div><div><ul><li>See <a target='_blank' href='https://www.arcgis.com/home/item.html?id=0546442443e848a9ae7758fdb98d73f0' rel='nofollow ugc noopener noreferrer'>Sample Layer Item</a> for sample data during inactive Hurricane Season!</li></ul></div><div><strong>Update Frequency</strong></div><div><ul><li><a target='_blank' href='https://www.esriurl.com/LiveFeed' rel='nofollow ugc noopener noreferrer'>The Aggregated Live Feeds methodology</a> checks the Source for updates every 15 minutes. Tropical cyclones are normally issued every six hours at 5:00 AM EDT, 11:00 AM EDT, 5:00 PM EDT, and 11:00 PM EDT (or 4:00 AM EST, 10:00 AM EST, 4:00 PM EST, and 10:00 PM EST).</li><li>Public advisories for Eastern Pacific tropical cyclones are normally issued every six hours at 2:00 AM PDT, 8:00 AM PDT, 2:00 PM PDT, and 8:00 PM PDT (or 1:00 AM PST, 7:00 AM PST, 1:00 PM PST, and 7:00 PM PST).</li><li>Intermediate public advisories may be issued every 3 hours when coastal watches or warnings are in effect, and every 2 hours when coastal watches or warnings are in effect and land-based radars have identified a reliable storm center. Additionally, special public advisories may be issued at any time due to significant changes in warnings or in a cyclone. For the NHC data source you can subscribe to <a target='_blank' href='https://www.nhc.noaa.gov/gis-at.xml' rel='nofollow ugc noopener noreferrer'>RSS Feeds</a>.</li><li>North Pacific and North Indian Ocean tropical cyclone warnings are updated every 6 hours, and South Indian and South Pacific Ocean tropical cyclone warnings are routinely updated every 12 hours. Times are set to Zulu/UTC.</li></ul></div><div><strong>Scale/Resolution</strong></div><div><ul><li>The horizontal accuracy of these datasets is not stated but it is important to remember that tropical cyclone track forecasts are subject to error, and that the effects of a tropical cyclone can span many hundreds of miles from the center.</li></ul></div><div><strong>Area Covered</strong></div><div><ul><li>World</li></ul></div><div><strong>Glossary</strong></div><div><ul><li><i><strong>Forecast location</strong></i>: Represents the official NHC forecast locations for the center of a tropical cyclone. Forecast center positions are given for projections valid 12, 24, 36, 48, 72, 96, and 120 hours after the forecast's nominal initial time.&nbsp;<a target='_blank' href='https://www.nhc.noaa.gov/gis/metadata_ex_point_at.xml' rel='nofollow ugc noopener noreferrer'>Click here for more information</a>. Forecast points from the JTWC are valid 12, 24, 36, 48 and 72 hours after the forecast’s initial time.</li><li><i><strong>Forecast track:</strong></i> This product aids in the visualization of an NHC official track forecast, the forecast points are connected by a red line. The track lines are not a forecast product, as such, the lines should not be interpreted as representing a specific forecast for the location of a tropical cyclone in between official forecast points. It is also important to remember that tropical cyclone track forecasts are subject to error, and that the effects of a tropical cyclone can span many hundreds of miles from the center.&nbsp;<a target='_blank' href='https://www.nhc.noaa.gov/gis/metadata_ex_lines_at.xml' rel='nofollow ugc noopener noreferrer'>Click here for more information</a>.</li><li><i><strong>The Cone of Uncertainty:</strong></i> Cyclone paths are hard to predict with absolute certainty, especially days in advance. The cone represents the probable track of the center of a tropical cyclone and is formed by enclosing the area swept out by a set of circles along the forecast track (at 12, 24, 36 hours, etc). The size of each circle is scaled so that two-thirds of the historical official forecast errors over a 5-year sample fall within the circle. Based on forecasts over the previous 5 years, the entire track of a tropical cyclone can be expected to remain within the cone roughly 60-70% of the time. It is important to note that the area affected by a tropical cyclone can extend well beyond the confines of the cone enclosing the most likely track area of the center.&nbsp;<a target='_blank' href='https://www.nhc.noaa.gov/gis/metadata_ex_cone_at.xml' rel='nofollow ugc noopener noreferrer'>Click here for more information</a>. <strong>Now includes</strong> 'Danger Area' Polygons from JTWC, detailing US Navy Ship Avoidance Area when Wind speeds exceed 34 Knots!</li><li><i><strong>Coastal Watch/Warning:</strong></i> Coastal areas are placed under watches and warnings depending on the proximity and intensity of the approaching storm.<ul><li><i>Tropical Storm Watch</i> is issued when a tropical cyclone containing winds of 34 to 63 knots (39 to 73 mph) or higher poses a possible threat, generally within 48 hours. These winds may be accompanied by storm surge, coastal flooding, and/or river flooding. The watch does not mean that tropical storm conditions will occur. It only means that these conditions are possible.</li><li><i>Tropical Storm Warning</i> is issued when sustained winds of 34 to 63 knots (39 to 73 mph) or higher associated with a tropical cyclone are expected in 36 hours or less. These winds may be accompanied by storm surge, coastal flooding, and/or river flooding.</li><li><i>Hurricane Watch</i> is issued when a tropical cyclone containing winds of 64 knots (74 mph) or higher poses a possible threat, generally within 48 hours. These winds may be accompanied by storm surge, coastal flooding, and/or river flooding. The watch does not mean that hurricane conditions will occur. It only means that these conditions are possible.</li><li><i>Hurricane Warning</i> is issued when sustained winds of 64 knots (74 mph) or higher associated with a tropical cyclone are expected in 36 hours or less. These winds may be accompanied by storm surge, coastal flooding, and/or river flooding. A hurricane warning can remain in effect when dangerously high water or a combination of dangerously high water and exceptionally high waves continue, even though winds may be less than hurricane force.</li></ul></li></ul></div><div><span style='font-size:x-large;'>Revisions</span></div><div><ul><li><strong>Sep 10, 2026</strong>: Adjusted Label on leading Forecast location to accurately reflect 3-hr processing/prep time.</li><li><strong>Aug 31, 2026</strong>: Adjusted ‘Event Label’ to correctly provide abbreviated Time Zone of user's location following Arcade update.</li><li><strong>Jul 23, 2026</strong>: Added ITCDVLP and IDVLBL fields to Forecast Position layer to differentiate storms based on basins.</li><li><strong>Mar 13, 2025</strong>: Altered 'Forecast Error Cone' layer to include 'Danger Area' with updated symbology.</li><li><strong>Nov 20, 2023</strong>: Added Event Label to 'Forecast Position' layer, showing arrival time and wind speed localized to user's location.</li><li><strong>Mar 27, 2022</strong>: Added UID, Max_SS, Max_Wind, Max_Gust, and Max_Label fields to ForecastErrorCone layer.</li></ul></div><div><p><span style='color:rgb(128,128,128);'>This map is provided for informational purposes and is not monitored 24/7 for accuracy and currency. Always refer to </span><a target='_blank' href='https://www.nhc.noaa.gov/contact.shtml' rel='nofollow ugc noopener noreferrer'><span style='color:rgb(128,128,128);'>NOAA</span></a><span style='color:rgb(128,128,128);'> or JTWC sources for official guidance.</span></p><div>&nbsp;</div><p>If you would like to be alerted to potential issues or simply see when this Service will update next, please visit our <a target='_blank' href='https://livingatlas.arcgis.com/livefeeds-status/' rel='nofollow ugc noopener noreferrer'>Live Feed Status</a> Page!</p></div>",
			"keyword": [
				"Esri",
				"NOAA",
				"NHC",
				"CPHC",
				"JTWC",
				"USNO",
				"Hurricane",
				"Typhoon",
				"Cyclone",
				"Weather",
				"Tropical",
				"Forecast",
				"Storm",
				"risk",
				"earth observations",
				"climate",
				"hosted",
				"esri_environment",
				"Active_Hurricanes",
				"Live Feeds",
				"livefeeds",
				"Alvin",
				"Barbara",
				"Cosme",
				"Dalila",
				"Erick",
				"Flossie",
				"Gil",
				"Henriette",
				"Ivo",
				"Juliette",
				"Kiko",
				"Lorena",
				"Mario",
				"Narda",
				"Octave",
				"Priscilla",
				"Raymond",
				"Sonia",
				"Tico",
				"Velma",
				"Wallis",
				"Xina",
				"York",
				"Zelda",
				"Andrea",
				"Barry",
				"Chantal",
				"Dexter",
				"Erin",
				"Fernand",
				"Gabrielle",
				"Humberto",
				"Imelda",
				"Jerry",
				"Karen",
				"Lorenzo",
				"Melissa",
				"Nestor",
				"Olga",
				"Pablo",
				"Rebekah",
				"Sebastien",
				"Tanya",
				"Van",
				"Wendy"
			],
			"issued": "2019-06-11T19:38:21.000Z",
			"modified": "2026-11-11T16:10:51.000Z",
			"publisher": {
				"name": "Esri"
			},
			"contactPoint": {
				"@type": "vcard:Contact",
				"fn": "esri_livefeeds2",
				"hasEmail": "{{orgContactEmail}}"
			},
			"accessLevel": "public",
			"spatial": "-180.0000,-90.0000,180.0000,90.0000",
			"license": "This work is licensed under the Esri Master License Agreement.<br /><div><a href='https://goto.arcgis.com/termsofuse/viewsummary' target='_blank' rel='nofollow ugc noopener noreferrer'><b>View Summary</b></a> | <a href='https://goto.arcgis.com/termsofuse/viewtermsofuse' target='_blank' rel='nofollow ugc noopener noreferrer'><b>View Terms of Use</b></a></div>",
			"distribution": [
				{
					"@type": "dcat:Distribution",
					"title": "ArcGIS Hub Dataset",
					"format": "Web Page",
					"mediaType": "text/html",
					"accessURL": "https://www.pacificgeoportal.com/maps/esri2::active-hurricanes-cyclones-and-typhoons"
				},
				{
					"@type": "dcat:Distribution",
					"title": "ArcGIS GeoService",
					"format": "ArcGIS GeoServices REST API",
					"mediaType": "application/json",
					"accessURL": "https://services9.arcgis.com/RHVPKKiFTONKtxq3/arcgis/rest/services/Active_Hurricanes_v1/FeatureServer"
				}
			],
			"theme": [
				"geospatial"
			]
		},
		{
			"@type": "dcat:Dataset",
			"identifier": "https://www.arcgis.com/home/item.html?id=248e7b5827a34b248647afb012c58787&sublayer=0",
			"landingPage": "https://www.pacificgeoportal.com/datasets/esri2::forecast-position",
			"title": "Forecast Position",
			"description": "<div>Hurricane tracks and positions provide information on where the storm has been, where it is currently located, and where it is predicted to go. Each storm location is depicted by the sustained wind speed, according to the <a target='_blank' href='https://www.nhc.noaa.gov/aboutsshws.php' rel='nofollow ugc noopener noreferrer'>Saffir-Simpson Scale</a>. It should be noted that the Saffir-Simpson Scale only applies to hurricanes in the Atlantic and Eastern Pacific basins, however all storms are still symbolized using that classification for consistency.</div><div>&nbsp;</div><div><strong>Data Source</strong></div><div><ul><li>This data is provided by <a target='_blank' href='https://www.nhc.noaa.gov/' rel='nofollow ugc noopener noreferrer'>NOAA National Hurricane Center</a> (NHC) for the Central+East Pacific and Atlantic, and the&nbsp;<a target='_blank' href='https://www.metoc.navy.mil/jtwc/jtwc.html' rel='nofollow ugc noopener noreferrer'>Joint Typhoon Warning Center</a>&nbsp;for the West+Central Pacific and Indian basins. For more disaster-related live feeds visit the <a target='_blank' href='https://www.arcgis.com/home/group.html?id=d55ba7a328924596b9fa9d5d1876a970#overview' rel='nofollow ugc noopener noreferrer'>Disaster Web Maps &amp; Feeds ArcGIS Online Group</a>.</li></ul></div><div><strong>Sample Data</strong></div><div><ul><li>See <a target='_blank' href='https://www.arcgis.com/home/item.html?id=0546442443e848a9ae7758fdb98d73f0' rel='nofollow ugc noopener noreferrer'>Sample Layer Item</a> for sample data during inactive Hurricane Season!</li></ul></div><div><strong>Update Frequency</strong></div><div><ul><li><a target='_blank' href='https://www.esriurl.com/LiveFeed' rel='nofollow ugc noopener noreferrer'>The Aggregated Live Feeds methodology</a> checks the Source for updates every 15 minutes. Tropical cyclones are normally issued every six hours at 5:00 AM EDT, 11:00 AM EDT, 5:00 PM EDT, and 11:00 PM EDT (or 4:00 AM EST, 10:00 AM EST, 4:00 PM EST, and 10:00 PM EST).</li><li>Public advisories for Eastern Pacific tropical cyclones are normally issued every six hours at 2:00 AM PDT, 8:00 AM PDT, 2:00 PM PDT, and 8:00 PM PDT (or 1:00 AM PST, 7:00 AM PST, 1:00 PM PST, and 7:00 PM PST).</li><li>Intermediate public advisories may be issued every 3 hours when coastal watches or warnings are in effect, and every 2 hours when coastal watches or warnings are in effect and land-based radars have identified a reliable storm center. Additionally, special public advisories may be issued at any time due to significant changes in warnings or in a cyclone. For the NHC data source you can subscribe to <a target='_blank' href='https://www.nhc.noaa.gov/gis-at.xml' rel='nofollow ugc noopener noreferrer'>RSS Feeds</a>.</li><li>North Pacific and North Indian Ocean tropical cyclone warnings are updated every 6 hours, and South Indian and South Pacific Ocean tropical cyclone warnings are routinely updated every 12 hours. Times are set to Zulu/UTC.</li></ul></div><div><strong>Scale/Resolution</strong></div><div><ul><li>The horizontal accuracy of these datasets is not stated but it is important to remember that tropical cyclone track forecasts are subject to error, and that the effects of a tropical cyclone can span many hundreds of miles from the center.</li></ul></div><div><strong>Area Covered</strong></div><div><ul><li>World</li></ul></div><div><strong>Glossary</strong></div><div><ul><li><i><strong>Forecast location</strong></i>: Represents the official NHC forecast locations for the center of a tropical cyclone. Forecast center positions are given for projections valid 12, 24, 36, 48, 72, 96, and 120 hours after the forecast's nominal initial time.&nbsp;<a target='_blank' href='https://www.nhc.noaa.gov/gis/metadata_ex_point_at.xml' rel='nofollow ugc noopener noreferrer'>Click here for more information</a>. Forecast points from the JTWC are valid 12, 24, 36, 48 and 72 hours after the forecast’s initial time.</li><li><i><strong>Forecast track:</strong></i> This product aids in the visualization of an NHC official track forecast, the forecast points are connected by a red line. The track lines are not a forecast product, as such, the lines should not be interpreted as representing a specific forecast for the location of a tropical cyclone in between official forecast points. It is also important to remember that tropical cyclone track forecasts are subject to error, and that the effects of a tropical cyclone can span many hundreds of miles from the center.&nbsp;<a target='_blank' href='https://www.nhc.noaa.gov/gis/metadata_ex_lines_at.xml' rel='nofollow ugc noopener noreferrer'>Click here for more information</a>.</li><li><i><strong>The Cone of Uncertainty:</strong></i> Cyclone paths are hard to predict with absolute certainty, especially days in advance. The cone represents the probable track of the center of a tropical cyclone and is formed by enclosing the area swept out by a set of circles along the forecast track (at 12, 24, 36 hours, etc). The size of each circle is scaled so that two-thirds of the historical official forecast errors over a 5-year sample fall within the circle. Based on forecasts over the previous 5 years, the entire track of a tropical cyclone can be expected to remain within the cone roughly 60-70% of the time. It is important to note that the area affected by a tropical cyclone can extend well beyond the confines of the cone enclosing the most likely track area of the center.&nbsp;<a target='_blank' href='https://www.nhc.noaa.gov/gis/metadata_ex_cone_at.xml' rel='nofollow ugc noopener noreferrer'>Click here for more information</a>. <strong>Now includes</strong> 'Danger Area' Polygons from JTWC, detailing US Navy Ship Avoidance Area when Wind speeds exceed 34 Knots!</li><li><i><strong>Coastal Watch/Warning:</strong></i> Coastal areas are placed under watches and warnings depending on the proximity and intensity of the approaching storm.<ul><li><i>Tropical Storm Watch</i> is issued when a tropical cyclone containing winds of 34 to 63 knots (39 to 73 mph) or higher poses a possible threat, generally within 48 hours. These winds may be accompanied by storm surge, coastal flooding, and/or river flooding. The watch does not mean that tropical storm conditions will occur. It only means that these conditions are possible.</li><li><i>Tropical Storm Warning</i> is issued when sustained winds of 34 to 63 knots (39 to 73 mph) or higher associated with a tropical cyclone are expected in 36 hours or less. These winds may be accompanied by storm surge, coastal flooding, and/or river flooding.</li><li><i>Hurricane Watch</i> is issued when a tropical cyclone containing winds of 64 knots (74 mph) or higher poses a possible threat, generally within 48 hours. These winds may be accompanied by storm surge, coastal flooding, and/or river flooding. The watch does not mean that hurricane conditions will occur. It only means that these conditions are possible.</li><li><i>Hurricane Warning</i> is issued when sustained winds of 64 knots (74 mph) or higher associated with a tropical cyclone are expected in 36 hours or less. These winds may be accompanied by storm surge, coastal flooding, and/or river flooding. A hurricane warning can remain in effect when dangerously high water or a combination of dangerously high water and exceptionally high waves continue, even though winds may be less than hurricane force.</li></ul></li></ul></div><div><span style='font-size:x-large;'>Revisions</span></div><div><ul><li><strong>Sep 10, 2026</strong>: Adjusted Label on leading Forecast location to accurately reflect 3-hr processing/prep time.</li><li><strong>Aug 31, 2026</strong>: Adjusted ‘Event Label’ to correctly provide abbreviated Time Zone of user's location following Arcade update.</li><li><strong>Jul 23, 2026</strong>: Added ITCDVLP and IDVLBL fields to Forecast Position layer to differentiate storms based on basins.</li><li><strong>Mar 13, 2025</strong>: Altered 'Forecast Error Cone' layer to include 'Danger Area' with updated symbology.</li><li><strong>Nov 20, 2023</strong>: Added Event Label to 'Forecast Position' layer, showing arrival time and wind speed localized to user's location.</li><li><strong>Mar 27, 2022</strong>: Added UID, Max_SS, Max_Wind, Max_Gust, and Max_Label fields to ForecastErrorCone layer.</li></ul></div><div><p><span style='color:rgb(128,128,128);'>This map is provided for informational purposes and is not monitored 24/7 for accuracy and currency. Always refer to </span><a target='_blank' href='https://www.nhc.noaa.gov/contact.shtml' rel='nofollow ugc noopener noreferrer'><span style='color:rgb(128,128,128);'>NOAA</span></a><span style='color:rgb(128,128,128);'> or JTWC sources for official guidance.</span></p><div>&nbsp;</div><p>If you would like to be alerted to potential issues or simply see when this Service will update next, please visit our <a target='_blank' href='https://livingatlas.arcgis.com/livefeeds-status/' rel='nofollow ugc noopener noreferrer'>Live Feed Status</a> Page!</p></div>",
			"keyword": [
				"Esri",
				"NOAA",
				"NHC",
				"CPHC",
				"JTWC",
				"USNO",
				"Hurricane",
				"Typhoon",
				"Cyclone",
				"Weather",
				"Tropical",
				"Forecast",
				"Storm",
				"risk",
				"earth observations",
				"climate",
				"hosted",
				"esri_environment",
				"Active_Hurricanes",
				"Live Feeds",
				"livefeeds",
				"Alvin",
				"Barbara",
				"Cosme",
				"Dalila",
				"Erick",
				"Flossie",
				"Gil",
				"Henriette",
				"Ivo",
				"Juliette",
				"Kiko",
				"Lorena",
				"Mario",
				"Narda",
				"Octave",
				"Priscilla",
				"Raymond",
				"Sonia",
				"Tico",
				"Velma",
				"Wallis",
				"Xina",
				"York",
				"Zelda",
				"Andrea",
				"Barry",
				"Chantal",
				"Dexter",
				"Erin",
				"Fernand",
				"Gabrielle",
				"Humberto",
				"Imelda",
				"Jerry",
				"Karen",
				"Lorenzo",
				"Melissa",
				"Nestor",
				"Olga",
				"Pablo",
				"Rebekah",
				"Sebastien",
				"Tanya",
				"Van",
				"Wendy"
			],
			"issued": "2019-06-11T19:38:21.000Z",
			"modified": "2026-11-11T15:27:59.635Z",
			"publisher": {
				"name": "Esri"
			},
			"contactPoint": {
				"@type": "vcard:Contact",
				"fn": "esri_livefeeds2",
				"hasEmail": "{{orgContactEmail}}"
			},
			"accessLevel": "public",
			"spatial": "117.1000,19.2000,128.8000,33.6000",
			"license": "This work is licensed under the Esri Master License Agreement.<br /><div><a href='https://goto.arcgis.com/termsofuse/viewsummary' target='_blank' rel='nofollow ugc noopener noreferrer'><b>View Summary</b></a> | <a href='https://goto.arcgis.com/termsofuse/viewtermsofuse' target='_blank' rel='nofollow ugc noopener noreferrer'><b>View Terms of Use</b></a></div>",
			"distribution": [
				{
					"@type": "dcat:Distribution",
					"title": "ArcGIS Hub Dataset",
					"format": "Web Page",
					"mediaType": "text/html",
					"accessURL": "https://www.pacificgeoportal.com/datasets/esri2::forecast-position"
				},
				{
					"@type": "dcat:Distribution",
					"title": "ArcGIS GeoService",
					"format": "ArcGIS GeoServices REST API",
					"mediaType": "application/json",
					"accessURL": "https://services9.arcgis.com/RHVPKKiFTONKtxq3/arcgis/rest/services/Active_Hurricanes_v1/FeatureServer/0"
				},
				{
					"@type": "dcat:Distribution",
					"title": "CSV",
					"format": "CSV",
					"mediaType": "text/csv",
					"accessURL": "https://www.pacificgeoportal.com/api/download/v1/items/248e7b5827a34b248647afb012c58787/csv?layers=0"
				},
				{
					"@type": "dcat:Distribution",
					"title": "Shapefile",
					"format": "ZIP",
					"mediaType": "application/zip",
					"accessURL": "https://www.pacificgeoportal.com/api/download/v1/items/248e7b5827a34b248647afb012c58787/shapefile?layers=0"
				},
				{
					"@type": "dcat:Distribution",
					"title": "GeoJSON",
					"format": "GeoJSON",
					"mediaType": "application/vnd.geo+json",
					"accessURL": "https://www.pacificgeoportal.com/api/download/v1/items/248e7b5827a34b248647afb012c58787/geojson?layers=0"
				},
				{
					"@type": "dcat:Distribution",
					"title": "KML",
					"format": "KML",
					"mediaType": "application/vnd.google-earth.kml+xml",
					"accessURL": "https://www.pacificgeoportal.com/api/download/v1/items/248e7b5827a34b248647afb012c58787/kml?layers=0"
				},
				{
					"@type": "dcat:Distribution",
					"title": "File Geodatabase",
					"format": "ZIP",
					"mediaType": "application/zip",
					"accessURL": "https://www.pacificgeoportal.com/api/download/v1/items/248e7b5827a34b248647afb012c58787/filegdb?layers=0"
				},
				{
					"@type": "dcat:Distribution",
					"title": "Feature Collection",
					"format": "TXT",
					"mediaType": "text/plain",
					"accessURL": "https://www.pacificgeoportal.com/api/download/v1/items/248e7b5827a34b248647afb012c58787/featureCollection?layers=0"
				},
				{
					"@type": "dcat:Distribution",
					"title": "Excel",
					"format": "XLSX",
					"mediaType": "application/vnd.ms-excel",
					"accessURL": "https://www.pacificgeoportal.com/api/download/v1/items/248e7b5827a34b248647afb012c58787/excel?layers=0"
				},
				{
					"@type": "dcat:Distribution",
					"title": "GeoPackage",
					"format": "GPKG",
					"mediaType": "application/geopackage+sqlite3",
					"accessURL": "https://www.pacificgeoportal.com/api/download/v1/items/248e7b5827a34b248647afb012c58787/geoPackage?layers=0"
				},
				{
					"@type": "dcat:Distribution",
					"title": "SQLite Geodatabase",
					"format": "GDB",
					"mediaType": "application/geopackage+sqlite3",
					"accessURL": "https://www.pacificgeoportal.com/api/download/v1/items/248e7b5827a34b248647afb012c58787/sqlite?layers=0"
				}
			],
			"theme": [
				"geospatial"
			]
		},
		{
			"@type": "dcat:Dataset",
			"identifier": "https://www.arcgis.com/home/item.html?id=248e7b5827a34b248647afb012c58787&sublayer=1",
			"landingPage": "https://www.pacificgeoportal.com/datasets/esri2::observed-position",
			"title": "Observed Position",
			"description": "<div>Hurricane tracks and positions provide information on where the storm has been, where it is currently located, and where it is predicted to go. Each storm location is depicted by the sustained wind speed, according to the <a target='_blank' href='https://www.nhc.noaa.gov/aboutsshws.php' rel='nofollow ugc noopener noreferrer'>Saffir-Simpson Scale</a>. It should be noted that the Saffir-Simpson Scale only applies to hurricanes in the Atlantic and Eastern Pacific basins, however all storms are still symbolized using that classification for consistency.</div><div>&nbsp;</div><div><strong>Data Source</strong></div><div><ul><li>This data is provided by <a target='_blank' href='https://www.nhc.noaa.gov/' rel='nofollow ugc noopener noreferrer'>NOAA National Hurricane Center</a> (NHC) for the Central+East Pacific and Atlantic, and the&nbsp;<a target='_blank' href='https://www.metoc.navy.mil/jtwc/jtwc.html' rel='nofollow ugc noopener noreferrer'>Joint Typhoon Warning Center</a>&nbsp;for the West+Central Pacific and Indian basins. For more disaster-related live feeds visit the <a target='_blank' href='https://www.arcgis.com/home/group.html?id=d55ba7a328924596b9fa9d5d1876a970#overview' rel='nofollow ugc noopener noreferrer'>Disaster Web Maps &amp; Feeds ArcGIS Online Group</a>.</li></ul></div><div><strong>Sample Data</strong></div><div><ul><li>See <a target='_blank' href='https://www.arcgis.com/home/item.html?id=0546442443e848a9ae7758fdb98d73f0' rel='nofollow ugc noopener noreferrer'>Sample Layer Item</a> for sample data during inactive Hurricane Season!</li></ul></div><div><strong>Update Frequency</strong></div><div><ul><li><a target='_blank' href='https://www.esriurl.com/LiveFeed' rel='nofollow ugc noopener noreferrer'>The Aggregated Live Feeds methodology</a> checks the Source for updates every 15 minutes. Tropical cyclones are normally issued every six hours at 5:00 AM EDT, 11:00 AM EDT, 5:00 PM EDT, and 11:00 PM EDT (or 4:00 AM EST, 10:00 AM EST, 4:00 PM EST, and 10:00 PM EST).</li><li>Public advisories for Eastern Pacific tropical cyclones are normally issued every six hours at 2:00 AM PDT, 8:00 AM PDT, 2:00 PM PDT, and 8:00 PM PDT (or 1:00 AM PST, 7:00 AM PST, 1:00 PM PST, and 7:00 PM PST).</li><li>Intermediate public advisories may be issued every 3 hours when coastal watches or warnings are in effect, and every 2 hours when coastal watches or warnings are in effect and land-based radars have identified a reliable storm center. Additionally, special public advisories may be issued at any time due to significant changes in warnings or in a cyclone. For the NHC data source you can subscribe to <a target='_blank' href='https://www.nhc.noaa.gov/gis-at.xml' rel='nofollow ugc noopener noreferrer'>RSS Feeds</a>.</li><li>North Pacific and North Indian Ocean tropical cyclone warnings are updated every 6 hours, and South Indian and South Pacific Ocean tropical cyclone warnings are routinely updated every 12 hours. Times are set to Zulu/UTC.</li></ul></div><div><strong>Scale/Resolution</strong></div><div><ul><li>The horizontal accuracy of these datasets is not stated but it is important to remember that tropical cyclone track forecasts are subject to error, and that the effects of a tropical cyclone can span many hundreds of miles from the center.</li></ul></div><div><strong>Area Covered</strong></div><div><ul><li>World</li></ul></div><div><strong>Glossary</strong></div><div><ul><li><i><strong>Forecast location</strong></i>: Represents the official NHC forecast locations for the center of a tropical cyclone. Forecast center positions are given for projections valid 12, 24, 36, 48, 72, 96, and 120 hours after the forecast's nominal initial time.&nbsp;<a target='_blank' href='https://www.nhc.noaa.gov/gis/metadata_ex_point_at.xml' rel='nofollow ugc noopener noreferrer'>Click here for more information</a>. Forecast points from the JTWC are valid 12, 24, 36, 48 and 72 hours after the forecast’s initial time.</li><li><i><strong>Forecast track:</strong></i> This product aids in the visualization of an NHC official track forecast, the forecast points are connected by a red line. The track lines are not a forecast product, as such, the lines should not be interpreted as representing a specific forecast for the location of a tropical cyclone in between official forecast points. It is also important to remember that tropical cyclone track forecasts are subject to error, and that the effects of a tropical cyclone can span many hundreds of miles from the center.&nbsp;<a target='_blank' href='https://www.nhc.noaa.gov/gis/metadata_ex_lines_at.xml' rel='nofollow ugc noopener noreferrer'>Click here for more information</a>.</li><li><i><strong>The Cone of Uncertainty:</strong></i> Cyclone paths are hard to predict with absolute certainty, especially days in advance. The cone represents the probable track of the center of a tropical cyclone and is formed by enclosing the area swept out by a set of circles along the forecast track (at 12, 24, 36 hours, etc). The size of each circle is scaled so that two-thirds of the historical official forecast errors over a 5-year sample fall within the circle. Based on forecasts over the previous 5 years, the entire track of a tropical cyclone can be expected to remain within the cone roughly 60-70% of the time. It is important to note that the area affected by a tropical cyclone can extend well beyond the confines of the cone enclosing the most likely track area of the center.&nbsp;<a target='_blank' href='https://www.nhc.noaa.gov/gis/metadata_ex_cone_at.xml' rel='nofollow ugc noopener noreferrer'>Click here for more information</a>. <strong>Now includes</strong> 'Danger Area' Polygons from JTWC, detailing US Navy Ship Avoidance Area when Wind speeds exceed 34 Knots!</li><li><i><strong>Coastal Watch/Warning:</strong></i> Coastal areas are placed under watches and warnings depending on the proximity and intensity of the approaching storm.<ul><li><i>Tropical Storm Watch</i> is issued when a tropical cyclone containing winds of 34 to 63 knots (39 to 73 mph) or higher poses a possible threat, generally within 48 hours. These winds may be accompanied by storm surge, coastal flooding, and/or river flooding. The watch does not mean that tropical storm conditions will occur. It only means that these conditions are possible.</li><li><i>Tropical Storm Warning</i> is issued when sustained winds of 34 to 63 knots (39 to 73 mph) or higher associated with a tropical cyclone are expected in 36 hours or less. These winds may be accompanied by storm surge, coastal flooding, and/or river flooding.</li><li><i>Hurricane Watch</i> is issued when a tropical cyclone containing winds of 64 knots (74 mph) or higher poses a possible threat, generally within 48 hours. These winds may be accompanied by storm surge, coastal flooding, and/or river flooding. The watch does not mean that hurricane conditions will occur. It only means that these conditions are possible.</li><li><i>Hurricane Warning</i> is issued when sustained winds of 64 knots (74 mph) or higher associated with a tropical cyclone are expected in 36 hours or less. These winds may be accompanied by storm surge, coastal flooding, and/or river flooding. A hurricane warning can remain in effect when dangerously high water or a combination of dangerously high water and exceptionally high waves continue, even though winds may be less than hurricane force.</li></ul></li></ul></div><div><span style='font-size:x-large;'>Revisions</span></div><div><ul><li><strong>Sep 10, 2026</strong>: Adjusted Label on leading Forecast location to accurately reflect 3-hr processing/prep time.</li><li><strong>Aug 31, 2026</strong>: Adjusted ‘Event Label’ to correctly provide abbreviated Time Zone of user's location following Arcade update.</li><li><strong>Jul 23, 2026</strong>: Added ITCDVLP and IDVLBL fields to Forecast Position layer to differentiate storms based on basins.</li><li><strong>Mar 13, 2025</strong>: Altered 'Forecast Error Cone' layer to include 'Danger Area' with updated symbology.</li><li><strong>Nov 20, 2023</strong>: Added Event Label to 'Forecast Position' layer, showing arrival time and wind speed localized to user's location.</li><li><strong>Mar 27, 2022</strong>: Added UID, Max_SS, Max_Wind, Max_Gust, and Max_Label fields to ForecastErrorCone layer.</li></ul></div><div><p><span style='color:rgb(128,128,128);'>This map is provided for informational purposes and is not monitored 24/7 for accuracy and currency. Always refer to </span><a target='_blank' href='https://www.nhc.noaa.gov/contact.shtml' rel='nofollow ugc noopener noreferrer'><span style='color:rgb(128,128,128);'>NOAA</span></a><span style='color:rgb(128,128,128);'> or JTWC sources for official guidance.</span></p><div>&nbsp;</div><p>If you would like to be alerted to potential issues or simply see when this Service will update next, please visit our <a target='_blank' href='https://livingatlas.arcgis.com/livefeeds-status/' rel='nofollow ugc noopener noreferrer'>Live Feed Status</a> Page!</p></div>",
			"keyword": [
				"Esri",
				"NOAA",
				"NHC",
				"CPHC",
				"JTWC",
				"USNO",
				"Hurricane",
				"Typhoon",
				"Cyclone",
				"Weather",
				"Tropical",
				"Forecast",
				"Storm",
				"risk",
				"earth observations",
				"climate",
				"hosted",
				"esri_environment",
				"Active_Hurricanes",
				"Live Feeds",
				"livefeeds",
				"Alvin",
				"Barbara",
				"Cosme",
				"Dalila",
				"Erick",
				"Flossie",
				"Gil",
				"Henriette",
				"Ivo",
				"Juliette",
				"Kiko",
				"Lorena",
				"Mario",
				"Narda",
				"Octave",
				"Priscilla",
				"Raymond",
				"Sonia",
				"Tico",
				"Velma",
				"Wallis",
				"Xina",
				"York",
				"Zelda",
				"Andrea",
				"Barry",
				"Chantal",
				"Dexter",
				"Erin",
				"Fernand",
				"Gabrielle",
				"Humberto",
				"Imelda",
				"Jerry",
				"Karen",
				"Lorenzo",
				"Melissa",
				"Nestor",
				"Olga",
				"Pablo",
				"Rebekah",
				"Sebastien",
				"Tanya",
				"Van",
				"Wendy"
			],
			"issued": "2019-06-11T19:38:21.000Z",
			"modified": "2026-11-11T15:27:59.635Z",
			"publisher": {
				"name": "Esri"
			},
			"contactPoint": {
				"@type": "vcard:Contact",
				"fn": "esri_livefeeds2",
				"hasEmail": "{{orgContactEmail}}"
			},
			"accessLevel": "public",
			"spatial": "129.0000,3.9000,167.9000,18.7000",
			"license": "This work is licensed under the Esri Master License Agreement.<br /><div><a href='https://goto.arcgis.com/termsofuse/viewsummary' target='_blank' rel='nofollow ugc noopener noreferrer'><b>View Summary</b></a> | <a href='https://goto.arcgis.com/termsofuse/viewtermsofuse' target='_blank' rel='nofollow ugc noopener noreferrer'><b>View Terms of Use</b></a></div>",
			"distribution": [
				{
					"@type": "dcat:Distribution",
					"title": "ArcGIS Hub Dataset",
					"format": "Web Page",
					"mediaType": "text/html",
					"accessURL": "https://www.pacificgeoportal.com/datasets/esri2::observed-position"
				},
				{
					"@type": "dcat:Distribution",
					"title": "ArcGIS GeoService",
					"format": "ArcGIS GeoServices REST API",
					"mediaType": "application/json",
					"accessURL": "https://services9.arcgis.com/RHVPKKiFTONKtxq3/arcgis/rest/services/Active_Hurricanes_v1/FeatureServer/1"
				},
				{
					"@type": "dcat:Distribution",
					"title": "CSV",
					"format": "CSV",
					"mediaType": "text/csv",
					"accessURL": "https://www.pacificgeoportal.com/api/download/v1/items/248e7b5827a34b248647afb012c58787/csv?layers=1"
				},
				{
					"@type": "dcat:Distribution",
					"title": "Shapefile",
					"format": "ZIP",
					"mediaType": "application/zip",
					"accessURL": "https://www.pacificgeoportal.com/api/download/v1/items/248e7b5827a34b248647afb012c58787/shapefile?layers=1"
				},
				{
					"@type": "dcat:Distribution",
					"title": "GeoJSON",
					"format": "GeoJSON",
					"mediaType": "application/vnd.geo+json",
					"accessURL": "https://www.pacificgeoportal.com/api/download/v1/items/248e7b5827a34b248647afb012c58787/geojson?layers=1"
				},
				{
					"@type": "dcat:Distribution",
					"title": "KML",
					"format": "KML",
					"mediaType": "application/vnd.google-earth.kml+xml",
					"accessURL": "https://www.pacificgeoportal.com/api/download/v1/items/248e7b5827a34b248647afb012c58787/kml?layers=1"
				},
				{
					"@type": "dcat:Distribution",
					"title": "File Geodatabase",
					"format": "ZIP",
					"mediaType": "application/zip",
					"accessURL": "https://www.pacificgeoportal.com/api/download/v1/items/248e7b5827a34b248647afb012c58787/filegdb?layers=1"
				},
				{
					"@type": "dcat:Distribution",
					"title": "Feature Collection",
					"format": "TXT",
					"mediaType": "text/plain",
					"accessURL": "https://www.pacificgeoportal.com/api/download/v1/items/248e7b5827a34b248647afb012c58787/featureCollection?layers=1"
				},
				{
					"@type": "dcat:Distribution",
					"title": "Excel",
					"format": "XLSX",
					"mediaType": "application/vnd.ms-excel",
					"accessURL": "https://www.pacificgeoportal.com/api/download/v1/items/248e7b5827a34b248647afb012c58787/excel?layers=1"
				},
				{
					"@type": "dcat:Distribution",
					"title": "GeoPackage",
					"format": "GPKG",
					"mediaType": "application/geopackage+sqlite3",
					"accessURL": "https://www.pacificgeoportal.com/api/download/v1/items/248e7b5827a34b248647afb012c58787/geoPackage?layers=1"
				},
				{
					"@type": "dcat:Distribution",
					"title": "SQLite Geodatabase",
					"format": "GDB",
					"mediaType": "application/geopackage+sqlite3",
					"accessURL": "https://www.pacificgeoportal.com/api/download/v1/items/248e7b5827a34b248647afb012c58787/sqlite?layers=1"
				}
			],
			"theme": [
				"geospatial"
			]
		},
		{
			"@type": "dcat:Dataset",
			"identifier": "https://www.arcgis.com/home/item.html?id=248e7b5827a34b248647afb012c58787&sublayer=10",
			"landingPage": "https://www.pacificgeoportal.com/datasets/esri2::raw-1-10th-degree-data-all",
			"title": "Raw 1/10th Degree Data (All)",
			"description": "<div>Hurricane tracks and positions provide information on where the storm has been, where it is currently located, and where it is predicted to go. Each storm location is depicted by the sustained wind speed, according to the <a target='_blank' href='https://www.nhc.noaa.gov/aboutsshws.php' rel='nofollow ugc noopener noreferrer'>Saffir-Simpson Scale</a>. It should be noted that the Saffir-Simpson Scale only applies to hurricanes in the Atlantic and Eastern Pacific basins, however all storms are still symbolized using that classification for consistency.</div><div>&nbsp;</div><div><strong>Data Source</strong></div><div><ul><li>This data is provided by <a target='_blank' href='https://www.nhc.noaa.gov/' rel='nofollow ugc noopener noreferrer'>NOAA National Hurricane Center</a> (NHC) for the Central+East Pacific and Atlantic, and the&nbsp;<a target='_blank' href='https://www.metoc.navy.mil/jtwc/jtwc.html' rel='nofollow ugc noopener noreferrer'>Joint Typhoon Warning Center</a>&nbsp;for the West+Central Pacific and Indian basins. For more disaster-related live feeds visit the <a target='_blank' href='https://www.arcgis.com/home/group.html?id=d55ba7a328924596b9fa9d5d1876a970#overview' rel='nofollow ugc noopener noreferrer'>Disaster Web Maps &amp; Feeds ArcGIS Online Group</a>.</li></ul></div><div><strong>Sample Data</strong></div><div><ul><li>See <a target='_blank' href='https://www.arcgis.com/home/item.html?id=0546442443e848a9ae7758fdb98d73f0' rel='nofollow ugc noopener noreferrer'>Sample Layer Item</a> for sample data during inactive Hurricane Season!</li></ul></div><div><strong>Update Frequency</strong></div><div><ul><li><a target='_blank' href='https://www.esriurl.com/LiveFeed' rel='nofollow ugc noopener noreferrer'>The Aggregated Live Feeds methodology</a> checks the Source for updates every 15 minutes. Tropical cyclones are normally issued every six hours at 5:00 AM EDT, 11:00 AM EDT, 5:00 PM EDT, and 11:00 PM EDT (or 4:00 AM EST, 10:00 AM EST, 4:00 PM EST, and 10:00 PM EST).</li><li>Public advisories for Eastern Pacific tropical cyclones are normally issued every six hours at 2:00 AM PDT, 8:00 AM PDT, 2:00 PM PDT, and 8:00 PM PDT (or 1:00 AM PST, 7:00 AM PST, 1:00 PM PST, and 7:00 PM PST).</li><li>Intermediate public advisories may be issued every 3 hours when coastal watches or warnings are in effect, and every 2 hours when coastal watches or warnings are in effect and land-based radars have identified a reliable storm center. Additionally, special public advisories may be issued at any time due to significant changes in warnings or in a cyclone. For the NHC data source you can subscribe to <a target='_blank' href='https://www.nhc.noaa.gov/gis-at.xml' rel='nofollow ugc noopener noreferrer'>RSS Feeds</a>.</li><li>North Pacific and North Indian Ocean tropical cyclone warnings are updated every 6 hours, and South Indian and South Pacific Ocean tropical cyclone warnings are routinely updated every 12 hours. Times are set to Zulu/UTC.</li></ul></div><div><strong>Scale/Resolution</strong></div><div><ul><li>The horizontal accuracy of these datasets is not stated but it is important to remember that tropical cyclone track forecasts are subject to error, and that the effects of a tropical cyclone can span many hundreds of miles from the center.</li></ul></div><div><strong>Area Covered</strong></div><div><ul><li>World</li></ul></div><div><strong>Glossary</strong></div><div><ul><li><i><strong>Forecast location</strong></i>: Represents the official NHC forecast locations for the center of a tropical cyclone. Forecast center positions are given for projections valid 12, 24, 36, 48, 72, 96, and 120 hours after the forecast's nominal initial time.&nbsp;<a target='_blank' href='https://www.nhc.noaa.gov/gis/metadata_ex_point_at.xml' rel='nofollow ugc noopener noreferrer'>Click here for more information</a>. Forecast points from the JTWC are valid 12, 24, 36, 48 and 72 hours after the forecast’s initial time.</li><li><i><strong>Forecast track:</strong></i> This product aids in the visualization of an NHC official track forecast, the forecast points are connected by a red line. The track lines are not a forecast product, as such, the lines should not be interpreted as representing a specific forecast for the location of a tropical cyclone in between official forecast points. It is also important to remember that tropical cyclone track forecasts are subject to error, and that the effects of a tropical cyclone can span many hundreds of miles from the center.&nbsp;<a target='_blank' href='https://www.nhc.noaa.gov/gis/metadata_ex_lines_at.xml' rel='nofollow ugc noopener noreferrer'>Click here for more information</a>.</li><li><i><strong>The Cone of Uncertainty:</strong></i> Cyclone paths are hard to predict with absolute certainty, especially days in advance. The cone represents the probable track of the center of a tropical cyclone and is formed by enclosing the area swept out by a set of circles along the forecast track (at 12, 24, 36 hours, etc). The size of each circle is scaled so that two-thirds of the historical official forecast errors over a 5-year sample fall within the circle. Based on forecasts over the previous 5 years, the entire track of a tropical cyclone can be expected to remain within the cone roughly 60-70% of the time. It is important to note that the area affected by a tropical cyclone can extend well beyond the confines of the cone enclosing the most likely track area of the center.&nbsp;<a target='_blank' href='https://www.nhc.noaa.gov/gis/metadata_ex_cone_at.xml' rel='nofollow ugc noopener noreferrer'>Click here for more information</a>. <strong>Now includes</strong> 'Danger Area' Polygons from JTWC, detailing US Navy Ship Avoidance Area when Wind speeds exceed 34 Knots!</li><li><i><strong>Coastal Watch/Warning:</strong></i> Coastal areas are placed under watches and warnings depending on the proximity and intensity of the approaching storm.<ul><li><i>Tropical Storm Watch</i> is issued when a tropical cyclone containing winds of 34 to 63 knots (39 to 73 mph) or higher poses a possible threat, generally within 48 hours. These winds may be accompanied by storm surge, coastal flooding, and/or river flooding. The watch does not mean that tropical storm conditions will occur. It only means that these conditions are possible.</li><li><i>Tropical Storm Warning</i> is issued when sustained winds of 34 to 63 knots (39 to 73 mph) or higher associated with a tropical cyclone are expected in 36 hours or less. These winds may be accompanied by storm surge, coastal flooding, and/or river flooding.</li><li><i>Hurricane Watch</i> is issued when a tropical cyclone containing winds of 64 knots (74 mph) or higher poses a possible threat, generally within 48 hours. These winds may be accompanied by storm surge, coastal flooding, and/or river flooding. The watch does not mean that hurricane conditions will occur. It only means that these conditions are possible.</li><li><i>Hurricane Warning</i> is issued when sustained winds of 64 knots (74 mph) or higher associated with a tropical cyclone are expected in 36 hours or less. These winds may be accompanied by storm surge, coastal flooding, and/or river flooding. A hurricane warning can remain in effect when dangerously high water or a combination of dangerously high water and exceptionally high waves continue, even though winds may be less than hurricane force.</li></ul></li></ul></div><div><span style='font-size:x-large;'>Revisions</span></div><div><ul><li><strong>Sep 10, 2026</strong>: Adjusted Label on leading Forecast location to accurately reflect 3-hr processing/prep time.</li><li><strong>Aug 31, 2026</strong>: Adjusted ‘Event Label’ to correctly provide abbreviated Time Zone of user's location following Arcade update.</li><li><strong>Jul 23, 2026</strong>: Added ITCDVLP and IDVLBL fields to Forecast Position layer to differentiate storms based on basins.</li><li><strong>Mar 13, 2025</strong>: Altered 'Forecast Error Cone' layer to include 'Danger Area' with updated symbology.</li><li><strong>Nov 20, 2023</strong>: Added Event Label to 'Forecast Position' layer, showing arrival time and wind speed localized to user's location.</li><li><strong>Mar 27, 2022</strong>: Added UID, Max_SS, Max_Wind, Max_Gust, and Max_Label fields to ForecastErrorCone layer.</li></ul></div><div><p><span style='color:rgb(128,128,128);'>This map is provided for informational purposes and is not monitored 24/7 for accuracy and currency. Always refer to </span><a target='_blank' href='https://www.nhc.noaa.gov/contact.shtml' rel='nofollow ugc noopener noreferrer'><span style='color:rgb(128,128,128);'>NOAA</span></a><span style='color:rgb(128,128,128);'> or JTWC sources for official guidance.</span></p><div>&nbsp;</div><p>If you would like to be alerted to potential issues or simply see when this Service will update next, please visit our <a target='_blank' href='https://livingatlas.arcgis.com/livefeeds-status/' rel='nofollow ugc noopener noreferrer'>Live Feed Status</a> Page!</p></div>",
			"keyword": [
				"Esri",
				"NOAA",
				"NHC",
				"CPHC",
				"JTWC",
				"USNO",
				"Hurricane",
				"Typhoon",
				"Cyclone",
				"Weather",
				"Tropical",
				"Forecast",
				"Storm",
				"risk",
				"earth observations",
				"climate",
				"hosted",
				"esri_environment",
				"Active_Hurricanes",
				"Live Feeds",
				"livefeeds",
				"Alvin",
				"Barbara",
				"Cosme",
				"Dalila",
				"Erick",
				"Flossie",
				"Gil",
				"Henriette",
				"Ivo",
				"Juliette",
				"Kiko",
				"Lorena",
				"Mario",
				"Narda",
				"Octave",
				"Priscilla",
				"Raymond",
				"Sonia",
				"Tico",
				"Velma",
				"Wallis",
				"Xina",
				"York",
				"Zelda",
				"Andrea",
				"Barry",
				"Chantal",
				"Dexter",
				"Erin",
				"Fernand",
				"Gabrielle",
				"Humberto",
				"Imelda",
				"Jerry",
				"Karen",
				"Lorenzo",
				"Melissa",
				"Nestor",
				"Olga",
				"Pablo",
				"Rebekah",
				"Sebastien",
				"Tanya",
				"Van",
				"Wendy"
			],
			"issued": "2019-06-11T19:38:21.000Z",
			"modified": "2026-11-11T15:27:59.635Z",
			"publisher": {
				"name": "Esri"
			},
			"contactPoint": {
				"@type": "vcard:Contact",
				"fn": "esri_livefeeds2",
				"hasEmail": "{{orgContactEmail}}"
			},
			"accessLevel": "public",
			"spatial": "-180.0000,-90.0000,180.0000,90.0000",
			"license": "This work is licensed under the Esri Master License Agreement.<br /><div><a href='https://goto.arcgis.com/termsofuse/viewsummary' target='_blank' rel='nofollow ugc noopener noreferrer'><b>View Summary</b></a> | <a href='https://goto.arcgis.com/termsofuse/viewtermsofuse' target='_blank' rel='nofollow ugc noopener noreferrer'><b>View Terms of Use</b></a></div>",
			"distribution": [
				{
					"@type": "dcat:Distribution",
					"title": "ArcGIS Hub Dataset",
					"format": "Web Page",
					"mediaType": "text/html",
					"accessURL": "https://www.pacificgeoportal.com/datasets/esri2::raw-1-10th-degree-data-all"
				},
				{
					"@type": "dcat:Distribution",
					"title": "ArcGIS GeoService",
					"format": "ArcGIS GeoServices REST API",
					"mediaType": "application/json",
					"accessURL": "https://services9.arcgis.com/RHVPKKiFTONKtxq3/arcgis/rest/services/Active_Hurricanes_v1/FeatureServer/10"
				},
				{
					"@type": "dcat:Distribution",
					"title": "CSV",
					"format": "CSV",
					"mediaType": "text/csv",
					"accessURL": "https://www.pacificgeoportal.com/api/download/v1/items/248e7b5827a34b248647afb012c58787/csv?layers=10"
				},
				{
					"@type": "dcat:Distribution",
					"title": "Shapefile",
					"format": "ZIP",
					"mediaType": "application/zip",
					"accessURL": "https://www.pacificgeoportal.com/api/download/v1/items/248e7b5827a34b248647afb012c58787/shapefile?layers=10"
				},
				{
					"@type": "dcat:Distribution",
					"title": "GeoJSON",
					"format": "GeoJSON",
					"mediaType": "application/vnd.geo+json",
					"accessURL": "https://www.pacificgeoportal.com/api/download/v1/items/248e7b5827a34b248647afb012c58787/geojson?layers=10"
				},
				{
					"@type": "dcat:Distribution",
					"title": "KML",
					"format": "KML",
					"mediaType": "application/vnd.google-earth.kml+xml",
					"accessURL": "https://www.pacificgeoportal.com/api/download/v1/items/248e7b5827a34b248647afb012c58787/kml?layers=10"
				},
				{
					"@type": "dcat:Distribution",
					"title": "File Geodatabase",
					"format": "ZIP",
					"mediaType": "application/zip",
					"accessURL": "https://www.pacificgeoportal.com/api/download/v1/items/248e7b5827a34b248647afb012c58787/filegdb?layers=10"
				},
				{
					"@type": "dcat:Distribution",
					"title": "Feature Collection",
					"format": "TXT",
					"mediaType": "text/plain",
					"accessURL": "https://www.pacificgeoportal.com/api/download/v1/items/248e7b5827a34b248647afb012c58787/featureCollection?layers=10"
				},
				{
					"@type": "dcat:Distribution",
					"title": "Excel",
					"format": "XLSX",
					"mediaType": "application/vnd.ms-excel",
					"accessURL": "https://www.pacificgeoportal.com/api/download/v1/items/248e7b5827a34b248647afb012c58787/excel?layers=10"
				},
				{
					"@type": "dcat:Distribution",
					"title": "GeoPackage",
					"format": "GPKG",
					"mediaType": "application/geopackage+sqlite3",
					"accessURL": "https://www.pacificgeoportal.com/api/download/v1/items/248e7b5827a34b248647afb012c58787/geoPackage?layers=10"
				},
				{
					"@type": "dcat:Distribution",
					"title": "SQLite Geodatabase",
					"format": "GDB",
					"mediaType": "application/geopackage+sqlite3",
					"accessURL": "https://www.pacificgeoportal.com/api/download/v1/items/248e7b5827a34b248647afb012c58787/sqlite?layers=10"
				}
			],
			"theme": [
				"geospatial"
			]
		},
		{
			"@type": "dcat:Dataset",
			"identifier": "https://www.arcgis.com/home/item.html?id=248e7b5827a34b248647afb012c58787&sublayer=11",
			"landingPage": "https://www.pacificgeoportal.com/datasets/esri2::observed-wind-swath",
			"title": "Observed Wind Swath",
			"description": "<div>Hurricane tracks and positions provide information on where the storm has been, where it is currently located, and where it is predicted to go. Each storm location is depicted by the sustained wind speed, according to the <a target='_blank' href='https://www.nhc.noaa.gov/aboutsshws.php' rel='nofollow ugc noopener noreferrer'>Saffir-Simpson Scale</a>. It should be noted that the Saffir-Simpson Scale only applies to hurricanes in the Atlantic and Eastern Pacific basins, however all storms are still symbolized using that classification for consistency.</div><div>&nbsp;</div><div><strong>Data Source</strong></div><div><ul><li>This data is provided by <a target='_blank' href='https://www.nhc.noaa.gov/' rel='nofollow ugc noopener noreferrer'>NOAA National Hurricane Center</a> (NHC) for the Central+East Pacific and Atlantic, and the&nbsp;<a target='_blank' href='https://www.metoc.navy.mil/jtwc/jtwc.html' rel='nofollow ugc noopener noreferrer'>Joint Typhoon Warning Center</a>&nbsp;for the West+Central Pacific and Indian basins. For more disaster-related live feeds visit the <a target='_blank' href='https://www.arcgis.com/home/group.html?id=d55ba7a328924596b9fa9d5d1876a970#overview' rel='nofollow ugc noopener noreferrer'>Disaster Web Maps &amp; Feeds ArcGIS Online Group</a>.</li></ul></div><div><strong>Sample Data</strong></div><div><ul><li>See <a target='_blank' href='https://www.arcgis.com/home/item.html?id=0546442443e848a9ae7758fdb98d73f0' rel='nofollow ugc noopener noreferrer'>Sample Layer Item</a> for sample data during inactive Hurricane Season!</li></ul></div><div><strong>Update Frequency</strong></div><div><ul><li><a target='_blank' href='https://www.esriurl.com/LiveFeed' rel='nofollow ugc noopener noreferrer'>The Aggregated Live Feeds methodology</a> checks the Source for updates every 15 minutes. Tropical cyclones are normally issued every six hours at 5:00 AM EDT, 11:00 AM EDT, 5:00 PM EDT, and 11:00 PM EDT (or 4:00 AM EST, 10:00 AM EST, 4:00 PM EST, and 10:00 PM EST).</li><li>Public advisories for Eastern Pacific tropical cyclones are normally issued every six hours at 2:00 AM PDT, 8:00 AM PDT, 2:00 PM PDT, and 8:00 PM PDT (or 1:00 AM PST, 7:00 AM PST, 1:00 PM PST, and 7:00 PM PST).</li><li>Intermediate public advisories may be issued every 3 hours when coastal watches or warnings are in effect, and every 2 hours when coastal watches or warnings are in effect and land-based radars have identified a reliable storm center. Additionally, special public advisories may be issued at any time due to significant changes in warnings or in a cyclone. For the NHC data source you can subscribe to <a target='_blank' href='https://www.nhc.noaa.gov/gis-at.xml' rel='nofollow ugc noopener noreferrer'>RSS Feeds</a>.</li><li>North Pacific and North Indian Ocean tropical cyclone warnings are updated every 6 hours, and South Indian and South Pacific Ocean tropical cyclone warnings are routinely updated every 12 hours. Times are set to Zulu/UTC.</li></ul></div><div><strong>Scale/Resolution</strong></div><div><ul><li>The horizontal accuracy of these datasets is not stated but it is important to remember that tropical cyclone track forecasts are subject to error, and that the effects of a tropical cyclone can span many hundreds of miles from the center.</li></ul></div><div><strong>Area Covered</strong></div><div><ul><li>World</li></ul></div><div><strong>Glossary</strong></div><div><ul><li><i><strong>Forecast location</strong></i>: Represents the official NHC forecast locations for the center of a tropical cyclone. Forecast center positions are given for projections valid 12, 24, 36, 48, 72, 96, and 120 hours after the forecast's nominal initial time.&nbsp;<a target='_blank' href='https://www.nhc.noaa.gov/gis/metadata_ex_point_at.xml' rel='nofollow ugc noopener noreferrer'>Click here for more information</a>. Forecast points from the JTWC are valid 12, 24, 36, 48 and 72 hours after the forecast’s initial time.</li><li><i><strong>Forecast track:</strong></i> This product aids in the visualization of an NHC official track forecast, the forecast points are connected by a red line. The track lines are not a forecast product, as such, the lines should not be interpreted as representing a specific forecast for the location of a tropical cyclone in between official forecast points. It is also important to remember that tropical cyclone track forecasts are subject to error, and that the effects of a tropical cyclone can span many hundreds of miles from the center.&nbsp;<a target='_blank' href='https://www.nhc.noaa.gov/gis/metadata_ex_lines_at.xml' rel='nofollow ugc noopener noreferrer'>Click here for more information</a>.</li><li><i><strong>The Cone of Uncertainty:</strong></i> Cyclone paths are hard to predict with absolute certainty, especially days in advance. The cone represents the probable track of the center of a tropical cyclone and is formed by enclosing the area swept out by a set of circles along the forecast track (at 12, 24, 36 hours, etc). The size of each circle is scaled so that two-thirds of the historical official forecast errors over a 5-year sample fall within the circle. Based on forecasts over the previous 5 years, the entire track of a tropical cyclone can be expected to remain within the cone roughly 60-70% of the time. It is important to note that the area affected by a tropical cyclone can extend well beyond the confines of the cone enclosing the most likely track area of the center.&nbsp;<a target='_blank' href='https://www.nhc.noaa.gov/gis/metadata_ex_cone_at.xml' rel='nofollow ugc noopener noreferrer'>Click here for more information</a>. <strong>Now includes</strong> 'Danger Area' Polygons from JTWC, detailing US Navy Ship Avoidance Area when Wind speeds exceed 34 Knots!</li><li><i><strong>Coastal Watch/Warning:</strong></i> Coastal areas are placed under watches and warnings depending on the proximity and intensity of the approaching storm.<ul><li><i>Tropical Storm Watch</i> is issued when a tropical cyclone containing winds of 34 to 63 knots (39 to 73 mph) or higher poses a possible threat, generally within 48 hours. These winds may be accompanied by storm surge, coastal flooding, and/or river flooding. The watch does not mean that tropical storm conditions will occur. It only means that these conditions are possible.</li><li><i>Tropical Storm Warning</i> is issued when sustained winds of 34 to 63 knots (39 to 73 mph) or higher associated with a tropical cyclone are expected in 36 hours or less. These winds may be accompanied by storm surge, coastal flooding, and/or river flooding.</li><li><i>Hurricane Watch</i> is issued when a tropical cyclone containing winds of 64 knots (74 mph) or higher poses a possible threat, generally within 48 hours. These winds may be accompanied by storm surge, coastal flooding, and/or river flooding. The watch does not mean that hurricane conditions will occur. It only means that these conditions are possible.</li><li><i>Hurricane Warning</i> is issued when sustained winds of 64 knots (74 mph) or higher associated with a tropical cyclone are expected in 36 hours or less. These winds may be accompanied by storm surge, coastal flooding, and/or river flooding. A hurricane warning can remain in effect when dangerously high water or a combination of dangerously high water and exceptionally high waves continue, even though winds may be less than hurricane force.</li></ul></li></ul></div><div><span style='font-size:x-large;'>Revisions</span></div><div><ul><li><strong>Sep 10, 2026</strong>: Adjusted Label on leading Forecast location to accurately reflect 3-hr processing/prep time.</li><li><strong>Aug 31, 2026</strong>: Adjusted ‘Event Label’ to correctly provide abbreviated Time Zone of user's location following Arcade update.</li><li><strong>Jul 23, 2026</strong>: Added ITCDVLP and IDVLBL fields to Forecast Position layer to differentiate storms based on basins.</li><li><strong>Mar 13, 2025</strong>: Altered 'Forecast Error Cone' layer to include 'Danger Area' with updated symbology.</li><li><strong>Nov 20, 2023</strong>: Added Event Label to 'Forecast Position' layer, showing arrival time and wind speed localized to user's location.</li><li><strong>Mar 27, 2022</strong>: Added UID, Max_SS, Max_Wind, Max_Gust, and Max_Label fields to ForecastErrorCone layer.</li></ul></div><div><p><span style='color:rgb(128,128,128);'>This map is provided for informational purposes and is not monitored 24/7 for accuracy and currency. Always refer to </span><a target='_blank' href='https://www.nhc.noaa.gov/contact.shtml' rel='nofollow ugc noopener noreferrer'><span style='color:rgb(128,128,128);'>NOAA</span></a><span style='color:rgb(128,128,128);'> or JTWC sources for official guidance.</span></p><div>&nbsp;</div><p>If you would like to be alerted to potential issues or simply see when this Service will update next, please visit our <a target='_blank' href='https://livingatlas.arcgis.com/livefeeds-status/' rel='nofollow ugc noopener noreferrer'>Live Feed Status</a> Page!</p></div>",
			"keyword": [
				"Esri",
				"NOAA",
				"NHC",
				"CPHC",
				"JTWC",
				"USNO",
				"Hurricane",
				"Typhoon",
				"Cyclone",
				"Weather",
				"Tropical",
				"Forecast",
				"Storm",
				"risk",
				"earth observations",
				"climate",
				"hosted",
				"esri_environment",
				"Active_Hurricanes",
				"Live Feeds",
				"livefeeds",
				"Alvin",
				"Barbara",
				"Cosme",
				"Dalila",
				"Erick",
				"Flossie",
				"Gil",
				"Henriette",
				"Ivo",
				"Juliette",
				"Kiko",
				"Lorena",
				"Mario",
				"Narda",
				"Octave",
				"Priscilla",
				"Raymond",
				"Sonia",
				"Tico",
				"Velma",
				"Wallis",
				"Xina",
				"York",
				"Zelda",
				"Andrea",
				"Barry",
				"Chantal",
				"Dexter",
				"Erin",
				"Fernand",
				"Gabrielle",
				"Humberto",
				"Imelda",
				"Jerry",
				"Karen",
				"Lorenzo",
				"Melissa",
				"Nestor",
				"Olga",
				"Pablo",
				"Rebekah",
				"Sebastien",
				"Tanya",
				"Van",
				"Wendy"
			],
			"issued": "2019-06-11T19:38:21.000Z",
			"modified": "2026-11-11T15:27:59.635Z",
			"publisher": {
				"name": "Esri"
			},
			"contactPoint": {
				"@type": "vcard:Contact",
				"fn": "esri_livefeeds2",
				"hasEmail": "{{orgContactEmail}}"
			},
			"accessLevel": "public",
			"spatial": "-180.0000,-90.0000,180.0000,90.0000",
			"license": "This work is licensed under the Esri Master License Agreement.<br /><div><a href='https://goto.arcgis.com/termsofuse/viewsummary' target='_blank' rel='nofollow ugc noopener noreferrer'><b>View Summary</b></a> | <a href='https://goto.arcgis.com/termsofuse/viewtermsofuse' target='_blank' rel='nofollow ugc noopener noreferrer'><b>View Terms of Use</b></a></div>",
			"distribution": [
				{
					"@type": "dcat:Distribution",
					"title": "ArcGIS Hub Dataset",
					"format": "Web Page",
					"mediaType": "text/html",
					"accessURL": "https://www.pacificgeoportal.com/datasets/esri2::observed-wind-swath"
				},
				{
					"@type": "dcat:Distribution",
					"title": "ArcGIS GeoService",
					"format": "ArcGIS GeoServices REST API",
					"mediaType": "application/json",
					"accessURL": "https://services9.arcgis.com/RHVPKKiFTONKtxq3/arcgis/rest/services/Active_Hurricanes_v1/FeatureServer/11"
				},
				{
					"@type": "dcat:Distribution",
					"title": "CSV",
					"format": "CSV",
					"mediaType": "text/csv",
					"accessURL": "https://www.pacificgeoportal.com/api/download/v1/items/248e7b5827a34b248647afb012c58787/csv?layers=11"
				},
				{
					"@type": "dcat:Distribution",
					"title": "Shapefile",
					"format": "ZIP",
					"mediaType": "application/zip",
					"accessURL": "https://www.pacificgeoportal.com/api/download/v1/items/248e7b5827a34b248647afb012c58787/shapefile?layers=11"
				},
				{
					"@type": "dcat:Distribution",
					"title": "GeoJSON",
					"format": "GeoJSON",
					"mediaType": "application/vnd.geo+json",
					"accessURL": "https://www.pacificgeoportal.com/api/download/v1/items/248e7b5827a34b248647afb012c58787/geojson?layers=11"
				},
				{
					"@type": "dcat:Distribution",
					"title": "KML",
					"format": "KML",
					"mediaType": "application/vnd.google-earth.kml+xml",
					"accessURL": "https://www.pacificgeoportal.com/api/download/v1/items/248e7b5827a34b248647afb012c58787/kml?layers=11"
				},
				{
					"@type": "dcat:Distribution",
					"title": "File Geodatabase",
					"format": "ZIP",
					"mediaType": "application/zip",
					"accessURL": "https://www.pacificgeoportal.com/api/download/v1/items/248e7b5827a34b248647afb012c58787/filegdb?layers=11"
				},
				{
					"@type": "dcat:Distribution",
					"title": "Feature Collection",
					"format": "TXT",
					"mediaType": "text/plain",
					"accessURL": "https://www.pacificgeoportal.com/api/download/v1/items/248e7b5827a34b248647afb012c58787/featureCollection?layers=11"
				},
				{
					"@type": "dcat:Distribution",
					"title": "Excel",
					"format": "XLSX",
					"mediaType": "application/vnd.ms-excel",
					"accessURL": "https://www.pacificgeoportal.com/api/download/v1/items/248e7b5827a34b248647afb012c58787/excel?layers=11"
				},
				{
					"@type": "dcat:Distribution",
					"title": "GeoPackage",
					"format": "GPKG",
					"mediaType": "application/geopackage+sqlite3",
					"accessURL": "https://www.pacificgeoportal.com/api/download/v1/items/248e7b5827a34b248647afb012c58787/geoPackage?layers=11"
				},
				{
					"@type": "dcat:Distribution",
					"title": "SQLite Geodatabase",
					"format": "GDB",
					"mediaType": "application/geopackage+sqlite3",
					"accessURL": "https://www.pacificgeoportal.com/api/download/v1/items/248e7b5827a34b248647afb012c58787/sqlite?layers=11"
				}
			],
			"theme": [
				"geospatial"
			]
		},
		{
			"@type": "dcat:Dataset",
			"identifier": "https://www.arcgis.com/home/item.html?id=248e7b5827a34b248647afb012c58787&sublayer=2",
			"landingPage": "https://www.pacificgeoportal.com/datasets/esri2::forecast-track",
			"title": "Forecast Track",
			"description": "<div>Hurricane tracks and positions provide information on where the storm has been, where it is currently located, and where it is predicted to go. Each storm location is depicted by the sustained wind speed, according to the <a target='_blank' href='https://www.nhc.noaa.gov/aboutsshws.php' rel='nofollow ugc noopener noreferrer'>Saffir-Simpson Scale</a>. It should be noted that the Saffir-Simpson Scale only applies to hurricanes in the Atlantic and Eastern Pacific basins, however all storms are still symbolized using that classification for consistency.</div><div>&nbsp;</div><div><strong>Data Source</strong></div><div><ul><li>This data is provided by <a target='_blank' href='https://www.nhc.noaa.gov/' rel='nofollow ugc noopener noreferrer'>NOAA National Hurricane Center</a> (NHC) for the Central+East Pacific and Atlantic, and the&nbsp;<a target='_blank' href='https://www.metoc.navy.mil/jtwc/jtwc.html' rel='nofollow ugc noopener noreferrer'>Joint Typhoon Warning Center</a>&nbsp;for the West+Central Pacific and Indian basins. For more disaster-related live feeds visit the <a target='_blank' href='https://www.arcgis.com/home/group.html?id=d55ba7a328924596b9fa9d5d1876a970#overview' rel='nofollow ugc noopener noreferrer'>Disaster Web Maps &amp; Feeds ArcGIS Online Group</a>.</li></ul></div><div><strong>Sample Data</strong></div><div><ul><li>See <a target='_blank' href='https://www.arcgis.com/home/item.html?id=0546442443e848a9ae7758fdb98d73f0' rel='nofollow ugc noopener noreferrer'>Sample Layer Item</a> for sample data during inactive Hurricane Season!</li></ul></div><div><strong>Update Frequency</strong></div><div><ul><li><a target='_blank' href='https://www.esriurl.com/LiveFeed' rel='nofollow ugc noopener noreferrer'>The Aggregated Live Feeds methodology</a> checks the Source for updates every 15 minutes. Tropical cyclones are normally issued every six hours at 5:00 AM EDT, 11:00 AM EDT, 5:00 PM EDT, and 11:00 PM EDT (or 4:00 AM EST, 10:00 AM EST, 4:00 PM EST, and 10:00 PM EST).</li><li>Public advisories for Eastern Pacific tropical cyclones are normally issued every six hours at 2:00 AM PDT, 8:00 AM PDT, 2:00 PM PDT, and 8:00 PM PDT (or 1:00 AM PST, 7:00 AM PST, 1:00 PM PST, and 7:00 PM PST).</li><li>Intermediate public advisories may be issued every 3 hours when coastal watches or warnings are in effect, and every 2 hours when coastal watches or warnings are in effect and land-based radars have identified a reliable storm center. Additionally, special public advisories may be issued at any time due to significant changes in warnings or in a cyclone. For the NHC data source you can subscribe to <a target='_blank' href='https://www.nhc.noaa.gov/gis-at.xml' rel='nofollow ugc noopener noreferrer'>RSS Feeds</a>.</li><li>North Pacific and North Indian Ocean tropical cyclone warnings are updated every 6 hours, and South Indian and South Pacific Ocean tropical cyclone warnings are routinely updated every 12 hours. Times are set to Zulu/UTC.</li></ul></div><div><strong>Scale/Resolution</strong></div><div><ul><li>The horizontal accuracy of these datasets is not stated but it is important to remember that tropical cyclone track forecasts are subject to error, and that the effects of a tropical cyclone can span many hundreds of miles from the center.</li></ul></div><div><strong>Area Covered</strong></div><div><ul><li>World</li></ul></div><div><strong>Glossary</strong></div><div><ul><li><i><strong>Forecast location</strong></i>: Represents the official NHC forecast locations for the center of a tropical cyclone. Forecast center positions are given for projections valid 12, 24, 36, 48, 72, 96, and 120 hours after the forecast's nominal initial time.&nbsp;<a target='_blank' href='https://www.nhc.noaa.gov/gis/metadata_ex_point_at.xml' rel='nofollow ugc noopener noreferrer'>Click here for more information</a>. Forecast points from the JTWC are valid 12, 24, 36, 48 and 72 hours after the forecast’s initial time.</li><li><i><strong>Forecast track:</strong></i> This product aids in the visualization of an NHC official track forecast, the forecast points are connected by a red line. The track lines are not a forecast product, as such, the lines should not be interpreted as representing a specific forecast for the location of a tropical cyclone in between official forecast points. It is also important to remember that tropical cyclone track forecasts are subject to error, and that the effects of a tropical cyclone can span many hundreds of miles from the center.&nbsp;<a target='_blank' href='https://www.nhc.noaa.gov/gis/metadata_ex_lines_at.xml' rel='nofollow ugc noopener noreferrer'>Click here for more information</a>.</li><li><i><strong>The Cone of Uncertainty:</strong></i> Cyclone paths are hard to predict with absolute certainty, especially days in advance. The cone represents the probable track of the center of a tropical cyclone and is formed by enclosing the area swept out by a set of circles along the forecast track (at 12, 24, 36 hours, etc). The size of each circle is scaled so that two-thirds of the historical official forecast errors over a 5-year sample fall within the circle. Based on forecasts over the previous 5 years, the entire track of a tropical cyclone can be expected to remain within the cone roughly 60-70% of the time. It is important to note that the area affected by a tropical cyclone can extend well beyond the confines of the cone enclosing the most likely track area of the center.&nbsp;<a target='_blank' href='https://www.nhc.noaa.gov/gis/metadata_ex_cone_at.xml' rel='nofollow ugc noopener noreferrer'>Click here for more information</a>. <strong>Now includes</strong> 'Danger Area' Polygons from JTWC, detailing US Navy Ship Avoidance Area when Wind speeds exceed 34 Knots!</li><li><i><strong>Coastal Watch/Warning:</strong></i> Coastal areas are placed under watches and warnings depending on the proximity and intensity of the approaching storm.<ul><li><i>Tropical Storm Watch</i> is issued when a tropical cyclone containing winds of 34 to 63 knots (39 to 73 mph) or higher poses a possible threat, generally within 48 hours. These winds may be accompanied by storm surge, coastal flooding, and/or river flooding. The watch does not mean that tropical storm conditions will occur. It only means that these conditions are possible.</li><li><i>Tropical Storm Warning</i> is issued when sustained winds of 34 to 63 knots (39 to 73 mph) or higher associated with a tropical cyclone are expected in 36 hours or less. These winds may be accompanied by storm surge, coastal flooding, and/or river flooding.</li><li><i>Hurricane Watch</i> is issued when a tropical cyclone containing winds of 64 knots (74 mph) or higher poses a possible threat, generally within 48 hours. These winds may be accompanied by storm surge, coastal flooding, and/or river flooding. The watch does not mean that hurricane conditions will occur. It only means that these conditions are possible.</li><li><i>Hurricane Warning</i> is issued when sustained winds of 64 knots (74 mph) or higher associated with a tropical cyclone are expected in 36 hours or less. These winds may be accompanied by storm surge, coastal flooding, and/or river flooding. A hurricane warning can remain in effect when dangerously high water or a combination of dangerously high water and exceptionally high waves continue, even though winds may be less than hurricane force.</li></ul></li></ul></div><div><span style='font-size:x-large;'>Revisions</span></div><div><ul><li><strong>Sep 10, 2026</strong>: Adjusted Label on leading Forecast location to accurately reflect 3-hr processing/prep time.</li><li><strong>Aug 31, 2026</strong>: Adjusted ‘Event Label’ to correctly provide abbreviated Time Zone of user's location following Arcade update.</li><li><strong>Jul 23, 2026</strong>: Added ITCDVLP and IDVLBL fields to Forecast Position layer to differentiate storms based on basins.</li><li><strong>Mar 13, 2025</strong>: Altered 'Forecast Error Cone' layer to include 'Danger Area' with updated symbology.</li><li><strong>Nov 20, 2023</strong>: Added Event Label to 'Forecast Position' layer, showing arrival time and wind speed localized to user's location.</li><li><strong>Mar 27, 2022</strong>: Added UID, Max_SS, Max_Wind, Max_Gust, and Max_Label fields to ForecastErrorCone layer.</li></ul></div><div><p><span style='color:rgb(128,128,128);'>This map is provided for informational purposes and is not monitored 24/7 for accuracy and currency. Always refer to </span><a target='_blank' href='https://www.nhc.noaa.gov/contact.shtml' rel='nofollow ugc noopener noreferrer'><span style='color:rgb(128,128,128);'>NOAA</span></a><span style='color:rgb(128,128,128);'> or JTWC sources for official guidance.</span></p><div>&nbsp;</div><p>If you would like to be alerted to potential issues or simply see when this Service will update next, please visit our <a target='_blank' href='https://livingatlas.arcgis.com/livefeeds-status/' rel='nofollow ugc noopener noreferrer'>Live Feed Status</a> Page!</p></div>",
			"keyword": [
				"Esri",
				"NOAA",
				"NHC",
				"CPHC",
				"JTWC",
				"USNO",
				"Hurricane",
				"Typhoon",
				"Cyclone",
				"Weather",
				"Tropical",
				"Forecast",
				"Storm",
				"risk",
				"earth observations",
				"climate",
				"hosted",
				"esri_environment",
				"Active_Hurricanes",
				"Live Feeds",
				"livefeeds",
				"Alvin",
				"Barbara",
				"Cosme",
				"Dalila",
				"Erick",
				"Flossie",
				"Gil",
				"Henriette",
				"Ivo",
				"Juliette",
				"Kiko",
				"Lorena",
				"Mario",
				"Narda",
				"Octave",
				"Priscilla",
				"Raymond",
				"Sonia",
				"Tico",
				"Velma",
				"Wallis",
				"Xina",
				"York",
				"Zelda",
				"Andrea",
				"Barry",
				"Chantal",
				"Dexter",
				"Erin",
				"Fernand",
				"Gabrielle",
				"Humberto",
				"Imelda",
				"Jerry",
				"Karen",
				"Lorenzo",
				"Melissa",
				"Nestor",
				"Olga",
				"Pablo",
				"Rebekah",
				"Sebastien",
				"Tanya",
				"Van",
				"Wendy"
			],
			"issued": "2019-06-11T19:38:21.000Z",
			"modified": "2026-11-11T15:27:59.635Z",
			"publisher": {
				"name": "Esri"
			},
			"contactPoint": {
				"@type": "vcard:Contact",
				"fn": "esri_livefeeds2",
				"hasEmail": "{{orgContactEmail}}"
			},
			"accessLevel": "public",
			"spatial": "117.1000,18.7000,129.0000,33.6000",
			"license": "This work is licensed under the Esri Master License Agreement.<br /><div><a href='https://goto.arcgis.com/termsofuse/viewsummary' target='_blank' rel='nofollow ugc noopener noreferrer'><b>View Summary</b></a> | <a href='https://goto.arcgis.com/termsofuse/viewtermsofuse' target='_blank' rel='nofollow ugc noopener noreferrer'><b>View Terms of Use</b></a></div>",
			"distribution": [
				{
					"@type": "dcat:Distribution",
					"title": "ArcGIS Hub Dataset",
					"format": "Web Page",
					"mediaType": "text/html",
					"accessURL": "https://www.pacificgeoportal.com/datasets/esri2::forecast-track"
				},
				{
					"@type": "dcat:Distribution",
					"title": "ArcGIS GeoService",
					"format": "ArcGIS GeoServices REST API",
					"mediaType": "application/json",
					"accessURL": "https://services9.arcgis.com/RHVPKKiFTONKtxq3/arcgis/rest/services/Active_Hurricanes_v1/FeatureServer/2"
				},
				{
					"@type": "dcat:Distribution",
					"title": "CSV",
					"format": "CSV",
					"mediaType": "text/csv",
					"accessURL": "https://www.pacificgeoportal.com/api/download/v1/items/248e7b5827a34b248647afb012c58787/csv?layers=2"
				},
				{
					"@type": "dcat:Distribution",
					"title": "Shapefile",
					"format": "ZIP",
					"mediaType": "application/zip",
					"accessURL": "https://www.pacificgeoportal.com/api/download/v1/items/248e7b5827a34b248647afb012c58787/shapefile?layers=2"
				},
				{
					"@type": "dcat:Distribution",
					"title": "GeoJSON",
					"format": "GeoJSON",
					"mediaType": "application/vnd.geo+json",
					"accessURL": "https://www.pacificgeoportal.com/api/download/v1/items/248e7b5827a34b248647afb012c58787/geojson?layers=2"
				},
				{
					"@type": "dcat:Distribution",
					"title": "KML",
					"format": "KML",
					"mediaType": "application/vnd.google-earth.kml+xml",
					"accessURL": "https://www.pacificgeoportal.com/api/download/v1/items/248e7b5827a34b248647afb012c58787/kml?layers=2"
				},
				{
					"@type": "dcat:Distribution",
					"title": "File Geodatabase",
					"format": "ZIP",
					"mediaType": "application/zip",
					"accessURL": "https://www.pacificgeoportal.com/api/download/v1/items/248e7b5827a34b248647afb012c58787/filegdb?layers=2"
				},
				{
					"@type": "dcat:Distribution",
					"title": "Feature Collection",
					"format": "TXT",
					"mediaType": "text/plain",
					"accessURL": "https://www.pacificgeoportal.com/api/download/v1/items/248e7b5827a34b248647afb012c58787/featureCollection?layers=2"
				},
				{
					"@type": "dcat:Distribution",
					"title": "Excel",
					"format": "XLSX",
					"mediaType": "application/vnd.ms-excel",
					"accessURL": "https://www.pacificgeoportal.com/api/download/v1/items/248e7b5827a34b248647afb012c58787/excel?layers=2"
				},
				{
					"@type": "dcat:Distribution",
					"title": "GeoPackage",
					"format": "GPKG",
					"mediaType": "application/geopackage+sqlite3",
					"accessURL": "https://www.pacificgeoportal.com/api/download/v1/items/248e7b5827a34b248647afb012c58787/geoPackage?layers=2"
				},
				{
					"@type": "dcat:Distribution",
					"title": "SQLite Geodatabase",
					"format": "GDB",
					"mediaType": "application/geopackage+sqlite3",
					"accessURL": "https://www.pacificgeoportal.com/api/download/v1/items/248e7b5827a34b248647afb012c58787/sqlite?layers=2"
				}
			],
			"theme": [
				"geospatial"
			]
		},
		{
			"@type": "dcat:Dataset",
			"identifier": "https://www.arcgis.com/home/item.html?id=248e7b5827a34b248647afb012c58787&sublayer=3",
			"landingPage": "https://www.pacificgeoportal.com/datasets/esri2::observed-track",
			"title": "Observed Track",
			"description": "<div>Hurricane tracks and positions provide information on where the storm has been, where it is currently located, and where it is predicted to go. Each storm location is depicted by the sustained wind speed, according to the <a target='_blank' href='https://www.nhc.noaa.gov/aboutsshws.php' rel='nofollow ugc noopener noreferrer'>Saffir-Simpson Scale</a>. It should be noted that the Saffir-Simpson Scale only applies to hurricanes in the Atlantic and Eastern Pacific basins, however all storms are still symbolized using that classification for consistency.</div><div>&nbsp;</div><div><strong>Data Source</strong></div><div><ul><li>This data is provided by <a target='_blank' href='https://www.nhc.noaa.gov/' rel='nofollow ugc noopener noreferrer'>NOAA National Hurricane Center</a> (NHC) for the Central+East Pacific and Atlantic, and the&nbsp;<a target='_blank' href='https://www.metoc.navy.mil/jtwc/jtwc.html' rel='nofollow ugc noopener noreferrer'>Joint Typhoon Warning Center</a>&nbsp;for the West+Central Pacific and Indian basins. For more disaster-related live feeds visit the <a target='_blank' href='https://www.arcgis.com/home/group.html?id=d55ba7a328924596b9fa9d5d1876a970#overview' rel='nofollow ugc noopener noreferrer'>Disaster Web Maps &amp; Feeds ArcGIS Online Group</a>.</li></ul></div><div><strong>Sample Data</strong></div><div><ul><li>See <a target='_blank' href='https://www.arcgis.com/home/item.html?id=0546442443e848a9ae7758fdb98d73f0' rel='nofollow ugc noopener noreferrer'>Sample Layer Item</a> for sample data during inactive Hurricane Season!</li></ul></div><div><strong>Update Frequency</strong></div><div><ul><li><a target='_blank' href='https://www.esriurl.com/LiveFeed' rel='nofollow ugc noopener noreferrer'>The Aggregated Live Feeds methodology</a> checks the Source for updates every 15 minutes. Tropical cyclones are normally issued every six hours at 5:00 AM EDT, 11:00 AM EDT, 5:00 PM EDT, and 11:00 PM EDT (or 4:00 AM EST, 10:00 AM EST, 4:00 PM EST, and 10:00 PM EST).</li><li>Public advisories for Eastern Pacific tropical cyclones are normally issued every six hours at 2:00 AM PDT, 8:00 AM PDT, 2:00 PM PDT, and 8:00 PM PDT (or 1:00 AM PST, 7:00 AM PST, 1:00 PM PST, and 7:00 PM PST).</li><li>Intermediate public advisories may be issued every 3 hours when coastal watches or warnings are in effect, and every 2 hours when coastal watches or warnings are in effect and land-based radars have identified a reliable storm center. Additionally, special public advisories may be issued at any time due to significant changes in warnings or in a cyclone. For the NHC data source you can subscribe to <a target='_blank' href='https://www.nhc.noaa.gov/gis-at.xml' rel='nofollow ugc noopener noreferrer'>RSS Feeds</a>.</li><li>North Pacific and North Indian Ocean tropical cyclone warnings are updated every 6 hours, and South Indian and South Pacific Ocean tropical cyclone warnings are routinely updated every 12 hours. Times are set to Zulu/UTC.</li></ul></div><div><strong>Scale/Resolution</strong></div><div><ul><li>The horizontal accuracy of these datasets is not stated but it is important to remember that tropical cyclone track forecasts are subject to error, and that the effects of a tropical cyclone can span many hundreds of miles from the center.</li></ul></div><div><strong>Area Covered</strong></div><div><ul><li>World</li></ul></div><div><strong>Glossary</strong></div><div><ul><li><i><strong>Forecast location</strong></i>: Represents the official NHC forecast locations for the center of a tropical cyclone. Forecast center positions are given for projections valid 12, 24, 36, 48, 72, 96, and 120 hours after the forecast's nominal initial time.&nbsp;<a target='_blank' href='https://www.nhc.noaa.gov/gis/metadata_ex_point_at.xml' rel='nofollow ugc noopener noreferrer'>Click here for more information</a>. Forecast points from the JTWC are valid 12, 24, 36, 48 and 72 hours after the forecast’s initial time.</li><li><i><strong>Forecast track:</strong></i> This product aids in the visualization of an NHC official track forecast, the forecast points are connected by a red line. The track lines are not a forecast product, as such, the lines should not be interpreted as representing a specific forecast for the location of a tropical cyclone in between official forecast points. It is also important to remember that tropical cyclone track forecasts are subject to error, and that the effects of a tropical cyclone can span many hundreds of miles from the center.&nbsp;<a target='_blank' href='https://www.nhc.noaa.gov/gis/metadata_ex_lines_at.xml' rel='nofollow ugc noopener noreferrer'>Click here for more information</a>.</li><li><i><strong>The Cone of Uncertainty:</strong></i> Cyclone paths are hard to predict with absolute certainty, especially days in advance. The cone represents the probable track of the center of a tropical cyclone and is formed by enclosing the area swept out by a set of circles along the forecast track (at 12, 24, 36 hours, etc). The size of each circle is scaled so that two-thirds of the historical official forecast errors over a 5-year sample fall within the circle. Based on forecasts over the previous 5 years, the entire track of a tropical cyclone can be expected to remain within the cone roughly 60-70% of the time. It is important to note that the area affected by a tropical cyclone can extend well beyond the confines of the cone enclosing the most likely track area of the center.&nbsp;<a target='_blank' href='https://www.nhc.noaa.gov/gis/metadata_ex_cone_at.xml' rel='nofollow ugc noopener noreferrer'>Click here for more information</a>. <strong>Now includes</strong> 'Danger Area' Polygons from JTWC, detailing US Navy Ship Avoidance Area when Wind speeds exceed 34 Knots!</li><li><i><strong>Coastal Watch/Warning:</strong></i> Coastal areas are placed under watches and warnings depending on the proximity and intensity of the approaching storm.<ul><li><i>Tropical Storm Watch</i> is issued when a tropical cyclone containing winds of 34 to 63 knots (39 to 73 mph) or higher poses a possible threat, generally within 48 hours. These winds may be accompanied by storm surge, coastal flooding, and/or river flooding. The watch does not mean that tropical storm conditions will occur. It only means that these conditions are possible.</li><li><i>Tropical Storm Warning</i> is issued when sustained winds of 34 to 63 knots (39 to 73 mph) or higher associated with a tropical cyclone are expected in 36 hours or less. These winds may be accompanied by storm surge, coastal flooding, and/or river flooding.</li><li><i>Hurricane Watch</i> is issued when a tropical cyclone containing winds of 64 knots (74 mph) or higher poses a possible threat, generally within 48 hours. These winds may be accompanied by storm surge, coastal flooding, and/or river flooding. The watch does not mean that hurricane conditions will occur. It only means that these conditions are possible.</li><li><i>Hurricane Warning</i> is issued when sustained winds of 64 knots (74 mph) or higher associated with a tropical cyclone are expected in 36 hours or less. These winds may be accompanied by storm surge, coastal flooding, and/or river flooding. A hurricane warning can remain in effect when dangerously high water or a combination of dangerously high water and exceptionally high waves continue, even though winds may be less than hurricane force.</li></ul></li></ul></div><div><span style='font-size:x-large;'>Revisions</span></div><div><ul><li><strong>Sep 10, 2026</strong>: Adjusted Label on leading Forecast location to accurately reflect 3-hr processing/prep time.</li><li><strong>Aug 31, 2026</strong>: Adjusted ‘Event Label’ to correctly provide abbreviated Time Zone of user's location following Arcade update.</li><li><strong>Jul 23, 2026</strong>: Added ITCDVLP and IDVLBL fields to Forecast Position layer to differentiate storms based on basins.</li><li><strong>Mar 13, 2025</strong>: Altered 'Forecast Error Cone' layer to include 'Danger Area' with updated symbology.</li><li><strong>Nov 20, 2023</strong>: Added Event Label to 'Forecast Position' layer, showing arrival time and wind speed localized to user's location.</li><li><strong>Mar 27, 2022</strong>: Added UID, Max_SS, Max_Wind, Max_Gust, and Max_Label fields to ForecastErrorCone layer.</li></ul></div><div><p><span style='color:rgb(128,128,128);'>This map is provided for informational purposes and is not monitored 24/7 for accuracy and currency. Always refer to </span><a target='_blank' href='https://www.nhc.noaa.gov/contact.shtml' rel='nofollow ugc noopener noreferrer'><span style='color:rgb(128,128,128);'>NOAA</span></a><span style='color:rgb(128,128,128);'> or JTWC sources for official guidance.</span></p><div>&nbsp;</div><p>If you would like to be alerted to potential issues or simply see when this Service will update next, please visit our <a target='_blank' href='https://livingatlas.arcgis.com/livefeeds-status/' rel='nofollow ugc noopener noreferrer'>Live Feed Status</a> Page!</p></div>",
			"keyword": [
				"Esri",
				"NOAA",
				"NHC",
				"CPHC",
				"JTWC",
				"USNO",
				"Hurricane",
				"Typhoon",
				"Cyclone",
				"Weather",
				"Tropical",
				"Forecast",
				"Storm",
				"risk",
				"earth observations",
				"climate",
				"hosted",
				"esri_environment",
				"Active_Hurricanes",
				"Live Feeds",
				"livefeeds",
				"Alvin",
				"Barbara",
				"Cosme",
				"Dalila",
				"Erick",
				"Flossie",
				"Gil",
				"Henriette",
				"Ivo",
				"Juliette",
				"Kiko",
				"Lorena",
				"Mario",
				"Narda",
				"Octave",
				"Priscilla",
				"Raymond",
				"Sonia",
				"Tico",
				"Velma",
				"Wallis",
				"Xina",
				"York",
				"Zelda",
				"Andrea",
				"Barry",
				"Chantal",
				"Dexter",
				"Erin",
				"Fernand",
				"Gabrielle",
				"Humberto",
				"Imelda",
				"Jerry",
				"Karen",
				"Lorenzo",
				"Melissa",
				"Nestor",
				"Olga",
				"Pablo",
				"Rebekah",
				"Sebastien",
				"Tanya",
				"Van",
				"Wendy"
			],
			"issued": "2019-06-11T19:38:21.000Z",
			"modified": "2026-11-11T15:27:59.635Z",
			"publisher": {
				"name": "Esri"
			},
			"contactPoint": {
				"@type": "vcard:Contact",
				"fn": "esri_livefeeds2",
				"hasEmail": "{{orgContactEmail}}"
			},
			"accessLevel": "public",
			"spatial": "129.0000,3.9000,167.9000,18.7000",
			"license": "This work is licensed under the Esri Master License Agreement.<br /><div><a href='https://goto.arcgis.com/termsofuse/viewsummary' target='_blank' rel='nofollow ugc noopener noreferrer'><b>View Summary</b></a> | <a href='https://goto.arcgis.com/termsofuse/viewtermsofuse' target='_blank' rel='nofollow ugc noopener noreferrer'><b>View Terms of Use</b></a></div>",
			"distribution": [
				{
					"@type": "dcat:Distribution",
					"title": "ArcGIS Hub Dataset",
					"format": "Web Page",
					"mediaType": "text/html",
					"accessURL": "https://www.pacificgeoportal.com/datasets/esri2::observed-track"
				},
				{
					"@type": "dcat:Distribution",
					"title": "ArcGIS GeoService",
					"format": "ArcGIS GeoServices REST API",
					"mediaType": "application/json",
					"accessURL": "https://services9.arcgis.com/RHVPKKiFTONKtxq3/arcgis/rest/services/Active_Hurricanes_v1/FeatureServer/3"
				},
				{
					"@type": "dcat:Distribution",
					"title": "CSV",
					"format": "CSV",
					"mediaType": "text/csv",
					"accessURL": "https://www.pacificgeoportal.com/api/download/v1/items/248e7b5827a34b248647afb012c58787/csv?layers=3"
				},
				{
					"@type": "dcat:Distribution",
					"title": "Shapefile",
					"format": "ZIP",
					"mediaType": "application/zip",
					"accessURL": "https://www.pacificgeoportal.com/api/download/v1/items/248e7b5827a34b248647afb012c58787/shapefile?layers=3"
				},
				{
					"@type": "dcat:Distribution",
					"title": "GeoJSON",
					"format": "GeoJSON",
					"mediaType": "application/vnd.geo+json",
					"accessURL": "https://www.pacificgeoportal.com/api/download/v1/items/248e7b5827a34b248647afb012c58787/geojson?layers=3"
				},
				{
					"@type": "dcat:Distribution",
					"title": "KML",
					"format": "KML",
					"mediaType": "application/vnd.google-earth.kml+xml",
					"accessURL": "https://www.pacificgeoportal.com/api/download/v1/items/248e7b5827a34b248647afb012c58787/kml?layers=3"
				},
				{
					"@type": "dcat:Distribution",
					"title": "File Geodatabase",
					"format": "ZIP",
					"mediaType": "application/zip",
					"accessURL": "https://www.pacificgeoportal.com/api/download/v1/items/248e7b5827a34b248647afb012c58787/filegdb?layers=3"
				},
				{
					"@type": "dcat:Distribution",
					"title": "Feature Collection",
					"format": "TXT",
					"mediaType": "text/plain",
					"accessURL": "https://www.pacificgeoportal.com/api/download/v1/items/248e7b5827a34b248647afb012c58787/featureCollection?layers=3"
				},
				{
					"@type": "dcat:Distribution",
					"title": "Excel",
					"format": "XLSX",
					"mediaType": "application/vnd.ms-excel",
					"accessURL": "https://www.pacificgeoportal.com/api/download/v1/items/248e7b5827a34b248647afb012c58787/excel?layers=3"
				},
				{
					"@type": "dcat:Distribution",
					"title": "GeoPackage",
					"format": "GPKG",
					"mediaType": "application/geopackage+sqlite3",
					"accessURL": "https://www.pacificgeoportal.com/api/download/v1/items/248e7b5827a34b248647afb012c58787/geoPackage?layers=3"
				},
				{
					"@type": "dcat:Distribution",
					"title": "SQLite Geodatabase",
					"format": "GDB",
					"mediaType": "application/geopackage+sqlite3",
					"accessURL": "https://www.pacificgeoportal.com/api/download/v1/items/248e7b5827a34b248647afb012c58787/sqlite?layers=3"
				}
			],
			"theme": [
				"geospatial"
			]
		},
		{
			"@type": "dcat:Dataset",
			"identifier": "https://www.arcgis.com/home/item.html?id=248e7b5827a34b248647afb012c58787&sublayer=4",
			"landingPage": "https://www.pacificgeoportal.com/datasets/esri2::forecast-error-cone-and-danger-area",
			"title": "Forecast Error Cone and Danger Area",
			"description": "<div>Hurricane tracks and positions provide information on where the storm has been, where it is currently located, and where it is predicted to go. Each storm location is depicted by the sustained wind speed, according to the <a target='_blank' href='https://www.nhc.noaa.gov/aboutsshws.php' rel='nofollow ugc noopener noreferrer'>Saffir-Simpson Scale</a>. It should be noted that the Saffir-Simpson Scale only applies to hurricanes in the Atlantic and Eastern Pacific basins, however all storms are still symbolized using that classification for consistency.</div><div>&nbsp;</div><div><strong>Data Source</strong></div><div><ul><li>This data is provided by <a target='_blank' href='https://www.nhc.noaa.gov/' rel='nofollow ugc noopener noreferrer'>NOAA National Hurricane Center</a> (NHC) for the Central+East Pacific and Atlantic, and the&nbsp;<a target='_blank' href='https://www.metoc.navy.mil/jtwc/jtwc.html' rel='nofollow ugc noopener noreferrer'>Joint Typhoon Warning Center</a>&nbsp;for the West+Central Pacific and Indian basins. For more disaster-related live feeds visit the <a target='_blank' href='https://www.arcgis.com/home/group.html?id=d55ba7a328924596b9fa9d5d1876a970#overview' rel='nofollow ugc noopener noreferrer'>Disaster Web Maps &amp; Feeds ArcGIS Online Group</a>.</li></ul></div><div><strong>Sample Data</strong></div><div><ul><li>See <a target='_blank' href='https://www.arcgis.com/home/item.html?id=0546442443e848a9ae7758fdb98d73f0' rel='nofollow ugc noopener noreferrer'>Sample Layer Item</a> for sample data during inactive Hurricane Season!</li></ul></div><div><strong>Update Frequency</strong></div><div><ul><li><a target='_blank' href='https://www.esriurl.com/LiveFeed' rel='nofollow ugc noopener noreferrer'>The Aggregated Live Feeds methodology</a> checks the Source for updates every 15 minutes. Tropical cyclones are normally issued every six hours at 5:00 AM EDT, 11:00 AM EDT, 5:00 PM EDT, and 11:00 PM EDT (or 4:00 AM EST, 10:00 AM EST, 4:00 PM EST, and 10:00 PM EST).</li><li>Public advisories for Eastern Pacific tropical cyclones are normally issued every six hours at 2:00 AM PDT, 8:00 AM PDT, 2:00 PM PDT, and 8:00 PM PDT (or 1:00 AM PST, 7:00 AM PST, 1:00 PM PST, and 7:00 PM PST).</li><li>Intermediate public advisories may be issued every 3 hours when coastal watches or warnings are in effect, and every 2 hours when coastal watches or warnings are in effect and land-based radars have identified a reliable storm center. Additionally, special public advisories may be issued at any time due to significant changes in warnings or in a cyclone. For the NHC data source you can subscribe to <a target='_blank' href='https://www.nhc.noaa.gov/gis-at.xml' rel='nofollow ugc noopener noreferrer'>RSS Feeds</a>.</li><li>North Pacific and North Indian Ocean tropical cyclone warnings are updated every 6 hours, and South Indian and South Pacific Ocean tropical cyclone warnings are routinely updated every 12 hours. Times are set to Zulu/UTC.</li></ul></div><div><strong>Scale/Resolution</strong></div><div><ul><li>The horizontal accuracy of these datasets is not stated but it is important to remember that tropical cyclone track forecasts are subject to error, and that the effects of a tropical cyclone can span many hundreds of miles from the center.</li></ul></div><div><strong>Area Covered</strong></div><div><ul><li>World</li></ul></div><div><strong>Glossary</strong></div><div><ul><li><i><strong>Forecast location</strong></i>: Represents the official NHC forecast locations for the center of a tropical cyclone. Forecast center positions are given for projections valid 12, 24, 36, 48, 72, 96, and 120 hours after the forecast's nominal initial time.&nbsp;<a target='_blank' href='https://www.nhc.noaa.gov/gis/metadata_ex_point_at.xml' rel='nofollow ugc noopener noreferrer'>Click here for more information</a>. Forecast points from the JTWC are valid 12, 24, 36, 48 and 72 hours after the forecast’s initial time.</li><li><i><strong>Forecast track:</strong></i> This product aids in the visualization of an NHC official track forecast, the forecast points are connected by a red line. The track lines are not a forecast product, as such, the lines should not be interpreted as representing a specific forecast for the location of a tropical cyclone in between official forecast points. It is also important to remember that tropical cyclone track forecasts are subject to error, and that the effects of a tropical cyclone can span many hundreds of miles from the center.&nbsp;<a target='_blank' href='https://www.nhc.noaa.gov/gis/metadata_ex_lines_at.xml' rel='nofollow ugc noopener noreferrer'>Click here for more information</a>.</li><li><i><strong>The Cone of Uncertainty:</strong></i> Cyclone paths are hard to predict with absolute certainty, especially days in advance. The cone represents the probable track of the center of a tropical cyclone and is formed by enclosing the area swept out by a set of circles along the forecast track (at 12, 24, 36 hours, etc). The size of each circle is scaled so that two-thirds of the historical official forecast errors over a 5-year sample fall within the circle. Based on forecasts over the previous 5 years, the entire track of a tropical cyclone can be expected to remain within the cone roughly 60-70% of the time. It is important to note that the area affected by a tropical cyclone can extend well beyond the confines of the cone enclosing the most likely track area of the center.&nbsp;<a target='_blank' href='https://www.nhc.noaa.gov/gis/metadata_ex_cone_at.xml' rel='nofollow ugc noopener noreferrer'>Click here for more information</a>. <strong>Now includes</strong> 'Danger Area' Polygons from JTWC, detailing US Navy Ship Avoidance Area when Wind speeds exceed 34 Knots!</li><li><i><strong>Coastal Watch/Warning:</strong></i> Coastal areas are placed under watches and warnings depending on the proximity and intensity of the approaching storm.<ul><li><i>Tropical Storm Watch</i> is issued when a tropical cyclone containing winds of 34 to 63 knots (39 to 73 mph) or higher poses a possible threat, generally within 48 hours. These winds may be accompanied by storm surge, coastal flooding, and/or river flooding. The watch does not mean that tropical storm conditions will occur. It only means that these conditions are possible.</li><li><i>Tropical Storm Warning</i> is issued when sustained winds of 34 to 63 knots (39 to 73 mph) or higher associated with a tropical cyclone are expected in 36 hours or less. These winds may be accompanied by storm surge, coastal flooding, and/or river flooding.</li><li><i>Hurricane Watch</i> is issued when a tropical cyclone containing winds of 64 knots (74 mph) or higher poses a possible threat, generally within 48 hours. These winds may be accompanied by storm surge, coastal flooding, and/or river flooding. The watch does not mean that hurricane conditions will occur. It only means that these conditions are possible.</li><li><i>Hurricane Warning</i> is issued when sustained winds of 64 knots (74 mph) or higher associated with a tropical cyclone are expected in 36 hours or less. These winds may be accompanied by storm surge, coastal flooding, and/or river flooding. A hurricane warning can remain in effect when dangerously high water or a combination of dangerously high water and exceptionally high waves continue, even though winds may be less than hurricane force.</li></ul></li></ul></div><div><span style='font-size:x-large;'>Revisions</span></div><div><ul><li><strong>Sep 10, 2026</strong>: Adjusted Label on leading Forecast location to accurately reflect 3-hr processing/prep time.</li><li><strong>Aug 31, 2026</strong>: Adjusted ‘Event Label’ to correctly provide abbreviated Time Zone of user's location following Arcade update.</li><li><strong>Jul 23, 2026</strong>: Added ITCDVLP and IDVLBL fields to Forecast Position layer to differentiate storms based on basins.</li><li><strong>Mar 13, 2025</strong>: Altered 'Forecast Error Cone' layer to include 'Danger Area' with updated symbology.</li><li><strong>Nov 20, 2023</strong>: Added Event Label to 'Forecast Position' layer, showing arrival time and wind speed localized to user's location.</li><li><strong>Mar 27, 2022</strong>: Added UID, Max_SS, Max_Wind, Max_Gust, and Max_Label fields to ForecastErrorCone layer.</li></ul></div><div><p><span style='color:rgb(128,128,128);'>This map is provided for informational purposes and is not monitored 24/7 for accuracy and currency. Always refer to </span><a target='_blank' href='https://www.nhc.noaa.gov/contact.shtml' rel='nofollow ugc noopener noreferrer'><span style='color:rgb(128,128,128);'>NOAA</span></a><span style='color:rgb(128,128,128);'> or JTWC sources for official guidance.</span></p><div>&nbsp;</div><p>If you would like to be alerted to potential issues or simply see when this Service will update next, please visit our <a target='_blank' href='https://livingatlas.arcgis.com/livefeeds-status/' rel='nofollow ugc noopener noreferrer'>Live Feed Status</a> Page!</p></div>",
			"keyword": [
				"Esri",
				"NOAA",
				"NHC",
				"CPHC",
				"JTWC",
				"USNO",
				"Hurricane",
				"Typhoon",
				"Cyclone",
				"Weather",
				"Tropical",
				"Forecast",
				"Storm",
				"risk",
				"earth observations",
				"climate",
				"hosted",
				"esri_environment",
				"Active_Hurricanes",
				"Live Feeds",
				"livefeeds",
				"Alvin",
				"Barbara",
				"Cosme",
				"Dalila",
				"Erick",
				"Flossie",
				"Gil",
				"Henriette",
				"Ivo",
				"Juliette",
				"Kiko",
				"Lorena",
				"Mario",
				"Narda",
				"Octave",
				"Priscilla",
				"Raymond",
				"Sonia",
				"Tico",
				"Velma",
				"Wallis",
				"Xina",
				"York",
				"Zelda",
				"Andrea",
				"Barry",
				"Chantal",
				"Dexter",
				"Erin",
				"Fernand",
				"Gabrielle",
				"Humberto",
				"Imelda",
				"Jerry",
				"Karen",
				"Lorenzo",
				"Melissa",
				"Nestor",
				"Olga",
				"Pablo",
				"Rebekah",
				"Sebastien",
				"Tanya",
				"Van",
				"Wendy"
			],
			"issued": "2019-06-11T19:38:21.000Z",
			"modified": "2026-11-11T15:27:59.635Z",
			"publisher": {
				"name": "Esri"
			},
			"contactPoint": {
				"@type": "vcard:Contact",
				"fn": "esri_livefeeds2",
				"hasEmail": "{{orgContactEmail}}"
			},
			"accessLevel": "public",
			"spatial": "109.3943,14.1347,134.1755,40.0101",
			"license": "This work is licensed under the Esri Master License Agreement.<br /><div><a href='https://goto.arcgis.com/termsofuse/viewsummary' target='_blank' rel='nofollow ugc noopener noreferrer'><b>View Summary</b></a> | <a href='https://goto.arcgis.com/termsofuse/viewtermsofuse' target='_blank' rel='nofollow ugc noopener noreferrer'><b>View Terms of Use</b></a></div>",
			"distribution": [
				{
					"@type": "dcat:Distribution",
					"title": "ArcGIS Hub Dataset",
					"format": "Web Page",
					"mediaType": "text/html",
					"accessURL": "https://www.pacificgeoportal.com/datasets/esri2::forecast-error-cone-and-danger-area"
				},
				{
					"@type": "dcat:Distribution",
					"title": "ArcGIS GeoService",
					"format": "ArcGIS GeoServices REST API",
					"mediaType": "application/json",
					"accessURL": "https://services9.arcgis.com/RHVPKKiFTONKtxq3/arcgis/rest/services/Active_Hurricanes_v1/FeatureServer/4"
				},
				{
					"@type": "dcat:Distribution",
					"title": "CSV",
					"format": "CSV",
					"mediaType": "text/csv",
					"accessURL": "https://www.pacificgeoportal.com/api/download/v1/items/248e7b5827a34b248647afb012c58787/csv?layers=4"
				},
				{
					"@type": "dcat:Distribution",
					"title": "Shapefile",
					"format": "ZIP",
					"mediaType": "application/zip",
					"accessURL": "https://www.pacificgeoportal.com/api/download/v1/items/248e7b5827a34b248647afb012c58787/shapefile?layers=4"
				},
				{
					"@type": "dcat:Distribution",
					"title": "GeoJSON",
					"format": "GeoJSON",
					"mediaType": "application/vnd.geo+json",
					"accessURL": "https://www.pacificgeoportal.com/api/download/v1/items/248e7b5827a34b248647afb012c58787/geojson?layers=4"
				},
				{
					"@type": "dcat:Distribution",
					"title": "KML",
					"format": "KML",
					"mediaType": "application/vnd.google-earth.kml+xml",
					"accessURL": "https://www.pacificgeoportal.com/api/download/v1/items/248e7b5827a34b248647afb012c58787/kml?layers=4"
				},
				{
					"@type": "dcat:Distribution",
					"title": "File Geodatabase",
					"format": "ZIP",
					"mediaType": "application/zip",
					"accessURL": "https://www.pacificgeoportal.com/api/download/v1/items/248e7b5827a34b248647afb012c58787/filegdb?layers=4"
				},
				{
					"@type": "dcat:Distribution",
					"title": "Feature Collection",
					"format": "TXT",
					"mediaType": "text/plain",
					"accessURL": "https://www.pacificgeoportal.com/api/download/v1/items/248e7b5827a34b248647afb012c58787/featureCollection?layers=4"
				},
				{
					"@type": "dcat:Distribution",
					"title": "Excel",
					"format": "XLSX",
					"mediaType": "application/vnd.ms-excel",
					"accessURL": "https://www.pacificgeoportal.com/api/download/v1/items/248e7b5827a34b248647afb012c58787/excel?layers=4"
				},
				{
					"@type": "dcat:Distribution",
					"title": "GeoPackage",
					"format": "GPKG",
					"mediaType": "application/geopackage+sqlite3",
					"accessURL": "https://www.pacificgeoportal.com/api/download/v1/items/248e7b5827a34b248647afb012c58787/geoPackage?layers=4"
				},
				{
					"@type": "dcat:Distribution",
					"title": "SQLite Geodatabase",
					"format": "GDB",
					"mediaType": "application/geopackage+sqlite3",
					"accessURL": "https://www.pacificgeoportal.com/api/download/v1/items/248e7b5827a34b248647afb012c58787/sqlite?layers=4"
				}
			],
			"theme": [
				"geospatial"
			]
		},
		{
			"@type": "dcat:Dataset",
			"identifier": "https://www.arcgis.com/home/item.html?id=248e7b5827a34b248647afb012c58787&sublayer=5",
			"landingPage": "https://www.pacificgeoportal.com/datasets/esri2::watches-and-warnings",
			"title": "Watches and Warnings",
			"description": "<div>Hurricane tracks and positions provide information on where the storm has been, where it is currently located, and where it is predicted to go. Each storm location is depicted by the sustained wind speed, according to the <a target='_blank' href='https://www.nhc.noaa.gov/aboutsshws.php' rel='nofollow ugc noopener noreferrer'>Saffir-Simpson Scale</a>. It should be noted that the Saffir-Simpson Scale only applies to hurricanes in the Atlantic and Eastern Pacific basins, however all storms are still symbolized using that classification for consistency.</div><div>&nbsp;</div><div><strong>Data Source</strong></div><div><ul><li>This data is provided by <a target='_blank' href='https://www.nhc.noaa.gov/' rel='nofollow ugc noopener noreferrer'>NOAA National Hurricane Center</a> (NHC) for the Central+East Pacific and Atlantic, and the&nbsp;<a target='_blank' href='https://www.metoc.navy.mil/jtwc/jtwc.html' rel='nofollow ugc noopener noreferrer'>Joint Typhoon Warning Center</a>&nbsp;for the West+Central Pacific and Indian basins. For more disaster-related live feeds visit the <a target='_blank' href='https://www.arcgis.com/home/group.html?id=d55ba7a328924596b9fa9d5d1876a970#overview' rel='nofollow ugc noopener noreferrer'>Disaster Web Maps &amp; Feeds ArcGIS Online Group</a>.</li></ul></div><div><strong>Sample Data</strong></div><div><ul><li>See <a target='_blank' href='https://www.arcgis.com/home/item.html?id=0546442443e848a9ae7758fdb98d73f0' rel='nofollow ugc noopener noreferrer'>Sample Layer Item</a> for sample data during inactive Hurricane Season!</li></ul></div><div><strong>Update Frequency</strong></div><div><ul><li><a target='_blank' href='https://www.esriurl.com/LiveFeed' rel='nofollow ugc noopener noreferrer'>The Aggregated Live Feeds methodology</a> checks the Source for updates every 15 minutes. Tropical cyclones are normally issued every six hours at 5:00 AM EDT, 11:00 AM EDT, 5:00 PM EDT, and 11:00 PM EDT (or 4:00 AM EST, 10:00 AM EST, 4:00 PM EST, and 10:00 PM EST).</li><li>Public advisories for Eastern Pacific tropical cyclones are normally issued every six hours at 2:00 AM PDT, 8:00 AM PDT, 2:00 PM PDT, and 8:00 PM PDT (or 1:00 AM PST, 7:00 AM PST, 1:00 PM PST, and 7:00 PM PST).</li><li>Intermediate public advisories may be issued every 3 hours when coastal watches or warnings are in effect, and every 2 hours when coastal watches or warnings are in effect and land-based radars have identified a reliable storm center. Additionally, special public advisories may be issued at any time due to significant changes in warnings or in a cyclone. For the NHC data source you can subscribe to <a target='_blank' href='https://www.nhc.noaa.gov/gis-at.xml' rel='nofollow ugc noopener noreferrer'>RSS Feeds</a>.</li><li>North Pacific and North Indian Ocean tropical cyclone warnings are updated every 6 hours, and South Indian and South Pacific Ocean tropical cyclone warnings are routinely updated every 12 hours. Times are set to Zulu/UTC.</li></ul></div><div><strong>Scale/Resolution</strong></div><div><ul><li>The horizontal accuracy of these datasets is not stated but it is important to remember that tropical cyclone track forecasts are subject to error, and that the effects of a tropical cyclone can span many hundreds of miles from the center.</li></ul></div><div><strong>Area Covered</strong></div><div><ul><li>World</li></ul></div><div><strong>Glossary</strong></div><div><ul><li><i><strong>Forecast location</strong></i>: Represents the official NHC forecast locations for the center of a tropical cyclone. Forecast center positions are given for projections valid 12, 24, 36, 48, 72, 96, and 120 hours after the forecast's nominal initial time.&nbsp;<a target='_blank' href='https://www.nhc.noaa.gov/gis/metadata_ex_point_at.xml' rel='nofollow ugc noopener noreferrer'>Click here for more information</a>. Forecast points from the JTWC are valid 12, 24, 36, 48 and 72 hours after the forecast’s initial time.</li><li><i><strong>Forecast track:</strong></i> This product aids in the visualization of an NHC official track forecast, the forecast points are connected by a red line. The track lines are not a forecast product, as such, the lines should not be interpreted as representing a specific forecast for the location of a tropical cyclone in between official forecast points. It is also important to remember that tropical cyclone track forecasts are subject to error, and that the effects of a tropical cyclone can span many hundreds of miles from the center.&nbsp;<a target='_blank' href='https://www.nhc.noaa.gov/gis/metadata_ex_lines_at.xml' rel='nofollow ugc noopener noreferrer'>Click here for more information</a>.</li><li><i><strong>The Cone of Uncertainty:</strong></i> Cyclone paths are hard to predict with absolute certainty, especially days in advance. The cone represents the probable track of the center of a tropical cyclone and is formed by enclosing the area swept out by a set of circles along the forecast track (at 12, 24, 36 hours, etc). The size of each circle is scaled so that two-thirds of the historical official forecast errors over a 5-year sample fall within the circle. Based on forecasts over the previous 5 years, the entire track of a tropical cyclone can be expected to remain within the cone roughly 60-70% of the time. It is important to note that the area affected by a tropical cyclone can extend well beyond the confines of the cone enclosing the most likely track area of the center.&nbsp;<a target='_blank' href='https://www.nhc.noaa.gov/gis/metadata_ex_cone_at.xml' rel='nofollow ugc noopener noreferrer'>Click here for more information</a>. <strong>Now includes</strong> 'Danger Area' Polygons from JTWC, detailing US Navy Ship Avoidance Area when Wind speeds exceed 34 Knots!</li><li><i><strong>Coastal Watch/Warning:</strong></i> Coastal areas are placed under watches and warnings depending on the proximity and intensity of the approaching storm.<ul><li><i>Tropical Storm Watch</i> is issued when a tropical cyclone containing winds of 34 to 63 knots (39 to 73 mph) or higher poses a possible threat, generally within 48 hours. These winds may be accompanied by storm surge, coastal flooding, and/or river flooding. The watch does not mean that tropical storm conditions will occur. It only means that these conditions are possible.</li><li><i>Tropical Storm Warning</i> is issued when sustained winds of 34 to 63 knots (39 to 73 mph) or higher associated with a tropical cyclone are expected in 36 hours or less. These winds may be accompanied by storm surge, coastal flooding, and/or river flooding.</li><li><i>Hurricane Watch</i> is issued when a tropical cyclone containing winds of 64 knots (74 mph) or higher poses a possible threat, generally within 48 hours. These winds may be accompanied by storm surge, coastal flooding, and/or river flooding. The watch does not mean that hurricane conditions will occur. It only means that these conditions are possible.</li><li><i>Hurricane Warning</i> is issued when sustained winds of 64 knots (74 mph) or higher associated with a tropical cyclone are expected in 36 hours or less. These winds may be accompanied by storm surge, coastal flooding, and/or river flooding. A hurricane warning can remain in effect when dangerously high water or a combination of dangerously high water and exceptionally high waves continue, even though winds may be less than hurricane force.</li></ul></li></ul></div><div><span style='font-size:x-large;'>Revisions</span></div><div><ul><li><strong>Sep 10, 2026</strong>: Adjusted Label on leading Forecast location to accurately reflect 3-hr processing/prep time.</li><li><strong>Aug 31, 2026</strong>: Adjusted ‘Event Label’ to correctly provide abbreviated Time Zone of user's location following Arcade update.</li><li><strong>Jul 23, 2026</strong>: Added ITCDVLP and IDVLBL fields to Forecast Position layer to differentiate storms based on basins.</li><li><strong>Mar 13, 2025</strong>: Altered 'Forecast Error Cone' layer to include 'Danger Area' with updated symbology.</li><li><strong>Nov 20, 2023</strong>: Added Event Label to 'Forecast Position' layer, showing arrival time and wind speed localized to user's location.</li><li><strong>Mar 27, 2022</strong>: Added UID, Max_SS, Max_Wind, Max_Gust, and Max_Label fields to ForecastErrorCone layer.</li></ul></div><div><p><span style='color:rgb(128,128,128);'>This map is provided for informational purposes and is not monitored 24/7 for accuracy and currency. Always refer to </span><a target='_blank' href='https://www.nhc.noaa.gov/contact.shtml' rel='nofollow ugc noopener noreferrer'><span style='color:rgb(128,128,128);'>NOAA</span></a><span style='color:rgb(128,128,128);'> or JTWC sources for official guidance.</span></p><div>&nbsp;</div><p>If you would like to be alerted to potential issues or simply see when this Service will update next, please visit our <a target='_blank' href='https://livingatlas.arcgis.com/livefeeds-status/' rel='nofollow ugc noopener noreferrer'>Live Feed Status</a> Page!</p></div>",
			"keyword": [
				"Esri",
				"NOAA",
				"NHC",
				"CPHC",
				"JTWC",
				"USNO",
				"Hurricane",
				"Typhoon",
				"Cyclone",
				"Weather",
				"Tropical",
				"Forecast",
				"Storm",
				"risk",
				"earth observations",
				"climate",
				"hosted",
				"esri_environment",
				"Active_Hurricanes",
				"Live Feeds",
				"livefeeds",
				"Alvin",
				"Barbara",
				"Cosme",
				"Dalila",
				"Erick",
				"Flossie",
				"Gil",
				"Henriette",
				"Ivo",
				"Juliette",
				"Kiko",
				"Lorena",
				"Mario",
				"Narda",
				"Octave",
				"Priscilla",
				"Raymond",
				"Sonia",
				"Tico",
				"Velma",
				"Wallis",
				"Xina",
				"York",
				"Zelda",
				"Andrea",
				"Barry",
				"Chantal",
				"Dexter",
				"Erin",
				"Fernand",
				"Gabrielle",
				"Humberto",
				"Imelda",
				"Jerry",
				"Karen",
				"Lorenzo",
				"Melissa",
				"Nestor",
				"Olga",
				"Pablo",
				"Rebekah",
				"Sebastien",
				"Tanya",
				"Van",
				"Wendy"
			],
			"issued": "2019-06-11T19:38:21.000Z",
			"modified": "2026-11-11T15:27:59.635Z",
			"publisher": {
				"name": "Esri"
			},
			"contactPoint": {
				"@type": "vcard:Contact",
				"fn": "esri_livefeeds2",
				"hasEmail": "{{orgContactEmail}}"
			},
			"accessLevel": "public",
			"spatial": "-180.0000,-90.0000,180.0000,90.0000",
			"license": "This work is licensed under the Esri Master License Agreement.<br /><div><a href='https://goto.arcgis.com/termsofuse/viewsummary' target='_blank' rel='nofollow ugc noopener noreferrer'><b>View Summary</b></a> | <a href='https://goto.arcgis.com/termsofuse/viewtermsofuse' target='_blank' rel='nofollow ugc noopener noreferrer'><b>View Terms of Use</b></a></div>",
			"distribution": [
				{
					"@type": "dcat:Distribution",
					"title": "ArcGIS Hub Dataset",
					"format": "Web Page",
					"mediaType": "text/html",
					"accessURL": "https://www.pacificgeoportal.com/datasets/esri2::watches-and-warnings"
				},
				{
					"@type": "dcat:Distribution",
					"title": "ArcGIS GeoService",
					"format": "ArcGIS GeoServices REST API",
					"mediaType": "application/json",
					"accessURL": "https://services9.arcgis.com/RHVPKKiFTONKtxq3/arcgis/rest/services/Active_Hurricanes_v1/FeatureServer/5"
				},
				{
					"@type": "dcat:Distribution",
					"title": "CSV",
					"format": "CSV",
					"mediaType": "text/csv",
					"accessURL": "https://www.pacificgeoportal.com/api/download/v1/items/248e7b5827a34b248647afb012c58787/csv?layers=5"
				},
				{
					"@type": "dcat:Distribution",
					"title": "Shapefile",
					"format": "ZIP",
					"mediaType": "application/zip",
					"accessURL": "https://www.pacificgeoportal.com/api/download/v1/items/248e7b5827a34b248647afb012c58787/shapefile?layers=5"
				},
				{
					"@type": "dcat:Distribution",
					"title": "GeoJSON",
					"format": "GeoJSON",
					"mediaType": "application/vnd.geo+json",
					"accessURL": "https://www.pacificgeoportal.com/api/download/v1/items/248e7b5827a34b248647afb012c58787/geojson?layers=5"
				},
				{
					"@type": "dcat:Distribution",
					"title": "KML",
					"format": "KML",
					"mediaType": "application/vnd.google-earth.kml+xml",
					"accessURL": "https://www.pacificgeoportal.com/api/download/v1/items/248e7b5827a34b248647afb012c58787/kml?layers=5"
				},
				{
					"@type": "dcat:Distribution",
					"title": "File Geodatabase",
					"format": "ZIP",
					"mediaType": "application/zip",
					"accessURL": "https://www.pacificgeoportal.com/api/download/v1/items/248e7b5827a34b248647afb012c58787/filegdb?layers=5"
				},
				{
					"@type": "dcat:Distribution",
					"title": "Feature Collection",
					"format": "TXT",
					"mediaType": "text/plain",
					"accessURL": "https://www.pacificgeoportal.com/api/download/v1/items/248e7b5827a34b248647afb012c58787/featureCollection?layers=5"
				},
				{
					"@type": "dcat:Distribution",
					"title": "Excel",
					"format": "XLSX",
					"mediaType": "application/vnd.ms-excel",
					"accessURL": "https://www.pacificgeoportal.com/api/download/v1/items/248e7b5827a34b248647afb012c58787/excel?layers=5"
				},
				{
					"@type": "dcat:Distribution",
					"title": "GeoPackage",
					"format": "GPKG",
					"mediaType": "application/geopackage+sqlite3",
					"accessURL": "https://www.pacificgeoportal.com/api/download/v1/items/248e7b5827a34b248647afb012c58787/geoPackage?layers=5"
				},
				{
					"@type": "dcat:Distribution",
					"title": "SQLite Geodatabase",
					"format": "GDB",
					"mediaType": "application/geopackage+sqlite3",
					"accessURL": "https://www.pacificgeoportal.com/api/download/v1/items/248e7b5827a34b248647afb012c58787/sqlite?layers=5"
				}
			],
			"theme": [
				"geospatial"
			]
		},
		{
			"@type": "dcat:Dataset",
			"identifier": "https://www.arcgis.com/home/item.html?id=248e7b5827a34b248647afb012c58787&sublayer=7",
			"landingPage": "https://www.pacificgeoportal.com/datasets/esri2::tropical-storm-force-34kts",
			"title": "Tropical Storm Force (34kts)",
			"description": "<div>Hurricane tracks and positions provide information on where the storm has been, where it is currently located, and where it is predicted to go. Each storm location is depicted by the sustained wind speed, according to the <a target='_blank' href='https://www.nhc.noaa.gov/aboutsshws.php' rel='nofollow ugc noopener noreferrer'>Saffir-Simpson Scale</a>. It should be noted that the Saffir-Simpson Scale only applies to hurricanes in the Atlantic and Eastern Pacific basins, however all storms are still symbolized using that classification for consistency.</div><div>&nbsp;</div><div><strong>Data Source</strong></div><div><ul><li>This data is provided by <a target='_blank' href='https://www.nhc.noaa.gov/' rel='nofollow ugc noopener noreferrer'>NOAA National Hurricane Center</a> (NHC) for the Central+East Pacific and Atlantic, and the&nbsp;<a target='_blank' href='https://www.metoc.navy.mil/jtwc/jtwc.html' rel='nofollow ugc noopener noreferrer'>Joint Typhoon Warning Center</a>&nbsp;for the West+Central Pacific and Indian basins. For more disaster-related live feeds visit the <a target='_blank' href='https://www.arcgis.com/home/group.html?id=d55ba7a328924596b9fa9d5d1876a970#overview' rel='nofollow ugc noopener noreferrer'>Disaster Web Maps &amp; Feeds ArcGIS Online Group</a>.</li></ul></div><div><strong>Sample Data</strong></div><div><ul><li>See <a target='_blank' href='https://www.arcgis.com/home/item.html?id=0546442443e848a9ae7758fdb98d73f0' rel='nofollow ugc noopener noreferrer'>Sample Layer Item</a> for sample data during inactive Hurricane Season!</li></ul></div><div><strong>Update Frequency</strong></div><div><ul><li><a target='_blank' href='https://www.esriurl.com/LiveFeed' rel='nofollow ugc noopener noreferrer'>The Aggregated Live Feeds methodology</a> checks the Source for updates every 15 minutes. Tropical cyclones are normally issued every six hours at 5:00 AM EDT, 11:00 AM EDT, 5:00 PM EDT, and 11:00 PM EDT (or 4:00 AM EST, 10:00 AM EST, 4:00 PM EST, and 10:00 PM EST).</li><li>Public advisories for Eastern Pacific tropical cyclones are normally issued every six hours at 2:00 AM PDT, 8:00 AM PDT, 2:00 PM PDT, and 8:00 PM PDT (or 1:00 AM PST, 7:00 AM PST, 1:00 PM PST, and 7:00 PM PST).</li><li>Intermediate public advisories may be issued every 3 hours when coastal watches or warnings are in effect, and every 2 hours when coastal watches or warnings are in effect and land-based radars have identified a reliable storm center. Additionally, special public advisories may be issued at any time due to significant changes in warnings or in a cyclone. For the NHC data source you can subscribe to <a target='_blank' href='https://www.nhc.noaa.gov/gis-at.xml' rel='nofollow ugc noopener noreferrer'>RSS Feeds</a>.</li><li>North Pacific and North Indian Ocean tropical cyclone warnings are updated every 6 hours, and South Indian and South Pacific Ocean tropical cyclone warnings are routinely updated every 12 hours. Times are set to Zulu/UTC.</li></ul></div><div><strong>Scale/Resolution</strong></div><div><ul><li>The horizontal accuracy of these datasets is not stated but it is important to remember that tropical cyclone track forecasts are subject to error, and that the effects of a tropical cyclone can span many hundreds of miles from the center.</li></ul></div><div><strong>Area Covered</strong></div><div><ul><li>World</li></ul></div><div><strong>Glossary</strong></div><div><ul><li><i><strong>Forecast location</strong></i>: Represents the official NHC forecast locations for the center of a tropical cyclone. Forecast center positions are given for projections valid 12, 24, 36, 48, 72, 96, and 120 hours after the forecast's nominal initial time.&nbsp;<a target='_blank' href='https://www.nhc.noaa.gov/gis/metadata_ex_point_at.xml' rel='nofollow ugc noopener noreferrer'>Click here for more information</a>. Forecast points from the JTWC are valid 12, 24, 36, 48 and 72 hours after the forecast’s initial time.</li><li><i><strong>Forecast track:</strong></i> This product aids in the visualization of an NHC official track forecast, the forecast points are connected by a red line. The track lines are not a forecast product, as such, the lines should not be interpreted as representing a specific forecast for the location of a tropical cyclone in between official forecast points. It is also important to remember that tropical cyclone track forecasts are subject to error, and that the effects of a tropical cyclone can span many hundreds of miles from the center.&nbsp;<a target='_blank' href='https://www.nhc.noaa.gov/gis/metadata_ex_lines_at.xml' rel='nofollow ugc noopener noreferrer'>Click here for more information</a>.</li><li><i><strong>The Cone of Uncertainty:</strong></i> Cyclone paths are hard to predict with absolute certainty, especially days in advance. The cone represents the probable track of the center of a tropical cyclone and is formed by enclosing the area swept out by a set of circles along the forecast track (at 12, 24, 36 hours, etc). The size of each circle is scaled so that two-thirds of the historical official forecast errors over a 5-year sample fall within the circle. Based on forecasts over the previous 5 years, the entire track of a tropical cyclone can be expected to remain within the cone roughly 60-70% of the time. It is important to note that the area affected by a tropical cyclone can extend well beyond the confines of the cone enclosing the most likely track area of the center.&nbsp;<a target='_blank' href='https://www.nhc.noaa.gov/gis/metadata_ex_cone_at.xml' rel='nofollow ugc noopener noreferrer'>Click here for more information</a>. <strong>Now includes</strong> 'Danger Area' Polygons from JTWC, detailing US Navy Ship Avoidance Area when Wind speeds exceed 34 Knots!</li><li><i><strong>Coastal Watch/Warning:</strong></i> Coastal areas are placed under watches and warnings depending on the proximity and intensity of the approaching storm.<ul><li><i>Tropical Storm Watch</i> is issued when a tropical cyclone containing winds of 34 to 63 knots (39 to 73 mph) or higher poses a possible threat, generally within 48 hours. These winds may be accompanied by storm surge, coastal flooding, and/or river flooding. The watch does not mean that tropical storm conditions will occur. It only means that these conditions are possible.</li><li><i>Tropical Storm Warning</i> is issued when sustained winds of 34 to 63 knots (39 to 73 mph) or higher associated with a tropical cyclone are expected in 36 hours or less. These winds may be accompanied by storm surge, coastal flooding, and/or river flooding.</li><li><i>Hurricane Watch</i> is issued when a tropical cyclone containing winds of 64 knots (74 mph) or higher poses a possible threat, generally within 48 hours. These winds may be accompanied by storm surge, coastal flooding, and/or river flooding. The watch does not mean that hurricane conditions will occur. It only means that these conditions are possible.</li><li><i>Hurricane Warning</i> is issued when sustained winds of 64 knots (74 mph) or higher associated with a tropical cyclone are expected in 36 hours or less. These winds may be accompanied by storm surge, coastal flooding, and/or river flooding. A hurricane warning can remain in effect when dangerously high water or a combination of dangerously high water and exceptionally high waves continue, even though winds may be less than hurricane force.</li></ul></li></ul></div><div><span style='font-size:x-large;'>Revisions</span></div><div><ul><li><strong>Sep 10, 2026</strong>: Adjusted Label on leading Forecast location to accurately reflect 3-hr processing/prep time.</li><li><strong>Aug 31, 2026</strong>: Adjusted ‘Event Label’ to correctly provide abbreviated Time Zone of user's location following Arcade update.</li><li><strong>Jul 23, 2026</strong>: Added ITCDVLP and IDVLBL fields to Forecast Position layer to differentiate storms based on basins.</li><li><strong>Mar 13, 2025</strong>: Altered 'Forecast Error Cone' layer to include 'Danger Area' with updated symbology.</li><li><strong>Nov 20, 2023</strong>: Added Event Label to 'Forecast Position' layer, showing arrival time and wind speed localized to user's location.</li><li><strong>Mar 27, 2022</strong>: Added UID, Max_SS, Max_Wind, Max_Gust, and Max_Label fields to ForecastErrorCone layer.</li></ul></div><div><p><span style='color:rgb(128,128,128);'>This map is provided for informational purposes and is not monitored 24/7 for accuracy and currency. Always refer to </span><a target='_blank' href='https://www.nhc.noaa.gov/contact.shtml' rel='nofollow ugc noopener noreferrer'><span style='color:rgb(128,128,128);'>NOAA</span></a><span style='color:rgb(128,128,128);'> or JTWC sources for official guidance.</span></p><div>&nbsp;</div><p>If you would like to be alerted to potential issues or simply see when this Service will update next, please visit our <a target='_blank' href='https://livingatlas.arcgis.com/livefeeds-status/' rel='nofollow ugc noopener noreferrer'>Live Feed Status</a> Page!</p></div>",
			"keyword": [
				"Esri",
				"NOAA",
				"NHC",
				"CPHC",
				"JTWC",
				"USNO",
				"Hurricane",
				"Typhoon",
				"Cyclone",
				"Weather",
				"Tropical",
				"Forecast",
				"Storm",
				"risk",
				"earth observations",
				"climate",
				"hosted",
				"esri_environment",
				"Active_Hurricanes",
				"Live Feeds",
				"livefeeds",
				"Alvin",
				"Barbara",
				"Cosme",
				"Dalila",
				"Erick",
				"Flossie",
				"Gil",
				"Henriette",
				"Ivo",
				"Juliette",
				"Kiko",
				"Lorena",
				"Mario",
				"Narda",
				"Octave",
				"Priscilla",
				"Raymond",
				"Sonia",
				"Tico",
				"Velma",
				"Wallis",
				"Xina",
				"York",
				"Zelda",
				"Andrea",
				"Barry",
				"Chantal",
				"Dexter",
				"Erin",
				"Fernand",
				"Gabrielle",
				"Humberto",
				"Imelda",
				"Jerry",
				"Karen",
				"Lorenzo",
				"Melissa",
				"Nestor",
				"Olga",
				"Pablo",
				"Rebekah",
				"Sebastien",
				"Tanya",
				"Van",
				"Wendy"
			],
			"issued": "2019-06-11T19:38:21.000Z",
			"modified": "2026-11-11T15:27:59.635Z",
			"publisher": {
				"name": "Esri"
			},
			"contactPoint": {
				"@type": "vcard:Contact",
				"fn": "esri_livefeeds2",
				"hasEmail": "{{orgContactEmail}}"
			},
			"accessLevel": "public",
			"spatial": "-180.0000,-90.0000,180.0000,90.0000",
			"license": "This work is licensed under the Esri Master License Agreement.<br /><div><a href='https://goto.arcgis.com/termsofuse/viewsummary' target='_blank' rel='nofollow ugc noopener noreferrer'><b>View Summary</b></a> | <a href='https://goto.arcgis.com/termsofuse/viewtermsofuse' target='_blank' rel='nofollow ugc noopener noreferrer'><b>View Terms of Use</b></a></div>",
			"distribution": [
				{
					"@type": "dcat:Distribution",
					"title": "ArcGIS Hub Dataset",
					"format": "Web Page",
					"mediaType": "text/html",
					"accessURL": "https://www.pacificgeoportal.com/datasets/esri2::tropical-storm-force-34kts"
				},
				{
					"@type": "dcat:Distribution",
					"title": "ArcGIS GeoService",
					"format": "ArcGIS GeoServices REST API",
					"mediaType": "application/json",
					"accessURL": "https://services9.arcgis.com/RHVPKKiFTONKtxq3/arcgis/rest/services/Active_Hurricanes_v1/FeatureServer/7"
				},
				{
					"@type": "dcat:Distribution",
					"title": "CSV",
					"format": "CSV",
					"mediaType": "text/csv",
					"accessURL": "https://www.pacificgeoportal.com/api/download/v1/items/248e7b5827a34b248647afb012c58787/csv?layers=7"
				},
				{
					"@type": "dcat:Distribution",
					"title": "Shapefile",
					"format": "ZIP",
					"mediaType": "application/zip",
					"accessURL": "https://www.pacificgeoportal.com/api/download/v1/items/248e7b5827a34b248647afb012c58787/shapefile?layers=7"
				},
				{
					"@type": "dcat:Distribution",
					"title": "GeoJSON",
					"format": "GeoJSON",
					"mediaType": "application/vnd.geo+json",
					"accessURL": "https://www.pacificgeoportal.com/api/download/v1/items/248e7b5827a34b248647afb012c58787/geojson?layers=7"
				},
				{
					"@type": "dcat:Distribution",
					"title": "KML",
					"format": "KML",
					"mediaType": "application/vnd.google-earth.kml+xml",
					"accessURL": "https://www.pacificgeoportal.com/api/download/v1/items/248e7b5827a34b248647afb012c58787/kml?layers=7"
				},
				{
					"@type": "dcat:Distribution",
					"title": "File Geodatabase",
					"format": "ZIP",
					"mediaType": "application/zip",
					"accessURL": "https://www.pacificgeoportal.com/api/download/v1/items/248e7b5827a34b248647afb012c58787/filegdb?layers=7"
				},
				{
					"@type": "dcat:Distribution",
					"title": "Feature Collection",
					"format": "TXT",
					"mediaType": "text/plain",
					"accessURL": "https://www.pacificgeoportal.com/api/download/v1/items/248e7b5827a34b248647afb012c58787/featureCollection?layers=7"
				},
				{
					"@type": "dcat:Distribution",
					"title": "Excel",
					"format": "XLSX",
					"mediaType": "application/vnd.ms-excel",
					"accessURL": "https://www.pacificgeoportal.com/api/download/v1/items/248e7b5827a34b248647afb012c58787/excel?layers=7"
				},
				{
					"@type": "dcat:Distribution",
					"title": "GeoPackage",
					"format": "GPKG",
					"mediaType": "application/geopackage+sqlite3",
					"accessURL": "https://www.pacificgeoportal.com/api/download/v1/items/248e7b5827a34b248647afb012c58787/geoPackage?layers=7"
				},
				{
					"@type": "dcat:Distribution",
					"title": "SQLite Geodatabase",
					"format": "GDB",
					"mediaType": "application/geopackage+sqlite3",
					"accessURL": "https://www.pacificgeoportal.com/api/download/v1/items/248e7b5827a34b248647afb012c58787/sqlite?layers=7"
				}
			],
			"theme": [
				"geospatial"
			]
		},
		{
			"@type": "dcat:Dataset",
			"identifier": "https://www.arcgis.com/home/item.html?id=248e7b5827a34b248647afb012c58787&sublayer=8",
			"landingPage": "https://www.pacificgeoportal.com/datasets/esri2::strong-tropical-storm-50kts",
			"title": "Strong Tropical Storm (50kts)",
			"description": "<div>Hurricane tracks and positions provide information on where the storm has been, where it is currently located, and where it is predicted to go. Each storm location is depicted by the sustained wind speed, according to the <a target='_blank' href='https://www.nhc.noaa.gov/aboutsshws.php' rel='nofollow ugc noopener noreferrer'>Saffir-Simpson Scale</a>. It should be noted that the Saffir-Simpson Scale only applies to hurricanes in the Atlantic and Eastern Pacific basins, however all storms are still symbolized using that classification for consistency.</div><div>&nbsp;</div><div><strong>Data Source</strong></div><div><ul><li>This data is provided by <a target='_blank' href='https://www.nhc.noaa.gov/' rel='nofollow ugc noopener noreferrer'>NOAA National Hurricane Center</a> (NHC) for the Central+East Pacific and Atlantic, and the&nbsp;<a target='_blank' href='https://www.metoc.navy.mil/jtwc/jtwc.html' rel='nofollow ugc noopener noreferrer'>Joint Typhoon Warning Center</a>&nbsp;for the West+Central Pacific and Indian basins. For more disaster-related live feeds visit the <a target='_blank' href='https://www.arcgis.com/home/group.html?id=d55ba7a328924596b9fa9d5d1876a970#overview' rel='nofollow ugc noopener noreferrer'>Disaster Web Maps &amp; Feeds ArcGIS Online Group</a>.</li></ul></div><div><strong>Sample Data</strong></div><div><ul><li>See <a target='_blank' href='https://www.arcgis.com/home/item.html?id=0546442443e848a9ae7758fdb98d73f0' rel='nofollow ugc noopener noreferrer'>Sample Layer Item</a> for sample data during inactive Hurricane Season!</li></ul></div><div><strong>Update Frequency</strong></div><div><ul><li><a target='_blank' href='https://www.esriurl.com/LiveFeed' rel='nofollow ugc noopener noreferrer'>The Aggregated Live Feeds methodology</a> checks the Source for updates every 15 minutes. Tropical cyclones are normally issued every six hours at 5:00 AM EDT, 11:00 AM EDT, 5:00 PM EDT, and 11:00 PM EDT (or 4:00 AM EST, 10:00 AM EST, 4:00 PM EST, and 10:00 PM EST).</li><li>Public advisories for Eastern Pacific tropical cyclones are normally issued every six hours at 2:00 AM PDT, 8:00 AM PDT, 2:00 PM PDT, and 8:00 PM PDT (or 1:00 AM PST, 7:00 AM PST, 1:00 PM PST, and 7:00 PM PST).</li><li>Intermediate public advisories may be issued every 3 hours when coastal watches or warnings are in effect, and every 2 hours when coastal watches or warnings are in effect and land-based radars have identified a reliable storm center. Additionally, special public advisories may be issued at any time due to significant changes in warnings or in a cyclone. For the NHC data source you can subscribe to <a target='_blank' href='https://www.nhc.noaa.gov/gis-at.xml' rel='nofollow ugc noopener noreferrer'>RSS Feeds</a>.</li><li>North Pacific and North Indian Ocean tropical cyclone warnings are updated every 6 hours, and South Indian and South Pacific Ocean tropical cyclone warnings are routinely updated every 12 hours. Times are set to Zulu/UTC.</li></ul></div><div><strong>Scale/Resolution</strong></div><div><ul><li>The horizontal accuracy of these datasets is not stated but it is important to remember that tropical cyclone track forecasts are subject to error, and that the effects of a tropical cyclone can span many hundreds of miles from the center.</li></ul></div><div><strong>Area Covered</strong></div><div><ul><li>World</li></ul></div><div><strong>Glossary</strong></div><div><ul><li><i><strong>Forecast location</strong></i>: Represents the official NHC forecast locations for the center of a tropical cyclone. Forecast center positions are given for projections valid 12, 24, 36, 48, 72, 96, and 120 hours after the forecast's nominal initial time.&nbsp;<a target='_blank' href='https://www.nhc.noaa.gov/gis/metadata_ex_point_at.xml' rel='nofollow ugc noopener noreferrer'>Click here for more information</a>. Forecast points from the JTWC are valid 12, 24, 36, 48 and 72 hours after the forecast’s initial time.</li><li><i><strong>Forecast track:</strong></i> This product aids in the visualization of an NHC official track forecast, the forecast points are connected by a red line. The track lines are not a forecast product, as such, the lines should not be interpreted as representing a specific forecast for the location of a tropical cyclone in between official forecast points. It is also important to remember that tropical cyclone track forecasts are subject to error, and that the effects of a tropical cyclone can span many hundreds of miles from the center.&nbsp;<a target='_blank' href='https://www.nhc.noaa.gov/gis/metadata_ex_lines_at.xml' rel='nofollow ugc noopener noreferrer'>Click here for more information</a>.</li><li><i><strong>The Cone of Uncertainty:</strong></i> Cyclone paths are hard to predict with absolute certainty, especially days in advance. The cone represents the probable track of the center of a tropical cyclone and is formed by enclosing the area swept out by a set of circles along the forecast track (at 12, 24, 36 hours, etc). The size of each circle is scaled so that two-thirds of the historical official forecast errors over a 5-year sample fall within the circle. Based on forecasts over the previous 5 years, the entire track of a tropical cyclone can be expected to remain within the cone roughly 60-70% of the time. It is important to note that the area affected by a tropical cyclone can extend well beyond the confines of the cone enclosing the most likely track area of the center.&nbsp;<a target='_blank' href='https://www.nhc.noaa.gov/gis/metadata_ex_cone_at.xml' rel='nofollow ugc noopener noreferrer'>Click here for more information</a>. <strong>Now includes</strong> 'Danger Area' Polygons from JTWC, detailing US Navy Ship Avoidance Area when Wind speeds exceed 34 Knots!</li><li><i><strong>Coastal Watch/Warning:</strong></i> Coastal areas are placed under watches and warnings depending on the proximity and intensity of the approaching storm.<ul><li><i>Tropical Storm Watch</i> is issued when a tropical cyclone containing winds of 34 to 63 knots (39 to 73 mph) or higher poses a possible threat, generally within 48 hours. These winds may be accompanied by storm surge, coastal flooding, and/or river flooding. The watch does not mean that tropical storm conditions will occur. It only means that these conditions are possible.</li><li><i>Tropical Storm Warning</i> is issued when sustained winds of 34 to 63 knots (39 to 73 mph) or higher associated with a tropical cyclone are expected in 36 hours or less. These winds may be accompanied by storm surge, coastal flooding, and/or river flooding.</li><li><i>Hurricane Watch</i> is issued when a tropical cyclone containing winds of 64 knots (74 mph) or higher poses a possible threat, generally within 48 hours. These winds may be accompanied by storm surge, coastal flooding, and/or river flooding. The watch does not mean that hurricane conditions will occur. It only means that these conditions are possible.</li><li><i>Hurricane Warning</i> is issued when sustained winds of 64 knots (74 mph) or higher associated with a tropical cyclone are expected in 36 hours or less. These winds may be accompanied by storm surge, coastal flooding, and/or river flooding. A hurricane warning can remain in effect when dangerously high water or a combination of dangerously high water and exceptionally high waves continue, even though winds may be less than hurricane force.</li></ul></li></ul></div><div><span style='font-size:x-large;'>Revisions</span></div><div><ul><li><strong>Sep 10, 2026</strong>: Adjusted Label on leading Forecast location to accurately reflect 3-hr processing/prep time.</li><li><strong>Aug 31, 2026</strong>: Adjusted ‘Event Label’ to correctly provide abbreviated Time Zone of user's location following Arcade update.</li><li><strong>Jul 23, 2026</strong>: Added ITCDVLP and IDVLBL fields to Forecast Position layer to differentiate storms based on basins.</li><li><strong>Mar 13, 2025</strong>: Altered 'Forecast Error Cone' layer to include 'Danger Area' with updated symbology.</li><li><strong>Nov 20, 2023</strong>: Added Event Label to 'Forecast Position' layer, showing arrival time and wind speed localized to user's location.</li><li><strong>Mar 27, 2022</strong>: Added UID, Max_SS, Max_Wind, Max_Gust, and Max_Label fields to ForecastErrorCone layer.</li></ul></div><div><p><span style='color:rgb(128,128,128);'>This map is provided for informational purposes and is not monitored 24/7 for accuracy and currency. Always refer to </span><a target='_blank' href='https://www.nhc.noaa.gov/contact.shtml' rel='nofollow ugc noopener noreferrer'><span style='color:rgb(128,128,128);'>NOAA</span></a><span style='color:rgb(128,128,128);'> or JTWC sources for official guidance.</span></p><div>&nbsp;</div><p>If you would like to be alerted to potential issues or simply see when this Service will update next, please visit our <a target='_blank' href='https://livingatlas.arcgis.com/livefeeds-status/' rel='nofollow ugc noopener noreferrer'>Live Feed Status</a> Page!</p></div>",
			"keyword": [
				"Esri",
				"NOAA",
				"NHC",
				"CPHC",
				"JTWC",
				"USNO",
				"Hurricane",
				"Typhoon",
				"Cyclone",
				"Weather",
				"Tropical",
				"Forecast",
				"Storm",
				"risk",
				"earth observations",
				"climate",
				"hosted",
				"esri_environment",
				"Active_Hurricanes",
				"Live Feeds",
				"livefeeds",
				"Alvin",
				"Barbara",
				"Cosme",
				"Dalila",
				"Erick",
				"Flossie",
				"Gil",
				"Henriette",
				"Ivo",
				"Juliette",
				"Kiko",
				"Lorena",
				"Mario",
				"Narda",
				"Octave",
				"Priscilla",
				"Raymond",
				"Sonia",
				"Tico",
				"Velma",
				"Wallis",
				"Xina",
				"York",
				"Zelda",
				"Andrea",
				"Barry",
				"Chantal",
				"Dexter",
				"Erin",
				"Fernand",
				"Gabrielle",
				"Humberto",
				"Imelda",
				"Jerry",
				"Karen",
				"Lorenzo",
				"Melissa",
				"Nestor",
				"Olga",
				"Pablo",
				"Rebekah",
				"Sebastien",
				"Tanya",
				"Van",
				"Wendy"
			],
			"issued": "2019-06-11T19:38:21.000Z",
			"modified": "2026-11-11T15:27:59.635Z",
			"publisher": {
				"name": "Esri"
			},
			"contactPoint": {
				"@type": "vcard:Contact",
				"fn": "esri_livefeeds2",
				"hasEmail": "{{orgContactEmail}}"
			},
			"accessLevel": "public",
			"spatial": "-180.0000,-90.0000,180.0000,90.0000",
			"license": "This work is licensed under the Esri Master License Agreement.<br /><div><a href='https://goto.arcgis.com/termsofuse/viewsummary' target='_blank' rel='nofollow ugc noopener noreferrer'><b>View Summary</b></a> | <a href='https://goto.arcgis.com/termsofuse/viewtermsofuse' target='_blank' rel='nofollow ugc noopener noreferrer'><b>View Terms of Use</b></a></div>",
			"distribution": [
				{
					"@type": "dcat:Distribution",
					"title": "ArcGIS Hub Dataset",
					"format": "Web Page",
					"mediaType": "text/html",
					"accessURL": "https://www.pacificgeoportal.com/datasets/esri2::strong-tropical-storm-50kts"
				},
				{
					"@type": "dcat:Distribution",
					"title": "ArcGIS GeoService",
					"format": "ArcGIS GeoServices REST API",
					"mediaType": "application/json",
					"accessURL": "https://services9.arcgis.com/RHVPKKiFTONKtxq3/arcgis/rest/services/Active_Hurricanes_v1/FeatureServer/8"
				},
				{
					"@type": "dcat:Distribution",
					"title": "CSV",
					"format": "CSV",
					"mediaType": "text/csv",
					"accessURL": "https://www.pacificgeoportal.com/api/download/v1/items/248e7b5827a34b248647afb012c58787/csv?layers=8"
				},
				{
					"@type": "dcat:Distribution",
					"title": "Shapefile",
					"format": "ZIP",
					"mediaType": "application/zip",
					"accessURL": "https://www.pacificgeoportal.com/api/download/v1/items/248e7b5827a34b248647afb012c58787/shapefile?layers=8"
				},
				{
					"@type": "dcat:Distribution",
					"title": "GeoJSON",
					"format": "GeoJSON",
					"mediaType": "application/vnd.geo+json",
					"accessURL": "https://www.pacificgeoportal.com/api/download/v1/items/248e7b5827a34b248647afb012c58787/geojson?layers=8"
				},
				{
					"@type": "dcat:Distribution",
					"title": "KML",
					"format": "KML",
					"mediaType": "application/vnd.google-earth.kml+xml",
					"accessURL": "https://www.pacificgeoportal.com/api/download/v1/items/248e7b5827a34b248647afb012c58787/kml?layers=8"
				},
				{
					"@type": "dcat:Distribution",
					"title": "File Geodatabase",
					"format": "ZIP",
					"mediaType": "application/zip",
					"accessURL": "https://www.pacificgeoportal.com/api/download/v1/items/248e7b5827a34b248647afb012c58787/filegdb?layers=8"
				},
				{
					"@type": "dcat:Distribution",
					"title": "Feature Collection",
					"format": "TXT",
					"mediaType": "text/plain",
					"accessURL": "https://www.pacificgeoportal.com/api/download/v1/items/248e7b5827a34b248647afb012c58787/featureCollection?layers=8"
				},
				{
					"@type": "dcat:Distribution",
					"title": "Excel",
					"format": "XLSX",
					"mediaType": "application/vnd.ms-excel",
					"accessURL": "https://www.pacificgeoportal.com/api/download/v1/items/248e7b5827a34b248647afb012c58787/excel?layers=8"
				},
				{
					"@type": "dcat:Distribution",
					"title": "GeoPackage",
					"format": "GPKG",
					"mediaType": "application/geopackage+sqlite3",
					"accessURL": "https://www.pacificgeoportal.com/api/download/v1/items/248e7b5827a34b248647afb012c58787/geoPackage?layers=8"
				},
				{
					"@type": "dcat:Distribution",
					"title": "SQLite Geodatabase",
					"format": "GDB",
					"mediaType": "application/geopackage+sqlite3",
					"accessURL": "https://www.pacificgeoportal.com/api/download/v1/items/248e7b5827a34b248647afb012c58787/sqlite?layers=8"
				}
			],
			"theme": [
				"geospatial"
			]
		},
		{
			"@type": "dcat:Dataset",
			"identifier": "https://www.arcgis.com/home/item.html?id=248e7b5827a34b248647afb012c58787&sublayer=9",
			"landingPage": "https://www.pacificgeoportal.com/datasets/esri2::hurricane-force-64kts",
			"title": "Hurricane Force (64kts+)",
			"description": "<div>Hurricane tracks and positions provide information on where the storm has been, where it is currently located, and where it is predicted to go. Each storm location is depicted by the sustained wind speed, according to the <a target='_blank' href='https://www.nhc.noaa.gov/aboutsshws.php' rel='nofollow ugc noopener noreferrer'>Saffir-Simpson Scale</a>. It should be noted that the Saffir-Simpson Scale only applies to hurricanes in the Atlantic and Eastern Pacific basins, however all storms are still symbolized using that classification for consistency.</div><div>&nbsp;</div><div><strong>Data Source</strong></div><div><ul><li>This data is provided by <a target='_blank' href='https://www.nhc.noaa.gov/' rel='nofollow ugc noopener noreferrer'>NOAA National Hurricane Center</a> (NHC) for the Central+East Pacific and Atlantic, and the&nbsp;<a target='_blank' href='https://www.metoc.navy.mil/jtwc/jtwc.html' rel='nofollow ugc noopener noreferrer'>Joint Typhoon Warning Center</a>&nbsp;for the West+Central Pacific and Indian basins. For more disaster-related live feeds visit the <a target='_blank' href='https://www.arcgis.com/home/group.html?id=d55ba7a328924596b9fa9d5d1876a970#overview' rel='nofollow ugc noopener noreferrer'>Disaster Web Maps &amp; Feeds ArcGIS Online Group</a>.</li></ul></div><div><strong>Sample Data</strong></div><div><ul><li>See <a target='_blank' href='https://www.arcgis.com/home/item.html?id=0546442443e848a9ae7758fdb98d73f0' rel='nofollow ugc noopener noreferrer'>Sample Layer Item</a> for sample data during inactive Hurricane Season!</li></ul></div><div><strong>Update Frequency</strong></div><div><ul><li><a target='_blank' href='https://www.esriurl.com/LiveFeed' rel='nofollow ugc noopener noreferrer'>The Aggregated Live Feeds methodology</a> checks the Source for updates every 15 minutes. Tropical cyclones are normally issued every six hours at 5:00 AM EDT, 11:00 AM EDT, 5:00 PM EDT, and 11:00 PM EDT (or 4:00 AM EST, 10:00 AM EST, 4:00 PM EST, and 10:00 PM EST).</li><li>Public advisories for Eastern Pacific tropical cyclones are normally issued every six hours at 2:00 AM PDT, 8:00 AM PDT, 2:00 PM PDT, and 8:00 PM PDT (or 1:00 AM PST, 7:00 AM PST, 1:00 PM PST, and 7:00 PM PST).</li><li>Intermediate public advisories may be issued every 3 hours when coastal watches or warnings are in effect, and every 2 hours when coastal watches or warnings are in effect and land-based radars have identified a reliable storm center. Additionally, special public advisories may be issued at any time due to significant changes in warnings or in a cyclone. For the NHC data source you can subscribe to <a target='_blank' href='https://www.nhc.noaa.gov/gis-at.xml' rel='nofollow ugc noopener noreferrer'>RSS Feeds</a>.</li><li>North Pacific and North Indian Ocean tropical cyclone warnings are updated every 6 hours, and South Indian and South Pacific Ocean tropical cyclone warnings are routinely updated every 12 hours. Times are set to Zulu/UTC.</li></ul></div><div><strong>Scale/Resolution</strong></div><div><ul><li>The horizontal accuracy of these datasets is not stated but it is important to remember that tropical cyclone track forecasts are subject to error, and that the effects of a tropical cyclone can span many hundreds of miles from the center.</li></ul></div><div><strong>Area Covered</strong></div><div><ul><li>World</li></ul></div><div><strong>Glossary</strong></div><div><ul><li><i><strong>Forecast location</strong></i>: Represents the official NHC forecast locations for the center of a tropical cyclone. Forecast center positions are given for projections valid 12, 24, 36, 48, 72, 96, and 120 hours after the forecast's nominal initial time.&nbsp;<a target='_blank' href='https://www.nhc.noaa.gov/gis/metadata_ex_point_at.xml' rel='nofollow ugc noopener noreferrer'>Click here for more information</a>. Forecast points from the JTWC are valid 12, 24, 36, 48 and 72 hours after the forecast’s initial time.</li><li><i><strong>Forecast track:</strong></i> This product aids in the visualization of an NHC official track forecast, the forecast points are connected by a red line. The track lines are not a forecast product, as such, the lines should not be interpreted as representing a specific forecast for the location of a tropical cyclone in between official forecast points. It is also important to remember that tropical cyclone track forecasts are subject to error, and that the effects of a tropical cyclone can span many hundreds of miles from the center.&nbsp;<a target='_blank' href='https://www.nhc.noaa.gov/gis/metadata_ex_lines_at.xml' rel='nofollow ugc noopener noreferrer'>Click here for more information</a>.</li><li><i><strong>The Cone of Uncertainty:</strong></i> Cyclone paths are hard to predict with absolute certainty, especially days in advance. The cone represents the probable track of the center of a tropical cyclone and is formed by enclosing the area swept out by a set of circles along the forecast track (at 12, 24, 36 hours, etc). The size of each circle is scaled so that two-thirds of the historical official forecast errors over a 5-year sample fall within the circle. Based on forecasts over the previous 5 years, the entire track of a tropical cyclone can be expected to remain within the cone roughly 60-70% of the time. It is important to note that the area affected by a tropical cyclone can extend well beyond the confines of the cone enclosing the most likely track area of the center.&nbsp;<a target='_blank' href='https://www.nhc.noaa.gov/gis/metadata_ex_cone_at.xml' rel='nofollow ugc noopener noreferrer'>Click here for more information</a>. <strong>Now includes</strong> 'Danger Area' Polygons from JTWC, detailing US Navy Ship Avoidance Area when Wind speeds exceed 34 Knots!</li><li><i><strong>Coastal Watch/Warning:</strong></i> Coastal areas are placed under watches and warnings depending on the proximity and intensity of the approaching storm.<ul><li><i>Tropical Storm Watch</i> is issued when a tropical cyclone containing winds of 34 to 63 knots (39 to 73 mph) or higher poses a possible threat, generally within 48 hours. These winds may be accompanied by storm surge, coastal flooding, and/or river flooding. The watch does not mean that tropical storm conditions will occur. It only means that these conditions are possible.</li><li><i>Tropical Storm Warning</i> is issued when sustained winds of 34 to 63 knots (39 to 73 mph) or higher associated with a tropical cyclone are expected in 36 hours or less. These winds may be accompanied by storm surge, coastal flooding, and/or river flooding.</li><li><i>Hurricane Watch</i> is issued when a tropical cyclone containing winds of 64 knots (74 mph) or higher poses a possible threat, generally within 48 hours. These winds may be accompanied by storm surge, coastal flooding, and/or river flooding. The watch does not mean that hurricane conditions will occur. It only means that these conditions are possible.</li><li><i>Hurricane Warning</i> is issued when sustained winds of 64 knots (74 mph) or higher associated with a tropical cyclone are expected in 36 hours or less. These winds may be accompanied by storm surge, coastal flooding, and/or river flooding. A hurricane warning can remain in effect when dangerously high water or a combination of dangerously high water and exceptionally high waves continue, even though winds may be less than hurricane force.</li></ul></li></ul></div><div><span style='font-size:x-large;'>Revisions</span></div><div><ul><li><strong>Sep 10, 2026</strong>: Adjusted Label on leading Forecast location to accurately reflect 3-hr processing/prep time.</li><li><strong>Aug 31, 2026</strong>: Adjusted ‘Event Label’ to correctly provide abbreviated Time Zone of user's location following Arcade update.</li><li><strong>Jul 23, 2026</strong>: Added ITCDVLP and IDVLBL fields to Forecast Position layer to differentiate storms based on basins.</li><li><strong>Mar 13, 2025</strong>: Altered 'Forecast Error Cone' layer to include 'Danger Area' with updated symbology.</li><li><strong>Nov 20, 2023</strong>: Added Event Label to 'Forecast Position' layer, showing arrival time and wind speed localized to user's location.</li><li><strong>Mar 27, 2022</strong>: Added UID, Max_SS, Max_Wind, Max_Gust, and Max_Label fields to ForecastErrorCone layer.</li></ul></div><div><p><span style='color:rgb(128,128,128);'>This map is provided for informational purposes and is not monitored 24/7 for accuracy and currency. Always refer to </span><a target='_blank' href='https://www.nhc.noaa.gov/contact.shtml' rel='nofollow ugc noopener noreferrer'><span style='color:rgb(128,128,128);'>NOAA</span></a><span style='color:rgb(128,128,128);'> or JTWC sources for official guidance.</span></p><div>&nbsp;</div><p>If you would like to be alerted to potential issues or simply see when this Service will update next, please visit our <a target='_blank' href='https://livingatlas.arcgis.com/livefeeds-status/' rel='nofollow ugc noopener noreferrer'>Live Feed Status</a> Page!</p></div>",
			"keyword": [
				"Esri",
				"NOAA",
				"NHC",
				"CPHC",
				"JTWC",
				"USNO",
				"Hurricane",
				"Typhoon",
				"Cyclone",
				"Weather",
				"Tropical",
				"Forecast",
				"Storm",
				"risk",
				"earth observations",
				"climate",
				"hosted",
				"esri_environment",
				"Active_Hurricanes",
				"Live Feeds",
				"livefeeds",
				"Alvin",
				"Barbara",
				"Cosme",
				"Dalila",
				"Erick",
				"Flossie",
				"Gil",
				"Henriette",
				"Ivo",
				"Juliette",
				"Kiko",
				"Lorena",
				"Mario",
				"Narda",
				"Octave",
				"Priscilla",
				"Raymond",
				"Sonia",
				"Tico",
				"Velma",
				"Wallis",
				"Xina",
				"York",
				"Zelda",
				"Andrea",
				"Barry",
				"Chantal",
				"Dexter",
				"Erin",
				"Fernand",
				"Gabrielle",
				"Humberto",
				"Imelda",
				"Jerry",
				"Karen",
				"Lorenzo",
				"Melissa",
				"Nestor",
				"Olga",
				"Pablo",
				"Rebekah",
				"Sebastien",
				"Tanya",
				"Van",
				"Wendy"
			],
			"issued": "2019-06-11T19:38:21.000Z",
			"modified": "2026-11-11T15:27:59.635Z",
			"publisher": {
				"name": "Esri"
			},
			"contactPoint": {
				"@type": "vcard:Contact",
				"fn": "esri_livefeeds2",
				"hasEmail": "{{orgContactEmail}}"
			},
			"accessLevel": "public",
			"spatial": "-180.0000,-90.0000,180.0000,90.0000",
			"license": "This work is licensed under the Esri Master License Agreement.<br /><div><a href='https://goto.arcgis.com/termsofuse/viewsummary' target='_blank' rel='nofollow ugc noopener noreferrer'><b>View Summary</b></a> | <a href='https://goto.arcgis.com/termsofuse/viewtermsofuse' target='_blank' rel='nofollow ugc noopener noreferrer'><b>View Terms of Use</b></a></div>",
			"distribution": [
				{
					"@type": "dcat:Distribution",
					"title": "ArcGIS Hub Dataset",
					"format": "Web Page",
					"mediaType": "text/html",
					"accessURL": "https://www.pacificgeoportal.com/datasets/esri2::hurricane-force-64kts"
				},
				{
					"@type": "dcat:Distribution",
					"title": "ArcGIS GeoService",
					"format": "ArcGIS GeoServices REST API",
					"mediaType": "application/json",
					"accessURL": "https://services9.arcgis.com/RHVPKKiFTONKtxq3/arcgis/rest/services/Active_Hurricanes_v1/FeatureServer/9"
				},
				{
					"@type": "dcat:Distribution",
					"title": "CSV",
					"format": "CSV",
					"mediaType": "text/csv",
					"accessURL": "https://www.pacificgeoportal.com/api/download/v1/items/248e7b5827a34b248647afb012c58787/csv?layers=9"
				},
				{
					"@type": "dcat:Distribution",
					"title": "Shapefile",
					"format": "ZIP",
					"mediaType": "application/zip",
					"accessURL": "https://www.pacificgeoportal.com/api/download/v1/items/248e7b5827a34b248647afb012c58787/shapefile?layers=9"
				},
				{
					"@type": "dcat:Distribution",
					"title": "GeoJSON",
					"format": "GeoJSON",
					"mediaType": "application/vnd.geo+json",
					"accessURL": "https://www.pacificgeoportal.com/api/download/v1/items/248e7b5827a34b248647afb012c58787/geojson?layers=9"
				},
				{
					"@type": "dcat:Distribution",
					"title": "KML",
					"format": "KML",
					"mediaType": "application/vnd.google-earth.kml+xml",
					"accessURL": "https://www.pacificgeoportal.com/api/download/v1/items/248e7b5827a34b248647afb012c58787/kml?layers=9"
				},
				{
					"@type": "dcat:Distribution",
					"title": "File Geodatabase",
					"format": "ZIP",
					"mediaType": "application/zip",
					"accessURL": "https://www.pacificgeoportal.com/api/download/v1/items/248e7b5827a34b248647afb012c58787/filegdb?layers=9"
				},
				{
					"@type": "dcat:Distribution",
					"title": "Feature Collection",
					"format": "TXT",
					"mediaType": "text/plain",
					"accessURL": "https://www.pacificgeoportal.com/api/download/v1/items/248e7b5827a34b248647afb012c58787/featureCollection?layers=9"
				},
				{
					"@type": "dcat:Distribution",
					"title": "Excel",
					"format": "XLSX",
					"mediaType": "application/vnd.ms-excel",
					"accessURL": "https://www.pacificgeoportal.com/api/download/v1/items/248e7b5827a34b248647afb012c58787/excel?layers=9"
				},
				{
					"@type": "dcat:Distribution",
					"title": "GeoPackage",
					"format": "GPKG",
					"mediaType": "application/geopackage+sqlite3",
					"accessURL": "https://www.pacificgeoportal.com/api/download/v1/items/248e7b5827a34b248647afb012c58787/geoPackage?layers=9"
				},
				{
					"@type": "dcat:Distribution",
					"title": "SQLite Geodatabase",
					"format": "GDB",
					"mediaType": "application/geopackage+sqlite3",
					"accessURL": "https://www.pacificgeoportal.com/api/download/v1/items/248e7b5827a34b248647afb012c58787/sqlite?layers=9"
				}
			],
			"theme": [
				"geospatial"
			]
		},
		{
			"@type": "dcat:Dataset",
			"identifier": "https://www.arcgis.com/home/item.html?id=8dcf5d4e124f480fa8c529fbe25ba04e",
			"landingPage": "https://www.pacificgeoportal.com/maps/esri2::openaq-recent-conditions-in-air-quality",
			"title": "OpenAQ Recent Conditions in Air Quality",
			"description": "<div>Every day activities such as driving, burning coal for electricity, wildfires, running factories, even cooking and cleaning, release particles into the air. Besides being an irritant, small particles of 10, 2.5, 1 micrometers (PM10, PM2.5, PM1) or less are a health hazard since they can get deep into the respiratory system and damage the delicate tissues.</div><div>&nbsp;</div><p>The exposure of populations to high levels of small particles increases the risk of respiratory and cardiovascular illnesses. The <a target='_blank' href='https://apps.who.int/iris/bitstream/handle/10665/69477/WHO_SDE_PHE_OEH_06.02_eng.pdf;jsessionid=899EE66D4431ABD26FE179B38FFB326D?sequence=1' rel='nofollow ugc noopener noreferrer'>World Health Organization (WHO) guidelines</a> provide long-term and short-term exposure limits to PM10 and PM2.5:<br />&nbsp;</p><div><div><ul><li>Long-term: PM10 20 µg/m³ annual mean and PM2.5 10 µg/m³</li><li>Short-term: PM10 50 µg/m³ 24-hour mean and PM2.5 25 µg/m³</li></ul><div>Exposure to PM10 and PM2.5 above these limits may significantly impact human health.</div></div></div><div>&nbsp;</div><div>The <a target='_blank' href='https://www.arcgis.com/home/item.html?id=8dcf5d4e124f480fa8c529fbe25ba04e' rel='nofollow ugc noopener noreferrer'>OpenAQ Recent Conditions in Air Quality</a> layers show the latest mass concentrations and particulate count for PM2.5, PM10, and PM1 of the stations in the OpenAQ data set with at least one value reported in the past 30 days.</div><div>&nbsp;</div><div>For more information please read our blog: <a target='_blank' href='https://www.esri.com/arcgis-blog/products/arcgis-living-atlas/mapping/a-breath-of-fresh-air' rel='nofollow ugc noopener noreferrer'>A Breath of Fresh Air</a></div><div>&nbsp;</div><div><strong>Source: </strong>The source information is the <a target='_blank' href='https://openaq.org' rel='nofollow ugc noopener noreferrer'>OpenAQ community</a> which reports measured concentrations (µg/m³) and particle matter count (particles/cm³) on a global scale by aggregating station data from national networks of air quality.</div><div>&nbsp;</div><div><strong>Update Frequency: </strong>It is updated every hour using the <a target='_blank' href='https://www.esriurl.com/LiveFeed' rel='nofollow ugc noopener noreferrer'>Aggregated Live Feed (ALF)</a> methodology.</div><div>&nbsp;</div><div><strong>Area Covered: </strong>Global</div><div>&nbsp;</div><div><div><span style='color:#696969; font-size:x-large;'>Revisions</span></div><div><ul><li><span style='font-size:medium;'><strong>Jan 25, 2025</strong></span>: Upgrade to OpenAQ API version 3\"</li><li><span style='font-size:medium;'><strong>Jan 18, 2024</strong></span>: Update to feed routine that allows stations w/o an identifier.<br />&nbsp;</li><li><span style='font-size:medium;'><strong>Jun 23, 2023</strong>: Added new fields: Location ID, Station URL; Provider, and Instrument names. The live feed routine was updated to increase reliability and improve the overall update process.</span></li><li><span style='font-size:medium;'><strong>Jul 21, 2022</strong>: Added service to </span><a target='_blank' href='https://livingatlas.arcgis.com/livefeeds-status/' rel='nofollow ugc noopener noreferrer'><span style='font-size:medium;'>Live Feed Status</span></a><span style='font-size:medium;'> Page for active monitoring!</span><br />&nbsp;</li><li><span style='font-size:medium;'><strong>Feb 8, 2022</strong>: Update of live feed routine to use OpenAQ API v2:</span><ul><li><span style='font-size:medium;'>Addition of PM10 and PM1 layers.</span></li><li><span style='font-size:medium;'>Values of particle matter count (particles/cm³) to all layers.</span></li><li><span style='font-size:medium;'>Update of field labels.</span></li><li><span style='font-size:medium;'>Removal of <i>SourceName </i>field.</span><br />&nbsp;</li></ul></li><li><span style='font-size:medium;'><strong>Feb 5, 2020</strong>: Official release of Feature Service offering.</span></li></ul><div><p><span style='font-size:medium;'>This layer is provided for informational purposes and is not monitored 24/7 for accuracy and currency.</span></p><div><br />&nbsp;</div><p><span style='font-size:medium;'>If you would like to be alerted to potential issues or simply see when this Service will update next, please visit our </span><a target='_blank' href='https://livingatlas.arcgis.com/livefeeds-status/' rel='nofollow ugc noopener noreferrer'><span style='font-size:medium;'>Live Feed Status</span></a><span style='font-size:medium;'> Page!</span></p></div></div></div>",
			"keyword": [
				"Air Quality",
				"PM2.5",
				"Global",
				"livefeeds2",
				"earth observations",
				"environment",
				"esri_environment",
				"OpenAQ",
				"Open AQ",
				"PM10",
				"PM1"
			],
			"issued": "2020-02-06T03:28:11.000Z",
			"modified": "2026-11-11T16:05:10.000Z",
			"publisher": {
				"name": "Esri"
			},
			"contactPoint": {
				"@type": "vcard:Contact",
				"fn": "esri_livefeeds2",
				"hasEmail": "{{orgContactEmail}}"
			},
			"accessLevel": "public",
			"spatial": "-179.5101,-69.5410,177.5259,71.2888",
			"license": "<div><img src='https://downloads.esri.com/blogs/arcgisonline/esrilogo_new.png' /> This work is licensed under the Esri Master License Agreement.<br /><div><a href='https://goto.arcgis.com/termsofuse/viewsummary' target='_blank' rel='nofollow ugc noopener noreferrer'><b>View Summary</b></a> | <a href='https://goto.arcgis.com/termsofuse/viewtermsofuse' target='_blank' rel='nofollow ugc noopener noreferrer'><b>View Terms of Use</b></a></div></div>",
			"distribution": [
				{
					"@type": "dcat:Distribution",
					"title": "ArcGIS Hub Dataset",
					"format": "Web Page",
					"mediaType": "text/html",
					"accessURL": "https://www.pacificgeoportal.com/maps/esri2::openaq-recent-conditions-in-air-quality"
				},
				{
					"@type": "dcat:Distribution",
					"title": "ArcGIS GeoService",
					"format": "ArcGIS GeoServices REST API",
					"mediaType": "application/json",
					"accessURL": "https://services9.arcgis.com/RHVPKKiFTONKtxq3/arcgis/rest/services/Air_Quality_PM25_Latest_Results/FeatureServer"
				}
			],
			"theme": [
				"geospatial"
			]
		},
		{
			"@type": "dcat:Dataset",
			"identifier": "https://www.arcgis.com/home/item.html?id=8dcf5d4e124f480fa8c529fbe25ba04e&sublayer=0",
			"landingPage": "https://www.pacificgeoportal.com/datasets/esri2::openaq-pm2-5",
			"title": "OpenAQ - PM2.5",
			"description": "<div>Every day activities such as driving, burning coal for electricity, wildfires, running factories, even cooking and cleaning, release particles into the air. Besides being an irritant, small particles of 10, 2.5, 1 micrometers (PM10, PM2.5, PM1) or less are a health hazard since they can get deep into the respiratory system and damage the delicate tissues.</div><div>&nbsp;</div><p>The exposure of populations to high levels of small particles increases the risk of respiratory and cardiovascular illnesses. The <a target='_blank' href='https://apps.who.int/iris/bitstream/handle/10665/69477/WHO_SDE_PHE_OEH_06.02_eng.pdf;jsessionid=899EE66D4431ABD26FE179B38FFB326D?sequence=1' rel='nofollow ugc noopener noreferrer'>World Health Organization (WHO) guidelines</a> provide long-term and short-term exposure limits to PM10 and PM2.5:<br />&nbsp;</p><div><div><ul><li>Long-term: PM10 20 µg/m³ annual mean and PM2.5 10 µg/m³</li><li>Short-term: PM10 50 µg/m³ 24-hour mean and PM2.5 25 µg/m³</li></ul><div>Exposure to PM10 and PM2.5 above these limits may significantly impact human health.</div></div></div><div>&nbsp;</div><div>The <a target='_blank' href='https://www.arcgis.com/home/item.html?id=8dcf5d4e124f480fa8c529fbe25ba04e' rel='nofollow ugc noopener noreferrer'>OpenAQ Recent Conditions in Air Quality</a> layers show the latest mass concentrations and particulate count for PM2.5, PM10, and PM1 of the stations in the OpenAQ data set with at least one value reported in the past 30 days.</div><div>&nbsp;</div><div>For more information please read our blog: <a target='_blank' href='https://www.esri.com/arcgis-blog/products/arcgis-living-atlas/mapping/a-breath-of-fresh-air' rel='nofollow ugc noopener noreferrer'>A Breath of Fresh Air</a></div><div>&nbsp;</div><div><strong>Source: </strong>The source information is the <a target='_blank' href='https://openaq.org' rel='nofollow ugc noopener noreferrer'>OpenAQ community</a> which reports measured concentrations (µg/m³) and particle matter count (particles/cm³) on a global scale by aggregating station data from national networks of air quality.</div><div>&nbsp;</div><div><strong>Update Frequency: </strong>It is updated every hour using the <a target='_blank' href='https://www.esriurl.com/LiveFeed' rel='nofollow ugc noopener noreferrer'>Aggregated Live Feed (ALF)</a> methodology.</div><div>&nbsp;</div><div><strong>Area Covered: </strong>Global</div><div>&nbsp;</div><div><div><span style='color:#696969; font-size:x-large;'>Revisions</span></div><div><ul><li><span style='font-size:medium;'><strong>Jan 25, 2025</strong></span>: Upgrade to OpenAQ API version 3\"</li><li><span style='font-size:medium;'><strong>Jan 18, 2024</strong></span>: Update to feed routine that allows stations w/o an identifier.<br />&nbsp;</li><li><span style='font-size:medium;'><strong>Jun 23, 2023</strong>: Added new fields: Location ID, Station URL; Provider, and Instrument names. The live feed routine was updated to increase reliability and improve the overall update process.</span></li><li><span style='font-size:medium;'><strong>Jul 21, 2022</strong>: Added service to </span><a target='_blank' href='https://livingatlas.arcgis.com/livefeeds-status/' rel='nofollow ugc noopener noreferrer'><span style='font-size:medium;'>Live Feed Status</span></a><span style='font-size:medium;'> Page for active monitoring!</span><br />&nbsp;</li><li><span style='font-size:medium;'><strong>Feb 8, 2022</strong>: Update of live feed routine to use OpenAQ API v2:</span><ul><li><span style='font-size:medium;'>Addition of PM10 and PM1 layers.</span></li><li><span style='font-size:medium;'>Values of particle matter count (particles/cm³) to all layers.</span></li><li><span style='font-size:medium;'>Update of field labels.</span></li><li><span style='font-size:medium;'>Removal of <i>SourceName </i>field.</span><br />&nbsp;</li></ul></li><li><span style='font-size:medium;'><strong>Feb 5, 2020</strong>: Official release of Feature Service offering.</span></li></ul><div><p><span style='font-size:medium;'>This layer is provided for informational purposes and is not monitored 24/7 for accuracy and currency.</span></p><div><br />&nbsp;</div><p><span style='font-size:medium;'>If you would like to be alerted to potential issues or simply see when this Service will update next, please visit our </span><a target='_blank' href='https://livingatlas.arcgis.com/livefeeds-status/' rel='nofollow ugc noopener noreferrer'><span style='font-size:medium;'>Live Feed Status</span></a><span style='font-size:medium;'> Page!</span></p></div></div></div>",
			"keyword": [
				"Air Quality",
				"PM2.5",
				"Global",
				"livefeeds2",
				"earth observations",
				"environment",
				"esri_environment",
				"OpenAQ",
				"Open AQ",
				"PM10",
				"PM1"
			],
			"issued": "2020-02-06T03:28:11.000Z",
			"modified": "2026-11-11T16:05:09.640Z",
			"publisher": {
				"name": "Esri"
			},
			"contactPoint": {
				"@type": "vcard:Contact",
				"fn": "esri_livefeeds2",
				"hasEmail": "{{orgContactEmail}}"
			},
			"accessLevel": "public",
			"spatial": "-179.5101,-69.5410,177.5259,70.1319",
			"license": "<div><img src='https://downloads.esri.com/blogs/arcgisonline/esrilogo_new.png' /> This work is licensed under the Esri Master License Agreement.<br /><div><a href='https://goto.arcgis.com/termsofuse/viewsummary' target='_blank' rel='nofollow ugc noopener noreferrer'><b>View Summary</b></a> | <a href='https://goto.arcgis.com/termsofuse/viewtermsofuse' target='_blank' rel='nofollow ugc noopener noreferrer'><b>View Terms of Use</b></a></div></div>",
			"distribution": [
				{
					"@type": "dcat:Distribution",
					"title": "ArcGIS Hub Dataset",
					"format": "Web Page",
					"mediaType": "text/html",
					"accessURL": "https://www.pacificgeoportal.com/datasets/esri2::openaq-pm2-5"
				},
				{
					"@type": "dcat:Distribution",
					"title": "ArcGIS GeoService",
					"format": "ArcGIS GeoServices REST API",
					"mediaType": "application/json",
					"accessURL": "https://services9.arcgis.com/RHVPKKiFTONKtxq3/arcgis/rest/services/Air_Quality_PM25_Latest_Results/FeatureServer/0"
				},
				{
					"@type": "dcat:Distribution",
					"title": "CSV",
					"format": "CSV",
					"mediaType": "text/csv",
					"accessURL": "https://www.pacificgeoportal.com/api/download/v1/items/8dcf5d4e124f480fa8c529fbe25ba04e/csv?layers=0"
				},
				{
					"@type": "dcat:Distribution",
					"title": "Shapefile",
					"format": "ZIP",
					"mediaType": "application/zip",
					"accessURL": "https://www.pacificgeoportal.com/api/download/v1/items/8dcf5d4e124f480fa8c529fbe25ba04e/shapefile?layers=0"
				},
				{
					"@type": "dcat:Distribution",
					"title": "GeoJSON",
					"format": "GeoJSON",
					"mediaType": "application/vnd.geo+json",
					"accessURL": "https://www.pacificgeoportal.com/api/download/v1/items/8dcf5d4e124f480fa8c529fbe25ba04e/geojson?layers=0"
				},
				{
					"@type": "dcat:Distribution",
					"title": "KML",
					"format": "KML",
					"mediaType": "application/vnd.google-earth.kml+xml",
					"accessURL": "https://www.pacificgeoportal.com/api/download/v1/items/8dcf5d4e124f480fa8c529fbe25ba04e/kml?layers=0"
				}
			],
			"theme": [
				"geospatial"
			]
		},
		{
			"@type": "dcat:Dataset",
			"identifier": "https://www.arcgis.com/home/item.html?id=8dcf5d4e124f480fa8c529fbe25ba04e&sublayer=1",
			"landingPage": "https://www.pacificgeoportal.com/datasets/esri2::openaq-pm10",
			"title": "OpenAQ - PM10",
			"description": "<div>Every day activities such as driving, burning coal for electricity, wildfires, running factories, even cooking and cleaning, release particles into the air. Besides being an irritant, small particles of 10, 2.5, 1 micrometers (PM10, PM2.5, PM1) or less are a health hazard since they can get deep into the respiratory system and damage the delicate tissues.</div><div>&nbsp;</div><p>The exposure of populations to high levels of small particles increases the risk of respiratory and cardiovascular illnesses. The <a target='_blank' href='https://apps.who.int/iris/bitstream/handle/10665/69477/WHO_SDE_PHE_OEH_06.02_eng.pdf;jsessionid=899EE66D4431ABD26FE179B38FFB326D?sequence=1' rel='nofollow ugc noopener noreferrer'>World Health Organization (WHO) guidelines</a> provide long-term and short-term exposure limits to PM10 and PM2.5:<br />&nbsp;</p><div><div><ul><li>Long-term: PM10 20 µg/m³ annual mean and PM2.5 10 µg/m³</li><li>Short-term: PM10 50 µg/m³ 24-hour mean and PM2.5 25 µg/m³</li></ul><div>Exposure to PM10 and PM2.5 above these limits may significantly impact human health.</div></div></div><div>&nbsp;</div><div>The <a target='_blank' href='https://www.arcgis.com/home/item.html?id=8dcf5d4e124f480fa8c529fbe25ba04e' rel='nofollow ugc noopener noreferrer'>OpenAQ Recent Conditions in Air Quality</a> layers show the latest mass concentrations and particulate count for PM2.5, PM10, and PM1 of the stations in the OpenAQ data set with at least one value reported in the past 30 days.</div><div>&nbsp;</div><div>For more information please read our blog: <a target='_blank' href='https://www.esri.com/arcgis-blog/products/arcgis-living-atlas/mapping/a-breath-of-fresh-air' rel='nofollow ugc noopener noreferrer'>A Breath of Fresh Air</a></div><div>&nbsp;</div><div><strong>Source: </strong>The source information is the <a target='_blank' href='https://openaq.org' rel='nofollow ugc noopener noreferrer'>OpenAQ community</a> which reports measured concentrations (µg/m³) and particle matter count (particles/cm³) on a global scale by aggregating station data from national networks of air quality.</div><div>&nbsp;</div><div><strong>Update Frequency: </strong>It is updated every hour using the <a target='_blank' href='https://www.esriurl.com/LiveFeed' rel='nofollow ugc noopener noreferrer'>Aggregated Live Feed (ALF)</a> methodology.</div><div>&nbsp;</div><div><strong>Area Covered: </strong>Global</div><div>&nbsp;</div><div><div><span style='color:#696969; font-size:x-large;'>Revisions</span></div><div><ul><li><span style='font-size:medium;'><strong>Jan 25, 2025</strong></span>: Upgrade to OpenAQ API version 3\"</li><li><span style='font-size:medium;'><strong>Jan 18, 2024</strong></span>: Update to feed routine that allows stations w/o an identifier.<br />&nbsp;</li><li><span style='font-size:medium;'><strong>Jun 23, 2023</strong>: Added new fields: Location ID, Station URL; Provider, and Instrument names. The live feed routine was updated to increase reliability and improve the overall update process.</span></li><li><span style='font-size:medium;'><strong>Jul 21, 2022</strong>: Added service to </span><a target='_blank' href='https://livingatlas.arcgis.com/livefeeds-status/' rel='nofollow ugc noopener noreferrer'><span style='font-size:medium;'>Live Feed Status</span></a><span style='font-size:medium;'> Page for active monitoring!</span><br />&nbsp;</li><li><span style='font-size:medium;'><strong>Feb 8, 2022</strong>: Update of live feed routine to use OpenAQ API v2:</span><ul><li><span style='font-size:medium;'>Addition of PM10 and PM1 layers.</span></li><li><span style='font-size:medium;'>Values of particle matter count (particles/cm³) to all layers.</span></li><li><span style='font-size:medium;'>Update of field labels.</span></li><li><span style='font-size:medium;'>Removal of <i>SourceName </i>field.</span><br />&nbsp;</li></ul></li><li><span style='font-size:medium;'><strong>Feb 5, 2020</strong>: Official release of Feature Service offering.</span></li></ul><div><p><span style='font-size:medium;'>This layer is provided for informational purposes and is not monitored 24/7 for accuracy and currency.</span></p><div><br />&nbsp;</div><p><span style='font-size:medium;'>If you would like to be alerted to potential issues or simply see when this Service will update next, please visit our </span><a target='_blank' href='https://livingatlas.arcgis.com/livefeeds-status/' rel='nofollow ugc noopener noreferrer'><span style='font-size:medium;'>Live Feed Status</span></a><span style='font-size:medium;'> Page!</span></p></div></div></div>",
			"keyword": [
				"Air Quality",
				"PM2.5",
				"Global",
				"livefeeds2",
				"earth observations",
				"environment",
				"esri_environment",
				"OpenAQ",
				"Open AQ",
				"PM10",
				"PM1"
			],
			"issued": "2020-02-06T03:28:11.000Z",
			"modified": "2026-11-11T16:05:09.640Z",
			"publisher": {
				"name": "Esri"
			},
			"contactPoint": {
				"@type": "vcard:Contact",
				"fn": "esri_livefeeds2",
				"hasEmail": "{{orgContactEmail}}"
			},
			"accessLevel": "public",
			"spatial": "-179.5101,-69.5410,177.5259,71.2888",
			"license": "<div><img src='https://downloads.esri.com/blogs/arcgisonline/esrilogo_new.png' /> This work is licensed under the Esri Master License Agreement.<br /><div><a href='https://goto.arcgis.com/termsofuse/viewsummary' target='_blank' rel='nofollow ugc noopener noreferrer'><b>View Summary</b></a> | <a href='https://goto.arcgis.com/termsofuse/viewtermsofuse' target='_blank' rel='nofollow ugc noopener noreferrer'><b>View Terms of Use</b></a></div></div>",
			"distribution": [
				{
					"@type": "dcat:Distribution",
					"title": "ArcGIS Hub Dataset",
					"format": "Web Page",
					"mediaType": "text/html",
					"accessURL": "https://www.pacificgeoportal.com/datasets/esri2::openaq-pm10"
				},
				{
					"@type": "dcat:Distribution",
					"title": "ArcGIS GeoService",
					"format": "ArcGIS GeoServices REST API",
					"mediaType": "application/json",
					"accessURL": "https://services9.arcgis.com/RHVPKKiFTONKtxq3/arcgis/rest/services/Air_Quality_PM25_Latest_Results/FeatureServer/1"
				},
				{
					"@type": "dcat:Distribution",
					"title": "CSV",
					"format": "CSV",
					"mediaType": "text/csv",
					"accessURL": "https://www.pacificgeoportal.com/api/download/v1/items/8dcf5d4e124f480fa8c529fbe25ba04e/csv?layers=1"
				},
				{
					"@type": "dcat:Distribution",
					"title": "Shapefile",
					"format": "ZIP",
					"mediaType": "application/zip",
					"accessURL": "https://www.pacificgeoportal.com/api/download/v1/items/8dcf5d4e124f480fa8c529fbe25ba04e/shapefile?layers=1"
				},
				{
					"@type": "dcat:Distribution",
					"title": "GeoJSON",
					"format": "GeoJSON",
					"mediaType": "application/vnd.geo+json",
					"accessURL": "https://www.pacificgeoportal.com/api/download/v1/items/8dcf5d4e124f480fa8c529fbe25ba04e/geojson?layers=1"
				},
				{
					"@type": "dcat:Distribution",
					"title": "KML",
					"format": "KML",
					"mediaType": "application/vnd.google-earth.kml+xml",
					"accessURL": "https://www.pacificgeoportal.com/api/download/v1/items/8dcf5d4e124f480fa8c529fbe25ba04e/kml?layers=1"
				}
			],
			"theme": [
				"geospatial"
			]
		},
		{
			"@type": "dcat:Dataset",
			"identifier": "https://www.arcgis.com/home/item.html?id=8dcf5d4e124f480fa8c529fbe25ba04e&sublayer=2",
			"landingPage": "https://www.pacificgeoportal.com/datasets/esri2::openaq-pm1",
			"title": "OpenAQ - PM1",
			"description": "<div>Every day activities such as driving, burning coal for electricity, wildfires, running factories, even cooking and cleaning, release particles into the air. Besides being an irritant, small particles of 10, 2.5, 1 micrometers (PM10, PM2.5, PM1) or less are a health hazard since they can get deep into the respiratory system and damage the delicate tissues.</div><div>&nbsp;</div><p>The exposure of populations to high levels of small particles increases the risk of respiratory and cardiovascular illnesses. The <a target='_blank' href='https://apps.who.int/iris/bitstream/handle/10665/69477/WHO_SDE_PHE_OEH_06.02_eng.pdf;jsessionid=899EE66D4431ABD26FE179B38FFB326D?sequence=1' rel='nofollow ugc noopener noreferrer'>World Health Organization (WHO) guidelines</a> provide long-term and short-term exposure limits to PM10 and PM2.5:<br />&nbsp;</p><div><div><ul><li>Long-term: PM10 20 µg/m³ annual mean and PM2.5 10 µg/m³</li><li>Short-term: PM10 50 µg/m³ 24-hour mean and PM2.5 25 µg/m³</li></ul><div>Exposure to PM10 and PM2.5 above these limits may significantly impact human health.</div></div></div><div>&nbsp;</div><div>The <a target='_blank' href='https://www.arcgis.com/home/item.html?id=8dcf5d4e124f480fa8c529fbe25ba04e' rel='nofollow ugc noopener noreferrer'>OpenAQ Recent Conditions in Air Quality</a> layers show the latest mass concentrations and particulate count for PM2.5, PM10, and PM1 of the stations in the OpenAQ data set with at least one value reported in the past 30 days.</div><div>&nbsp;</div><div>For more information please read our blog: <a target='_blank' href='https://www.esri.com/arcgis-blog/products/arcgis-living-atlas/mapping/a-breath-of-fresh-air' rel='nofollow ugc noopener noreferrer'>A Breath of Fresh Air</a></div><div>&nbsp;</div><div><strong>Source: </strong>The source information is the <a target='_blank' href='https://openaq.org' rel='nofollow ugc noopener noreferrer'>OpenAQ community</a> which reports measured concentrations (µg/m³) and particle matter count (particles/cm³) on a global scale by aggregating station data from national networks of air quality.</div><div>&nbsp;</div><div><strong>Update Frequency: </strong>It is updated every hour using the <a target='_blank' href='https://www.esriurl.com/LiveFeed' rel='nofollow ugc noopener noreferrer'>Aggregated Live Feed (ALF)</a> methodology.</div><div>&nbsp;</div><div><strong>Area Covered: </strong>Global</div><div>&nbsp;</div><div><div><span style='color:#696969; font-size:x-large;'>Revisions</span></div><div><ul><li><span style='font-size:medium;'><strong>Jan 25, 2025</strong></span>: Upgrade to OpenAQ API version 3\"</li><li><span style='font-size:medium;'><strong>Jan 18, 2024</strong></span>: Update to feed routine that allows stations w/o an identifier.<br />&nbsp;</li><li><span style='font-size:medium;'><strong>Jun 23, 2023</strong>: Added new fields: Location ID, Station URL; Provider, and Instrument names. The live feed routine was updated to increase reliability and improve the overall update process.</span></li><li><span style='font-size:medium;'><strong>Jul 21, 2022</strong>: Added service to </span><a target='_blank' href='https://livingatlas.arcgis.com/livefeeds-status/' rel='nofollow ugc noopener noreferrer'><span style='font-size:medium;'>Live Feed Status</span></a><span style='font-size:medium;'> Page for active monitoring!</span><br />&nbsp;</li><li><span style='font-size:medium;'><strong>Feb 8, 2022</strong>: Update of live feed routine to use OpenAQ API v2:</span><ul><li><span style='font-size:medium;'>Addition of PM10 and PM1 layers.</span></li><li><span style='font-size:medium;'>Values of particle matter count (particles/cm³) to all layers.</span></li><li><span style='font-size:medium;'>Update of field labels.</span></li><li><span style='font-size:medium;'>Removal of <i>SourceName </i>field.</span><br />&nbsp;</li></ul></li><li><span style='font-size:medium;'><strong>Feb 5, 2020</strong>: Official release of Feature Service offering.</span></li></ul><div><p><span style='font-size:medium;'>This layer is provided for informational purposes and is not monitored 24/7 for accuracy and currency.</span></p><div><br />&nbsp;</div><p><span style='font-size:medium;'>If you would like to be alerted to potential issues or simply see when this Service will update next, please visit our </span><a target='_blank' href='https://livingatlas.arcgis.com/livefeeds-status/' rel='nofollow ugc noopener noreferrer'><span style='font-size:medium;'>Live Feed Status</span></a><span style='font-size:medium;'> Page!</span></p></div></div></div>",
			"keyword": [
				"Air Quality",
				"PM2.5",
				"Global",
				"livefeeds2",
				"earth observations",
				"environment",
				"esri_environment",
				"OpenAQ",
				"Open AQ",
				"PM10",
				"PM1"
			],
			"issued": "2020-02-06T03:28:11.000Z",
			"modified": "2026-11-11T16:05:09.640Z",
			"publisher": {
				"name": "Esri"
			},
			"contactPoint": {
				"@type": "vcard:Contact",
				"fn": "esri_livefeeds2",
				"hasEmail": "{{orgContactEmail}}"
			},
			"accessLevel": "public",
			"spatial": "-162.5714,-69.5410,177.5259,69.6596",
			"license": "<div><img src='https://downloads.esri.com/blogs/arcgisonline/esrilogo_new.png' /> This work is licensed under the Esri Master License Agreement.<br /><div><a href='https://goto.arcgis.com/termsofuse/viewsummary' target='_blank' rel='nofollow ugc noopener noreferrer'><b>View Summary</b></a> | <a href='https://goto.arcgis.com/termsofuse/viewtermsofuse' target='_blank' rel='nofollow ugc noopener noreferrer'><b>View Terms of Use</b></a></div></div>",
			"distribution": [
				{
					"@type": "dcat:Distribution",
					"title": "ArcGIS Hub Dataset",
					"format": "Web Page",
					"mediaType": "text/html",
					"accessURL": "https://www.pacificgeoportal.com/datasets/esri2::openaq-pm1"
				},
				{
					"@type": "dcat:Distribution",
					"title": "ArcGIS GeoService",
					"format": "ArcGIS GeoServices REST API",
					"mediaType": "application/json",
					"accessURL": "https://services9.arcgis.com/RHVPKKiFTONKtxq3/arcgis/rest/services/Air_Quality_PM25_Latest_Results/FeatureServer/2"
				},
				{
					"@type": "dcat:Distribution",
					"title": "CSV",
					"format": "CSV",
					"mediaType": "text/csv",
					"accessURL": "https://www.pacificgeoportal.com/api/download/v1/items/8dcf5d4e124f480fa8c529fbe25ba04e/csv?layers=2"
				},
				{
					"@type": "dcat:Distribution",
					"title": "Shapefile",
					"format": "ZIP",
					"mediaType": "application/zip",
					"accessURL": "https://www.pacificgeoportal.com/api/download/v1/items/8dcf5d4e124f480fa8c529fbe25ba04e/shapefile?layers=2"
				},
				{
					"@type": "dcat:Distribution",
					"title": "GeoJSON",
					"format": "GeoJSON",
					"mediaType": "application/vnd.geo+json",
					"accessURL": "https://www.pacificgeoportal.com/api/download/v1/items/8dcf5d4e124f480fa8c529fbe25ba04e/geojson?layers=2"
				},
				{
					"@type": "dcat:Distribution",
					"title": "KML",
					"format": "KML",
					"mediaType": "application/vnd.google-earth.kml+xml",
					"accessURL": "https://www.pacificgeoportal.com/api/download/v1/items/8dcf5d4e124f480fa8c529fbe25ba04e/kml?layers=2"
				}
			],
			"theme": [
				"geospatial"
			]
		},
		{
			"@type": "dcat:Dataset",
			"identifier": "https://www.arcgis.com/home/item.html?id=dece90af1a0242dcbf0ca36d30276aa3&sublayer=0",
			"landingPage": "https://www.pacificgeoportal.com/datasets/esri2::satellite-viirs-thermal-hotspots-and-fire-activity",
			"title": "Satellite (VIIRS) Thermal Hotspots and Fire Activity",
			"description": "<div style='text-align:center;'><span style='background-color:#ffc0cb; color:#000000;'>* Please NOTE * As of November 1, 2026, data from the Suomi NPP satellite will cease to be available from NASA. See </span><a target='_blank' href='https://www.nesdis.noaa.gov/news/cessation-of-suomi-national-polar-orbiting-partnership-s-npp-data-users-onafter-november-01-2026' rel='nofollow ugc noopener noreferrer'><span style='background-color:#ffc0cb; color:#000000;'><strong>NASA's announcement dated August 3, 2026</strong></span></a><span style='background-color:#ffc0cb; color:#000000;'> * Data updates from NOAA-20 and NOAA-21 will continue to be available *</span></div><div>&nbsp;</div><div>This layer presents detectable thermal activity from VIIRS satellites for the last 7 days. VIIRS Thermal Hotspots and Fire Activity is a product of NASA’s Land, Atmosphere Near real-time Capability for EOS (LANCE) Earth Observation Data, part of NASA's Earth Science Data.</div><div>&nbsp;</div><div><div><p><strong>Consumption Best Practices:</strong></p><ul><li>As a service that is subject to very high usage, ensure peak performance and accessibility of your maps and apps by avoiding the use of non-cacheable relative Date/Time field filters. To accommodate filtering events by Date/Time, we suggest using the included \"Age\" fields that maintain the number of days or hours since a record was created or last modified, compared to the last service update. These queries fully support the ability to cache a response, allowing common query results to be efficiently provided to users in a high demand service environment.</li><li>When ingesting this service in your applications, avoid using <a target='_blank' href='https://en.wikipedia.org/wiki/POST_(HTTP)' rel='nofollow ugc noopener noreferrer'><strong>POST</strong></a> requests whenever possible. These requests can compromise performance and scalability during periods of high usage because they too are not cacheable.</li></ul><p>&nbsp;</p></div></div><p><strong>Source: </strong><a target='_blank' href='https://firms2.modaps.eosdis.nasa.gov/active_fire/' rel='nofollow ugc noopener noreferrer'><strong>NASA LANCE - VNP14IMG_NRT active fire detection - World</strong></a><br /><strong>Scale/Resolution:</strong> 375-meter<br /><strong>Update Frequency:</strong> Hourly (depending on source availability) using the aggregated live feed methodology<br /><strong>Area Covered:</strong> World<br /><br /><strong>What can I do with this layer?</strong><br />This layer represents the most frequently updated and most detailed global remotely sensed wildfire information. Detection attributes include time, location, and intensity. It can be used to track the location of fires from the recent past, a few hours up to seven days behind real time. This layer also shows the location of wildfire over the past 7 days as a time-enabled service so that the progress of fires over that timeframe can be reproduced as an animation.<br /><br />The VIIRS thermal activity layer can be used to visualize and assess wildfires worldwide. However, it should be noted that this dataset contains many “false positives” (e.g., oil/natural gas wells or volcanoes) since the satellite will detect any large thermal signal.<br /><br />Fire points in this service are generally available within 3 1/4 hours after detection by a VIIRS device. LANCE estimates availability at around 3 hours after detection, and esri livefeeds check for updates every 20 minutes from LANCE.<br /><br />Even though these data display as point features, each point in fact represents a pixel that is &gt;= 375 m high and wide. A point feature means somewhere in this pixel at least one \"hot\" spot was detected which may be a fire.<br /><br />VIIRS is a scanning radiometer device aboard the Suomi NPP (ending Nov 1, 2026), NOAA-20, and NOAA-21 satellites that collects imagery and radiometric measurements of the land, atmosphere, cryosphere, and oceans in several visible and infrared bands. The VIIRS Thermal Hotspots and Fire Activity layer is a livefeed from a subset of the overall VIIRS imagery, in particular from NASA's VNP14IMG_NRT active fire detection product. The source downloads are monitored automatically and retrieved from LANCE, NASA's near real time data and imagery site, every 20 minutes when updates detected.<br /><br />The 375-m data complements the 1-km Moderate Resolution Imaging Spectroradiometer (MODIS) Thermal Hotspots and Fire Activity layer; they both show good agreement in hotspot detection but the improved spatial resolution of the 375 m data provides a greater response over fires of relatively small areas and provides improved mapping of large fire perimeters.</p><p>Pleae read more in our blog:&nbsp;<a target='_blank' href='https://www.esri.com/arcgis-blog/products/arcgis-living-atlas/mapping/using-arcade-to-extract-meaning-from-satellite-fire-detections' rel='nofollow ugc noopener noreferrer'>Using Arcade to Extract Meaning from Satellite Fire Detections</a>.<br /><br /><span style='font-size:large;'>Attribute information</span></p><ul><li><strong>Latitude and Longitude:</strong> The center point location of the 375 m (approximately) pixel flagged as containing one or more fires/hotspots.</li><li><strong>Satellite:</strong> Whether the detection was picked up by the Suomi NPP satellite (N) or NOAA-20 satellite (1) or NOAA-21 satellite (2). For best results, use the virtual field <i>WhichSatellite</i>, redefined by an arcade expression, that gives the complete satellite name.</li><li><strong>Confidence:</strong> The detection confidence is a quality flag of the individual hotspot/active fire pixel. This value is based on a collection of intermediate algorithm quantities used in the detection process. It is intended to help users gauge the quality of individual hotspot/fire pixels. Confidence values are set to low, nominal and high. Low confidence daytime fire pixels are typically associated with areas of sun glint and lower relative temperature anomaly (&lt;15K) in the mid-infrared channel I4. Nominal confidence pixels are those free of potential sun glint contamination during the day and marked by strong (&gt;15K) temperature anomaly in either day or nighttime data. High confidence fire pixels are associated with day or nighttime saturated pixels.</li><li>Please note: Low confidence nighttime pixels occur only over the geographic area extending from 11 deg E to 110 deg W and 7 deg N to 55 deg S. This area describes the region of influence of the South Atlantic Magnetic Anomaly which can cause spurious brightness temperatures in the mid-infrared channel I4 leading to potential false positive alarms. These have been removed from the NRT data distributed by FIRMS.</li><li><strong>FRP:</strong> Fire Radiative Power. Depicts the pixel-integrated fire radiative power in MW (MegaWatts). FRP provides information on the measured radiant heat output of detected fires. The amount of radiant heat energy liberated per unit time (the Fire Radiative Power) is thought to be related to the rate at which fuel is being consumed (Wooster et. al. (2005)).</li><li><strong>DayNight:</strong> D = Daytime fire, N = Nighttime fire</li><li><strong>Hours Old</strong>: Derived field that provides age of record in hours between Acquisition date/time and latest update date/time. 0 = less than 1 hour ago, 1 = less than 2 hours ago, 2 = less than 3 hours ago, and so on.</li></ul><div>&nbsp;</div><div>Additional information can be found on the NASA FIRMS site&nbsp;<a target='_blank' href='https://www.earthdata.nasa.gov/data/tools/firms/faq' rel='nofollow ugc noopener noreferrer'><span style='font-size:medium;'><strong>FAQ</strong></span></a>.<br /><br /><strong>Note about near real time data:</strong><br />Near real time data is not checked thoroughly before it's posted on LANCE or downloaded and posted to the Living Atlas. NASA's goal is to get vital fire information to its customers within three hours of observation time. However, the data is screened by a confidence algorithm which seeks to help users gauge the quality of individual hotspot/fire points. Low confidence daytime fire pixels are typically associated with areas of sun glint and lower relative temperature anomaly (&lt;15K) in the mid-infrared channel I4. Medium confidence pixels are those free of potential sun glint contamination during the day and marked by strong (&gt;15K) temperature anomaly in either day or nighttime data. High confidence fire pixels are associated with day or nighttime saturated pixels.<br />&nbsp;</div><div><span style='font-size:x-large;'>Revisions</span></div><div><ul><li><strong>August 10, 2026</strong>: Added Notation regarding Suomi NPP satellite.</li><li><strong>March 9, 2026</strong>: Switched back to primary source site ‘firms’ to get around data delivery delays on alternate ‘firms2’ site.</li><li><strong>September 10, 2025</strong>: Switched to alternate source site ‘firms2’ to get around data delivery delays on primary ‘firms’ site.</li><li><strong>March 7, 2024</strong>: Updated to include source data from NOAA-21 Satellite.&nbsp;</li><li><strong>September 15, 2022</strong>: Updated to include 'Hours_Old' field. Time series has been disabled by default, but still available.&nbsp;</li><li><strong>July 5, 2022</strong>: Terms of Use updated to Esri Master License Agreement, no longer stating that a subscription is required!</li></ul><p>&nbsp;</p></div><div><p>This layer is provided for informational purposes and is not monitored 24/7 for accuracy and currency.</p><p>If you would like to be alerted to potential issues or simply see when this Service will update next, please visit our <a target='_blank' href='https://livingatlas.arcgis.com/livefeeds-status/' rel='nofollow ugc noopener noreferrer'><strong>Live Feed Status</strong></a> Page!</p></div>",
			"keyword": [
				"viirs",
				"fire",
				"fires",
				"LANCE",
				"FIRMS",
				"NOAA20",
				"NOAA-20",
				"SuomiNPP",
				"Suomi NPP",
				"SNPP",
				"hotspot",
				"hotspots",
				"hot spot",
				"hot spots",
				"detections",
				"detection",
				"VNP14IMG_NRT",
				"thermal",
				"EOS",
				"NASA",
				"wildfire",
				"hosted",
				"environment",
				"esri_environment",
				"earth observations"
			],
			"issued": "2020-04-01T20:37:09.000Z",
			"modified": "2026-11-11T15:55:42.219Z",
			"publisher": {
				"name": "Esri"
			},
			"contactPoint": {
				"@type": "vcard:Contact",
				"fn": "esri_livefeeds2",
				"hasEmail": "{{orgContactEmail}}"
			},
			"accessLevel": "public",
			"spatial": "-179.3156,-84.5384,179.8773,76.1240",
			"license": "<img src='https://downloads.esri.com/blogs/arcgisonline/esrilogo_new.png' /> This work is licensed under the Esri Master License Agreement.<br /><div><a href='https://goto.arcgis.com/termsofuse/viewsummary' target='_blank' rel='nofollow ugc noopener noreferrer'><b>View Summary</b></a> | <a href='https://goto.arcgis.com/termsofuse/viewtermsofuse' target='_blank' rel='nofollow ugc noopener noreferrer'><b>View Terms of Use</b></a></div>",
			"distribution": [
				{
					"@type": "dcat:Distribution",
					"title": "ArcGIS Hub Dataset",
					"format": "Web Page",
					"mediaType": "text/html",
					"accessURL": "https://www.pacificgeoportal.com/datasets/esri2::satellite-viirs-thermal-hotspots-and-fire-activity"
				},
				{
					"@type": "dcat:Distribution",
					"title": "ArcGIS GeoService",
					"format": "ArcGIS GeoServices REST API",
					"mediaType": "application/json",
					"accessURL": "https://services9.arcgis.com/RHVPKKiFTONKtxq3/arcgis/rest/services/Satellite_VIIRS_Thermal_Hotspots_and_Fire_Activity/FeatureServer/0"
				},
				{
					"@type": "dcat:Distribution",
					"title": "CSV",
					"format": "CSV",
					"mediaType": "text/csv",
					"accessURL": "https://www.pacificgeoportal.com/api/download/v1/items/dece90af1a0242dcbf0ca36d30276aa3/csv?layers=0"
				},
				{
					"@type": "dcat:Distribution",
					"title": "Shapefile",
					"format": "ZIP",
					"mediaType": "application/zip",
					"accessURL": "https://www.pacificgeoportal.com/api/download/v1/items/dece90af1a0242dcbf0ca36d30276aa3/shapefile?layers=0"
				},
				{
					"@type": "dcat:Distribution",
					"title": "GeoJSON",
					"format": "GeoJSON",
					"mediaType": "application/vnd.geo+json",
					"accessURL": "https://www.pacificgeoportal.com/api/download/v1/items/dece90af1a0242dcbf0ca36d30276aa3/geojson?layers=0"
				},
				{
					"@type": "dcat:Distribution",
					"title": "KML",
					"format": "KML",
					"mediaType": "application/vnd.google-earth.kml+xml",
					"accessURL": "https://www.pacificgeoportal.com/api/download/v1/items/dece90af1a0242dcbf0ca36d30276aa3/kml?layers=0"
				}
			],
			"theme": [
				"geospatial"
			]
		},
		{
			"@type": "dcat:Dataset",
			"identifier": "https://www.arcgis.com/home/item.html?id=26e71d14067c4b3f8dd31d1a4e008cfb",
			"landingPage": "https://www.pacificgeoportal.com/maps/esri2::noaa-coral-reef-watch-crw-virtual-stations",
			"title": "NOAA Coral Reef Watch (CRW) Virtual Stations",
			"description": "<div><span style='text-align:justify;'>Coral reefs are one of the most diverse and ecologically important areas of the world. However, many reefs, are threatened by ocean temperatures that are increasingly becoming warmer than the coral animals' natural tolerance. According to&nbsp;</span><a target='_blank' href='https://oceanservice.noaa.gov/facts/coral_bleach.html' rel='nofollow ugc noopener noreferrer'><strong>NOAA</strong></a><span style='text-align:justify;'>, when&nbsp;</span>water is too warm, corals will expel the algae (zooxanthellae) living in their tissues causing the coral to turn completely white. This is called coral bleaching. When a coral bleaches, it is not dead. Corals can survive a bleaching event, but they are under more stress and are subject to mortality.</div><div>&nbsp;</div><p><span style='text-align:justify;'>The&nbsp;</span><a target='_blank' href='https://coralreefwatch.noaa.gov/' rel='nofollow ugc noopener noreferrer'><strong>NOAA Coral Reef Watch</strong></a><span style='text-align:justify;'>&nbsp;program uses satellite data to provide current reef environmental conditions to quickly identify areas at risk for&nbsp;coral bleaching. The station data displayed in this map are derived from satellite based measurements of ocean temperature. These \"virtual stations\" are not actual&nbsp;buoys or&nbsp;</span><i><span style='text-align:justify;'>in situ</span></i><span style='text-align:justify;'>&nbsp;stations transmitting data, rather a spatial analyses for reef locations around the world are derived from 5 km resolution raster data.&nbsp;</span></p><div style='text-align:justify;'>&nbsp;</div><div style='text-align:justify;'>There are 213 points for the virtual stations around the world along with polygons describing the major tropical coral reef systems.&nbsp;</div><div><br />&nbsp;</div><div><span style='text-align:justify;'><strong>Each station has several variables:&nbsp;</strong></span></div><div style='text-align:justify;'><ul><li><i><span style='text-align:justify;'>Alert Level</span></i><span style='text-align:justify;'>: an index of the likelihood of coral bleaching, scaled from 0 (no heat stress) to 4 (coral mortality likely) based on the attributes below</span></li><li><i><span style='text-align:justify;'>Sea surface temperature</span></i><span style='text-align:justify;'>: average temperature of the ocean surface derived from satellite measurements</span></li><li><i>Temperature anomaly</i>: a comparison of the current surface temperature to the 1981-2010 historical average</li><li><i>Hotspots</i>: number of degrees above the coral's threshold tolerance</li><li><i>Degree Heating Weeks</i>: accumulated thermal stress experienced by corals</li></ul><div><span style='font-size:x-large;'>Maintenance</span></div><div><ul><li>Service data is maintained by the Overwrite Feature Service script running as a Scheduled Notebook Task</li><li>See <a target='_blank' href='https://www.arcgis.com/home/item.html?id=cd5819375aca40a3a7f8b3a269404c2c' rel='nofollow ugc noopener noreferrer'><strong>Sample OverwriteFS Notebook</strong></a></li></ul><div><span style='font-size:x-large;'>Revisions</span></div><div><ul><li><strong>Sep 17, 2026</strong>: Updated fields by adding Alias, Description, and Value Type. Also added minScale on layers and set item Extent.</li><li><strong>Jan 25, 2024</strong>: Updated Legend text for Area Layer, adding clarity</li><li><strong>Jul 28, 2023</strong>: Applied updated Symbology and Popups from&nbsp;<a target='_blank' href='https://www.arcgis.com/apps/mapviewer/index.html?webmap=cf77e070aa014f2ca25b43c0ec3d5b92' rel='nofollow ugc noopener noreferrer'><strong>Coral Reef Bleaching Stations</strong></a> Web Map</li></ul></div></div></div>",
			"keyword": [
				"Coral",
				"Reef",
				"Bleaching",
				"NOAA",
				"heat stress",
				"Ocean",
				"oceans",
				"esri_o",
				"esri_environment",
				"environment"
			],
			"issued": "2019-04-15T16:06:02.000Z",
			"modified": "2026-11-10T21:59:17.000Z",
			"publisher": {
				"name": "Esri"
			},
			"contactPoint": {
				"@type": "vcard:Contact",
				"fn": "esri_livefeeds2",
				"hasEmail": "{{orgContactEmail}}"
			},
			"accessLevel": "public",
			"spatial": "-180.0000,-32.2500,180.0000,32.7500",
			"license": "<img alt='' src='https://downloads.esri.com/blogs/arcgisonline/esrilogo_new.png' /> This work is licensed under the Esri Master License Agreement.<br /><div><a href='https://goto.arcgis.com/termsofuse/viewsummary' target='_blank' rel='nofollow ugc noopener noreferrer'><b>View Summary</b></a> | <a href='https://goto.arcgis.com/termsofuse/viewtermsofuse' target='_blank' rel='nofollow ugc noopener noreferrer'><b>View Terms of Use</b></a></div>",
			"distribution": [
				{
					"@type": "dcat:Distribution",
					"title": "ArcGIS Hub Dataset",
					"format": "Web Page",
					"mediaType": "text/html",
					"accessURL": "https://www.pacificgeoportal.com/maps/esri2::noaa-coral-reef-watch-crw-virtual-stations"
				},
				{
					"@type": "dcat:Distribution",
					"title": "ArcGIS GeoService",
					"format": "ArcGIS GeoServices REST API",
					"mediaType": "application/json",
					"accessURL": "https://services9.arcgis.com/RHVPKKiFTONKtxq3/arcgis/rest/services/Coral_Reef_Stations/FeatureServer"
				}
			],
			"theme": [
				"geospatial"
			]
		},
		{
			"@type": "dcat:Dataset",
			"identifier": "https://www.arcgis.com/home/item.html?id=26e71d14067c4b3f8dd31d1a4e008cfb&sublayer=0",
			"landingPage": "https://www.pacificgeoportal.com/datasets/esri2::stations-1",
			"title": "Stations",
			"description": "<div><span style='text-align:justify;'>Coral reefs are one of the most diverse and ecologically important areas of the world. However, many reefs, are threatened by ocean temperatures that are increasingly becoming warmer than the coral animals' natural tolerance. According to&nbsp;</span><a target='_blank' href='https://oceanservice.noaa.gov/facts/coral_bleach.html' rel='nofollow ugc noopener noreferrer'><strong>NOAA</strong></a><span style='text-align:justify;'>, when&nbsp;</span>water is too warm, corals will expel the algae (zooxanthellae) living in their tissues causing the coral to turn completely white. This is called coral bleaching. When a coral bleaches, it is not dead. Corals can survive a bleaching event, but they are under more stress and are subject to mortality.</div><div>&nbsp;</div><p><span style='text-align:justify;'>The&nbsp;</span><a target='_blank' href='https://coralreefwatch.noaa.gov/' rel='nofollow ugc noopener noreferrer'><strong>NOAA Coral Reef Watch</strong></a><span style='text-align:justify;'>&nbsp;program uses satellite data to provide current reef environmental conditions to quickly identify areas at risk for&nbsp;coral bleaching. The station data displayed in this map are derived from satellite based measurements of ocean temperature. These \"virtual stations\" are not actual&nbsp;buoys or&nbsp;</span><i><span style='text-align:justify;'>in situ</span></i><span style='text-align:justify;'>&nbsp;stations transmitting data, rather a spatial analyses for reef locations around the world are derived from 5 km resolution raster data.&nbsp;</span></p><div style='text-align:justify;'>&nbsp;</div><div style='text-align:justify;'>There are 213 points for the virtual stations around the world along with polygons describing the major tropical coral reef systems.&nbsp;</div><div><br />&nbsp;</div><div><span style='text-align:justify;'><strong>Each station has several variables:&nbsp;</strong></span></div><div style='text-align:justify;'><ul><li><i><span style='text-align:justify;'>Alert Level</span></i><span style='text-align:justify;'>: an index of the likelihood of coral bleaching, scaled from 0 (no heat stress) to 4 (coral mortality likely) based on the attributes below</span></li><li><i><span style='text-align:justify;'>Sea surface temperature</span></i><span style='text-align:justify;'>: average temperature of the ocean surface derived from satellite measurements</span></li><li><i>Temperature anomaly</i>: a comparison of the current surface temperature to the 1981-2010 historical average</li><li><i>Hotspots</i>: number of degrees above the coral's threshold tolerance</li><li><i>Degree Heating Weeks</i>: accumulated thermal stress experienced by corals</li></ul><div><span style='font-size:x-large;'>Maintenance</span></div><div><ul><li>Service data is maintained by the Overwrite Feature Service script running as a Scheduled Notebook Task</li><li>See <a target='_blank' href='https://www.arcgis.com/home/item.html?id=cd5819375aca40a3a7f8b3a269404c2c' rel='nofollow ugc noopener noreferrer'><strong>Sample OverwriteFS Notebook</strong></a></li></ul><div><span style='font-size:x-large;'>Revisions</span></div><div><ul><li><strong>Sep 17, 2026</strong>: Updated fields by adding Alias, Description, and Value Type. Also added minScale on layers and set item Extent.</li><li><strong>Jan 25, 2024</strong>: Updated Legend text for Area Layer, adding clarity</li><li><strong>Jul 28, 2023</strong>: Applied updated Symbology and Popups from&nbsp;<a target='_blank' href='https://www.arcgis.com/apps/mapviewer/index.html?webmap=cf77e070aa014f2ca25b43c0ec3d5b92' rel='nofollow ugc noopener noreferrer'><strong>Coral Reef Bleaching Stations</strong></a> Web Map</li></ul></div></div></div>",
			"keyword": [
				"Coral",
				"Reef",
				"Bleaching",
				"NOAA",
				"heat stress",
				"Ocean",
				"oceans",
				"esri_o",
				"esri_environment",
				"environment"
			],
			"issued": "2019-04-15T16:06:02.000Z",
			"modified": "2026-11-10T21:59:14.673Z",
			"publisher": {
				"name": "Esri"
			},
			"contactPoint": {
				"@type": "vcard:Contact",
				"fn": "esri_livefeeds2",
				"hasEmail": "{{orgContactEmail}}"
			},
			"accessLevel": "public",
			"spatial": "-176.9000,-31.9250,179.3500,32.3500",
			"license": "<img alt='' src='https://downloads.esri.com/blogs/arcgisonline/esrilogo_new.png' /> This work is licensed under the Esri Master License Agreement.<br /><div><a href='https://goto.arcgis.com/termsofuse/viewsummary' target='_blank' rel='nofollow ugc noopener noreferrer'><b>View Summary</b></a> | <a href='https://goto.arcgis.com/termsofuse/viewtermsofuse' target='_blank' rel='nofollow ugc noopener noreferrer'><b>View Terms of Use</b></a></div>",
			"distribution": [
				{
					"@type": "dcat:Distribution",
					"title": "ArcGIS Hub Dataset",
					"format": "Web Page",
					"mediaType": "text/html",
					"accessURL": "https://www.pacificgeoportal.com/datasets/esri2::stations-1"
				},
				{
					"@type": "dcat:Distribution",
					"title": "ArcGIS GeoService",
					"format": "ArcGIS GeoServices REST API",
					"mediaType": "application/json",
					"accessURL": "https://services9.arcgis.com/RHVPKKiFTONKtxq3/arcgis/rest/services/Coral_Reef_Stations/FeatureServer/0"
				},
				{
					"@type": "dcat:Distribution",
					"title": "CSV",
					"format": "CSV",
					"mediaType": "text/csv",
					"accessURL": "https://www.pacificgeoportal.com/api/download/v1/items/26e71d14067c4b3f8dd31d1a4e008cfb/csv?layers=0"
				},
				{
					"@type": "dcat:Distribution",
					"title": "Shapefile",
					"format": "ZIP",
					"mediaType": "application/zip",
					"accessURL": "https://www.pacificgeoportal.com/api/download/v1/items/26e71d14067c4b3f8dd31d1a4e008cfb/shapefile?layers=0"
				},
				{
					"@type": "dcat:Distribution",
					"title": "GeoJSON",
					"format": "GeoJSON",
					"mediaType": "application/vnd.geo+json",
					"accessURL": "https://www.pacificgeoportal.com/api/download/v1/items/26e71d14067c4b3f8dd31d1a4e008cfb/geojson?layers=0"
				},
				{
					"@type": "dcat:Distribution",
					"title": "KML",
					"format": "KML",
					"mediaType": "application/vnd.google-earth.kml+xml",
					"accessURL": "https://www.pacificgeoportal.com/api/download/v1/items/26e71d14067c4b3f8dd31d1a4e008cfb/kml?layers=0"
				}
			],
			"theme": [
				"geospatial"
			]
		},
		{
			"@type": "dcat:Dataset",
			"identifier": "https://www.arcgis.com/home/item.html?id=26e71d14067c4b3f8dd31d1a4e008cfb&sublayer=1",
			"landingPage": "https://www.pacificgeoportal.com/datasets/esri2::areas",
			"title": "Areas",
			"description": "<div><span style='text-align:justify;'>Coral reefs are one of the most diverse and ecologically important areas of the world. However, many reefs, are threatened by ocean temperatures that are increasingly becoming warmer than the coral animals' natural tolerance. According to&nbsp;</span><a target='_blank' href='https://oceanservice.noaa.gov/facts/coral_bleach.html' rel='nofollow ugc noopener noreferrer'><strong>NOAA</strong></a><span style='text-align:justify;'>, when&nbsp;</span>water is too warm, corals will expel the algae (zooxanthellae) living in their tissues causing the coral to turn completely white. This is called coral bleaching. When a coral bleaches, it is not dead. Corals can survive a bleaching event, but they are under more stress and are subject to mortality.</div><div>&nbsp;</div><p><span style='text-align:justify;'>The&nbsp;</span><a target='_blank' href='https://coralreefwatch.noaa.gov/' rel='nofollow ugc noopener noreferrer'><strong>NOAA Coral Reef Watch</strong></a><span style='text-align:justify;'>&nbsp;program uses satellite data to provide current reef environmental conditions to quickly identify areas at risk for&nbsp;coral bleaching. The station data displayed in this map are derived from satellite based measurements of ocean temperature. These \"virtual stations\" are not actual&nbsp;buoys or&nbsp;</span><i><span style='text-align:justify;'>in situ</span></i><span style='text-align:justify;'>&nbsp;stations transmitting data, rather a spatial analyses for reef locations around the world are derived from 5 km resolution raster data.&nbsp;</span></p><div style='text-align:justify;'>&nbsp;</div><div style='text-align:justify;'>There are 213 points for the virtual stations around the world along with polygons describing the major tropical coral reef systems.&nbsp;</div><div><br />&nbsp;</div><div><span style='text-align:justify;'><strong>Each station has several variables:&nbsp;</strong></span></div><div style='text-align:justify;'><ul><li><i><span style='text-align:justify;'>Alert Level</span></i><span style='text-align:justify;'>: an index of the likelihood of coral bleaching, scaled from 0 (no heat stress) to 4 (coral mortality likely) based on the attributes below</span></li><li><i><span style='text-align:justify;'>Sea surface temperature</span></i><span style='text-align:justify;'>: average temperature of the ocean surface derived from satellite measurements</span></li><li><i>Temperature anomaly</i>: a comparison of the current surface temperature to the 1981-2010 historical average</li><li><i>Hotspots</i>: number of degrees above the coral's threshold tolerance</li><li><i>Degree Heating Weeks</i>: accumulated thermal stress experienced by corals</li></ul><div><span style='font-size:x-large;'>Maintenance</span></div><div><ul><li>Service data is maintained by the Overwrite Feature Service script running as a Scheduled Notebook Task</li><li>See <a target='_blank' href='https://www.arcgis.com/home/item.html?id=cd5819375aca40a3a7f8b3a269404c2c' rel='nofollow ugc noopener noreferrer'><strong>Sample OverwriteFS Notebook</strong></a></li></ul><div><span style='font-size:x-large;'>Revisions</span></div><div><ul><li><strong>Sep 17, 2026</strong>: Updated fields by adding Alias, Description, and Value Type. Also added minScale on layers and set item Extent.</li><li><strong>Jan 25, 2024</strong>: Updated Legend text for Area Layer, adding clarity</li><li><strong>Jul 28, 2023</strong>: Applied updated Symbology and Popups from&nbsp;<a target='_blank' href='https://www.arcgis.com/apps/mapviewer/index.html?webmap=cf77e070aa014f2ca25b43c0ec3d5b92' rel='nofollow ugc noopener noreferrer'><strong>Coral Reef Bleaching Stations</strong></a> Web Map</li></ul></div></div></div>",
			"keyword": [
				"Coral",
				"Reef",
				"Bleaching",
				"NOAA",
				"heat stress",
				"Ocean",
				"oceans",
				"esri_o",
				"esri_environment",
				"environment"
			],
			"issued": "2019-04-15T16:06:02.000Z",
			"modified": "2026-11-10T21:59:20.993Z",
			"publisher": {
				"name": "Esri"
			},
			"contactPoint": {
				"@type": "vcard:Contact",
				"fn": "esri_livefeeds2",
				"hasEmail": "{{orgContactEmail}}"
			},
			"accessLevel": "public",
			"spatial": "-180.0000,-32.2500,180.0000,32.7500",
			"license": "<img alt='' src='https://downloads.esri.com/blogs/arcgisonline/esrilogo_new.png' /> This work is licensed under the Esri Master License Agreement.<br /><div><a href='https://goto.arcgis.com/termsofuse/viewsummary' target='_blank' rel='nofollow ugc noopener noreferrer'><b>View Summary</b></a> | <a href='https://goto.arcgis.com/termsofuse/viewtermsofuse' target='_blank' rel='nofollow ugc noopener noreferrer'><b>View Terms of Use</b></a></div>",
			"distribution": [
				{
					"@type": "dcat:Distribution",
					"title": "ArcGIS Hub Dataset",
					"format": "Web Page",
					"mediaType": "text/html",
					"accessURL": "https://www.pacificgeoportal.com/datasets/esri2::areas"
				},
				{
					"@type": "dcat:Distribution",
					"title": "ArcGIS GeoService",
					"format": "ArcGIS GeoServices REST API",
					"mediaType": "application/json",
					"accessURL": "https://services9.arcgis.com/RHVPKKiFTONKtxq3/arcgis/rest/services/Coral_Reef_Stations/FeatureServer/1"
				},
				{
					"@type": "dcat:Distribution",
					"title": "CSV",
					"format": "CSV",
					"mediaType": "text/csv",
					"accessURL": "https://www.pacificgeoportal.com/api/download/v1/items/26e71d14067c4b3f8dd31d1a4e008cfb/csv?layers=1"
				},
				{
					"@type": "dcat:Distribution",
					"title": "Shapefile",
					"format": "ZIP",
					"mediaType": "application/zip",
					"accessURL": "https://www.pacificgeoportal.com/api/download/v1/items/26e71d14067c4b3f8dd31d1a4e008cfb/shapefile?layers=1"
				},
				{
					"@type": "dcat:Distribution",
					"title": "GeoJSON",
					"format": "GeoJSON",
					"mediaType": "application/vnd.geo+json",
					"accessURL": "https://www.pacificgeoportal.com/api/download/v1/items/26e71d14067c4b3f8dd31d1a4e008cfb/geojson?layers=1"
				},
				{
					"@type": "dcat:Distribution",
					"title": "KML",
					"format": "KML",
					"mediaType": "application/vnd.google-earth.kml+xml",
					"accessURL": "https://www.pacificgeoportal.com/api/download/v1/items/26e71d14067c4b3f8dd31d1a4e008cfb/kml?layers=1"
				}
			],
			"theme": [
				"geospatial"
			]
		},
		{
			"@type": "dcat:Dataset",
			"identifier": "https://www.arcgis.com/home/item.html?id=72016493081d480bbc09d2981986a38e",
			"landingPage": "https://www.pacificgeoportal.com/maps/eaglegis::nz-hybrid-reference-vector",
			"title": "NZ Hybrid Reference (Vector)",
			"description": "<span style='font-weight:bold;'>Last updated</span><br />November 2026<br /><br /><span style='font-weight:bold;'>Projection</span><br />New Zealand Transverse Mercator 2000 (NZTM2000).<br /><br />This vector tile layer provides a detailed reference layer for New Zealand in the NZ Transverse Mercator projection. The style is based on the Esri World Hybrid Imagery style. This vector tile layer provides unique capabilities for customization and high-resolution display. <div><br /></div><div>This item is designed to be used as a reference layer with the New Zealand Imagery basemap. You can find the already combined NZ Imagery Hybrid Webmap <a href='https://www.arcgis.com/home/item.html?id=e221dc39fa7d43609562c529f170d416' target='_blank' rel='nofollow ugc noopener noreferrer'>here</a>. </div><div><br />This map includes highways, major roads, minor roads, railways, water features, cities, parks, landmarks, and administrative boundaries for added context.<br /><br /><div><div><b>Data sources</b></div></div><div><ul><li>Land Information New Zealand</li><ul><li>Place Names, Water-bodies, Protected Areas, Airports, Railways &amp; Islands.</li></ul><li>Statistics New Zealand</li><ul><li>Administrative Boundaries</li></ul><li>© OpenStreetMap Contributors</li><ul><li>Road Centrelines, Landuse Types, Areas of Interest and Points of Interest.</li></ul><li>Natural Earth</li><ul><li>Marine Labels</li></ul></ul></div>This map is offered by Eagle Technology (Official Esri Distributor). Eagle Technology offers layers and maps that can be used in the ArcGIS platform. The Content team at Eagle Technology updates the layers on a regular basis and regularly adds new content to the Living Atlas. By using this content and combining it with other data you can create new information products quickly and easily.<br /><br />If you have any questions or remarks about the content, please let us now at <a href='mailto:livingatlas@eagle.co.nz' target='_blank' rel='nofollow ugc noopener noreferrer'>livingatlas@eagle.co.nz</a><br /><br /><span style='font-weight:bold;'>Customize this Map</span><br /><div>Because this map is delivered as a vector tile layer, users can customize the map to change its content and symbology, including fonts. Users are able to turn on and off layers and change symbols for layers.</div><div><br /></div><div>An easy way to change the style of this map is to use the Vector Basemap Style Editor:</div><div><a href='https://developers.arcgis.com/vector-tile-style-editor/' target='_blank' rel='nofollow ugc noopener noreferrer'>https://developers.arcgis.com/vector-tile-style-editor/</a></div></div>",
			"keyword": [
				"basemap",
				"NZ",
				"New Zealand",
				"Map",
				"Basemap",
				"Background",
				"Layer",
				"topography",
				"content",
				"living atlas",
				"basemaps",
				"detailed",
				"digital map",
				"Linz",
				"current",
				"open data",
				"data sets",
				"kiwi",
				"vector",
				"vector tiles",
				"topo",
				"topo nz",
				"Eagle",
				"Eagle Technology",
				"NZTM",
				"Aotearoa",
				"eaglegis",
				"hybrid",
				"reference",
				"image",
				"imagery"
			],
			"issued": "2021-09-01T23:50:01.000Z",
			"modified": "2026-11-03T04:04:58.000Z",
			"publisher": {
				"name": "Eagle Technology Group Ltd"
			},
			"contactPoint": {
				"@type": "vcard:Contact",
				"fn": "eaglegis",
				"hasEmail": "mailto:ts@eaglegis.co.nz"
			},
			"accessLevel": "public",
			"spatial": "163.8527,-47.6571,179.5732,-34.0089",
			"license": "https://creativecommons.org/licenses/by/4.0",
			"distribution": [
				{
					"@type": "dcat:Distribution",
					"title": "ArcGIS Hub Dataset",
					"format": "Web Page",
					"mediaType": "text/html",
					"accessURL": "https://www.pacificgeoportal.com/maps/eaglegis::nz-hybrid-reference-vector"
				},
				{
					"@type": "dcat:Distribution",
					"title": "ArcGIS GeoService",
					"format": "ArcGIS GeoServices REST API",
					"mediaType": "application/json",
					"accessURL": "https://tiles.arcgis.com/tiles/XTtANUDT8Va4DLwI/arcgis/rest/services/nz_vector_basemap_v1/VectorTileServer"
				}
			],
			"theme": [
				"geospatial"
			]
		},
		{
			"@type": "dcat:Dataset",
			"identifier": "https://www.arcgis.com/home/item.html?id=b052dff3628e4203856079a07d7d814c",
			"landingPage": "https://www.pacificgeoportal.com/maps/eaglegis::nz-navigation-vector",
			"title": "NZ Navigation (Vector)",
			"description": "<span style='font-weight:bold;'>Last updated</span><br />November 2026<br /><br /><span style='font-weight:bold;'>Projection</span><br />New Zealand Transverse Mercator 2000 (NZTM2000).<br /><br />This vector tile layer provides a detailed basemap for New Zealand in the NZ Transverse Mercator projection. The style is based on the classic Esri World Navigation style. This vector tile layer provides unique capabilities for customization and high-resolution display.<br /><br />This map includes highways, major roads, minor roads, railways, water features, cities, parks, landmarks, building footprints, and administrative boundaries for added context.<br /><br /><div><div><b>Data sources</b></div></div><div><div><ul><li>Land Information New Zealand</li><ul><li>Buildings, Parcels, Place Names, Water-bodies, Vegetation, Protected Areas, Airports, Railways &amp; Islands.</li></ul><li>Statistics New Zealand</li><ul><li>Administrative Boundaries &amp; Urban Areas</li></ul><li>National Institute of Water &amp; Atmospheric Research (NIWA)</li><ul><li>River Environment Classification</li></ul><li>© OpenStreetMap Contributors</li><ul><li>Road Centrelines, Buildings, Landuse Types, Areas of Interest and Points of Interest.</li></ul><li>Natural Earth</li><ul><li>Bathymetry &amp; Marine Labels</li></ul></ul></div></div>This map is offered by Eagle Technology (Official Esri Distributor). Eagle Technology offers layers and maps that can be used in the ArcGIS platform. The Content team at Eagle Technology updates the layers on a regular basis and regularly adds new content to the Living Atlas. By using this content and combining it with other data you can create new information products quickly and easily.<br /><br />If you have any questions or remarks about the content, please let us now at <a href='mailto:livingatlas@eagle.co.nz' target='_blank' rel='nofollow ugc noopener noreferrer'>livingatlas@eagle.co.nz</a><br /><br /><span style='font-weight:bold;'>Customize this Map</span><br /><div>Because this map is delivered as a vector tile layer, users can customize the map to change its content and symbology, including fonts. Users are able to turn on and off layers and change symbols for layers.</div><div><br /></div><div>An easy way to change the style of this map is to use the Vector Basemap Style Editor:</div><div><a href='https://developers.arcgis.com/vector-tile-style-editor/' target='_blank' rel='nofollow ugc noopener noreferrer'>https://developers.arcgis.com/vector-tile-style-editor/</a></div>",
			"keyword": [
				"navigation",
				"community",
				"basemap",
				"NZ",
				"New Zealand",
				"Map",
				"Basemap",
				"Background",
				"Layer",
				"light",
				"content",
				"living atlas",
				"basemaps",
				"esri_basemap",
				"esri_basemaps",
				"detailed",
				"digital map",
				"Linz",
				"current",
				"open data",
				"data sets",
				"kiwi",
				"vector",
				"vector tiles",
				"topo",
				"topo nz",
				"Eagle",
				"Eagle Technology",
				"NZTM",
				"Aotearoa",
				"eaglegis"
			],
			"issued": "2020-02-24T02:03:12.000Z",
			"modified": "2026-11-03T04:04:57.000Z",
			"publisher": {
				"name": "Eagle Technology Group Ltd"
			},
			"contactPoint": {
				"@type": "vcard:Contact",
				"fn": "eaglegis",
				"hasEmail": "mailto:ts@eaglegis.co.nz"
			},
			"accessLevel": "public",
			"spatial": "163.8527,-47.6571,179.8808,-34.0089",
			"license": "https://creativecommons.org/licenses/by/4.0",
			"distribution": [
				{
					"@type": "dcat:Distribution",
					"title": "ArcGIS Hub Dataset",
					"format": "Web Page",
					"mediaType": "text/html",
					"accessURL": "https://www.pacificgeoportal.com/maps/eaglegis::nz-navigation-vector"
				},
				{
					"@type": "dcat:Distribution",
					"title": "ArcGIS GeoService",
					"format": "ArcGIS GeoServices REST API",
					"mediaType": "application/json",
					"accessURL": "https://tiles.arcgis.com/tiles/XTtANUDT8Va4DLwI/arcgis/rest/services/nz_vector_basemap_v1/VectorTileServer"
				}
			],
			"theme": [
				"geospatial"
			]
		},
		{
			"@type": "dcat:Dataset",
			"identifier": "https://www.arcgis.com/home/item.html?id=7aaf5b68b31b426faf8870ca7fbf1583",
			"landingPage": "https://www.pacificgeoportal.com/maps/eaglegis::nz-dark-grey-canvas-vector",
			"title": "NZ Dark Grey Canvas (Vector)",
			"description": "<span style='font-weight:bold;'>Last updated</span><br />November 2026<br /><br /><span style='font-weight:bold;'>Projection</span><br />New Zealand Transverse Mercator 2000 (NZTM2000).<br /><br />This vector tile layer provides a detailed basemap for New Zealand in the NZ Transverse Mercator projection. The style is based on the classic Esri Dark Gray Canvas style. This vector tile layer provides unique capabilities for customization and high-resolution display.<br /><br />This map includes highways, major roads, minor roads, railways, water features, cities, parks, landmarks, building footprints, and administrative boundaries for added context.<br /><br /><div><div><b>Data sources</b></div></div><div><div><ul><li>Land Information New Zealand</li><ul><li>Buildings, Parcels, Place Names, Water-bodies, Vegetation, Protected Areas, Airports, Railways &amp; Islands.</li></ul><li>Statistics New Zealand</li><ul><li>Administrative Boundaries &amp; Urban Areas</li></ul><li>National Institute of Water &amp; Atmospheric Research (NIWA)</li><ul><li>River Environment Classification</li></ul><li>© OpenStreetMap Contributors</li><ul><li>Road Centrelines, Buildings, Landuse Types, Areas of Interest and Points of Interest.</li></ul><li>Natural Earth</li><ul><li>Bathymetry &amp; Marine Labels</li></ul></ul></div></div>This map is offered by Eagle Technology (Official Esri Distributor). Eagle Technology offers layers and maps that can be used in the ArcGIS platform. The Content team at Eagle Technology updates the layers on a regular basis and regularly adds new content to the Living Atlas. By using this content and combining it with other data you can create new information products quickly and easily.<br /><br />If you have any questions or remarks about the content, please let us now at <a href='mailto:livingatlas@eagle.co.nz' target='_blank' rel='nofollow ugc noopener noreferrer'>livingatlas@eagle.co.nz</a><br /><br /><span style='font-weight:bold;'>Customize this Map</span><br /><div>Because this map is delivered as a vector tile layer, users can customize the map to change its content and symbology, including fonts. Users are able to turn on and off layers and change symbols for layers.</div><div><br /></div><div>An easy way to change the style of this map is to use the Vector Basemap Style Editor:</div><div><a href='https://developers.arcgis.com/vector-tile-style-editor/' target='_blank' rel='nofollow ugc noopener noreferrer'>https://developers.arcgis.com/vector-tile-style-editor/</a></div>",
			"keyword": [
				"canvas",
				"community",
				"basemap",
				"NZ",
				"New Zealand",
				"Map",
				"Basemap",
				"Background",
				"Layer",
				"dark",
				"grey",
				"gray",
				"content",
				"living atlas",
				"basemaps",
				"esri_basemap",
				"esri_basemaps",
				"detailed",
				"digital map",
				"Linz",
				"current",
				"open data",
				"data sets",
				"kiwi",
				"vector",
				"vector tiles",
				"topo",
				"topo nz",
				"Eagle",
				"Eagle Technology",
				"NZTM",
				"Aotearoa",
				"eaglegis"
			],
			"issued": "2020-02-24T02:02:43.000Z",
			"modified": "2026-11-03T04:04:55.000Z",
			"publisher": {
				"name": "Eagle Technology Group Ltd"
			},
			"contactPoint": {
				"@type": "vcard:Contact",
				"fn": "eaglegis",
				"hasEmail": "mailto:ts@eaglegis.co.nz"
			},
			"accessLevel": "public",
			"spatial": "163.8527,-47.6571,179.5732,-34.0089",
			"license": "https://creativecommons.org/licenses/by/4.0",
			"distribution": [
				{
					"@type": "dcat:Distribution",
					"title": "ArcGIS Hub Dataset",
					"format": "Web Page",
					"mediaType": "text/html",
					"accessURL": "https://www.pacificgeoportal.com/maps/eaglegis::nz-dark-grey-canvas-vector"
				},
				{
					"@type": "dcat:Distribution",
					"title": "ArcGIS GeoService",
					"format": "ArcGIS GeoServices REST API",
					"mediaType": "application/json",
					"accessURL": "https://tiles.arcgis.com/tiles/XTtANUDT8Va4DLwI/arcgis/rest/services/nz_vector_basemap_v1/VectorTileServer"
				}
			],
			"theme": [
				"geospatial"
			]
		},
		{
			"@type": "dcat:Dataset",
			"identifier": "https://www.arcgis.com/home/item.html?id=fed71141e42a45c49dabb30a4c2903e1",
			"landingPage": "https://www.pacificgeoportal.com/maps/eaglegis::nz-light-grey-canvas-vector",
			"title": "NZ Light Grey Canvas (Vector)",
			"description": "<span style='font-weight:bold;'>Last updated</span><br />November 2026<br /><br /><span style='font-weight:bold;'>Projection</span><br />New Zealand Transverse Mercator 2000 (NZTM2000).<br /><br />This vector tile layer provides a detailed basemap for New Zealand in the NZ Transverse Mercator projection. The style is based on the classic Esri Light Gray Canvas style. This vector tile layer provides unique capabilities for customization and high-resolution display.<br /><br />This map includes highways, major roads, minor roads, railways, water features, cities, parks, landmarks, building footprints, and administrative boundaries for added context.<br /><br /><div><div><b>Data sources</b></div></div><div><div><ul><li>Land Information New Zealand</li><ul><li>Buildings, Parcels, Place Names, Water-bodies, Vegetation, Protected Areas, Airports, Railways &amp; Islands.</li></ul><li>Statistics New Zealand</li><ul><li>Administrative Boundaries &amp; Urban Areas</li></ul><li>National Institute of Water &amp; Atmospheric Research (NIWA)</li><ul><li>River Environment Classification</li></ul><li>© OpenStreetMap Contributors</li><ul><li>Road Centrelines, Buildings, Landuse Types, Areas of Interest and Points of Interest.</li></ul><li>Natural Earth</li><ul><li>Bathymetry &amp; Marine Labels</li></ul></ul></div></div>This map is offered by Eagle Technology (Official Esri Distributor). Eagle Technology offers layers and maps that can be used in the ArcGIS platform. The Content team at Eagle Technology updates the layers on a regular basis and regularly adds new content to the Living Atlas. By using this content and combining it with other data you can create new information products quickly and easily.<br /><br />If you have any questions or remarks about the content, please let us now at <a href='mailto:livingatlas@eagle.co.nz' target='_blank' rel='nofollow ugc noopener noreferrer'>livingatlas@eagle.co.nz</a><br /><br /><span style='font-weight:bold;'>Customize this Map</span><br /><div>Because this map is delivered as a vector tile layer, users can customize the map to change its content and symbology, including fonts. Users are able to turn on and off layers and change symbols for layers.</div><div><br /></div><div>An easy way to change the style of this map is to use the Vector Basemap Style Editor:</div><div><a href='https://developers.arcgis.com/vector-tile-style-editor/' target='_blank' rel='nofollow ugc noopener noreferrer'>https://developers.arcgis.com/vector-tile-style-editor/</a></div>",
			"keyword": [
				"canvas",
				"community",
				"basemap",
				"NZ",
				"New Zealand",
				"Map",
				"Basemap",
				"Background",
				"Layer",
				"light",
				"grey",
				"gray",
				"content",
				"living atlas",
				"basemaps",
				"esri_basemap",
				"esri_basemaps",
				"detailed",
				"digital map",
				"Linz",
				"current",
				"open data",
				"data sets",
				"kiwi",
				"vector",
				"vector tiles",
				"topo",
				"topo nz",
				"Eagle",
				"Eagle Technology",
				"NZTM",
				"Aotearoa",
				"eaglegis"
			],
			"issued": "2020-02-24T02:02:58.000Z",
			"modified": "2026-11-03T04:04:53.000Z",
			"publisher": {
				"name": "Eagle Technology Group Ltd"
			},
			"contactPoint": {
				"@type": "vcard:Contact",
				"fn": "eaglegis",
				"hasEmail": "mailto:ts@eaglegis.co.nz"
			},
			"accessLevel": "public",
			"spatial": "",
			"license": "https://creativecommons.org/licenses/by/4.0",
			"distribution": [
				{
					"@type": "dcat:Distribution",
					"title": "ArcGIS Hub Dataset",
					"format": "Web Page",
					"mediaType": "text/html",
					"accessURL": "https://www.pacificgeoportal.com/maps/eaglegis::nz-light-grey-canvas-vector"
				},
				{
					"@type": "dcat:Distribution",
					"title": "ArcGIS GeoService",
					"format": "ArcGIS GeoServices REST API",
					"mediaType": "application/json",
					"accessURL": "https://tiles.arcgis.com/tiles/XTtANUDT8Va4DLwI/arcgis/rest/services/nz_vector_basemap_v1/VectorTileServer"
				}
			],
			"theme": ""
		},
		{
			"@type": "dcat:Dataset",
			"identifier": "https://www.arcgis.com/home/item.html?id=734c12e9904b4a8086d2dff8582a93a1",
			"landingPage": "https://www.pacificgeoportal.com/maps/eaglegis::nz-topographic-relief-vector",
			"title": "NZ Topographic Relief (Vector)",
			"description": "<span style='font-weight:bold;'>Last updated</span><br />November 2026<br /><br /><span style='font-weight:bold;'>Projection</span><br />New Zealand Transverse Mercator 2000 (NZTM2000).<br /><br />This vector tile layer provides a detailed basemap for New Zealand in the NZ Transverse Mercator projection. The style is based on the classic Esri Topographic style. This vector tile layer provides unique capabilities for customization and high-resolution display.<br /><br />This map includes highways, major roads, minor roads, railways, water features, cities, parks, landmarks, building footprints, and administrative boundaries for added context.<br /><br />This map is designed for use with a shaded relief layer.<br /><br /><div><div><b>Data sources</b></div></div><div><div><ul><li>Land Information New Zealand</li><ul><li>Buildings, Parcels, Place Names, Water-bodies, Vegetation, Protected Areas, Airports, Railways &amp; Islands.</li></ul><li>Statistics New Zealand</li><ul><li>Administrative Boundaries &amp; Urban Areas</li></ul><li>National Institute of Water &amp; Atmospheric Research (NIWA)</li><ul><li>River Environment Classification</li></ul><li>© OpenStreetMap Contributors</li><ul><li>Road Centrelines, Buildings, Landuse Types, Areas of Interest and Points of Interest.</li></ul><li>Natural Earth</li><ul><li>Bathymetry &amp; Marine Labels</li></ul></ul></div></div>This map is offered by Eagle Technology (Official Esri Distributor). Eagle Technology offers layers and maps that can be used in the ArcGIS platform. The Content team at Eagle Technology updates the layers on a regular basis and regularly adds new content to the Living Atlas. By using this content and combining it with other data you can create new information products quickly and easily.<br /><br />If you have any questions or remarks about the content, please let us now at <a href='mailto:livingatlas@eagle.co.nz' target='_blank' rel='nofollow ugc noopener noreferrer'>livingatlas@eagle.co.nz</a><br /><br /><span style='font-weight:bold;'>Customize this Map</span><br /><div>Because this map is delivered as a vector tile layer, users can customize the map to change its content and symbology, including fonts. Users are able to turn on and off layers and change symbols for layers.</div><div><br /></div><div>An easy way to change the style of this map is to use the Vector Basemap Style Editor:</div><div><a href='https://developers.arcgis.com/vector-tile-style-editor/' target='_blank' rel='nofollow ugc noopener noreferrer'>https://developers.arcgis.com/vector-tile-style-editor/</a></div>",
			"keyword": [
				"topographic",
				"relief",
				"hillshade",
				"community",
				"basemap",
				"NZ",
				"New Zealand",
				"Map",
				"Basemap",
				"Background",
				"Layer",
				"topography",
				"content",
				"living atlas",
				"basemaps",
				"esri_basemap",
				"esri_basemaps",
				"detailed",
				"digital map",
				"Linz",
				"current",
				"open data",
				"data sets",
				"kiwi",
				"vector",
				"vector tiles",
				"topo",
				"topo nz",
				"Eagle",
				"Eagle Technology",
				"NZTM",
				"Aotearoa",
				"eaglegis"
			],
			"issued": "2019-12-12T23:58:48.000Z",
			"modified": "2026-11-03T04:04:51.000Z",
			"publisher": {
				"name": "Eagle Technology Group Ltd"
			},
			"contactPoint": {
				"@type": "vcard:Contact",
				"fn": "eaglegis",
				"hasEmail": "mailto:ts@eaglegis.co.nz"
			},
			"accessLevel": "public",
			"spatial": "",
			"license": "https://creativecommons.org/licenses/by/4.0",
			"distribution": [
				{
					"@type": "dcat:Distribution",
					"title": "ArcGIS Hub Dataset",
					"format": "Web Page",
					"mediaType": "text/html",
					"accessURL": "https://www.pacificgeoportal.com/maps/eaglegis::nz-topographic-relief-vector"
				},
				{
					"@type": "dcat:Distribution",
					"title": "ArcGIS GeoService",
					"format": "ArcGIS GeoServices REST API",
					"mediaType": "application/json",
					"accessURL": "https://tiles.arcgis.com/tiles/XTtANUDT8Va4DLwI/arcgis/rest/services/nz_vector_basemap_v1/VectorTileServer"
				}
			],
			"theme": ""
		},
		{
			"@type": "dcat:Dataset",
			"identifier": "https://www.arcgis.com/home/item.html?id=e1ef3b88c1b84d23ba479c03c7938cf5",
			"landingPage": "https://www.pacificgeoportal.com/maps/eaglegis::nz-topographic-vector",
			"title": "NZ Topographic (Vector)",
			"description": "<span style='font-weight:bold;'>Last updated</span><br />November 2026<br /><br /><span style='font-weight:bold;'>Projection</span><br />New Zealand Transverse Mercator 2000 (NZTM2000).<br /><br />This vector tile layer provides a detailed basemap for New Zealand in the NZ Transverse Mercator projection. The style is based on the classic Esri Topographic style. This vector tile layer provides unique capabilities for customization and high-resolution display.<br /><br />This map includes highways, major roads, minor roads, railways, water features, cities, parks, landmarks, building footprints, and administrative boundaries for added context.<br /><br /><div><div><b>Data sources</b></div></div><div><div><ul><li>Land Information New Zealand</li><ul><li>Buildings, Parcels, Place Names, Water-bodies, Vegetation, Protected Areas, Airports, Railways &amp; Islands.</li></ul><li>Statistics New Zealand</li><ul><li>Administrative Boundaries &amp; Urban Areas</li></ul><li>National Institute of Water &amp; Atmospheric Research (NIWA)</li><ul><li>River Environment Classification</li></ul><li>© OpenStreetMap Contributors</li><ul><li>Road Centrelines, Buildings, Landuse Types, Areas of Interest and Points of Interest.</li></ul><li>Natural Earth</li><ul><li>Bathymetry &amp; Marine Labels</li></ul></ul></div></div>This map is offered by Eagle Technology (Official Esri Distributor). Eagle Technology offers layers and maps that can be used in the ArcGIS platform. The Content team at Eagle Technology updates the layers on a regular basis and regularly adds new content to the Living Atlas. By using this content and combining it with other data you can create new information products quickly and easily.<br /><br />If you have any questions or remarks about the content, please let us now at <a href='mailto:livingatlas@eagle.co.nz' target='_blank' rel='nofollow ugc noopener noreferrer'>livingatlas@eagle.co.nz</a><br /><br /><span style='font-weight:bold;'>Customize this Map</span><br /><div>Because this map is delivered as a vector tile layer, users can customize the map to change its content and symbology, including fonts. Users are able to turn on and off layers and change symbols for layers.</div><div><br /></div><div>An easy way to change the style of this map is to use the Vector Basemap Style Editor:</div><div><a href='https://developers.arcgis.com/vector-tile-style-editor/' target='_blank' rel='nofollow ugc noopener noreferrer'>https://developers.arcgis.com/vector-tile-style-editor/</a></div>",
			"keyword": [
				"topographic",
				"community",
				"basemap",
				"NZ",
				"New Zealand",
				"Map",
				"Basemap",
				"Background",
				"Layer",
				"topography",
				"content",
				"living atlas",
				"basemaps",
				"esri_basemap",
				"esri_basemaps",
				"detailed",
				"digital map",
				"Linz",
				"current",
				"open data",
				"data sets",
				"kiwi",
				"vector",
				"vector tiles",
				"topo",
				"topo nz",
				"Eagle",
				"Eagle Technology",
				"NZTM",
				"Aotearoa",
				"eaglegis"
			],
			"issued": "2019-12-12T23:58:29.000Z",
			"modified": "2026-11-03T04:04:50.000Z",
			"publisher": {
				"name": "Eagle Technology Group Ltd"
			},
			"contactPoint": {
				"@type": "vcard:Contact",
				"fn": "eaglegis",
				"hasEmail": "mailto:ts@eaglegis.co.nz"
			},
			"accessLevel": "public",
			"spatial": "",
			"license": "https://creativecommons.org/licenses/by/4.0",
			"distribution": [
				{
					"@type": "dcat:Distribution",
					"title": "ArcGIS Hub Dataset",
					"format": "Web Page",
					"mediaType": "text/html",
					"accessURL": "https://www.pacificgeoportal.com/maps/eaglegis::nz-topographic-vector"
				},
				{
					"@type": "dcat:Distribution",
					"title": "ArcGIS GeoService",
					"format": "ArcGIS GeoServices REST API",
					"mediaType": "application/json",
					"accessURL": "https://tiles.arcgis.com/tiles/XTtANUDT8Va4DLwI/arcgis/rest/services/nz_vector_basemap_v1/VectorTileServer"
				}
			],
			"theme": ""
		},
		{
			"@type": "dcat:Dataset",
			"identifier": "https://www.arcgis.com/home/item.html?id=3af669838f594b378f90c10f98e46a7f",
			"landingPage": "https://www.pacificgeoportal.com/maps/esri::world-elevation-coverage-map",
			"title": "World Elevation Coverage Map",
			"description": "<div><p style='margin-bottom:12.0pt; margin-right:0in; margin-top:12.0pt;'>World Elevation layers are compiled from many authoritative data providers, and are updated quarterly. This map shows the extent of the various datasets comprising the World Elevation dynamic (<a target='_blank' href='https://www.arcgis.com/home/item.html?id=58a541efc59545e6b7137f961d7de883' rel='nofollow ugc noopener noreferrer'>Terrain</a>,<a target='_blank' href='https://www.arcgis.com/home/item.html?id=c753e5bfadb54d46b69c3e68922483bc' rel='nofollow ugc noopener noreferrer'>TopoBathy</a>) and tiled (<a target='_blank' href='https://www.arcgis.com/home/item.html?id=7029fb60158543ad845c7e1527af11e4' rel='nofollow ugc noopener noreferrer'>Terrain 3D</a>, <a target='_blank' href='https://www.arcgis.com/home/item.html?id=0c69ba5a5d254118841d43f03aa3e97d' rel='nofollow ugc noopener noreferrer'>TopoBathy 3D</a>, <a target='_blank' href='https://www.arcgis.com/home/item.html?id=1b243539f4514b6ba35e7d995890db1d' rel='nofollow ugc noopener noreferrer'>World Hillshade</a>, <a target='_blank' href='https://www.arcgis.com/home/item.html?id=428539ef9cab4017b69d15a40a9ee98b' rel='nofollow ugc noopener noreferrer'>World Hillshade (Dark)</a>) services.</p><p style='margin-bottom:12.0pt; margin-right:0in; margin-top:12.0pt;'>The tiled services (<a target='_blank' href='https://www.arcgis.com/home/item.html?id=7029fb60158543ad845c7e1527af11e4' rel='nofollow ugc noopener noreferrer'>Terrain 3D</a>,<a target='_blank' href='https://www.arcgis.com/home/item.html?id=0c69ba5a5d254118841d43f03aa3e97d' rel='nofollow ugc noopener noreferrer'> TopoBathy 3D</a>, <a target='_blank' href='https://www.arcgis.com/home/item.html?id=1b243539f4514b6ba35e7d995890db1d' rel='nofollow ugc noopener noreferrer'>World Hillshade</a>, <a target='_blank' href='https://www.arcgis.com/home/item.html?id=428539ef9cab4017b69d15a40a9ee98b' rel='nofollow ugc noopener noreferrer'>World Hillshade (Dark)</a>) also include an additional data source from <a target='_blank' href='https://www.arcgis.com/apps/mapviewer/index.html?webmap=2daa50a1091b4395925e816a8bb05ae0' rel='nofollow ugc noopener noreferrer'>Vantor's Precision3D</a> covering parts of the globe.</p><p style='margin-bottom:12.0pt; margin-right:0in; margin-top:12.0pt;'><strong>Note: </strong><a target='_blank' href='https://developers.arcgis.com/rest/elevation/' rel='nofollow ugc noopener noreferrer'>ArcGIS Elevation service</a>, <a target='_blank' href='https://www.arcgis.com/home/item.html?id=09ae40dd6766478bb7de3c557c1421cb' rel='nofollow ugc noopener noreferrer'>Terrain 3D (for Export)</a> and <a target='_blank' href='https://www.arcgis.com/home/item.html?id=2ed76fcfac0a405e821aca0568ab41cd' rel='nofollow ugc noopener noreferrer'>TopoBathy 3D (for Export)</a> does not include Vantor Precision3D and Airbus WorldDEM4Ortho.</p><p style='line-height:115%; margin-bottom:8.0pt;'>To view the all the sources in a table format, check out <a target='_blank' href='https://www.arcgis.com/home/item.html?id=a183c04c3d9f40349ca87b555efb3180' rel='nofollow ugc noopener noreferrer'>World Elevation Data Sources Table</a>.</p><p style='margin-bottom:12.0pt; margin-right:0in; margin-top:12.0pt;'>Topography sources listed in the table are part of <a target='_blank' href='https://www.arcgis.com/home/item.html?id=58a541efc59545e6b7137f961d7de883' rel='nofollow ugc noopener noreferrer'>Terrain</a>, <a target='_blank' href='https://www.arcgis.com/home/item.html?id=c753e5bfadb54d46b69c3e68922483bc' rel='nofollow ugc noopener noreferrer'>TopoBathy</a>, <a target='_blank' href='https://www.arcgis.com/home/item.html?id=7029fb60158543ad845c7e1527af11e4' rel='nofollow ugc noopener noreferrer'>Terrain 3D</a>, <a target='_blank' href='https://www.arcgis.com/home/item.html?id=0c69ba5a5d254118841d43f03aa3e97d' rel='nofollow ugc noopener noreferrer'>TopoBathy 3D</a>, <a target='_blank' href='https://www.arcgis.com/home/item.html?id=1b243539f4514b6ba35e7d995890db1d' rel='nofollow ugc noopener noreferrer'>World Hillshade</a> and <a target='_blank' href='https://www.arcgis.com/home/item.html?id=428539ef9cab4017b69d15a40a9ee98b' rel='nofollow ugc noopener noreferrer'>World Hillshade (Dark)</a>, while bathymetry sources are part of <a target='_blank' href='https://www.arcgis.com/home/item.html?id=c753e5bfadb54d46b69c3e68922483bc' rel='nofollow ugc noopener noreferrer'>TopoBathy</a> and <a target='_blank' href='https://www.arcgis.com/home/item.html?id=0c69ba5a5d254118841d43f03aa3e97d' rel='nofollow ugc noopener noreferrer'>TopoBathy 3D</a> only.</p><p style='line-height:18.0pt;'>Check out <a target='_blank' href='https://www.arcgis.com/home/group.html?id=bbc5f50839094e9d8dc5255b6a7783dd#overview' rel='nofollow ugc noopener noreferrer'>elevation layers</a>&nbsp;group for all the elevation content available to ArcGIS users.</p><p><span style='font-size:14px;'><strong>Disclaimer</strong>: Data sources are not to be used for navigation/safety at sea and in air.</span></p></div><div><p style='margin-bottom:12.0pt; margin-right:0in; margin-top:12.0pt;'>&nbsp;</p></div>",
			"keyword": [
				"NED",
				"SRTM",
				"GMTED",
				"EGM2008",
				"DEM",
				"land",
				"topography",
				"bathymetry",
				"ocean",
				"coverage map",
				"hillshade",
				"slope",
				"aspect",
				"elevation",
				"esri_elevation",
				"landscape",
				"world_elevation",
				"world elevation",
				"multidirectional",
				"multi-directional",
				"DTM",
				"WorldDEM"
			],
			"issued": "2014-04-10T22:42:00.000Z",
			"modified": "2026-10-29T15:43:27.000Z",
			"publisher": {
				"name": "Esri"
			},
			"contactPoint": {
				"@type": "vcard:Contact",
				"fn": "esri",
				"hasEmail": "{{orgContactEmail}}"
			},
			"accessLevel": "public",
			"spatial": "-180.0000,-89.0000,180.0000,89.0000",
			"license": "<img alt='' src='https://downloads.esri.com/blogs/arcgisonline/esrilogo_new.png' /> This work is licensed under the Esri Master License Agreement.<br /><div><a href='https://goto.arcgis.com/termsofuse/viewsummary' target='_blank' rel='nofollow ugc noopener noreferrer'><b>View Summary</b></a> | <a href='https://goto.arcgis.com/termsofuse/viewtermsofuse' target='_blank' rel='nofollow ugc noopener noreferrer'><b>View Terms of Use</b></a></div>",
			"distribution": [
				{
					"@type": "dcat:Distribution",
					"title": "ArcGIS Hub Dataset",
					"format": "Web Page",
					"mediaType": "text/html",
					"accessURL": "https://www.pacificgeoportal.com/maps/esri::world-elevation-coverage-map"
				},
				{
					"@type": "dcat:Distribution",
					"title": "ArcGIS GeoService",
					"format": "ArcGIS GeoServices REST API",
					"mediaType": "application/json",
					"accessURL": "https://elevation.arcgis.com/arcgis/rest/services/WorldElevation/DataExtents/MapServer"
				}
			],
			"theme": [
				"geospatial"
			]
		},
		{
			"@type": "dcat:Dataset",
			"identifier": "https://www.arcgis.com/home/item.html?id=3af669838f594b378f90c10f98e46a7f&sublayer=0",
			"landingPage": "https://www.pacificgeoportal.com/datasets/esri::1m-or-better-1",
			"title": "1m or better",
			"description": "<div><p style='margin-bottom:12.0pt; margin-right:0in; margin-top:12.0pt;'>World Elevation layers are compiled from many authoritative data providers, and are updated quarterly. This map shows the extent of the various datasets comprising the World Elevation dynamic (<a target='_blank' href='https://www.arcgis.com/home/item.html?id=58a541efc59545e6b7137f961d7de883' rel='nofollow ugc noopener noreferrer'>Terrain</a>,<a target='_blank' href='https://www.arcgis.com/home/item.html?id=c753e5bfadb54d46b69c3e68922483bc' rel='nofollow ugc noopener noreferrer'>TopoBathy</a>) and tiled (<a target='_blank' href='https://www.arcgis.com/home/item.html?id=7029fb60158543ad845c7e1527af11e4' rel='nofollow ugc noopener noreferrer'>Terrain 3D</a>, <a target='_blank' href='https://www.arcgis.com/home/item.html?id=0c69ba5a5d254118841d43f03aa3e97d' rel='nofollow ugc noopener noreferrer'>TopoBathy 3D</a>, <a target='_blank' href='https://www.arcgis.com/home/item.html?id=1b243539f4514b6ba35e7d995890db1d' rel='nofollow ugc noopener noreferrer'>World Hillshade</a>, <a target='_blank' href='https://www.arcgis.com/home/item.html?id=428539ef9cab4017b69d15a40a9ee98b' rel='nofollow ugc noopener noreferrer'>World Hillshade (Dark)</a>) services.</p><p style='margin-bottom:12.0pt; margin-right:0in; margin-top:12.0pt;'>The tiled services (<a target='_blank' href='https://www.arcgis.com/home/item.html?id=7029fb60158543ad845c7e1527af11e4' rel='nofollow ugc noopener noreferrer'>Terrain 3D</a>,<a target='_blank' href='https://www.arcgis.com/home/item.html?id=0c69ba5a5d254118841d43f03aa3e97d' rel='nofollow ugc noopener noreferrer'> TopoBathy 3D</a>, <a target='_blank' href='https://www.arcgis.com/home/item.html?id=1b243539f4514b6ba35e7d995890db1d' rel='nofollow ugc noopener noreferrer'>World Hillshade</a>, <a target='_blank' href='https://www.arcgis.com/home/item.html?id=428539ef9cab4017b69d15a40a9ee98b' rel='nofollow ugc noopener noreferrer'>World Hillshade (Dark)</a>) also include an additional data source from <a target='_blank' href='https://www.arcgis.com/apps/mapviewer/index.html?webmap=2daa50a1091b4395925e816a8bb05ae0' rel='nofollow ugc noopener noreferrer'>Vantor's Precision3D</a> covering parts of the globe.</p><p style='margin-bottom:12.0pt; margin-right:0in; margin-top:12.0pt;'><strong>Note: </strong><a target='_blank' href='https://developers.arcgis.com/rest/elevation/' rel='nofollow ugc noopener noreferrer'>ArcGIS Elevation service</a>, <a target='_blank' href='https://www.arcgis.com/home/item.html?id=09ae40dd6766478bb7de3c557c1421cb' rel='nofollow ugc noopener noreferrer'>Terrain 3D (for Export)</a> and <a target='_blank' href='https://www.arcgis.com/home/item.html?id=2ed76fcfac0a405e821aca0568ab41cd' rel='nofollow ugc noopener noreferrer'>TopoBathy 3D (for Export)</a> does not include Vantor Precision3D and Airbus WorldDEM4Ortho.</p><p style='line-height:115%; margin-bottom:8.0pt;'>To view the all the sources in a table format, check out <a target='_blank' href='https://www.arcgis.com/home/item.html?id=a183c04c3d9f40349ca87b555efb3180' rel='nofollow ugc noopener noreferrer'>World Elevation Data Sources Table</a>.</p><p style='margin-bottom:12.0pt; margin-right:0in; margin-top:12.0pt;'>Topography sources listed in the table are part of <a target='_blank' href='https://www.arcgis.com/home/item.html?id=58a541efc59545e6b7137f961d7de883' rel='nofollow ugc noopener noreferrer'>Terrain</a>, <a target='_blank' href='https://www.arcgis.com/home/item.html?id=c753e5bfadb54d46b69c3e68922483bc' rel='nofollow ugc noopener noreferrer'>TopoBathy</a>, <a target='_blank' href='https://www.arcgis.com/home/item.html?id=7029fb60158543ad845c7e1527af11e4' rel='nofollow ugc noopener noreferrer'>Terrain 3D</a>, <a target='_blank' href='https://www.arcgis.com/home/item.html?id=0c69ba5a5d254118841d43f03aa3e97d' rel='nofollow ugc noopener noreferrer'>TopoBathy 3D</a>, <a target='_blank' href='https://www.arcgis.com/home/item.html?id=1b243539f4514b6ba35e7d995890db1d' rel='nofollow ugc noopener noreferrer'>World Hillshade</a> and <a target='_blank' href='https://www.arcgis.com/home/item.html?id=428539ef9cab4017b69d15a40a9ee98b' rel='nofollow ugc noopener noreferrer'>World Hillshade (Dark)</a>, while bathymetry sources are part of <a target='_blank' href='https://www.arcgis.com/home/item.html?id=c753e5bfadb54d46b69c3e68922483bc' rel='nofollow ugc noopener noreferrer'>TopoBathy</a> and <a target='_blank' href='https://www.arcgis.com/home/item.html?id=0c69ba5a5d254118841d43f03aa3e97d' rel='nofollow ugc noopener noreferrer'>TopoBathy 3D</a> only.</p><p style='line-height:18.0pt;'>Check out <a target='_blank' href='https://www.arcgis.com/home/group.html?id=bbc5f50839094e9d8dc5255b6a7783dd#overview' rel='nofollow ugc noopener noreferrer'>elevation layers</a>&nbsp;group for all the elevation content available to ArcGIS users.</p><p><span style='font-size:14px;'><strong>Disclaimer</strong>: Data sources are not to be used for navigation/safety at sea and in air.</span></p></div><div><p style='margin-bottom:12.0pt; margin-right:0in; margin-top:12.0pt;'>&nbsp;</p></div>",
			"keyword": [
				"NED",
				"SRTM",
				"GMTED",
				"EGM2008",
				"DEM",
				"land",
				"topography",
				"bathymetry",
				"ocean",
				"coverage map",
				"hillshade",
				"slope",
				"aspect",
				"elevation",
				"esri_elevation",
				"landscape",
				"world_elevation",
				"world elevation",
				"multidirectional",
				"multi-directional",
				"DTM",
				"WorldDEM"
			],
			"issued": "2014-04-10T22:42:00.000Z",
			"modified": "2026-10-29T15:43:27.000Z",
			"publisher": {
				"name": "Esri"
			},
			"contactPoint": {
				"@type": "vcard:Contact",
				"fn": "esri",
				"hasEmail": "{{orgContactEmail}}"
			},
			"accessLevel": "public",
			"spatial": "-180.0000,-89.0000,180.0000,89.0000",
			"license": "<img alt='' src='https://downloads.esri.com/blogs/arcgisonline/esrilogo_new.png' /> This work is licensed under the Esri Master License Agreement.<br /><div><a href='https://goto.arcgis.com/termsofuse/viewsummary' target='_blank' rel='nofollow ugc noopener noreferrer'><b>View Summary</b></a> | <a href='https://goto.arcgis.com/termsofuse/viewtermsofuse' target='_blank' rel='nofollow ugc noopener noreferrer'><b>View Terms of Use</b></a></div>",
			"distribution": [
				{
					"@type": "dcat:Distribution",
					"title": "ArcGIS Hub Dataset",
					"format": "Web Page",
					"mediaType": "text/html",
					"accessURL": "https://www.pacificgeoportal.com/datasets/esri::1m-or-better-1"
				},
				{
					"@type": "dcat:Distribution",
					"title": "ArcGIS GeoService",
					"format": "ArcGIS GeoServices REST API",
					"mediaType": "application/json",
					"accessURL": "https://elevation.arcgis.com/arcgis/rest/services/WorldElevation/DataExtents/MapServer/0"
				},
				{
					"@type": "dcat:Distribution",
					"title": "CSV",
					"format": "CSV",
					"mediaType": "text/csv",
					"accessURL": "https://www.pacificgeoportal.com/api/download/v1/items/3af669838f594b378f90c10f98e46a7f/csv?layers=0"
				},
				{
					"@type": "dcat:Distribution",
					"title": "Shapefile",
					"format": "ZIP",
					"mediaType": "application/zip",
					"accessURL": "https://www.pacificgeoportal.com/api/download/v1/items/3af669838f594b378f90c10f98e46a7f/shapefile?layers=0"
				},
				{
					"@type": "dcat:Distribution",
					"title": "GeoJSON",
					"format": "GeoJSON",
					"mediaType": "application/vnd.geo+json",
					"accessURL": "https://www.pacificgeoportal.com/api/download/v1/items/3af669838f594b378f90c10f98e46a7f/geojson?layers=0"
				},
				{
					"@type": "dcat:Distribution",
					"title": "KML",
					"format": "KML",
					"mediaType": "application/vnd.google-earth.kml+xml",
					"accessURL": "https://www.pacificgeoportal.com/api/download/v1/items/3af669838f594b378f90c10f98e46a7f/kml?layers=0"
				}
			],
			"theme": [
				"geospatial"
			]
		},
		{
			"@type": "dcat:Dataset",
			"identifier": "https://www.arcgis.com/home/item.html?id=3af669838f594b378f90c10f98e46a7f&sublayer=1",
			"landingPage": "https://www.pacificgeoportal.com/datasets/esri::2-6m-1",
			"title": "2-6m",
			"description": "<div><p style='margin-bottom:12.0pt; margin-right:0in; margin-top:12.0pt;'>World Elevation layers are compiled from many authoritative data providers, and are updated quarterly. This map shows the extent of the various datasets comprising the World Elevation dynamic (<a target='_blank' href='https://www.arcgis.com/home/item.html?id=58a541efc59545e6b7137f961d7de883' rel='nofollow ugc noopener noreferrer'>Terrain</a>,<a target='_blank' href='https://www.arcgis.com/home/item.html?id=c753e5bfadb54d46b69c3e68922483bc' rel='nofollow ugc noopener noreferrer'>TopoBathy</a>) and tiled (<a target='_blank' href='https://www.arcgis.com/home/item.html?id=7029fb60158543ad845c7e1527af11e4' rel='nofollow ugc noopener noreferrer'>Terrain 3D</a>, <a target='_blank' href='https://www.arcgis.com/home/item.html?id=0c69ba5a5d254118841d43f03aa3e97d' rel='nofollow ugc noopener noreferrer'>TopoBathy 3D</a>, <a target='_blank' href='https://www.arcgis.com/home/item.html?id=1b243539f4514b6ba35e7d995890db1d' rel='nofollow ugc noopener noreferrer'>World Hillshade</a>, <a target='_blank' href='https://www.arcgis.com/home/item.html?id=428539ef9cab4017b69d15a40a9ee98b' rel='nofollow ugc noopener noreferrer'>World Hillshade (Dark)</a>) services.</p><p style='margin-bottom:12.0pt; margin-right:0in; margin-top:12.0pt;'>The tiled services (<a target='_blank' href='https://www.arcgis.com/home/item.html?id=7029fb60158543ad845c7e1527af11e4' rel='nofollow ugc noopener noreferrer'>Terrain 3D</a>,<a target='_blank' href='https://www.arcgis.com/home/item.html?id=0c69ba5a5d254118841d43f03aa3e97d' rel='nofollow ugc noopener noreferrer'> TopoBathy 3D</a>, <a target='_blank' href='https://www.arcgis.com/home/item.html?id=1b243539f4514b6ba35e7d995890db1d' rel='nofollow ugc noopener noreferrer'>World Hillshade</a>, <a target='_blank' href='https://www.arcgis.com/home/item.html?id=428539ef9cab4017b69d15a40a9ee98b' rel='nofollow ugc noopener noreferrer'>World Hillshade (Dark)</a>) also include an additional data source from <a target='_blank' href='https://www.arcgis.com/apps/mapviewer/index.html?webmap=2daa50a1091b4395925e816a8bb05ae0' rel='nofollow ugc noopener noreferrer'>Vantor's Precision3D</a> covering parts of the globe.</p><p style='margin-bottom:12.0pt; margin-right:0in; margin-top:12.0pt;'><strong>Note: </strong><a target='_blank' href='https://developers.arcgis.com/rest/elevation/' rel='nofollow ugc noopener noreferrer'>ArcGIS Elevation service</a>, <a target='_blank' href='https://www.arcgis.com/home/item.html?id=09ae40dd6766478bb7de3c557c1421cb' rel='nofollow ugc noopener noreferrer'>Terrain 3D (for Export)</a> and <a target='_blank' href='https://www.arcgis.com/home/item.html?id=2ed76fcfac0a405e821aca0568ab41cd' rel='nofollow ugc noopener noreferrer'>TopoBathy 3D (for Export)</a> does not include Vantor Precision3D and Airbus WorldDEM4Ortho.</p><p style='line-height:115%; margin-bottom:8.0pt;'>To view the all the sources in a table format, check out <a target='_blank' href='https://www.arcgis.com/home/item.html?id=a183c04c3d9f40349ca87b555efb3180' rel='nofollow ugc noopener noreferrer'>World Elevation Data Sources Table</a>.</p><p style='margin-bottom:12.0pt; margin-right:0in; margin-top:12.0pt;'>Topography sources listed in the table are part of <a target='_blank' href='https://www.arcgis.com/home/item.html?id=58a541efc59545e6b7137f961d7de883' rel='nofollow ugc noopener noreferrer'>Terrain</a>, <a target='_blank' href='https://www.arcgis.com/home/item.html?id=c753e5bfadb54d46b69c3e68922483bc' rel='nofollow ugc noopener noreferrer'>TopoBathy</a>, <a target='_blank' href='https://www.arcgis.com/home/item.html?id=7029fb60158543ad845c7e1527af11e4' rel='nofollow ugc noopener noreferrer'>Terrain 3D</a>, <a target='_blank' href='https://www.arcgis.com/home/item.html?id=0c69ba5a5d254118841d43f03aa3e97d' rel='nofollow ugc noopener noreferrer'>TopoBathy 3D</a>, <a target='_blank' href='https://www.arcgis.com/home/item.html?id=1b243539f4514b6ba35e7d995890db1d' rel='nofollow ugc noopener noreferrer'>World Hillshade</a> and <a target='_blank' href='https://www.arcgis.com/home/item.html?id=428539ef9cab4017b69d15a40a9ee98b' rel='nofollow ugc noopener noreferrer'>World Hillshade (Dark)</a>, while bathymetry sources are part of <a target='_blank' href='https://www.arcgis.com/home/item.html?id=c753e5bfadb54d46b69c3e68922483bc' rel='nofollow ugc noopener noreferrer'>TopoBathy</a> and <a target='_blank' href='https://www.arcgis.com/home/item.html?id=0c69ba5a5d254118841d43f03aa3e97d' rel='nofollow ugc noopener noreferrer'>TopoBathy 3D</a> only.</p><p style='line-height:18.0pt;'>Check out <a target='_blank' href='https://www.arcgis.com/home/group.html?id=bbc5f50839094e9d8dc5255b6a7783dd#overview' rel='nofollow ugc noopener noreferrer'>elevation layers</a>&nbsp;group for all the elevation content available to ArcGIS users.</p><p><span style='font-size:14px;'><strong>Disclaimer</strong>: Data sources are not to be used for navigation/safety at sea and in air.</span></p></div><div><p style='margin-bottom:12.0pt; margin-right:0in; margin-top:12.0pt;'>&nbsp;</p></div>",
			"keyword": [
				"NED",
				"SRTM",
				"GMTED",
				"EGM2008",
				"DEM",
				"land",
				"topography",
				"bathymetry",
				"ocean",
				"coverage map",
				"hillshade",
				"slope",
				"aspect",
				"elevation",
				"esri_elevation",
				"landscape",
				"world_elevation",
				"world elevation",
				"multidirectional",
				"multi-directional",
				"DTM",
				"WorldDEM"
			],
			"issued": "2014-04-10T22:42:00.000Z",
			"modified": "2026-10-29T15:43:27.000Z",
			"publisher": {
				"name": "Esri"
			},
			"contactPoint": {
				"@type": "vcard:Contact",
				"fn": "esri",
				"hasEmail": "{{orgContactEmail}}"
			},
			"accessLevel": "public",
			"spatial": "-180.0000,-89.0000,180.0000,89.0000",
			"license": "<img alt='' src='https://downloads.esri.com/blogs/arcgisonline/esrilogo_new.png' /> This work is licensed under the Esri Master License Agreement.<br /><div><a href='https://goto.arcgis.com/termsofuse/viewsummary' target='_blank' rel='nofollow ugc noopener noreferrer'><b>View Summary</b></a> | <a href='https://goto.arcgis.com/termsofuse/viewtermsofuse' target='_blank' rel='nofollow ugc noopener noreferrer'><b>View Terms of Use</b></a></div>",
			"distribution": [
				{
					"@type": "dcat:Distribution",
					"title": "ArcGIS Hub Dataset",
					"format": "Web Page",
					"mediaType": "text/html",
					"accessURL": "https://www.pacificgeoportal.com/datasets/esri::2-6m-1"
				},
				{
					"@type": "dcat:Distribution",
					"title": "ArcGIS GeoService",
					"format": "ArcGIS GeoServices REST API",
					"mediaType": "application/json",
					"accessURL": "https://elevation.arcgis.com/arcgis/rest/services/WorldElevation/DataExtents/MapServer/1"
				},
				{
					"@type": "dcat:Distribution",
					"title": "CSV",
					"format": "CSV",
					"mediaType": "text/csv",
					"accessURL": "https://www.pacificgeoportal.com/api/download/v1/items/3af669838f594b378f90c10f98e46a7f/csv?layers=1"
				},
				{
					"@type": "dcat:Distribution",
					"title": "Shapefile",
					"format": "ZIP",
					"mediaType": "application/zip",
					"accessURL": "https://www.pacificgeoportal.com/api/download/v1/items/3af669838f594b378f90c10f98e46a7f/shapefile?layers=1"
				},
				{
					"@type": "dcat:Distribution",
					"title": "GeoJSON",
					"format": "GeoJSON",
					"mediaType": "application/vnd.geo+json",
					"accessURL": "https://www.pacificgeoportal.com/api/download/v1/items/3af669838f594b378f90c10f98e46a7f/geojson?layers=1"
				},
				{
					"@type": "dcat:Distribution",
					"title": "KML",
					"format": "KML",
					"mediaType": "application/vnd.google-earth.kml+xml",
					"accessURL": "https://www.pacificgeoportal.com/api/download/v1/items/3af669838f594b378f90c10f98e46a7f/kml?layers=1"
				}
			],
			"theme": [
				"geospatial"
			]
		},
		{
			"@type": "dcat:Dataset",
			"identifier": "https://www.arcgis.com/home/item.html?id=3af669838f594b378f90c10f98e46a7f&sublayer=10",
			"landingPage": "https://www.pacificgeoportal.com/datasets/esri::1000m",
			"title": "1000m",
			"description": "<div><p style='margin-bottom:12.0pt; margin-right:0in; margin-top:12.0pt;'>World Elevation layers are compiled from many authoritative data providers, and are updated quarterly. This map shows the extent of the various datasets comprising the World Elevation dynamic (<a target='_blank' href='https://www.arcgis.com/home/item.html?id=58a541efc59545e6b7137f961d7de883' rel='nofollow ugc noopener noreferrer'>Terrain</a>,<a target='_blank' href='https://www.arcgis.com/home/item.html?id=c753e5bfadb54d46b69c3e68922483bc' rel='nofollow ugc noopener noreferrer'>TopoBathy</a>) and tiled (<a target='_blank' href='https://www.arcgis.com/home/item.html?id=7029fb60158543ad845c7e1527af11e4' rel='nofollow ugc noopener noreferrer'>Terrain 3D</a>, <a target='_blank' href='https://www.arcgis.com/home/item.html?id=0c69ba5a5d254118841d43f03aa3e97d' rel='nofollow ugc noopener noreferrer'>TopoBathy 3D</a>, <a target='_blank' href='https://www.arcgis.com/home/item.html?id=1b243539f4514b6ba35e7d995890db1d' rel='nofollow ugc noopener noreferrer'>World Hillshade</a>, <a target='_blank' href='https://www.arcgis.com/home/item.html?id=428539ef9cab4017b69d15a40a9ee98b' rel='nofollow ugc noopener noreferrer'>World Hillshade (Dark)</a>) services.</p><p style='margin-bottom:12.0pt; margin-right:0in; margin-top:12.0pt;'>The tiled services (<a target='_blank' href='https://www.arcgis.com/home/item.html?id=7029fb60158543ad845c7e1527af11e4' rel='nofollow ugc noopener noreferrer'>Terrain 3D</a>,<a target='_blank' href='https://www.arcgis.com/home/item.html?id=0c69ba5a5d254118841d43f03aa3e97d' rel='nofollow ugc noopener noreferrer'> TopoBathy 3D</a>, <a target='_blank' href='https://www.arcgis.com/home/item.html?id=1b243539f4514b6ba35e7d995890db1d' rel='nofollow ugc noopener noreferrer'>World Hillshade</a>, <a target='_blank' href='https://www.arcgis.com/home/item.html?id=428539ef9cab4017b69d15a40a9ee98b' rel='nofollow ugc noopener noreferrer'>World Hillshade (Dark)</a>) also include an additional data source from <a target='_blank' href='https://www.arcgis.com/apps/mapviewer/index.html?webmap=2daa50a1091b4395925e816a8bb05ae0' rel='nofollow ugc noopener noreferrer'>Vantor's Precision3D</a> covering parts of the globe.</p><p style='margin-bottom:12.0pt; margin-right:0in; margin-top:12.0pt;'><strong>Note: </strong><a target='_blank' href='https://developers.arcgis.com/rest/elevation/' rel='nofollow ugc noopener noreferrer'>ArcGIS Elevation service</a>, <a target='_blank' href='https://www.arcgis.com/home/item.html?id=09ae40dd6766478bb7de3c557c1421cb' rel='nofollow ugc noopener noreferrer'>Terrain 3D (for Export)</a> and <a target='_blank' href='https://www.arcgis.com/home/item.html?id=2ed76fcfac0a405e821aca0568ab41cd' rel='nofollow ugc noopener noreferrer'>TopoBathy 3D (for Export)</a> does not include Vantor Precision3D and Airbus WorldDEM4Ortho.</p><p style='line-height:115%; margin-bottom:8.0pt;'>To view the all the sources in a table format, check out <a target='_blank' href='https://www.arcgis.com/home/item.html?id=a183c04c3d9f40349ca87b555efb3180' rel='nofollow ugc noopener noreferrer'>World Elevation Data Sources Table</a>.</p><p style='margin-bottom:12.0pt; margin-right:0in; margin-top:12.0pt;'>Topography sources listed in the table are part of <a target='_blank' href='https://www.arcgis.com/home/item.html?id=58a541efc59545e6b7137f961d7de883' rel='nofollow ugc noopener noreferrer'>Terrain</a>, <a target='_blank' href='https://www.arcgis.com/home/item.html?id=c753e5bfadb54d46b69c3e68922483bc' rel='nofollow ugc noopener noreferrer'>TopoBathy</a>, <a target='_blank' href='https://www.arcgis.com/home/item.html?id=7029fb60158543ad845c7e1527af11e4' rel='nofollow ugc noopener noreferrer'>Terrain 3D</a>, <a target='_blank' href='https://www.arcgis.com/home/item.html?id=0c69ba5a5d254118841d43f03aa3e97d' rel='nofollow ugc noopener noreferrer'>TopoBathy 3D</a>, <a target='_blank' href='https://www.arcgis.com/home/item.html?id=1b243539f4514b6ba35e7d995890db1d' rel='nofollow ugc noopener noreferrer'>World Hillshade</a> and <a target='_blank' href='https://www.arcgis.com/home/item.html?id=428539ef9cab4017b69d15a40a9ee98b' rel='nofollow ugc noopener noreferrer'>World Hillshade (Dark)</a>, while bathymetry sources are part of <a target='_blank' href='https://www.arcgis.com/home/item.html?id=c753e5bfadb54d46b69c3e68922483bc' rel='nofollow ugc noopener noreferrer'>TopoBathy</a> and <a target='_blank' href='https://www.arcgis.com/home/item.html?id=0c69ba5a5d254118841d43f03aa3e97d' rel='nofollow ugc noopener noreferrer'>TopoBathy 3D</a> only.</p><p style='line-height:18.0pt;'>Check out <a target='_blank' href='https://www.arcgis.com/home/group.html?id=bbc5f50839094e9d8dc5255b6a7783dd#overview' rel='nofollow ugc noopener noreferrer'>elevation layers</a>&nbsp;group for all the elevation content available to ArcGIS users.</p><p><span style='font-size:14px;'><strong>Disclaimer</strong>: Data sources are not to be used for navigation/safety at sea and in air.</span></p></div><div><p style='margin-bottom:12.0pt; margin-right:0in; margin-top:12.0pt;'>&nbsp;</p></div>",
			"keyword": [
				"NED",
				"SRTM",
				"GMTED",
				"EGM2008",
				"DEM",
				"land",
				"topography",
				"bathymetry",
				"ocean",
				"coverage map",
				"hillshade",
				"slope",
				"aspect",
				"elevation",
				"esri_elevation",
				"landscape",
				"world_elevation",
				"world elevation",
				"multidirectional",
				"multi-directional",
				"DTM",
				"WorldDEM"
			],
			"issued": "2014-04-10T22:42:00.000Z",
			"modified": "2026-10-29T15:43:27.000Z",
			"publisher": {
				"name": "Esri"
			},
			"contactPoint": {
				"@type": "vcard:Contact",
				"fn": "esri",
				"hasEmail": "{{orgContactEmail}}"
			},
			"accessLevel": "public",
			"spatial": "-180.0000,-89.0000,180.0000,89.0000",
			"license": "<img alt='' src='https://downloads.esri.com/blogs/arcgisonline/esrilogo_new.png' /> This work is licensed under the Esri Master License Agreement.<br /><div><a href='https://goto.arcgis.com/termsofuse/viewsummary' target='_blank' rel='nofollow ugc noopener noreferrer'><b>View Summary</b></a> | <a href='https://goto.arcgis.com/termsofuse/viewtermsofuse' target='_blank' rel='nofollow ugc noopener noreferrer'><b>View Terms of Use</b></a></div>",
			"distribution": [
				{
					"@type": "dcat:Distribution",
					"title": "ArcGIS Hub Dataset",
					"format": "Web Page",
					"mediaType": "text/html",
					"accessURL": "https://www.pacificgeoportal.com/datasets/esri::1000m"
				},
				{
					"@type": "dcat:Distribution",
					"title": "ArcGIS GeoService",
					"format": "ArcGIS GeoServices REST API",
					"mediaType": "application/json",
					"accessURL": "https://elevation.arcgis.com/arcgis/rest/services/WorldElevation/DataExtents/MapServer/10"
				},
				{
					"@type": "dcat:Distribution",
					"title": "CSV",
					"format": "CSV",
					"mediaType": "text/csv",
					"accessURL": "https://www.pacificgeoportal.com/api/download/v1/items/3af669838f594b378f90c10f98e46a7f/csv?layers=10"
				},
				{
					"@type": "dcat:Distribution",
					"title": "Shapefile",
					"format": "ZIP",
					"mediaType": "application/zip",
					"accessURL": "https://www.pacificgeoportal.com/api/download/v1/items/3af669838f594b378f90c10f98e46a7f/shapefile?layers=10"
				},
				{
					"@type": "dcat:Distribution",
					"title": "GeoJSON",
					"format": "GeoJSON",
					"mediaType": "application/vnd.geo+json",
					"accessURL": "https://www.pacificgeoportal.com/api/download/v1/items/3af669838f594b378f90c10f98e46a7f/geojson?layers=10"
				},
				{
					"@type": "dcat:Distribution",
					"title": "KML",
					"format": "KML",
					"mediaType": "application/vnd.google-earth.kml+xml",
					"accessURL": "https://www.pacificgeoportal.com/api/download/v1/items/3af669838f594b378f90c10f98e46a7f/kml?layers=10"
				}
			],
			"theme": [
				"geospatial"
			]
		},
		{
			"@type": "dcat:Dataset",
			"identifier": "https://www.arcgis.com/home/item.html?id=3af669838f594b378f90c10f98e46a7f&sublayer=2",
			"landingPage": "https://www.pacificgeoportal.com/datasets/esri::10m-1",
			"title": "10m",
			"description": "<div><p style='margin-bottom:12.0pt; margin-right:0in; margin-top:12.0pt;'>World Elevation layers are compiled from many authoritative data providers, and are updated quarterly. This map shows the extent of the various datasets comprising the World Elevation dynamic (<a target='_blank' href='https://www.arcgis.com/home/item.html?id=58a541efc59545e6b7137f961d7de883' rel='nofollow ugc noopener noreferrer'>Terrain</a>,<a target='_blank' href='https://www.arcgis.com/home/item.html?id=c753e5bfadb54d46b69c3e68922483bc' rel='nofollow ugc noopener noreferrer'>TopoBathy</a>) and tiled (<a target='_blank' href='https://www.arcgis.com/home/item.html?id=7029fb60158543ad845c7e1527af11e4' rel='nofollow ugc noopener noreferrer'>Terrain 3D</a>, <a target='_blank' href='https://www.arcgis.com/home/item.html?id=0c69ba5a5d254118841d43f03aa3e97d' rel='nofollow ugc noopener noreferrer'>TopoBathy 3D</a>, <a target='_blank' href='https://www.arcgis.com/home/item.html?id=1b243539f4514b6ba35e7d995890db1d' rel='nofollow ugc noopener noreferrer'>World Hillshade</a>, <a target='_blank' href='https://www.arcgis.com/home/item.html?id=428539ef9cab4017b69d15a40a9ee98b' rel='nofollow ugc noopener noreferrer'>World Hillshade (Dark)</a>) services.</p><p style='margin-bottom:12.0pt; margin-right:0in; margin-top:12.0pt;'>The tiled services (<a target='_blank' href='https://www.arcgis.com/home/item.html?id=7029fb60158543ad845c7e1527af11e4' rel='nofollow ugc noopener noreferrer'>Terrain 3D</a>,<a target='_blank' href='https://www.arcgis.com/home/item.html?id=0c69ba5a5d254118841d43f03aa3e97d' rel='nofollow ugc noopener noreferrer'> TopoBathy 3D</a>, <a target='_blank' href='https://www.arcgis.com/home/item.html?id=1b243539f4514b6ba35e7d995890db1d' rel='nofollow ugc noopener noreferrer'>World Hillshade</a>, <a target='_blank' href='https://www.arcgis.com/home/item.html?id=428539ef9cab4017b69d15a40a9ee98b' rel='nofollow ugc noopener noreferrer'>World Hillshade (Dark)</a>) also include an additional data source from <a target='_blank' href='https://www.arcgis.com/apps/mapviewer/index.html?webmap=2daa50a1091b4395925e816a8bb05ae0' rel='nofollow ugc noopener noreferrer'>Vantor's Precision3D</a> covering parts of the globe.</p><p style='margin-bottom:12.0pt; margin-right:0in; margin-top:12.0pt;'><strong>Note: </strong><a target='_blank' href='https://developers.arcgis.com/rest/elevation/' rel='nofollow ugc noopener noreferrer'>ArcGIS Elevation service</a>, <a target='_blank' href='https://www.arcgis.com/home/item.html?id=09ae40dd6766478bb7de3c557c1421cb' rel='nofollow ugc noopener noreferrer'>Terrain 3D (for Export)</a> and <a target='_blank' href='https://www.arcgis.com/home/item.html?id=2ed76fcfac0a405e821aca0568ab41cd' rel='nofollow ugc noopener noreferrer'>TopoBathy 3D (for Export)</a> does not include Vantor Precision3D and Airbus WorldDEM4Ortho.</p><p style='line-height:115%; margin-bottom:8.0pt;'>To view the all the sources in a table format, check out <a target='_blank' href='https://www.arcgis.com/home/item.html?id=a183c04c3d9f40349ca87b555efb3180' rel='nofollow ugc noopener noreferrer'>World Elevation Data Sources Table</a>.</p><p style='margin-bottom:12.0pt; margin-right:0in; margin-top:12.0pt;'>Topography sources listed in the table are part of <a target='_blank' href='https://www.arcgis.com/home/item.html?id=58a541efc59545e6b7137f961d7de883' rel='nofollow ugc noopener noreferrer'>Terrain</a>, <a target='_blank' href='https://www.arcgis.com/home/item.html?id=c753e5bfadb54d46b69c3e68922483bc' rel='nofollow ugc noopener noreferrer'>TopoBathy</a>, <a target='_blank' href='https://www.arcgis.com/home/item.html?id=7029fb60158543ad845c7e1527af11e4' rel='nofollow ugc noopener noreferrer'>Terrain 3D</a>, <a target='_blank' href='https://www.arcgis.com/home/item.html?id=0c69ba5a5d254118841d43f03aa3e97d' rel='nofollow ugc noopener noreferrer'>TopoBathy 3D</a>, <a target='_blank' href='https://www.arcgis.com/home/item.html?id=1b243539f4514b6ba35e7d995890db1d' rel='nofollow ugc noopener noreferrer'>World Hillshade</a> and <a target='_blank' href='https://www.arcgis.com/home/item.html?id=428539ef9cab4017b69d15a40a9ee98b' rel='nofollow ugc noopener noreferrer'>World Hillshade (Dark)</a>, while bathymetry sources are part of <a target='_blank' href='https://www.arcgis.com/home/item.html?id=c753e5bfadb54d46b69c3e68922483bc' rel='nofollow ugc noopener noreferrer'>TopoBathy</a> and <a target='_blank' href='https://www.arcgis.com/home/item.html?id=0c69ba5a5d254118841d43f03aa3e97d' rel='nofollow ugc noopener noreferrer'>TopoBathy 3D</a> only.</p><p style='line-height:18.0pt;'>Check out <a target='_blank' href='https://www.arcgis.com/home/group.html?id=bbc5f50839094e9d8dc5255b6a7783dd#overview' rel='nofollow ugc noopener noreferrer'>elevation layers</a>&nbsp;group for all the elevation content available to ArcGIS users.</p><p><span style='font-size:14px;'><strong>Disclaimer</strong>: Data sources are not to be used for navigation/safety at sea and in air.</span></p></div><div><p style='margin-bottom:12.0pt; margin-right:0in; margin-top:12.0pt;'>&nbsp;</p></div>",
			"keyword": [
				"NED",
				"SRTM",
				"GMTED",
				"EGM2008",
				"DEM",
				"land",
				"topography",
				"bathymetry",
				"ocean",
				"coverage map",
				"hillshade",
				"slope",
				"aspect",
				"elevation",
				"esri_elevation",
				"landscape",
				"world_elevation",
				"world elevation",
				"multidirectional",
				"multi-directional",
				"DTM",
				"WorldDEM"
			],
			"issued": "2014-04-10T22:42:00.000Z",
			"modified": "2026-10-29T15:43:27.000Z",
			"publisher": {
				"name": "Esri"
			},
			"contactPoint": {
				"@type": "vcard:Contact",
				"fn": "esri",
				"hasEmail": "{{orgContactEmail}}"
			},
			"accessLevel": "public",
			"spatial": "-180.0000,-89.0000,180.0000,89.0000",
			"license": "<img alt='' src='https://downloads.esri.com/blogs/arcgisonline/esrilogo_new.png' /> This work is licensed under the Esri Master License Agreement.<br /><div><a href='https://goto.arcgis.com/termsofuse/viewsummary' target='_blank' rel='nofollow ugc noopener noreferrer'><b>View Summary</b></a> | <a href='https://goto.arcgis.com/termsofuse/viewtermsofuse' target='_blank' rel='nofollow ugc noopener noreferrer'><b>View Terms of Use</b></a></div>",
			"distribution": [
				{
					"@type": "dcat:Distribution",
					"title": "ArcGIS Hub Dataset",
					"format": "Web Page",
					"mediaType": "text/html",
					"accessURL": "https://www.pacificgeoportal.com/datasets/esri::10m-1"
				},
				{
					"@type": "dcat:Distribution",
					"title": "ArcGIS GeoService",
					"format": "ArcGIS GeoServices REST API",
					"mediaType": "application/json",
					"accessURL": "https://elevation.arcgis.com/arcgis/rest/services/WorldElevation/DataExtents/MapServer/2"
				},
				{
					"@type": "dcat:Distribution",
					"title": "CSV",
					"format": "CSV",
					"mediaType": "text/csv",
					"accessURL": "https://www.pacificgeoportal.com/api/download/v1/items/3af669838f594b378f90c10f98e46a7f/csv?layers=2"
				},
				{
					"@type": "dcat:Distribution",
					"title": "Shapefile",
					"format": "ZIP",
					"mediaType": "application/zip",
					"accessURL": "https://www.pacificgeoportal.com/api/download/v1/items/3af669838f594b378f90c10f98e46a7f/shapefile?layers=2"
				},
				{
					"@type": "dcat:Distribution",
					"title": "GeoJSON",
					"format": "GeoJSON",
					"mediaType": "application/vnd.geo+json",
					"accessURL": "https://www.pacificgeoportal.com/api/download/v1/items/3af669838f594b378f90c10f98e46a7f/geojson?layers=2"
				},
				{
					"@type": "dcat:Distribution",
					"title": "KML",
					"format": "KML",
					"mediaType": "application/vnd.google-earth.kml+xml",
					"accessURL": "https://www.pacificgeoportal.com/api/download/v1/items/3af669838f594b378f90c10f98e46a7f/kml?layers=2"
				}
			],
			"theme": [
				"geospatial"
			]
		},
		{
			"@type": "dcat:Dataset",
			"identifier": "https://www.arcgis.com/home/item.html?id=3af669838f594b378f90c10f98e46a7f&sublayer=3",
			"landingPage": "https://www.pacificgeoportal.com/datasets/esri::25m-1",
			"title": "25m",
			"description": "<div><p style='margin-bottom:12.0pt; margin-right:0in; margin-top:12.0pt;'>World Elevation layers are compiled from many authoritative data providers, and are updated quarterly. This map shows the extent of the various datasets comprising the World Elevation dynamic (<a target='_blank' href='https://www.arcgis.com/home/item.html?id=58a541efc59545e6b7137f961d7de883' rel='nofollow ugc noopener noreferrer'>Terrain</a>,<a target='_blank' href='https://www.arcgis.com/home/item.html?id=c753e5bfadb54d46b69c3e68922483bc' rel='nofollow ugc noopener noreferrer'>TopoBathy</a>) and tiled (<a target='_blank' href='https://www.arcgis.com/home/item.html?id=7029fb60158543ad845c7e1527af11e4' rel='nofollow ugc noopener noreferrer'>Terrain 3D</a>, <a target='_blank' href='https://www.arcgis.com/home/item.html?id=0c69ba5a5d254118841d43f03aa3e97d' rel='nofollow ugc noopener noreferrer'>TopoBathy 3D</a>, <a target='_blank' href='https://www.arcgis.com/home/item.html?id=1b243539f4514b6ba35e7d995890db1d' rel='nofollow ugc noopener noreferrer'>World Hillshade</a>, <a target='_blank' href='https://www.arcgis.com/home/item.html?id=428539ef9cab4017b69d15a40a9ee98b' rel='nofollow ugc noopener noreferrer'>World Hillshade (Dark)</a>) services.</p><p style='margin-bottom:12.0pt; margin-right:0in; margin-top:12.0pt;'>The tiled services (<a target='_blank' href='https://www.arcgis.com/home/item.html?id=7029fb60158543ad845c7e1527af11e4' rel='nofollow ugc noopener noreferrer'>Terrain 3D</a>,<a target='_blank' href='https://www.arcgis.com/home/item.html?id=0c69ba5a5d254118841d43f03aa3e97d' rel='nofollow ugc noopener noreferrer'> TopoBathy 3D</a>, <a target='_blank' href='https://www.arcgis.com/home/item.html?id=1b243539f4514b6ba35e7d995890db1d' rel='nofollow ugc noopener noreferrer'>World Hillshade</a>, <a target='_blank' href='https://www.arcgis.com/home/item.html?id=428539ef9cab4017b69d15a40a9ee98b' rel='nofollow ugc noopener noreferrer'>World Hillshade (Dark)</a>) also include an additional data source from <a target='_blank' href='https://www.arcgis.com/apps/mapviewer/index.html?webmap=2daa50a1091b4395925e816a8bb05ae0' rel='nofollow ugc noopener noreferrer'>Vantor's Precision3D</a> covering parts of the globe.</p><p style='margin-bottom:12.0pt; margin-right:0in; margin-top:12.0pt;'><strong>Note: </strong><a target='_blank' href='https://developers.arcgis.com/rest/elevation/' rel='nofollow ugc noopener noreferrer'>ArcGIS Elevation service</a>, <a target='_blank' href='https://www.arcgis.com/home/item.html?id=09ae40dd6766478bb7de3c557c1421cb' rel='nofollow ugc noopener noreferrer'>Terrain 3D (for Export)</a> and <a target='_blank' href='https://www.arcgis.com/home/item.html?id=2ed76fcfac0a405e821aca0568ab41cd' rel='nofollow ugc noopener noreferrer'>TopoBathy 3D (for Export)</a> does not include Vantor Precision3D and Airbus WorldDEM4Ortho.</p><p style='line-height:115%; margin-bottom:8.0pt;'>To view the all the sources in a table format, check out <a target='_blank' href='https://www.arcgis.com/home/item.html?id=a183c04c3d9f40349ca87b555efb3180' rel='nofollow ugc noopener noreferrer'>World Elevation Data Sources Table</a>.</p><p style='margin-bottom:12.0pt; margin-right:0in; margin-top:12.0pt;'>Topography sources listed in the table are part of <a target='_blank' href='https://www.arcgis.com/home/item.html?id=58a541efc59545e6b7137f961d7de883' rel='nofollow ugc noopener noreferrer'>Terrain</a>, <a target='_blank' href='https://www.arcgis.com/home/item.html?id=c753e5bfadb54d46b69c3e68922483bc' rel='nofollow ugc noopener noreferrer'>TopoBathy</a>, <a target='_blank' href='https://www.arcgis.com/home/item.html?id=7029fb60158543ad845c7e1527af11e4' rel='nofollow ugc noopener noreferrer'>Terrain 3D</a>, <a target='_blank' href='https://www.arcgis.com/home/item.html?id=0c69ba5a5d254118841d43f03aa3e97d' rel='nofollow ugc noopener noreferrer'>TopoBathy 3D</a>, <a target='_blank' href='https://www.arcgis.com/home/item.html?id=1b243539f4514b6ba35e7d995890db1d' rel='nofollow ugc noopener noreferrer'>World Hillshade</a> and <a target='_blank' href='https://www.arcgis.com/home/item.html?id=428539ef9cab4017b69d15a40a9ee98b' rel='nofollow ugc noopener noreferrer'>World Hillshade (Dark)</a>, while bathymetry sources are part of <a target='_blank' href='https://www.arcgis.com/home/item.html?id=c753e5bfadb54d46b69c3e68922483bc' rel='nofollow ugc noopener noreferrer'>TopoBathy</a> and <a target='_blank' href='https://www.arcgis.com/home/item.html?id=0c69ba5a5d254118841d43f03aa3e97d' rel='nofollow ugc noopener noreferrer'>TopoBathy 3D</a> only.</p><p style='line-height:18.0pt;'>Check out <a target='_blank' href='https://www.arcgis.com/home/group.html?id=bbc5f50839094e9d8dc5255b6a7783dd#overview' rel='nofollow ugc noopener noreferrer'>elevation layers</a>&nbsp;group for all the elevation content available to ArcGIS users.</p><p><span style='font-size:14px;'><strong>Disclaimer</strong>: Data sources are not to be used for navigation/safety at sea and in air.</span></p></div><div><p style='margin-bottom:12.0pt; margin-right:0in; margin-top:12.0pt;'>&nbsp;</p></div>",
			"keyword": [
				"NED",
				"SRTM",
				"GMTED",
				"EGM2008",
				"DEM",
				"land",
				"topography",
				"bathymetry",
				"ocean",
				"coverage map",
				"hillshade",
				"slope",
				"aspect",
				"elevation",
				"esri_elevation",
				"landscape",
				"world_elevation",
				"world elevation",
				"multidirectional",
				"multi-directional",
				"DTM",
				"WorldDEM"
			],
			"issued": "2014-04-10T22:42:00.000Z",
			"modified": "2026-10-29T15:43:27.000Z",
			"publisher": {
				"name": "Esri"
			},
			"contactPoint": {
				"@type": "vcard:Contact",
				"fn": "esri",
				"hasEmail": "{{orgContactEmail}}"
			},
			"accessLevel": "public",
			"spatial": "-180.0000,-89.0000,180.0000,89.0000",
			"license": "<img alt='' src='https://downloads.esri.com/blogs/arcgisonline/esrilogo_new.png' /> This work is licensed under the Esri Master License Agreement.<br /><div><a href='https://goto.arcgis.com/termsofuse/viewsummary' target='_blank' rel='nofollow ugc noopener noreferrer'><b>View Summary</b></a> | <a href='https://goto.arcgis.com/termsofuse/viewtermsofuse' target='_blank' rel='nofollow ugc noopener noreferrer'><b>View Terms of Use</b></a></div>",
			"distribution": [
				{
					"@type": "dcat:Distribution",
					"title": "ArcGIS Hub Dataset",
					"format": "Web Page",
					"mediaType": "text/html",
					"accessURL": "https://www.pacificgeoportal.com/datasets/esri::25m-1"
				},
				{
					"@type": "dcat:Distribution",
					"title": "ArcGIS GeoService",
					"format": "ArcGIS GeoServices REST API",
					"mediaType": "application/json",
					"accessURL": "https://elevation.arcgis.com/arcgis/rest/services/WorldElevation/DataExtents/MapServer/3"
				},
				{
					"@type": "dcat:Distribution",
					"title": "CSV",
					"format": "CSV",
					"mediaType": "text/csv",
					"accessURL": "https://www.pacificgeoportal.com/api/download/v1/items/3af669838f594b378f90c10f98e46a7f/csv?layers=3"
				},
				{
					"@type": "dcat:Distribution",
					"title": "Shapefile",
					"format": "ZIP",
					"mediaType": "application/zip",
					"accessURL": "https://www.pacificgeoportal.com/api/download/v1/items/3af669838f594b378f90c10f98e46a7f/shapefile?layers=3"
				},
				{
					"@type": "dcat:Distribution",
					"title": "GeoJSON",
					"format": "GeoJSON",
					"mediaType": "application/vnd.geo+json",
					"accessURL": "https://www.pacificgeoportal.com/api/download/v1/items/3af669838f594b378f90c10f98e46a7f/geojson?layers=3"
				},
				{
					"@type": "dcat:Distribution",
					"title": "KML",
					"format": "KML",
					"mediaType": "application/vnd.google-earth.kml+xml",
					"accessURL": "https://www.pacificgeoportal.com/api/download/v1/items/3af669838f594b378f90c10f98e46a7f/kml?layers=3"
				}
			],
			"theme": [
				"geospatial"
			]
		},
		{
			"@type": "dcat:Dataset",
			"identifier": "https://www.arcgis.com/home/item.html?id=3af669838f594b378f90c10f98e46a7f&sublayer=4",
			"landingPage": "https://www.pacificgeoportal.com/datasets/esri::30m-1",
			"title": "30m",
			"description": "<div><p style='margin-bottom:12.0pt; margin-right:0in; margin-top:12.0pt;'>World Elevation layers are compiled from many authoritative data providers, and are updated quarterly. This map shows the extent of the various datasets comprising the World Elevation dynamic (<a target='_blank' href='https://www.arcgis.com/home/item.html?id=58a541efc59545e6b7137f961d7de883' rel='nofollow ugc noopener noreferrer'>Terrain</a>,<a target='_blank' href='https://www.arcgis.com/home/item.html?id=c753e5bfadb54d46b69c3e68922483bc' rel='nofollow ugc noopener noreferrer'>TopoBathy</a>) and tiled (<a target='_blank' href='https://www.arcgis.com/home/item.html?id=7029fb60158543ad845c7e1527af11e4' rel='nofollow ugc noopener noreferrer'>Terrain 3D</a>, <a target='_blank' href='https://www.arcgis.com/home/item.html?id=0c69ba5a5d254118841d43f03aa3e97d' rel='nofollow ugc noopener noreferrer'>TopoBathy 3D</a>, <a target='_blank' href='https://www.arcgis.com/home/item.html?id=1b243539f4514b6ba35e7d995890db1d' rel='nofollow ugc noopener noreferrer'>World Hillshade</a>, <a target='_blank' href='https://www.arcgis.com/home/item.html?id=428539ef9cab4017b69d15a40a9ee98b' rel='nofollow ugc noopener noreferrer'>World Hillshade (Dark)</a>) services.</p><p style='margin-bottom:12.0pt; margin-right:0in; margin-top:12.0pt;'>The tiled services (<a target='_blank' href='https://www.arcgis.com/home/item.html?id=7029fb60158543ad845c7e1527af11e4' rel='nofollow ugc noopener noreferrer'>Terrain 3D</a>,<a target='_blank' href='https://www.arcgis.com/home/item.html?id=0c69ba5a5d254118841d43f03aa3e97d' rel='nofollow ugc noopener noreferrer'> TopoBathy 3D</a>, <a target='_blank' href='https://www.arcgis.com/home/item.html?id=1b243539f4514b6ba35e7d995890db1d' rel='nofollow ugc noopener noreferrer'>World Hillshade</a>, <a target='_blank' href='https://www.arcgis.com/home/item.html?id=428539ef9cab4017b69d15a40a9ee98b' rel='nofollow ugc noopener noreferrer'>World Hillshade (Dark)</a>) also include an additional data source from <a target='_blank' href='https://www.arcgis.com/apps/mapviewer/index.html?webmap=2daa50a1091b4395925e816a8bb05ae0' rel='nofollow ugc noopener noreferrer'>Vantor's Precision3D</a> covering parts of the globe.</p><p style='margin-bottom:12.0pt; margin-right:0in; margin-top:12.0pt;'><strong>Note: </strong><a target='_blank' href='https://developers.arcgis.com/rest/elevation/' rel='nofollow ugc noopener noreferrer'>ArcGIS Elevation service</a>, <a target='_blank' href='https://www.arcgis.com/home/item.html?id=09ae40dd6766478bb7de3c557c1421cb' rel='nofollow ugc noopener noreferrer'>Terrain 3D (for Export)</a> and <a target='_blank' href='https://www.arcgis.com/home/item.html?id=2ed76fcfac0a405e821aca0568ab41cd' rel='nofollow ugc noopener noreferrer'>TopoBathy 3D (for Export)</a> does not include Vantor Precision3D and Airbus WorldDEM4Ortho.</p><p style='line-height:115%; margin-bottom:8.0pt;'>To view the all the sources in a table format, check out <a target='_blank' href='https://www.arcgis.com/home/item.html?id=a183c04c3d9f40349ca87b555efb3180' rel='nofollow ugc noopener noreferrer'>World Elevation Data Sources Table</a>.</p><p style='margin-bottom:12.0pt; margin-right:0in; margin-top:12.0pt;'>Topography sources listed in the table are part of <a target='_blank' href='https://www.arcgis.com/home/item.html?id=58a541efc59545e6b7137f961d7de883' rel='nofollow ugc noopener noreferrer'>Terrain</a>, <a target='_blank' href='https://www.arcgis.com/home/item.html?id=c753e5bfadb54d46b69c3e68922483bc' rel='nofollow ugc noopener noreferrer'>TopoBathy</a>, <a target='_blank' href='https://www.arcgis.com/home/item.html?id=7029fb60158543ad845c7e1527af11e4' rel='nofollow ugc noopener noreferrer'>Terrain 3D</a>, <a target='_blank' href='https://www.arcgis.com/home/item.html?id=0c69ba5a5d254118841d43f03aa3e97d' rel='nofollow ugc noopener noreferrer'>TopoBathy 3D</a>, <a target='_blank' href='https://www.arcgis.com/home/item.html?id=1b243539f4514b6ba35e7d995890db1d' rel='nofollow ugc noopener noreferrer'>World Hillshade</a> and <a target='_blank' href='https://www.arcgis.com/home/item.html?id=428539ef9cab4017b69d15a40a9ee98b' rel='nofollow ugc noopener noreferrer'>World Hillshade (Dark)</a>, while bathymetry sources are part of <a target='_blank' href='https://www.arcgis.com/home/item.html?id=c753e5bfadb54d46b69c3e68922483bc' rel='nofollow ugc noopener noreferrer'>TopoBathy</a> and <a target='_blank' href='https://www.arcgis.com/home/item.html?id=0c69ba5a5d254118841d43f03aa3e97d' rel='nofollow ugc noopener noreferrer'>TopoBathy 3D</a> only.</p><p style='line-height:18.0pt;'>Check out <a target='_blank' href='https://www.arcgis.com/home/group.html?id=bbc5f50839094e9d8dc5255b6a7783dd#overview' rel='nofollow ugc noopener noreferrer'>elevation layers</a>&nbsp;group for all the elevation content available to ArcGIS users.</p><p><span style='font-size:14px;'><strong>Disclaimer</strong>: Data sources are not to be used for navigation/safety at sea and in air.</span></p></div><div><p style='margin-bottom:12.0pt; margin-right:0in; margin-top:12.0pt;'>&nbsp;</p></div>",
			"keyword": [
				"NED",
				"SRTM",
				"GMTED",
				"EGM2008",
				"DEM",
				"land",
				"topography",
				"bathymetry",
				"ocean",
				"coverage map",
				"hillshade",
				"slope",
				"aspect",
				"elevation",
				"esri_elevation",
				"landscape",
				"world_elevation",
				"world elevation",
				"multidirectional",
				"multi-directional",
				"DTM",
				"WorldDEM"
			],
			"issued": "2014-04-10T22:42:00.000Z",
			"modified": "2026-10-29T15:43:27.000Z",
			"publisher": {
				"name": "Esri"
			},
			"contactPoint": {
				"@type": "vcard:Contact",
				"fn": "esri",
				"hasEmail": "{{orgContactEmail}}"
			},
			"accessLevel": "public",
			"spatial": "-180.0000,-89.0000,180.0000,89.0000",
			"license": "<img alt='' src='https://downloads.esri.com/blogs/arcgisonline/esrilogo_new.png' /> This work is licensed under the Esri Master License Agreement.<br /><div><a href='https://goto.arcgis.com/termsofuse/viewsummary' target='_blank' rel='nofollow ugc noopener noreferrer'><b>View Summary</b></a> | <a href='https://goto.arcgis.com/termsofuse/viewtermsofuse' target='_blank' rel='nofollow ugc noopener noreferrer'><b>View Terms of Use</b></a></div>",
			"distribution": [
				{
					"@type": "dcat:Distribution",
					"title": "ArcGIS Hub Dataset",
					"format": "Web Page",
					"mediaType": "text/html",
					"accessURL": "https://www.pacificgeoportal.com/datasets/esri::30m-1"
				},
				{
					"@type": "dcat:Distribution",
					"title": "ArcGIS GeoService",
					"format": "ArcGIS GeoServices REST API",
					"mediaType": "application/json",
					"accessURL": "https://elevation.arcgis.com/arcgis/rest/services/WorldElevation/DataExtents/MapServer/4"
				},
				{
					"@type": "dcat:Distribution",
					"title": "CSV",
					"format": "CSV",
					"mediaType": "text/csv",
					"accessURL": "https://www.pacificgeoportal.com/api/download/v1/items/3af669838f594b378f90c10f98e46a7f/csv?layers=4"
				},
				{
					"@type": "dcat:Distribution",
					"title": "Shapefile",
					"format": "ZIP",
					"mediaType": "application/zip",
					"accessURL": "https://www.pacificgeoportal.com/api/download/v1/items/3af669838f594b378f90c10f98e46a7f/shapefile?layers=4"
				},
				{
					"@type": "dcat:Distribution",
					"title": "GeoJSON",
					"format": "GeoJSON",
					"mediaType": "application/vnd.geo+json",
					"accessURL": "https://www.pacificgeoportal.com/api/download/v1/items/3af669838f594b378f90c10f98e46a7f/geojson?layers=4"
				},
				{
					"@type": "dcat:Distribution",
					"title": "KML",
					"format": "KML",
					"mediaType": "application/vnd.google-earth.kml+xml",
					"accessURL": "https://www.pacificgeoportal.com/api/download/v1/items/3af669838f594b378f90c10f98e46a7f/kml?layers=4"
				}
			],
			"theme": [
				"geospatial"
			]
		},
		{
			"@type": "dcat:Dataset",
			"identifier": "https://www.arcgis.com/home/item.html?id=3af669838f594b378f90c10f98e46a7f&sublayer=5",
			"landingPage": "https://www.pacificgeoportal.com/datasets/esri::50-60m-1",
			"title": "50-60m",
			"description": "<div><p style='margin-bottom:12.0pt; margin-right:0in; margin-top:12.0pt;'>World Elevation layers are compiled from many authoritative data providers, and are updated quarterly. This map shows the extent of the various datasets comprising the World Elevation dynamic (<a target='_blank' href='https://www.arcgis.com/home/item.html?id=58a541efc59545e6b7137f961d7de883' rel='nofollow ugc noopener noreferrer'>Terrain</a>,<a target='_blank' href='https://www.arcgis.com/home/item.html?id=c753e5bfadb54d46b69c3e68922483bc' rel='nofollow ugc noopener noreferrer'>TopoBathy</a>) and tiled (<a target='_blank' href='https://www.arcgis.com/home/item.html?id=7029fb60158543ad845c7e1527af11e4' rel='nofollow ugc noopener noreferrer'>Terrain 3D</a>, <a target='_blank' href='https://www.arcgis.com/home/item.html?id=0c69ba5a5d254118841d43f03aa3e97d' rel='nofollow ugc noopener noreferrer'>TopoBathy 3D</a>, <a target='_blank' href='https://www.arcgis.com/home/item.html?id=1b243539f4514b6ba35e7d995890db1d' rel='nofollow ugc noopener noreferrer'>World Hillshade</a>, <a target='_blank' href='https://www.arcgis.com/home/item.html?id=428539ef9cab4017b69d15a40a9ee98b' rel='nofollow ugc noopener noreferrer'>World Hillshade (Dark)</a>) services.</p><p style='margin-bottom:12.0pt; margin-right:0in; margin-top:12.0pt;'>The tiled services (<a target='_blank' href='https://www.arcgis.com/home/item.html?id=7029fb60158543ad845c7e1527af11e4' rel='nofollow ugc noopener noreferrer'>Terrain 3D</a>,<a target='_blank' href='https://www.arcgis.com/home/item.html?id=0c69ba5a5d254118841d43f03aa3e97d' rel='nofollow ugc noopener noreferrer'> TopoBathy 3D</a>, <a target='_blank' href='https://www.arcgis.com/home/item.html?id=1b243539f4514b6ba35e7d995890db1d' rel='nofollow ugc noopener noreferrer'>World Hillshade</a>, <a target='_blank' href='https://www.arcgis.com/home/item.html?id=428539ef9cab4017b69d15a40a9ee98b' rel='nofollow ugc noopener noreferrer'>World Hillshade (Dark)</a>) also include an additional data source from <a target='_blank' href='https://www.arcgis.com/apps/mapviewer/index.html?webmap=2daa50a1091b4395925e816a8bb05ae0' rel='nofollow ugc noopener noreferrer'>Vantor's Precision3D</a> covering parts of the globe.</p><p style='margin-bottom:12.0pt; margin-right:0in; margin-top:12.0pt;'><strong>Note: </strong><a target='_blank' href='https://developers.arcgis.com/rest/elevation/' rel='nofollow ugc noopener noreferrer'>ArcGIS Elevation service</a>, <a target='_blank' href='https://www.arcgis.com/home/item.html?id=09ae40dd6766478bb7de3c557c1421cb' rel='nofollow ugc noopener noreferrer'>Terrain 3D (for Export)</a> and <a target='_blank' href='https://www.arcgis.com/home/item.html?id=2ed76fcfac0a405e821aca0568ab41cd' rel='nofollow ugc noopener noreferrer'>TopoBathy 3D (for Export)</a> does not include Vantor Precision3D and Airbus WorldDEM4Ortho.</p><p style='line-height:115%; margin-bottom:8.0pt;'>To view the all the sources in a table format, check out <a target='_blank' href='https://www.arcgis.com/home/item.html?id=a183c04c3d9f40349ca87b555efb3180' rel='nofollow ugc noopener noreferrer'>World Elevation Data Sources Table</a>.</p><p style='margin-bottom:12.0pt; margin-right:0in; margin-top:12.0pt;'>Topography sources listed in the table are part of <a target='_blank' href='https://www.arcgis.com/home/item.html?id=58a541efc59545e6b7137f961d7de883' rel='nofollow ugc noopener noreferrer'>Terrain</a>, <a target='_blank' href='https://www.arcgis.com/home/item.html?id=c753e5bfadb54d46b69c3e68922483bc' rel='nofollow ugc noopener noreferrer'>TopoBathy</a>, <a target='_blank' href='https://www.arcgis.com/home/item.html?id=7029fb60158543ad845c7e1527af11e4' rel='nofollow ugc noopener noreferrer'>Terrain 3D</a>, <a target='_blank' href='https://www.arcgis.com/home/item.html?id=0c69ba5a5d254118841d43f03aa3e97d' rel='nofollow ugc noopener noreferrer'>TopoBathy 3D</a>, <a target='_blank' href='https://www.arcgis.com/home/item.html?id=1b243539f4514b6ba35e7d995890db1d' rel='nofollow ugc noopener noreferrer'>World Hillshade</a> and <a target='_blank' href='https://www.arcgis.com/home/item.html?id=428539ef9cab4017b69d15a40a9ee98b' rel='nofollow ugc noopener noreferrer'>World Hillshade (Dark)</a>, while bathymetry sources are part of <a target='_blank' href='https://www.arcgis.com/home/item.html?id=c753e5bfadb54d46b69c3e68922483bc' rel='nofollow ugc noopener noreferrer'>TopoBathy</a> and <a target='_blank' href='https://www.arcgis.com/home/item.html?id=0c69ba5a5d254118841d43f03aa3e97d' rel='nofollow ugc noopener noreferrer'>TopoBathy 3D</a> only.</p><p style='line-height:18.0pt;'>Check out <a target='_blank' href='https://www.arcgis.com/home/group.html?id=bbc5f50839094e9d8dc5255b6a7783dd#overview' rel='nofollow ugc noopener noreferrer'>elevation layers</a>&nbsp;group for all the elevation content available to ArcGIS users.</p><p><span style='font-size:14px;'><strong>Disclaimer</strong>: Data sources are not to be used for navigation/safety at sea and in air.</span></p></div><div><p style='margin-bottom:12.0pt; margin-right:0in; margin-top:12.0pt;'>&nbsp;</p></div>",
			"keyword": [
				"NED",
				"SRTM",
				"GMTED",
				"EGM2008",
				"DEM",
				"land",
				"topography",
				"bathymetry",
				"ocean",
				"coverage map",
				"hillshade",
				"slope",
				"aspect",
				"elevation",
				"esri_elevation",
				"landscape",
				"world_elevation",
				"world elevation",
				"multidirectional",
				"multi-directional",
				"DTM",
				"WorldDEM"
			],
			"issued": "2014-04-10T22:42:00.000Z",
			"modified": "2026-10-29T15:43:27.000Z",
			"publisher": {
				"name": "Esri"
			},
			"contactPoint": {
				"@type": "vcard:Contact",
				"fn": "esri",
				"hasEmail": "{{orgContactEmail}}"
			},
			"accessLevel": "public",
			"spatial": "-180.0000,-89.0000,180.0000,89.0000",
			"license": "<img alt='' src='https://downloads.esri.com/blogs/arcgisonline/esrilogo_new.png' /> This work is licensed under the Esri Master License Agreement.<br /><div><a href='https://goto.arcgis.com/termsofuse/viewsummary' target='_blank' rel='nofollow ugc noopener noreferrer'><b>View Summary</b></a> | <a href='https://goto.arcgis.com/termsofuse/viewtermsofuse' target='_blank' rel='nofollow ugc noopener noreferrer'><b>View Terms of Use</b></a></div>",
			"distribution": [
				{
					"@type": "dcat:Distribution",
					"title": "ArcGIS Hub Dataset",
					"format": "Web Page",
					"mediaType": "text/html",
					"accessURL": "https://www.pacificgeoportal.com/datasets/esri::50-60m-1"
				},
				{
					"@type": "dcat:Distribution",
					"title": "ArcGIS GeoService",
					"format": "ArcGIS GeoServices REST API",
					"mediaType": "application/json",
					"accessURL": "https://elevation.arcgis.com/arcgis/rest/services/WorldElevation/DataExtents/MapServer/5"
				},
				{
					"@type": "dcat:Distribution",
					"title": "CSV",
					"format": "CSV",
					"mediaType": "text/csv",
					"accessURL": "https://www.pacificgeoportal.com/api/download/v1/items/3af669838f594b378f90c10f98e46a7f/csv?layers=5"
				},
				{
					"@type": "dcat:Distribution",
					"title": "Shapefile",
					"format": "ZIP",
					"mediaType": "application/zip",
					"accessURL": "https://www.pacificgeoportal.com/api/download/v1/items/3af669838f594b378f90c10f98e46a7f/shapefile?layers=5"
				},
				{
					"@type": "dcat:Distribution",
					"title": "GeoJSON",
					"format": "GeoJSON",
					"mediaType": "application/vnd.geo+json",
					"accessURL": "https://www.pacificgeoportal.com/api/download/v1/items/3af669838f594b378f90c10f98e46a7f/geojson?layers=5"
				},
				{
					"@type": "dcat:Distribution",
					"title": "KML",
					"format": "KML",
					"mediaType": "application/vnd.google-earth.kml+xml",
					"accessURL": "https://www.pacificgeoportal.com/api/download/v1/items/3af669838f594b378f90c10f98e46a7f/kml?layers=5"
				}
			],
			"theme": [
				"geospatial"
			]
		},
		{
			"@type": "dcat:Dataset",
			"identifier": "https://www.arcgis.com/home/item.html?id=3af669838f594b378f90c10f98e46a7f&sublayer=6",
			"landingPage": "https://www.pacificgeoportal.com/datasets/esri::90m-1",
			"title": "90m",
			"description": "<div><p style='margin-bottom:12.0pt; margin-right:0in; margin-top:12.0pt;'>World Elevation layers are compiled from many authoritative data providers, and are updated quarterly. This map shows the extent of the various datasets comprising the World Elevation dynamic (<a target='_blank' href='https://www.arcgis.com/home/item.html?id=58a541efc59545e6b7137f961d7de883' rel='nofollow ugc noopener noreferrer'>Terrain</a>,<a target='_blank' href='https://www.arcgis.com/home/item.html?id=c753e5bfadb54d46b69c3e68922483bc' rel='nofollow ugc noopener noreferrer'>TopoBathy</a>) and tiled (<a target='_blank' href='https://www.arcgis.com/home/item.html?id=7029fb60158543ad845c7e1527af11e4' rel='nofollow ugc noopener noreferrer'>Terrain 3D</a>, <a target='_blank' href='https://www.arcgis.com/home/item.html?id=0c69ba5a5d254118841d43f03aa3e97d' rel='nofollow ugc noopener noreferrer'>TopoBathy 3D</a>, <a target='_blank' href='https://www.arcgis.com/home/item.html?id=1b243539f4514b6ba35e7d995890db1d' rel='nofollow ugc noopener noreferrer'>World Hillshade</a>, <a target='_blank' href='https://www.arcgis.com/home/item.html?id=428539ef9cab4017b69d15a40a9ee98b' rel='nofollow ugc noopener noreferrer'>World Hillshade (Dark)</a>) services.</p><p style='margin-bottom:12.0pt; margin-right:0in; margin-top:12.0pt;'>The tiled services (<a target='_blank' href='https://www.arcgis.com/home/item.html?id=7029fb60158543ad845c7e1527af11e4' rel='nofollow ugc noopener noreferrer'>Terrain 3D</a>,<a target='_blank' href='https://www.arcgis.com/home/item.html?id=0c69ba5a5d254118841d43f03aa3e97d' rel='nofollow ugc noopener noreferrer'> TopoBathy 3D</a>, <a target='_blank' href='https://www.arcgis.com/home/item.html?id=1b243539f4514b6ba35e7d995890db1d' rel='nofollow ugc noopener noreferrer'>World Hillshade</a>, <a target='_blank' href='https://www.arcgis.com/home/item.html?id=428539ef9cab4017b69d15a40a9ee98b' rel='nofollow ugc noopener noreferrer'>World Hillshade (Dark)</a>) also include an additional data source from <a target='_blank' href='https://www.arcgis.com/apps/mapviewer/index.html?webmap=2daa50a1091b4395925e816a8bb05ae0' rel='nofollow ugc noopener noreferrer'>Vantor's Precision3D</a> covering parts of the globe.</p><p style='margin-bottom:12.0pt; margin-right:0in; margin-top:12.0pt;'><strong>Note: </strong><a target='_blank' href='https://developers.arcgis.com/rest/elevation/' rel='nofollow ugc noopener noreferrer'>ArcGIS Elevation service</a>, <a target='_blank' href='https://www.arcgis.com/home/item.html?id=09ae40dd6766478bb7de3c557c1421cb' rel='nofollow ugc noopener noreferrer'>Terrain 3D (for Export)</a> and <a target='_blank' href='https://www.arcgis.com/home/item.html?id=2ed76fcfac0a405e821aca0568ab41cd' rel='nofollow ugc noopener noreferrer'>TopoBathy 3D (for Export)</a> does not include Vantor Precision3D and Airbus WorldDEM4Ortho.</p><p style='line-height:115%; margin-bottom:8.0pt;'>To view the all the sources in a table format, check out <a target='_blank' href='https://www.arcgis.com/home/item.html?id=a183c04c3d9f40349ca87b555efb3180' rel='nofollow ugc noopener noreferrer'>World Elevation Data Sources Table</a>.</p><p style='margin-bottom:12.0pt; margin-right:0in; margin-top:12.0pt;'>Topography sources listed in the table are part of <a target='_blank' href='https://www.arcgis.com/home/item.html?id=58a541efc59545e6b7137f961d7de883' rel='nofollow ugc noopener noreferrer'>Terrain</a>, <a target='_blank' href='https://www.arcgis.com/home/item.html?id=c753e5bfadb54d46b69c3e68922483bc' rel='nofollow ugc noopener noreferrer'>TopoBathy</a>, <a target='_blank' href='https://www.arcgis.com/home/item.html?id=7029fb60158543ad845c7e1527af11e4' rel='nofollow ugc noopener noreferrer'>Terrain 3D</a>, <a target='_blank' href='https://www.arcgis.com/home/item.html?id=0c69ba5a5d254118841d43f03aa3e97d' rel='nofollow ugc noopener noreferrer'>TopoBathy 3D</a>, <a target='_blank' href='https://www.arcgis.com/home/item.html?id=1b243539f4514b6ba35e7d995890db1d' rel='nofollow ugc noopener noreferrer'>World Hillshade</a> and <a target='_blank' href='https://www.arcgis.com/home/item.html?id=428539ef9cab4017b69d15a40a9ee98b' rel='nofollow ugc noopener noreferrer'>World Hillshade (Dark)</a>, while bathymetry sources are part of <a target='_blank' href='https://www.arcgis.com/home/item.html?id=c753e5bfadb54d46b69c3e68922483bc' rel='nofollow ugc noopener noreferrer'>TopoBathy</a> and <a target='_blank' href='https://www.arcgis.com/home/item.html?id=0c69ba5a5d254118841d43f03aa3e97d' rel='nofollow ugc noopener noreferrer'>TopoBathy 3D</a> only.</p><p style='line-height:18.0pt;'>Check out <a target='_blank' href='https://www.arcgis.com/home/group.html?id=bbc5f50839094e9d8dc5255b6a7783dd#overview' rel='nofollow ugc noopener noreferrer'>elevation layers</a>&nbsp;group for all the elevation content available to ArcGIS users.</p><p><span style='font-size:14px;'><strong>Disclaimer</strong>: Data sources are not to be used for navigation/safety at sea and in air.</span></p></div><div><p style='margin-bottom:12.0pt; margin-right:0in; margin-top:12.0pt;'>&nbsp;</p></div>",
			"keyword": [
				"NED",
				"SRTM",
				"GMTED",
				"EGM2008",
				"DEM",
				"land",
				"topography",
				"bathymetry",
				"ocean",
				"coverage map",
				"hillshade",
				"slope",
				"aspect",
				"elevation",
				"esri_elevation",
				"landscape",
				"world_elevation",
				"world elevation",
				"multidirectional",
				"multi-directional",
				"DTM",
				"WorldDEM"
			],
			"issued": "2014-04-10T22:42:00.000Z",
			"modified": "2026-10-29T15:43:27.000Z",
			"publisher": {
				"name": "Esri"
			},
			"contactPoint": {
				"@type": "vcard:Contact",
				"fn": "esri",
				"hasEmail": "{{orgContactEmail}}"
			},
			"accessLevel": "public",
			"spatial": "-180.0000,-89.0000,180.0000,89.0000",
			"license": "<img alt='' src='https://downloads.esri.com/blogs/arcgisonline/esrilogo_new.png' /> This work is licensed under the Esri Master License Agreement.<br /><div><a href='https://goto.arcgis.com/termsofuse/viewsummary' target='_blank' rel='nofollow ugc noopener noreferrer'><b>View Summary</b></a> | <a href='https://goto.arcgis.com/termsofuse/viewtermsofuse' target='_blank' rel='nofollow ugc noopener noreferrer'><b>View Terms of Use</b></a></div>",
			"distribution": [
				{
					"@type": "dcat:Distribution",
					"title": "ArcGIS Hub Dataset",
					"format": "Web Page",
					"mediaType": "text/html",
					"accessURL": "https://www.pacificgeoportal.com/datasets/esri::90m-1"
				},
				{
					"@type": "dcat:Distribution",
					"title": "ArcGIS GeoService",
					"format": "ArcGIS GeoServices REST API",
					"mediaType": "application/json",
					"accessURL": "https://elevation.arcgis.com/arcgis/rest/services/WorldElevation/DataExtents/MapServer/6"
				},
				{
					"@type": "dcat:Distribution",
					"title": "CSV",
					"format": "CSV",
					"mediaType": "text/csv",
					"accessURL": "https://www.pacificgeoportal.com/api/download/v1/items/3af669838f594b378f90c10f98e46a7f/csv?layers=6"
				},
				{
					"@type": "dcat:Distribution",
					"title": "Shapefile",
					"format": "ZIP",
					"mediaType": "application/zip",
					"accessURL": "https://www.pacificgeoportal.com/api/download/v1/items/3af669838f594b378f90c10f98e46a7f/shapefile?layers=6"
				},
				{
					"@type": "dcat:Distribution",
					"title": "GeoJSON",
					"format": "GeoJSON",
					"mediaType": "application/vnd.geo+json",
					"accessURL": "https://www.pacificgeoportal.com/api/download/v1/items/3af669838f594b378f90c10f98e46a7f/geojson?layers=6"
				},
				{
					"@type": "dcat:Distribution",
					"title": "KML",
					"format": "KML",
					"mediaType": "application/vnd.google-earth.kml+xml",
					"accessURL": "https://www.pacificgeoportal.com/api/download/v1/items/3af669838f594b378f90c10f98e46a7f/kml?layers=6"
				}
			],
			"theme": [
				"geospatial"
			]
		},
		{
			"@type": "dcat:Dataset",
			"identifier": "https://www.arcgis.com/home/item.html?id=3af669838f594b378f90c10f98e46a7f&sublayer=7",
			"landingPage": "https://www.pacificgeoportal.com/datasets/esri::150m-1",
			"title": "150m",
			"description": "<div><p style='margin-bottom:12.0pt; margin-right:0in; margin-top:12.0pt;'>World Elevation layers are compiled from many authoritative data providers, and are updated quarterly. This map shows the extent of the various datasets comprising the World Elevation dynamic (<a target='_blank' href='https://www.arcgis.com/home/item.html?id=58a541efc59545e6b7137f961d7de883' rel='nofollow ugc noopener noreferrer'>Terrain</a>,<a target='_blank' href='https://www.arcgis.com/home/item.html?id=c753e5bfadb54d46b69c3e68922483bc' rel='nofollow ugc noopener noreferrer'>TopoBathy</a>) and tiled (<a target='_blank' href='https://www.arcgis.com/home/item.html?id=7029fb60158543ad845c7e1527af11e4' rel='nofollow ugc noopener noreferrer'>Terrain 3D</a>, <a target='_blank' href='https://www.arcgis.com/home/item.html?id=0c69ba5a5d254118841d43f03aa3e97d' rel='nofollow ugc noopener noreferrer'>TopoBathy 3D</a>, <a target='_blank' href='https://www.arcgis.com/home/item.html?id=1b243539f4514b6ba35e7d995890db1d' rel='nofollow ugc noopener noreferrer'>World Hillshade</a>, <a target='_blank' href='https://www.arcgis.com/home/item.html?id=428539ef9cab4017b69d15a40a9ee98b' rel='nofollow ugc noopener noreferrer'>World Hillshade (Dark)</a>) services.</p><p style='margin-bottom:12.0pt; margin-right:0in; margin-top:12.0pt;'>The tiled services (<a target='_blank' href='https://www.arcgis.com/home/item.html?id=7029fb60158543ad845c7e1527af11e4' rel='nofollow ugc noopener noreferrer'>Terrain 3D</a>,<a target='_blank' href='https://www.arcgis.com/home/item.html?id=0c69ba5a5d254118841d43f03aa3e97d' rel='nofollow ugc noopener noreferrer'> TopoBathy 3D</a>, <a target='_blank' href='https://www.arcgis.com/home/item.html?id=1b243539f4514b6ba35e7d995890db1d' rel='nofollow ugc noopener noreferrer'>World Hillshade</a>, <a target='_blank' href='https://www.arcgis.com/home/item.html?id=428539ef9cab4017b69d15a40a9ee98b' rel='nofollow ugc noopener noreferrer'>World Hillshade (Dark)</a>) also include an additional data source from <a target='_blank' href='https://www.arcgis.com/apps/mapviewer/index.html?webmap=2daa50a1091b4395925e816a8bb05ae0' rel='nofollow ugc noopener noreferrer'>Vantor's Precision3D</a> covering parts of the globe.</p><p style='margin-bottom:12.0pt; margin-right:0in; margin-top:12.0pt;'><strong>Note: </strong><a target='_blank' href='https://developers.arcgis.com/rest/elevation/' rel='nofollow ugc noopener noreferrer'>ArcGIS Elevation service</a>, <a target='_blank' href='https://www.arcgis.com/home/item.html?id=09ae40dd6766478bb7de3c557c1421cb' rel='nofollow ugc noopener noreferrer'>Terrain 3D (for Export)</a> and <a target='_blank' href='https://www.arcgis.com/home/item.html?id=2ed76fcfac0a405e821aca0568ab41cd' rel='nofollow ugc noopener noreferrer'>TopoBathy 3D (for Export)</a> does not include Vantor Precision3D and Airbus WorldDEM4Ortho.</p><p style='line-height:115%; margin-bottom:8.0pt;'>To view the all the sources in a table format, check out <a target='_blank' href='https://www.arcgis.com/home/item.html?id=a183c04c3d9f40349ca87b555efb3180' rel='nofollow ugc noopener noreferrer'>World Elevation Data Sources Table</a>.</p><p style='margin-bottom:12.0pt; margin-right:0in; margin-top:12.0pt;'>Topography sources listed in the table are part of <a target='_blank' href='https://www.arcgis.com/home/item.html?id=58a541efc59545e6b7137f961d7de883' rel='nofollow ugc noopener noreferrer'>Terrain</a>, <a target='_blank' href='https://www.arcgis.com/home/item.html?id=c753e5bfadb54d46b69c3e68922483bc' rel='nofollow ugc noopener noreferrer'>TopoBathy</a>, <a target='_blank' href='https://www.arcgis.com/home/item.html?id=7029fb60158543ad845c7e1527af11e4' rel='nofollow ugc noopener noreferrer'>Terrain 3D</a>, <a target='_blank' href='https://www.arcgis.com/home/item.html?id=0c69ba5a5d254118841d43f03aa3e97d' rel='nofollow ugc noopener noreferrer'>TopoBathy 3D</a>, <a target='_blank' href='https://www.arcgis.com/home/item.html?id=1b243539f4514b6ba35e7d995890db1d' rel='nofollow ugc noopener noreferrer'>World Hillshade</a> and <a target='_blank' href='https://www.arcgis.com/home/item.html?id=428539ef9cab4017b69d15a40a9ee98b' rel='nofollow ugc noopener noreferrer'>World Hillshade (Dark)</a>, while bathymetry sources are part of <a target='_blank' href='https://www.arcgis.com/home/item.html?id=c753e5bfadb54d46b69c3e68922483bc' rel='nofollow ugc noopener noreferrer'>TopoBathy</a> and <a target='_blank' href='https://www.arcgis.com/home/item.html?id=0c69ba5a5d254118841d43f03aa3e97d' rel='nofollow ugc noopener noreferrer'>TopoBathy 3D</a> only.</p><p style='line-height:18.0pt;'>Check out <a target='_blank' href='https://www.arcgis.com/home/group.html?id=bbc5f50839094e9d8dc5255b6a7783dd#overview' rel='nofollow ugc noopener noreferrer'>elevation layers</a>&nbsp;group for all the elevation content available to ArcGIS users.</p><p><span style='font-size:14px;'><strong>Disclaimer</strong>: Data sources are not to be used for navigation/safety at sea and in air.</span></p></div><div><p style='margin-bottom:12.0pt; margin-right:0in; margin-top:12.0pt;'>&nbsp;</p></div>",
			"keyword": [
				"NED",
				"SRTM",
				"GMTED",
				"EGM2008",
				"DEM",
				"land",
				"topography",
				"bathymetry",
				"ocean",
				"coverage map",
				"hillshade",
				"slope",
				"aspect",
				"elevation",
				"esri_elevation",
				"landscape",
				"world_elevation",
				"world elevation",
				"multidirectional",
				"multi-directional",
				"DTM",
				"WorldDEM"
			],
			"issued": "2014-04-10T22:42:00.000Z",
			"modified": "2026-10-29T15:43:27.000Z",
			"publisher": {
				"name": "Esri"
			},
			"contactPoint": {
				"@type": "vcard:Contact",
				"fn": "esri",
				"hasEmail": "{{orgContactEmail}}"
			},
			"accessLevel": "public",
			"spatial": "-180.0000,-89.0000,180.0000,89.0000",
			"license": "<img alt='' src='https://downloads.esri.com/blogs/arcgisonline/esrilogo_new.png' /> This work is licensed under the Esri Master License Agreement.<br /><div><a href='https://goto.arcgis.com/termsofuse/viewsummary' target='_blank' rel='nofollow ugc noopener noreferrer'><b>View Summary</b></a> | <a href='https://goto.arcgis.com/termsofuse/viewtermsofuse' target='_blank' rel='nofollow ugc noopener noreferrer'><b>View Terms of Use</b></a></div>",
			"distribution": [
				{
					"@type": "dcat:Distribution",
					"title": "ArcGIS Hub Dataset",
					"format": "Web Page",
					"mediaType": "text/html",
					"accessURL": "https://www.pacificgeoportal.com/datasets/esri::150m-1"
				},
				{
					"@type": "dcat:Distribution",
					"title": "ArcGIS GeoService",
					"format": "ArcGIS GeoServices REST API",
					"mediaType": "application/json",
					"accessURL": "https://elevation.arcgis.com/arcgis/rest/services/WorldElevation/DataExtents/MapServer/7"
				},
				{
					"@type": "dcat:Distribution",
					"title": "CSV",
					"format": "CSV",
					"mediaType": "text/csv",
					"accessURL": "https://www.pacificgeoportal.com/api/download/v1/items/3af669838f594b378f90c10f98e46a7f/csv?layers=7"
				},
				{
					"@type": "dcat:Distribution",
					"title": "Shapefile",
					"format": "ZIP",
					"mediaType": "application/zip",
					"accessURL": "https://www.pacificgeoportal.com/api/download/v1/items/3af669838f594b378f90c10f98e46a7f/shapefile?layers=7"
				},
				{
					"@type": "dcat:Distribution",
					"title": "GeoJSON",
					"format": "GeoJSON",
					"mediaType": "application/vnd.geo+json",
					"accessURL": "https://www.pacificgeoportal.com/api/download/v1/items/3af669838f594b378f90c10f98e46a7f/geojson?layers=7"
				},
				{
					"@type": "dcat:Distribution",
					"title": "KML",
					"format": "KML",
					"mediaType": "application/vnd.google-earth.kml+xml",
					"accessURL": "https://www.pacificgeoportal.com/api/download/v1/items/3af669838f594b378f90c10f98e46a7f/kml?layers=7"
				}
			],
			"theme": [
				"geospatial"
			]
		},
		{
			"@type": "dcat:Dataset",
			"identifier": "https://www.arcgis.com/home/item.html?id=3af669838f594b378f90c10f98e46a7f&sublayer=8",
			"landingPage": "https://www.pacificgeoportal.com/datasets/esri::250m-1",
			"title": "250m",
			"description": "<div><p style='margin-bottom:12.0pt; margin-right:0in; margin-top:12.0pt;'>World Elevation layers are compiled from many authoritative data providers, and are updated quarterly. This map shows the extent of the various datasets comprising the World Elevation dynamic (<a target='_blank' href='https://www.arcgis.com/home/item.html?id=58a541efc59545e6b7137f961d7de883' rel='nofollow ugc noopener noreferrer'>Terrain</a>,<a target='_blank' href='https://www.arcgis.com/home/item.html?id=c753e5bfadb54d46b69c3e68922483bc' rel='nofollow ugc noopener noreferrer'>TopoBathy</a>) and tiled (<a target='_blank' href='https://www.arcgis.com/home/item.html?id=7029fb60158543ad845c7e1527af11e4' rel='nofollow ugc noopener noreferrer'>Terrain 3D</a>, <a target='_blank' href='https://www.arcgis.com/home/item.html?id=0c69ba5a5d254118841d43f03aa3e97d' rel='nofollow ugc noopener noreferrer'>TopoBathy 3D</a>, <a target='_blank' href='https://www.arcgis.com/home/item.html?id=1b243539f4514b6ba35e7d995890db1d' rel='nofollow ugc noopener noreferrer'>World Hillshade</a>, <a target='_blank' href='https://www.arcgis.com/home/item.html?id=428539ef9cab4017b69d15a40a9ee98b' rel='nofollow ugc noopener noreferrer'>World Hillshade (Dark)</a>) services.</p><p style='margin-bottom:12.0pt; margin-right:0in; margin-top:12.0pt;'>The tiled services (<a target='_blank' href='https://www.arcgis.com/home/item.html?id=7029fb60158543ad845c7e1527af11e4' rel='nofollow ugc noopener noreferrer'>Terrain 3D</a>,<a target='_blank' href='https://www.arcgis.com/home/item.html?id=0c69ba5a5d254118841d43f03aa3e97d' rel='nofollow ugc noopener noreferrer'> TopoBathy 3D</a>, <a target='_blank' href='https://www.arcgis.com/home/item.html?id=1b243539f4514b6ba35e7d995890db1d' rel='nofollow ugc noopener noreferrer'>World Hillshade</a>, <a target='_blank' href='https://www.arcgis.com/home/item.html?id=428539ef9cab4017b69d15a40a9ee98b' rel='nofollow ugc noopener noreferrer'>World Hillshade (Dark)</a>) also include an additional data source from <a target='_blank' href='https://www.arcgis.com/apps/mapviewer/index.html?webmap=2daa50a1091b4395925e816a8bb05ae0' rel='nofollow ugc noopener noreferrer'>Vantor's Precision3D</a> covering parts of the globe.</p><p style='margin-bottom:12.0pt; margin-right:0in; margin-top:12.0pt;'><strong>Note: </strong><a target='_blank' href='https://developers.arcgis.com/rest/elevation/' rel='nofollow ugc noopener noreferrer'>ArcGIS Elevation service</a>, <a target='_blank' href='https://www.arcgis.com/home/item.html?id=09ae40dd6766478bb7de3c557c1421cb' rel='nofollow ugc noopener noreferrer'>Terrain 3D (for Export)</a> and <a target='_blank' href='https://www.arcgis.com/home/item.html?id=2ed76fcfac0a405e821aca0568ab41cd' rel='nofollow ugc noopener noreferrer'>TopoBathy 3D (for Export)</a> does not include Vantor Precision3D and Airbus WorldDEM4Ortho.</p><p style='line-height:115%; margin-bottom:8.0pt;'>To view the all the sources in a table format, check out <a target='_blank' href='https://www.arcgis.com/home/item.html?id=a183c04c3d9f40349ca87b555efb3180' rel='nofollow ugc noopener noreferrer'>World Elevation Data Sources Table</a>.</p><p style='margin-bottom:12.0pt; margin-right:0in; margin-top:12.0pt;'>Topography sources listed in the table are part of <a target='_blank' href='https://www.arcgis.com/home/item.html?id=58a541efc59545e6b7137f961d7de883' rel='nofollow ugc noopener noreferrer'>Terrain</a>, <a target='_blank' href='https://www.arcgis.com/home/item.html?id=c753e5bfadb54d46b69c3e68922483bc' rel='nofollow ugc noopener noreferrer'>TopoBathy</a>, <a target='_blank' href='https://www.arcgis.com/home/item.html?id=7029fb60158543ad845c7e1527af11e4' rel='nofollow ugc noopener noreferrer'>Terrain 3D</a>, <a target='_blank' href='https://www.arcgis.com/home/item.html?id=0c69ba5a5d254118841d43f03aa3e97d' rel='nofollow ugc noopener noreferrer'>TopoBathy 3D</a>, <a target='_blank' href='https://www.arcgis.com/home/item.html?id=1b243539f4514b6ba35e7d995890db1d' rel='nofollow ugc noopener noreferrer'>World Hillshade</a> and <a target='_blank' href='https://www.arcgis.com/home/item.html?id=428539ef9cab4017b69d15a40a9ee98b' rel='nofollow ugc noopener noreferrer'>World Hillshade (Dark)</a>, while bathymetry sources are part of <a target='_blank' href='https://www.arcgis.com/home/item.html?id=c753e5bfadb54d46b69c3e68922483bc' rel='nofollow ugc noopener noreferrer'>TopoBathy</a> and <a target='_blank' href='https://www.arcgis.com/home/item.html?id=0c69ba5a5d254118841d43f03aa3e97d' rel='nofollow ugc noopener noreferrer'>TopoBathy 3D</a> only.</p><p style='line-height:18.0pt;'>Check out <a target='_blank' href='https://www.arcgis.com/home/group.html?id=bbc5f50839094e9d8dc5255b6a7783dd#overview' rel='nofollow ugc noopener noreferrer'>elevation layers</a>&nbsp;group for all the elevation content available to ArcGIS users.</p><p><span style='font-size:14px;'><strong>Disclaimer</strong>: Data sources are not to be used for navigation/safety at sea and in air.</span></p></div><div><p style='margin-bottom:12.0pt; margin-right:0in; margin-top:12.0pt;'>&nbsp;</p></div>",
			"keyword": [
				"NED",
				"SRTM",
				"GMTED",
				"EGM2008",
				"DEM",
				"land",
				"topography",
				"bathymetry",
				"ocean",
				"coverage map",
				"hillshade",
				"slope",
				"aspect",
				"elevation",
				"esri_elevation",
				"landscape",
				"world_elevation",
				"world elevation",
				"multidirectional",
				"multi-directional",
				"DTM",
				"WorldDEM"
			],
			"issued": "2014-04-10T22:42:00.000Z",
			"modified": "2026-10-29T15:43:27.000Z",
			"publisher": {
				"name": "Esri"
			},
			"contactPoint": {
				"@type": "vcard:Contact",
				"fn": "esri",
				"hasEmail": "{{orgContactEmail}}"
			},
			"accessLevel": "public",
			"spatial": "-180.0000,-89.0000,180.0000,89.0000",
			"license": "<img alt='' src='https://downloads.esri.com/blogs/arcgisonline/esrilogo_new.png' /> This work is licensed under the Esri Master License Agreement.<br /><div><a href='https://goto.arcgis.com/termsofuse/viewsummary' target='_blank' rel='nofollow ugc noopener noreferrer'><b>View Summary</b></a> | <a href='https://goto.arcgis.com/termsofuse/viewtermsofuse' target='_blank' rel='nofollow ugc noopener noreferrer'><b>View Terms of Use</b></a></div>",
			"distribution": [
				{
					"@type": "dcat:Distribution",
					"title": "ArcGIS Hub Dataset",
					"format": "Web Page",
					"mediaType": "text/html",
					"accessURL": "https://www.pacificgeoportal.com/datasets/esri::250m-1"
				},
				{
					"@type": "dcat:Distribution",
					"title": "ArcGIS GeoService",
					"format": "ArcGIS GeoServices REST API",
					"mediaType": "application/json",
					"accessURL": "https://elevation.arcgis.com/arcgis/rest/services/WorldElevation/DataExtents/MapServer/8"
				},
				{
					"@type": "dcat:Distribution",
					"title": "CSV",
					"format": "CSV",
					"mediaType": "text/csv",
					"accessURL": "https://www.pacificgeoportal.com/api/download/v1/items/3af669838f594b378f90c10f98e46a7f/csv?layers=8"
				},
				{
					"@type": "dcat:Distribution",
					"title": "Shapefile",
					"format": "ZIP",
					"mediaType": "application/zip",
					"accessURL": "https://www.pacificgeoportal.com/api/download/v1/items/3af669838f594b378f90c10f98e46a7f/shapefile?layers=8"
				},
				{
					"@type": "dcat:Distribution",
					"title": "GeoJSON",
					"format": "GeoJSON",
					"mediaType": "application/vnd.geo+json",
					"accessURL": "https://www.pacificgeoportal.com/api/download/v1/items/3af669838f594b378f90c10f98e46a7f/geojson?layers=8"
				},
				{
					"@type": "dcat:Distribution",
					"title": "KML",
					"format": "KML",
					"mediaType": "application/vnd.google-earth.kml+xml",
					"accessURL": "https://www.pacificgeoportal.com/api/download/v1/items/3af669838f594b378f90c10f98e46a7f/kml?layers=8"
				}
			],
			"theme": [
				"geospatial"
			]
		},
		{
			"@type": "dcat:Dataset",
			"identifier": "https://www.arcgis.com/home/item.html?id=3af669838f594b378f90c10f98e46a7f&sublayer=9",
			"landingPage": "https://www.pacificgeoportal.com/datasets/esri::500m-1",
			"title": "500m",
			"description": "<div><p style='margin-bottom:12.0pt; margin-right:0in; margin-top:12.0pt;'>World Elevation layers are compiled from many authoritative data providers, and are updated quarterly. This map shows the extent of the various datasets comprising the World Elevation dynamic (<a target='_blank' href='https://www.arcgis.com/home/item.html?id=58a541efc59545e6b7137f961d7de883' rel='nofollow ugc noopener noreferrer'>Terrain</a>,<a target='_blank' href='https://www.arcgis.com/home/item.html?id=c753e5bfadb54d46b69c3e68922483bc' rel='nofollow ugc noopener noreferrer'>TopoBathy</a>) and tiled (<a target='_blank' href='https://www.arcgis.com/home/item.html?id=7029fb60158543ad845c7e1527af11e4' rel='nofollow ugc noopener noreferrer'>Terrain 3D</a>, <a target='_blank' href='https://www.arcgis.com/home/item.html?id=0c69ba5a5d254118841d43f03aa3e97d' rel='nofollow ugc noopener noreferrer'>TopoBathy 3D</a>, <a target='_blank' href='https://www.arcgis.com/home/item.html?id=1b243539f4514b6ba35e7d995890db1d' rel='nofollow ugc noopener noreferrer'>World Hillshade</a>, <a target='_blank' href='https://www.arcgis.com/home/item.html?id=428539ef9cab4017b69d15a40a9ee98b' rel='nofollow ugc noopener noreferrer'>World Hillshade (Dark)</a>) services.</p><p style='margin-bottom:12.0pt; margin-right:0in; margin-top:12.0pt;'>The tiled services (<a target='_blank' href='https://www.arcgis.com/home/item.html?id=7029fb60158543ad845c7e1527af11e4' rel='nofollow ugc noopener noreferrer'>Terrain 3D</a>,<a target='_blank' href='https://www.arcgis.com/home/item.html?id=0c69ba5a5d254118841d43f03aa3e97d' rel='nofollow ugc noopener noreferrer'> TopoBathy 3D</a>, <a target='_blank' href='https://www.arcgis.com/home/item.html?id=1b243539f4514b6ba35e7d995890db1d' rel='nofollow ugc noopener noreferrer'>World Hillshade</a>, <a target='_blank' href='https://www.arcgis.com/home/item.html?id=428539ef9cab4017b69d15a40a9ee98b' rel='nofollow ugc noopener noreferrer'>World Hillshade (Dark)</a>) also include an additional data source from <a target='_blank' href='https://www.arcgis.com/apps/mapviewer/index.html?webmap=2daa50a1091b4395925e816a8bb05ae0' rel='nofollow ugc noopener noreferrer'>Vantor's Precision3D</a> covering parts of the globe.</p><p style='margin-bottom:12.0pt; margin-right:0in; margin-top:12.0pt;'><strong>Note: </strong><a target='_blank' href='https://developers.arcgis.com/rest/elevation/' rel='nofollow ugc noopener noreferrer'>ArcGIS Elevation service</a>, <a target='_blank' href='https://www.arcgis.com/home/item.html?id=09ae40dd6766478bb7de3c557c1421cb' rel='nofollow ugc noopener noreferrer'>Terrain 3D (for Export)</a> and <a target='_blank' href='https://www.arcgis.com/home/item.html?id=2ed76fcfac0a405e821aca0568ab41cd' rel='nofollow ugc noopener noreferrer'>TopoBathy 3D (for Export)</a> does not include Vantor Precision3D and Airbus WorldDEM4Ortho.</p><p style='line-height:115%; margin-bottom:8.0pt;'>To view the all the sources in a table format, check out <a target='_blank' href='https://www.arcgis.com/home/item.html?id=a183c04c3d9f40349ca87b555efb3180' rel='nofollow ugc noopener noreferrer'>World Elevation Data Sources Table</a>.</p><p style='margin-bottom:12.0pt; margin-right:0in; margin-top:12.0pt;'>Topography sources listed in the table are part of <a target='_blank' href='https://www.arcgis.com/home/item.html?id=58a541efc59545e6b7137f961d7de883' rel='nofollow ugc noopener noreferrer'>Terrain</a>, <a target='_blank' href='https://www.arcgis.com/home/item.html?id=c753e5bfadb54d46b69c3e68922483bc' rel='nofollow ugc noopener noreferrer'>TopoBathy</a>, <a target='_blank' href='https://www.arcgis.com/home/item.html?id=7029fb60158543ad845c7e1527af11e4' rel='nofollow ugc noopener noreferrer'>Terrain 3D</a>, <a target='_blank' href='https://www.arcgis.com/home/item.html?id=0c69ba5a5d254118841d43f03aa3e97d' rel='nofollow ugc noopener noreferrer'>TopoBathy 3D</a>, <a target='_blank' href='https://www.arcgis.com/home/item.html?id=1b243539f4514b6ba35e7d995890db1d' rel='nofollow ugc noopener noreferrer'>World Hillshade</a> and <a target='_blank' href='https://www.arcgis.com/home/item.html?id=428539ef9cab4017b69d15a40a9ee98b' rel='nofollow ugc noopener noreferrer'>World Hillshade (Dark)</a>, while bathymetry sources are part of <a target='_blank' href='https://www.arcgis.com/home/item.html?id=c753e5bfadb54d46b69c3e68922483bc' rel='nofollow ugc noopener noreferrer'>TopoBathy</a> and <a target='_blank' href='https://www.arcgis.com/home/item.html?id=0c69ba5a5d254118841d43f03aa3e97d' rel='nofollow ugc noopener noreferrer'>TopoBathy 3D</a> only.</p><p style='line-height:18.0pt;'>Check out <a target='_blank' href='https://www.arcgis.com/home/group.html?id=bbc5f50839094e9d8dc5255b6a7783dd#overview' rel='nofollow ugc noopener noreferrer'>elevation layers</a>&nbsp;group for all the elevation content available to ArcGIS users.</p><p><span style='font-size:14px;'><strong>Disclaimer</strong>: Data sources are not to be used for navigation/safety at sea and in air.</span></p></div><div><p style='margin-bottom:12.0pt; margin-right:0in; margin-top:12.0pt;'>&nbsp;</p></div>",
			"keyword": [
				"NED",
				"SRTM",
				"GMTED",
				"EGM2008",
				"DEM",
				"land",
				"topography",
				"bathymetry",
				"ocean",
				"coverage map",
				"hillshade",
				"slope",
				"aspect",
				"elevation",
				"esri_elevation",
				"landscape",
				"world_elevation",
				"world elevation",
				"multidirectional",
				"multi-directional",
				"DTM",
				"WorldDEM"
			],
			"issued": "2014-04-10T22:42:00.000Z",
			"modified": "2026-10-29T15:43:27.000Z",
			"publisher": {
				"name": "Esri"
			},
			"contactPoint": {
				"@type": "vcard:Contact",
				"fn": "esri",
				"hasEmail": "{{orgContactEmail}}"
			},
			"accessLevel": "public",
			"spatial": "-180.0000,-89.0000,180.0000,89.0000",
			"license": "<img alt='' src='https://downloads.esri.com/blogs/arcgisonline/esrilogo_new.png' /> This work is licensed under the Esri Master License Agreement.<br /><div><a href='https://goto.arcgis.com/termsofuse/viewsummary' target='_blank' rel='nofollow ugc noopener noreferrer'><b>View Summary</b></a> | <a href='https://goto.arcgis.com/termsofuse/viewtermsofuse' target='_blank' rel='nofollow ugc noopener noreferrer'><b>View Terms of Use</b></a></div>",
			"distribution": [
				{
					"@type": "dcat:Distribution",
					"title": "ArcGIS Hub Dataset",
					"format": "Web Page",
					"mediaType": "text/html",
					"accessURL": "https://www.pacificgeoportal.com/datasets/esri::500m-1"
				},
				{
					"@type": "dcat:Distribution",
					"title": "ArcGIS GeoService",
					"format": "ArcGIS GeoServices REST API",
					"mediaType": "application/json",
					"accessURL": "https://elevation.arcgis.com/arcgis/rest/services/WorldElevation/DataExtents/MapServer/9"
				},
				{
					"@type": "dcat:Distribution",
					"title": "CSV",
					"format": "CSV",
					"mediaType": "text/csv",
					"accessURL": "https://www.pacificgeoportal.com/api/download/v1/items/3af669838f594b378f90c10f98e46a7f/csv?layers=9"
				},
				{
					"@type": "dcat:Distribution",
					"title": "Shapefile",
					"format": "ZIP",
					"mediaType": "application/zip",
					"accessURL": "https://www.pacificgeoportal.com/api/download/v1/items/3af669838f594b378f90c10f98e46a7f/shapefile?layers=9"
				},
				{
					"@type": "dcat:Distribution",
					"title": "GeoJSON",
					"format": "GeoJSON",
					"mediaType": "application/vnd.geo+json",
					"accessURL": "https://www.pacificgeoportal.com/api/download/v1/items/3af669838f594b378f90c10f98e46a7f/geojson?layers=9"
				},
				{
					"@type": "dcat:Distribution",
					"title": "KML",
					"format": "KML",
					"mediaType": "application/vnd.google-earth.kml+xml",
					"accessURL": "https://www.pacificgeoportal.com/api/download/v1/items/3af669838f594b378f90c10f98e46a7f/kml?layers=9"
				}
			],
			"theme": [
				"geospatial"
			]
		},
		{
			"@type": "dcat:Dataset",
			"identifier": "https://www.arcgis.com/home/item.html?id=0383ba18906149e3bd2a0975a0afdb8e",
			"landingPage": "https://www.pacificgeoportal.com/datasets/esri::ground-surface-elevation-30m",
			"title": "Ground Surface Elevation - 30m",
			"description": "<div style='margin:0px; padding:0px;'><div style='margin:0px; padding:0px;'><div style='margin:0px; padding:0px;'><p style='margin-bottom:0pt;'>This dynamic image\nservice provides numeric values representing ground surface heights, based on a\ndigital terrain model (DTM). Heights are orthometric (sea level = 0), and water\nbodies that are above sea level have approximated nominal water heights.</p></div><div style='margin:0px; padding:0px;'></div><div style='margin:0px; padding:0px;'><br /></div><div style='margin:0px; padding:0px;'><font size='4'>What can you do with this layer?</font><br /></div><div style='margin:0px; padding:0px;'><br /></div><div style='margin:0px; padding:0px;'><b>Use for Visualization:</b> This layer is generally not\noptimal for direct visualization. By default, 32 bit floating point values are\nreturned, resulting in higher bandwidth requirements. Therefore, usage should\nbe limited to applications requiring elevation data values. Alternatively,\nclient applications can select from numerous additional functions, applied on\nthe server, that return rendered data. For visualizations such as hillshade, slope, consider using the appropriate server-side\nfunction defined on this service.</div><div style='margin:0px; padding:0px;'>\n\n<p style='margin:12pt 0in;'><b>Use for Analysis:</b><span> </span>Yes. This layer provides data\nas floating point elevation values suitable for use in analysis.</p>\n\n<p><b>NOTE:</b><span> </span>The image\nservice uses North America Albers Equal Area Conic projection (WKID: 102008) and\nresamples the data dynamically to the requested projection, extent and pixel\nsize. For analyses requiring the highest accuracy, when using ArcGIS Desktop,\nyou will need to use native coordinates (GCS_North_American_1983, WKID: 4269) and\nspecify the native resolutions (0.0002777777777779 degrees) as the cell size\ngeoprocessing environment setting and ensure that the request is aligned with\nthe source pixels.</p>\n\n<p style='margin:12pt 0in;'><b>Server Functions:</b><span> </span>This layer has server\nfunctions defined for the following elevation derivatives:</p><ul>\n <li>Slope Degrees</li>\n <li>Slope Percentage</li>\n <li>Aspect</li>\n <li>Hillshade</li>\n <li>Slope Degrees\n     Map</li></ul><div><p style='margin-top:0in; background-image:initial; background-position:initial; background-size:initial; background-repeat:initial; background-attachment:initial; background-origin:initial; background-clip:initial;'><b>Data Sources:</b> The data for this layer comes from 3DEP 1 arc-second dataset\nfrom the <a href='https://www.usgs.gov/3dep' target='_blank' rel='nofollow ugc noopener noreferrer'>USGS's 3D Elevation Program</a> with original\nsource data in its native coordinate system.</p><p style='margin-top:0in; background-image:initial; background-position:initial; background-size:initial; background-repeat:initial; background-attachment:initial; background-origin:initial; background-clip:initial;'><b>Data Coverage:</b> The dataset covers the\nconterminous United States, Hawaii, Alaska, Puerto Rico, Territorial Islands of\nthe United States; Canada and Mexico.</p></div></div></div><div style='margin:0px; padding:0px;'>\n\n<p style='margin-bottom:0pt;'>This layer has query,\nidentify, and export image services available.  The layer is restricted to\na 24,000 x 24,000 pixel limit. </p>\n\n<p style='margin-bottom:0pt;'>This layer is part of\na larger collection of <a href='https://www.arcgis.com/home/group.html?owner=esri&amp;title=Elevation%20Layers' target='_blank' rel='nofollow ugc noopener noreferrer'>elevation layers</a> that you can use\nto perform a variety of mapping analysis tasks. </p></div></div>",
			"keyword": [
				"Elevation",
				"land",
				"esri_elevation",
				"USGS",
				"3DEP",
				"seamless",
				"Standard DEMs"
			],
			"issued": "2013-07-04T19:29:39.000Z",
			"modified": "2023-06-29T03:19:23.000Z",
			"publisher": {
				"name": "Esri"
			},
			"contactPoint": {
				"@type": "vcard:Contact",
				"fn": "esri_elevation",
				"hasEmail": "{{orgContactEmail}}"
			},
			"accessLevel": "public",
			"spatial": "-180.0000,-68.7410,180.0000,80.5273",
			"license": "<img alt='' src='https://downloads.esri.com/blogs/arcgisonline/esrilogo_new.png' />This work is licensed under the Esri Master License Agreement. <br /><div><a href='https://goto.arcgis.com/termsofuse/viewsummary' target='_blank' rel='nofollow ugc noopener noreferrer'><b>View Summary</b></a> | <a href='https://goto.arcgis.com/termsofuse/viewtermsofuse' target='_blank' rel='nofollow ugc noopener noreferrer'><b>View Terms of Use</b></a> </div><div><span style='line-height: 16.05px;'><br /></span></div><div><font color='#b22222'>Important Note:</font> This item requires an ArcGIS Online organizational subscription or an ArcGIS Developer account and does not consume credits. To access this item, you'll need to do one of the following: </div><div><ul><li>Sign in with an account that is a member of an organizational subscription </li><li>Sign in with a developer account </li><li><a href='https://goto.arcgis.com/termsofuse/registeranapplication' target='_blank' rel='nofollow ugc noopener noreferrer'>Register an application</a> and use your application's credentials.</li></ul>If you don't have an account, you can sign up for a <a href='https://goto.arcgis.com/features/trial' target='_blank' rel='nofollow ugc noopener noreferrer'>free trial of ArcGIS</a> or a <a href='https://goto.arcgis.com/developers/signup' target='_blank' rel='nofollow ugc noopener noreferrer'>free ArcGIS Developer account</a>.</div>",
			"distribution": [
				{
					"@type": "dcat:Distribution",
					"title": "ArcGIS Hub Dataset",
					"format": "Web Page",
					"mediaType": "text/html",
					"accessURL": "https://www.pacificgeoportal.com/datasets/esri::ground-surface-elevation-30m"
				},
				{
					"@type": "dcat:Distribution",
					"title": "ArcGIS GeoService",
					"format": "ArcGIS GeoServices REST API",
					"mediaType": "application/json",
					"accessURL": "https://elevation.arcgis.com/arcgis/rest/services/NED30m/ImageServer"
				}
			],
			"theme": [
				"geospatial"
			]
		},
		{
			"@type": "dcat:Dataset",
			"identifier": "https://www.arcgis.com/home/item.html?id=a1ba14d09df14f42ad6ca3c4bcebf3b4",
			"landingPage": "https://www.pacificgeoportal.com/datasets/esri::terrain-slope-map",
			"title": "Terrain: Slope Map",
			"description": "<span style='line-height: 115%;'>This map provides a\ncolorized representation of slope, generated dynamically using server-side slope\nfunction on Terrain service. The degree of\nslope steepness is depicted by light to dark colors - flat surfaces as gray, shallow\nslopes as light yellow, moderate slopes as light orange and steep slopes as\nred-brown. <span style='line-height: 115%;'><span style='line-height: 115%;'>A scaling is applied to\nslope values to generate appropriate visualization at each map scale.  </span></span>This service should only be used for\nvisualization, such as a base layer in applications or maps. </span><div><div><br /></div><div><img alt='' src='https://downloads.esri.com/esri_content_doc/landscape/SlopeMapLegend_V7b.png' /></div><div><br /></div><div>If access to <span style='line-height: 17.25px;'>non-scaled </span>slope values is required, use the <a href='https://www.arcgis.com/home/item.html?id=af25a795273440deb449b336543602be' target='_blank' rel='nofollow ugc noopener noreferrer'>Slope Degrees</a> or Slope percent functions, which return values from 0 to 90 degrees, or 0 to 1000%, respectively.<br /><div><br /></div><div><div><font size='4'>What can you do with this layer?</font></div><div><br /></div><div><b>Use for Visualization:</b> Yes. This colorized slope\nis appropriate for visualizing the steepness of the terrain at all map scales.\nThis layer can be added to applications or maps to enhance contextual\nunderstanding. </div><div><br /></div><div><b>Use for Analysis:  </b>No.  8 bit color values\nreturned by this service represent scaled slope values. For analysis with non-scaled values, use the <a href='https://www.arcgis.com/home/item.html?id=af25a795273440deb449b336543602be' target='_blank' rel='nofollow ugc noopener noreferrer'><span style='background-color: rgb(255, 255, 255);'>Slope Degrees</span></a> or Slope percent functions.</div><div><br /></div><div><p style='margin-top:12.0pt;margin-right:0in;margin-bottom:\n12.0pt;margin-left:0in'><span style='line-height: 115%;'>For more details such as Data\nSources, Mosaic method used in this layer, please see the <a href='https://www.arcgis.com/home/item.html?id=58a541efc59545e6b7137f961d7de883' style='' target='_blank' rel='nofollow ugc noopener noreferrer'>Terrain layer</a>. This layer allows query, identify, and\nexport image requests. The layer is restricted to a 5,000 x 5,000 pixel limit\nin a single export image request.</span></p>\n\n<p style='margin: 0in 0in 0.0001pt; text-decoration-style: initial; text-decoration-color: initial; background-image: initial; background-position: initial; background-size: initial; background-repeat: initial; background-attachment: initial; background-origin: initial; background-clip: initial;'>This layer is part of a larger collection of <a href='https://www.arcgis.com/home/group.html?owner=esri&amp;title=Elevation%20Layers' style='' target='_blank' rel='nofollow ugc noopener noreferrer'>elevation layers</a> that you can use to perform a variety\nof mapping analysis tasks.</p></div></div></div></div>",
			"keyword": [
				"DEM",
				"Elevation",
				"land",
				"topography",
				"slope map",
				"esri_elevation",
				"landscape",
				"world_elevation",
				"world elevation"
			],
			"issued": "2013-12-30T23:05:03.000Z",
			"modified": "2024-04-05T03:22:03.000Z",
			"publisher": {
				"name": "Esri"
			},
			"contactPoint": {
				"@type": "vcard:Contact",
				"fn": "esri_elevation",
				"hasEmail": "{{orgContactEmail}}"
			},
			"accessLevel": "public",
			"spatial": "-180.0000,-89.0000,180.0000,85.0511",
			"license": "<img alt='' src='https://downloads.esri.com/blogs/arcgisonline/esrilogo_new.png' />This work is licensed under the Esri Master License Agreement. <br /><div><a href='https://goto.arcgis.com/termsofuse/viewsummary' target='_blank'><b>View Summary</b></a> | <a href='https://goto.arcgis.com/termsofuse/viewtermsofuse' target='_blank'><b>View Terms of Use</b></a> </div><div><span style='line-height: 16.05px;'><br /></span></div><div><font color='#b22222'>Important Note:</font> This item requires an ArcGIS Online organizational subscription or an ArcGIS Developer account and does not consume credits. To access this item, you'll need to do one of the following: </div><div><ul><li>Sign in with an account that is a member of an organizational subscription </li><li>Sign in with a developer account </li><li><a href='https://goto.arcgis.com/termsofuse/registeranapplication' target='_blank'>Register an application</a> and use your application's credentials.</li></ul>If you don't have an account, you can sign up for a <a href='https://goto.arcgis.com/features/trial' target='_blank'>free trial of ArcGIS</a> or a <a href='https://goto.arcgis.com/developers/signup' target='_blank'>free ArcGIS Developer account</a>.</div>",
			"distribution": [
				{
					"@type": "dcat:Distribution",
					"title": "ArcGIS Hub Dataset",
					"format": "Web Page",
					"mediaType": "text/html",
					"accessURL": "https://www.pacificgeoportal.com/datasets/esri::terrain-slope-map"
				},
				{
					"@type": "dcat:Distribution",
					"title": "ArcGIS GeoService",
					"format": "ArcGIS GeoServices REST API",
					"mediaType": "application/json",
					"accessURL": "https://elevation.arcgis.com/arcgis/rest/services/WorldElevation/Terrain/ImageServer"
				}
			],
			"theme": [
				"geospatial"
			]
		},
		{
			"@type": "dcat:Dataset",
			"identifier": "https://www.arcgis.com/home/item.html?id=af25a795273440deb449b336543602be",
			"landingPage": "https://www.pacificgeoportal.com/datasets/esri::terrain-slope-in-degrees",
			"title": "Terrain: Slope in Degrees",
			"description": "This layer provides slope values calculated dynamically from the elevation data (within the current extents) using the<span style='background-color: rgb(255, 255, 255);'> server-side slope function </span>applied to a <a href='https://www.arcgis.com/home/item.html?id=58a541efc59545e6b7137f961d7de883' target='_blank' rel='nofollow ugc noopener noreferrer'>Terrain layer</a>. The values are integer and represent the angle of the downward sloping terrain (0 to 90 degrees).  Note slope is a function of the pixel size of the request, so at smaller scales the slope values are smaller as pixel sizes increase.  <div><br /></div><div><b>WARNING: </b>Slope is computed in the projection specified by the client software. The server resamples the elevation data to the requested projection and pixel size and then computes slope. Slope should be requested in a projection that maintains correct scale in x and y directions for the area of interest. Using geographic coordinates will give incorrect results. For the WGS84 Mercator and WGS Web Mercator (auxiliary sphere) projections used by many web applications, a correction factor has been included to correct for latitude-dependent scale changes.<br /></div><div><br /></div><div><div><font size='4'>What can you do with this layer?</font></div><div><font size='4'><b><br /></b></font></div><div><b>Use for Visualization:</b>  No. This image service provides numeric values indicating terrain characteristics.  Due to the limited range of values, this service is not generally appropriate for visual interpretation, unless the client application applies an additional color map. For use in visualization, use the <a href='https://www.arcgis.com/home/item.html?id=a1ba14d09df14f42ad6ca3c4bcebf3b4' target='_blank' rel='nofollow ugc noopener noreferrer'>Terrain: Slope Map</a>. </div><div><br /></div><div><b>Use for Analysis:</b>  Yes. This layer provides numeric values indicating the average slope angle within a raster cell, calculated based on the defined cell size. Cell size has an effect on the slope values.</div><div><br /></div><div><p style='margin-top:12.0pt;margin-right:0in;margin-bottom:\n12.0pt;margin-left:0in'><span style='line-height: 115%;'>For more details such as Data\nSources, Mosaic method used in this layer, please see the <a href='https://www.arcgis.com/home/item.html?id=58a541efc59545e6b7137f961d7de883' style='' target='_blank' rel='nofollow ugc noopener noreferrer'>Terrain layer</a>. This layer allows query, identify, and\nexport image requests. The layer is restricted to a 5,000 x 5,000 pixel limit\nin a single export image request.</span></p>\n\n<p style='margin: 0in 0in 0.0001pt; text-decoration-style: initial; text-decoration-color: initial; background-image: initial; background-position: initial; background-size: initial; background-repeat: initial; background-attachment: initial; background-origin: initial; background-clip: initial;'>This layer is part of a larger collection of <a href='https://www.arcgis.com/home/group.html?owner=esri&amp;title=Elevation%20Layers' style='' target='_blank' rel='nofollow ugc noopener noreferrer'>elevation layers</a> that you can use to perform a variety\nof mapping analysis tasks.</p><br /></div></div>",
			"keyword": [
				"DEM",
				"Elevation",
				"land",
				"topography",
				"slope degrees",
				"esri_elevation",
				"landscape",
				"world_elevation",
				"world elevation",
				"DTM"
			],
			"issued": "2014-04-10T17:52:30.000Z",
			"modified": "2024-04-05T03:22:09.000Z",
			"publisher": {
				"name": "Esri"
			},
			"contactPoint": {
				"@type": "vcard:Contact",
				"fn": "esri",
				"hasEmail": "{{orgContactEmail}}"
			},
			"accessLevel": "public",
			"spatial": "-180.0000,-89.0000,180.0000,85.0511",
			"license": "<img alt='' src='https://downloads.esri.com/blogs/arcgisonline/esrilogo_new.png' />This work is licensed under the Esri Master License Agreement. <br /><div><a href='https://goto.arcgis.com/termsofuse/viewsummary' target='_blank'><b>View Summary</b></a> | <a href='https://goto.arcgis.com/termsofuse/viewtermsofuse' target='_blank'><b>View Terms of Use</b></a> </div><div><span style='line-height: 16.05px;'><br /></span></div><div><font color='#b22222'>Important Note:</font> This item requires an ArcGIS Online organizational subscription or an ArcGIS Developer account and does not consume credits. To access this item, you'll need to do one of the following: </div><div><ul><li>Sign in with an account that is a member of an organizational subscription </li><li>Sign in with a developer account </li><li><a href='https://goto.arcgis.com/termsofuse/registeranapplication' target='_blank'>Register an application</a> and use your application's credentials.</li></ul>If you don't have an account, you can sign up for a <a href='https://goto.arcgis.com/features/trial' target='_blank'>free trial of ArcGIS</a> or a <a href='https://goto.arcgis.com/developers/signup' target='_blank'>free ArcGIS Developer account</a>.</div>",
			"distribution": [
				{
					"@type": "dcat:Distribution",
					"title": "ArcGIS Hub Dataset",
					"format": "Web Page",
					"mediaType": "text/html",
					"accessURL": "https://www.pacificgeoportal.com/datasets/esri::terrain-slope-in-degrees"
				},
				{
					"@type": "dcat:Distribution",
					"title": "ArcGIS GeoService",
					"format": "ArcGIS GeoServices REST API",
					"mediaType": "application/json",
					"accessURL": "https://elevation.arcgis.com/arcgis/rest/services/WorldElevation/Terrain/ImageServer"
				}
			],
			"theme": [
				"geospatial"
			]
		},
		{
			"@type": "dcat:Dataset",
			"identifier": "https://www.arcgis.com/home/item.html?id=3cedfc19d7b941d89ee15b0e2f454070",
			"landingPage": "https://www.pacificgeoportal.com/datasets/esri::terrain-multi-directional-hillshade-1",
			"title": "Terrain: Multi-Directional Hillshade",
			"description": "This map provides a hillshaded surface generated dynamically using a multi-directional hillshade server-side custom function on the World Elevation <a href='https://www.arcgis.com/home/item.html?id=58a541efc59545e6b7137f961d7de883' rel='nofollow ugc' style='' target='_blank'><span style='background-image:initial; background-position:initial; background-size:initial; background-repeat:initial; background-attachment:initial; background-origin:initial; background-clip:initial;'>Terrain layer</span></a>. This algorithm computes hillshade from six different directions, where each hillshade is multiplied by a weight and thereafter the sum of all is normalized to produce the final output. The z factor is varied based on scale so that a suitable hillshade is visible at all scales. This layer is useful for visualization of the Terrain because it is easy to interpret and use as a base layer in applications and maps.<div>For more information about uses, refer <a href='https://blogs.esri.com/esri/arcgis/2014/07/14/introducing-esris-next-generation-hillshade/' rel='nofollow ugc' target='_blank'>Introducing Esri’s Next Generation Hillshade</a>.<div><br /></div><div><div><font size='4'>What can you do with this layer?</font></div><div><font size='4'><br /></font></div><div><b>Use for Visualization:</b> Yes. Multi-Directional Hillshade provides a quick indication of the shape of the terrain at a range of map scales. The image service can be added to web applications or other maps to enhance contextual understanding.<br /></div><div><br /></div><div><b>Use for Analysis:</b> No. A hillshade is generally not used for analysis.</div></div><div><br /></div><div><b>Note:</b> If you intend to use\nit as basemap, consider using the tiled version of this service i.e. <a href='https://www.arcgis.com/home/item.html?id=1b243539f4514b6ba35e7d995890db1d' rel='nofollow ugc' style=''>World\nHillshade</a>, which provides fast and performant rendering.</div><div><br /></div><div><span style='background-image: initial; background-position: initial; background-size: initial; background-repeat: initial; background-attachment: initial; background-origin: initial; background-clip: initial;'><b>Data Sources and Coverage:</b></span><span style='background-image: initial; background-position: initial; background-size: initial; background-repeat: initial; background-attachment: initial; background-origin: initial; background-clip: initial;'> This layer is compiled from a variety of best available sources from several data providers. To see the coverage and extents of various datasets comprising this service in an interactive map, see </span><span style='background-image: initial; background-position: initial; background-size: initial; background-repeat: initial; background-attachment: initial; background-origin: initial; background-clip: initial;'><a href='https://www.arcgis.com/home/item.html?id=3af669838f594b378f90c10f98e46a7f' rel='nofollow ugc' target='_blank'>Elevation Coverage Map</a></span><span style='background-image: initial; background-position: initial; background-size: initial; background-repeat: initial; background-attachment: initial; background-origin: initial; background-clip: initial;'>.</span><br /></div><div><br /></div><div>This layer is part of a larger collection of <a href='https://www.arcgis.com/home/group.html?owner=esri&amp;title=Elevation%20Layers' rel='nofollow ugc' target='_blank'>elevation layers</a> that you can use to perform a variety of mapping analysis tasks.</div></div>",
			"keyword": [
				"DEM",
				"Elevation",
				"land",
				"topography",
				"hillshade",
				"esri_elevation",
				"world_elevation",
				"world elevation"
			],
			"issued": "2014-06-24T22:52:39.000Z",
			"modified": "2024-04-05T03:22:25.000Z",
			"publisher": {
				"name": "Esri"
			},
			"contactPoint": {
				"@type": "vcard:Contact",
				"fn": "esri",
				"hasEmail": "{{orgContactEmail}}"
			},
			"accessLevel": "public",
			"spatial": "-180.0000,-85.0511,-180.0000,85.0511",
			"license": "<img alt='' src='https://downloads.esri.com/blogs/arcgisonline/esrilogo_new.png' />This work is licensed under the Esri Master License Agreement. <br /><div><a href='https://goto.arcgis.com/termsofuse/viewsummary' target='_blank'><b>View Summary</b></a> | <a href='https://goto.arcgis.com/termsofuse/viewtermsofuse' target='_blank'><b>View Terms of Use</b></a> </div><div><span style='line-height: 16.05px;'><br /></span></div><div><font color='#b22222'>Important Note:</font> This item requires an ArcGIS Online organizational subscription or an ArcGIS Developer account and does not consume credits. To access this item, you'll need to do one of the following: </div><div><ul><li>Sign in with an account that is a member of an organizational subscription </li><li>Sign in with a developer account </li><li><a href='https://goto.arcgis.com/termsofuse/registeranapplication' target='_blank'>Register an application</a> and use your application's credentials.</li></ul>If you don't have an account, you can sign up for a <a href='https://goto.arcgis.com/features/trial' target='_blank'>free trial of ArcGIS</a> or a <a href='https://goto.arcgis.com/developers/signup' target='_blank'>free ArcGIS Developer account</a>.</div>",
			"distribution": [
				{
					"@type": "dcat:Distribution",
					"title": "ArcGIS Hub Dataset",
					"format": "Web Page",
					"mediaType": "text/html",
					"accessURL": "https://www.pacificgeoportal.com/datasets/esri::terrain-multi-directional-hillshade-1"
				},
				{
					"@type": "dcat:Distribution",
					"title": "ArcGIS GeoService",
					"format": "ArcGIS GeoServices REST API",
					"mediaType": "application/json",
					"accessURL": "https://elevation.arcgis.com/arcgis/rest/services/WorldElevation/Terrain/ImageServer"
				}
			],
			"theme": [
				"geospatial"
			]
		},
		{
			"@type": "dcat:Dataset",
			"identifier": "https://www.arcgis.com/home/item.html?id=2729e694b9b34738a59075aed367dedd",
			"landingPage": "https://www.pacificgeoportal.com/datasets/esri::terrain-elevation-tinted-hillshade-1",
			"title": "Terrain: Elevation Tinted Hillshade",
			"description": "This map provides an elevation tinted hillshade surface generated dynamically using a chain of <span style='background-color:rgb(255, 255, 255);'>server-side functions </span>on a <a href='https://www.arcgis.com/home/item.html?id=58a541efc59545e6b7137f961d7de883' rel='nofollow ugc' target='_blank'>Terrain layer</a>. A tinted hillshade is a combination of a hillshade applied to the Terrain, fused to a colormap applied to the same Terrain to represent elevation. The hillshading is based on a solar altitude angle of 45 degrees, and solar aspect angle of 315 degrees.  The z factor is varied based on scale so that a suitable hillshade is visible at all scales. <div><br /></div><div><img src='https://downloads.esri.com/esri_content_doc/landscape/DTMElevTintLegend_V8_wCorrectLabel.png' /><br /><div><br /></div><div><div><font size='4'>What can you do with this layer?</font></div><div><b><br /></b></div><div><b>Use for Visualization:</b>  Yes. This is appropriate for visualizing the shape and height of the terrain at a range of map scales.  The image service can be added to applications or maps to enhance a users’ contextual understanding.  </div><div><br /></div><div><b>Use for Analysis:</b>  No. </div><div><br /></div><div>To learn more about the technique used in this map to fuse the elevation tint with hillshade, refer <a href='https://www.cartogis.org/docs/proceedings/2012/Nagi_AutoCarto2012.pdf' rel='nofollow ugc' target='_blank'>NAGI fusion method</a>.</div><div><br /></div><div><p style='background-image:initial; background-position:initial; background-size:initial; background-repeat:initial; background-attachment:initial; background-origin:initial; background-clip:initial;'></p><p style='margin-top:12.0pt; margin-right:0in; margin-bottom:12.0pt; margin-left:0in;'><span>For more details such as Data\nSources, Mosaic method used in this layer, please see the <a href='https://www.arcgis.com/home/item.html?id=58a541efc59545e6b7137f961d7de883' rel='nofollow ugc' target='_blank'>Terrain layer</a>. This layer allows query, identify, and\nexport image requests. The layer is restricted to a 5,000 x 5,000 pixel limit\nin a single export image request.</span></p>\n\n<p style='margin:0in 0in 0.0001pt; text-decoration-style:initial; text-decoration-color:initial; background-image:initial; background-position:initial; background-size:initial; background-repeat:initial; background-attachment:initial; background-origin:initial; background-clip:initial;'>This layer is part of a larger collection of <a href='https://www.arcgis.com/home/group.html?owner=esri&amp;title=Elevation%20Layers' rel='nofollow ugc' target='_blank'>elevation layers</a> that you can use to perform a variety\nof mapping analysis tasks.</p><br /><p></p></div></div></div>",
			"keyword": [
				"DEM",
				"Elevation",
				"esri_elevation",
				"land",
				"topography",
				"topographic",
				"elevation tinted hillshade",
				"NAGI Fusion",
				"world_elevation",
				"world elevation"
			],
			"issued": "2013-12-30T22:39:45.000Z",
			"modified": "2024-04-05T03:22:06.000Z",
			"publisher": {
				"name": "Esri"
			},
			"contactPoint": {
				"@type": "vcard:Contact",
				"fn": "esri_elevation",
				"hasEmail": "{{orgContactEmail}}"
			},
			"accessLevel": "public",
			"spatial": "-180.0000,-89.0000,180.0000,85.0511",
			"license": "<img alt='' src='https://downloads.esri.com/blogs/arcgisonline/esrilogo_new.png' />This work is licensed under the Esri Master License Agreement. <br /><div><a href='https://goto.arcgis.com/termsofuse/viewsummary' target='_blank'><b>View Summary</b></a> | <a href='https://goto.arcgis.com/termsofuse/viewtermsofuse' target='_blank'><b>View Terms of Use</b></a> </div><div><span style='line-height: 16.05px;'><br /></span></div><div><font color='#b22222'>Important Note:</font> This item requires an ArcGIS Online organizational subscription or an ArcGIS Developer account and does not consume credits. To access this item, you'll need to do one of the following: </div><div><ul><li>Sign in with an account that is a member of an organizational subscription </li><li>Sign in with a developer account </li><li><a href='https://goto.arcgis.com/termsofuse/registeranapplication' target='_blank'>Register an application</a> and use your application's credentials.</li></ul>If you don't have an account, you can sign up for a <a href='https://goto.arcgis.com/features/trial' target='_blank'>free trial of ArcGIS</a> or a <a href='https://goto.arcgis.com/developers/signup' target='_blank'>free ArcGIS Developer account</a>.</div>",
			"distribution": [
				{
					"@type": "dcat:Distribution",
					"title": "ArcGIS Hub Dataset",
					"format": "Web Page",
					"mediaType": "text/html",
					"accessURL": "https://www.pacificgeoportal.com/datasets/esri::terrain-elevation-tinted-hillshade-1"
				},
				{
					"@type": "dcat:Distribution",
					"title": "ArcGIS GeoService",
					"format": "ArcGIS GeoServices REST API",
					"mediaType": "application/json",
					"accessURL": "https://elevation.arcgis.com/arcgis/rest/services/WorldElevation/Terrain/ImageServer"
				}
			],
			"theme": [
				"geospatial"
			]
		},
		{
			"@type": "dcat:Dataset",
			"identifier": "https://www.arcgis.com/home/item.html?id=f513ac256fbe48f091b53182190a7d35",
			"landingPage": "https://www.pacificgeoportal.com/datasets/esri::terrain-dark-multi-directional-hillshade",
			"title": "Terrain: Dark Multi-Directional Hillshade",
			"description": "<p><span style='background-image:initial; background-position:initial; background-size:initial; background-repeat:initial; background-attachment:initial; background-origin:initial; background-clip:initial;'>This map provides\na darker version of multi-directional hillshade<span>, </span>generated dynamically using a server-side\ncustom function<span> </span>on the<span> World Elevation </span></span><a href='https://www.arcgis.com/home/item.html?id=58a541efc59545e6b7137f961d7de883' rel='nofollow ugc' target='_blank'><span style='background-image:initial; background-position:initial; background-size:initial; background-repeat:initial; background-attachment:initial; background-origin:initial; background-clip:initial;'>Terrain layer</span></a><span style='background-image:initial; background-position:initial; background-size:initial; background-repeat:initial; background-attachment:initial; background-origin:initial; background-clip:initial;'>. It complements the lighter version of </span><span style='background-image:initial; background-position:initial; background-size:initial; background-repeat:initial; background-attachment:initial; background-origin:initial; background-clip:initial;'><a href='https://www.arcgis.com/home/item.html?id=3cedfc19d7b941d89ee15b0e2f454070' rel='nofollow ugc' target='_blank'>Multi-Directional Hillshade function</a>. The z factor is varied based on scale to\ngenerate an appropriate visualization at all scales. This layer is useful for\nvisualization of the Terrain and is suitable to use as backdrop for thematic\ncontent in web applications and maps.</span></p><p><span style='background-image:initial; background-position:initial; background-size:initial; background-repeat:initial; background-attachment:initial; background-origin:initial; background-clip:initial;'>For more information about uses, refer <a href='https://www.esri.com/arcgis-blog/products/arcgis-living-atlas/mapping/introducing-dark-hillshade/' rel='nofollow ugc' target='_blank'>Introducing Dark Hillshade</a>.<br /></span></p>\n\n<p style='background-image:initial; background-position:initial; background-size:initial; background-repeat:initial; background-attachment:initial; background-origin:initial; background-clip:initial;'><font size='4'>What can you do with this layer?</font></p>\n\n<p style='background-image:initial; background-position:initial; background-size:initial; background-repeat:initial; background-attachment:initial; background-origin:initial; background-clip:initial;'><b>Use for Visualization:</b><span> </span>Yes. Dark Multi-Directional Hillshade provides a quick\nindication of the shape of the terrain at a range of map scales. The image\nservice can be added to web applications or other maps to enhance contextual\nunderstanding. <br /></p><p style='background-image:initial; background-position:initial; background-size:initial; background-repeat:initial; background-attachment:initial; background-origin:initial; background-clip:initial;'><span style='font-size:10.5pt; font-family:&quot;Lucida Sans Unicode&quot;,sans-serif; color:#4D4D4D;'></span></p>\n\n<p style='background-image:initial; background-position:initial; background-size:initial; background-repeat:initial; background-attachment:initial; background-origin:initial; background-clip:initial;'><b>Use for Analysis:</b><span> </span>No. A hillshade is generally\nnot used for analysis.<br /></p><p style='background-image:initial; background-position:initial; background-size:initial; background-repeat:initial; background-attachment:initial; background-origin:initial; background-clip:initial;'><b>Note:</b> If you intend\nto use it as basemap, consider using the tiled version of this service i.e. <a href='https://www.arcgis.com/home/item.html?id=428539ef9cab4017b69d15a40a9ee98b' rel='nofollow ugc' style=''>World\nHillshade (Dark)</a>, which provides fast and performant rendering.<font color='#4d4d4d'><span style='font-size:10.5pt;'></span></font></p>\n\n<p style='margin-bottom:0in; margin-bottom:.0001pt;'><span style='background-image:initial; background-position:initial; background-size:initial; background-repeat:initial; background-attachment:initial; background-origin:initial; background-clip:initial;'><b>Data Sources and Coverage:</b></span><span style='background-image:initial; background-position:initial; background-size:initial; background-repeat:initial; background-attachment:initial; background-origin:initial; background-clip:initial;'> This layer is compiled from a variety of best available sources from several data providers. To see the coverage and extents of various datasets comprising this service in an interactive map, see </span><span style='background-image:initial; background-position:initial; background-size:initial; background-repeat:initial; background-attachment:initial; background-origin:initial; background-clip:initial;'><a href='https://www.arcgis.com/home/item.html?id=3af669838f594b378f90c10f98e46a7f' rel='nofollow ugc' target='_blank'>Elevation Coverage Map</a></span><span style='background-image:initial; background-position:initial; background-size:initial; background-repeat:initial; background-attachment:initial; background-origin:initial; background-clip:initial;'>.</span><br /></p><p style='margin-bottom:0in; margin-bottom:.0001pt;'><br /></p><p style='margin-bottom:0in; margin-bottom:.0001pt;'>This layer is part of a larger collection of <a href='https://www.arcgis.com/home/group.html?owner=esri&amp;title=Elevation%20Layers' rel='nofollow ugc' target='_blank'>elevation layers</a> that you can use to perform a variety of\nmapping analysis tasks.<br /></p>",
			"keyword": [
				"DEM",
				"Elevation",
				"land",
				"topography",
				"hillshade",
				"esri_elevation",
				"world_elevation",
				"world elevation",
				"dark",
				"multi-directional",
				"multidirectional"
			],
			"issued": "2018-11-02T03:50:50.000Z",
			"modified": "2024-04-05T03:22:27.000Z",
			"publisher": {
				"name": "Esri"
			},
			"contactPoint": {
				"@type": "vcard:Contact",
				"fn": "esri",
				"hasEmail": "{{orgContactEmail}}"
			},
			"accessLevel": "public",
			"spatial": "-180.0000,-85.0511,180.0000,85.0511",
			"license": "<img alt='' src='https://downloads.esri.com/blogs/arcgisonline/esrilogo_new.png' />This work is licensed under the Esri Master License Agreement. <br /><div><a href='https://goto.arcgis.com/termsofuse/viewsummary' rel='nofollow ugc' target='_blank'><b>View Summary</b></a> | <a href='https://goto.arcgis.com/termsofuse/viewtermsofuse' rel='nofollow ugc' target='_blank'><b>View Terms of Use</b></a> </div><div><span style=''><font color='#b22222'><br /></font></span></div><div><font color='#b22222'>Important Note:</font> This item requires an ArcGIS Online organizational subscription or an ArcGIS Developer account and does not consume credits. To access this item, you'll need to do one of the following:<br /></div><div><ul><li>Sign in with an account that is a member of an organizational subscription </li><li>Sign in with a developer account </li><li><a href='https://goto.arcgis.com/termsofuse/registeranapplication' rel='nofollow ugc' target='_blank'>Register an application</a> and use your application's credentials.</li></ul>If you don't have an account, you can sign up for a <a href='https://goto.arcgis.com/features/trial' rel='nofollow ugc' target='_blank'>free trial of ArcGIS</a> or a <a href='https://goto.arcgis.com/developers/signup' rel='nofollow ugc' target='_blank'>free ArcGIS Developer account</a>.</div>",
			"distribution": [
				{
					"@type": "dcat:Distribution",
					"title": "ArcGIS Hub Dataset",
					"format": "Web Page",
					"mediaType": "text/html",
					"accessURL": "https://www.pacificgeoportal.com/datasets/esri::terrain-dark-multi-directional-hillshade"
				},
				{
					"@type": "dcat:Distribution",
					"title": "ArcGIS GeoService",
					"format": "ArcGIS GeoServices REST API",
					"mediaType": "application/json",
					"accessURL": "https://elevation.arcgis.com/arcgis/rest/services/WorldElevation/Terrain/ImageServer"
				}
			],
			"theme": [
				"geospatial"
			]
		},
		{
			"@type": "dcat:Dataset",
			"identifier": "https://www.arcgis.com/home/item.html?id=63fe6ad86c3d4536a3c44a0fbad0045e",
			"landingPage": "https://www.pacificgeoportal.com/datasets/esri::terrain-aspect-map-1",
			"title": "Terrain: Aspect Map",
			"description": "<div><span style='line-height: 1.4142;'>This map provides a\ncolorized representation of aspect, generated dynamically using the server-side\naspect function on the Terrain service. The orientation of the downward sloping\nterrain (0° – 360°) is indicated by different colors, rotating from green (North)\nto blue (East), to magenta (South) to orange (West).  Flat areas having no down slope direction are\ngiven a value of 361° and rendered as gray. This service can be used for\nvisualization or analysis. </span></div><div><span style='line-height: 1.4142;'><br /></span></div><div><div><img alt='' src='https://downloads.esri.com/esri_content_doc/landscape/AspectMapLegendPie_V7b.png' /></div><div><div><br /></div><div>If you require access to numeric (float) aspect values, use the <a href='https://www.arcgis.com/home/item.html?id=9c426279db0e42559e947321b34bf1cd' target='_blank' rel='nofollow ugc noopener noreferrer'>Terrain: Aspect layer</a>, which returns orientation values from 0 to 360 degrees. <br /></div><div><br /></div><div><div><font size='4'>What can you do with this layer?</font></div><div><br /></div><div><b>Use for Visualization:</b>  Yes. This colorized aspect map is appropriate for visualizing\nthe downslope direction of the terrain. This layer can be added to applications\nor maps to enhance contextual understanding.<br /></div><p style='margin: 12pt 0in; line-height: 18pt; background-image: initial; background-position: initial; background-size: initial; background-repeat: initial; background-attachment: initial; background-origin: initial; background-clip: initial;'></p><div><b>Use for Analysis:</b>  Yes.  8 bit color values\nreturned by this service represent integer aspect values. For float values, use the <a href='https://www.arcgis.com/home/item.html?id=9c426279db0e42559e947321b34bf1cd' target='_blank' rel='nofollow ugc noopener noreferrer'>Terrain: Aspect layer</a>.<br /></div><div><br /></div><div>For more details such as Data\nSources, Mosaic method used in this layer, please see the <a href='https://www.arcgis.com/home/item.html?id=58a541efc59545e6b7137f961d7de883' target='_blank' rel='nofollow ugc noopener noreferrer'>Terrain layer</a>. This layer allows query, identify, and\nexport image requests. The layer is restricted to a 5,000 x 5,000 pixel limit\nin a single export image request.<br /></div><div><p style='background-image: initial; background-position: initial; background-size: initial; background-repeat: initial; background-attachment: initial; background-origin: initial; background-clip: initial;'>\n\n</p><p style='margin: 0in 0in 0.0001pt; background-image: initial; background-position: initial; background-size: initial; background-repeat: initial; background-attachment: initial; background-origin: initial; background-clip: initial;'>This layer is part of a larger collection of <a href='https://www.arcgis.com/home/group.html?owner=esri&amp;title=Elevation%20Layers' style='' target='_blank' rel='nofollow ugc noopener noreferrer'>elevation layers</a> that you can use to perform a variety\nof mapping analysis tasks.</p></div></div></div></div>",
			"keyword": [
				"DEM",
				"Elevation",
				"land",
				"topography",
				"aspect",
				"esri_elevation",
				"landscape",
				"world_elevation",
				"world elevation"
			],
			"issued": "2013-12-30T23:18:32.000Z",
			"modified": "2024-04-05T03:21:58.000Z",
			"publisher": {
				"name": "Esri"
			},
			"contactPoint": {
				"@type": "vcard:Contact",
				"fn": "esri",
				"hasEmail": "{{orgContactEmail}}"
			},
			"accessLevel": "public",
			"spatial": "-180.0000,-89.0000,180.0000,85.0511",
			"license": "<img alt='' src='https://downloads.esri.com/blogs/arcgisonline/esrilogo_new.png' />This work is licensed under the Esri Master License Agreement. <br /><div><a href='https://goto.arcgis.com/termsofuse/viewsummary' target='_blank' rel='nofollow ugc noopener noreferrer'><b>View Summary</b></a> | <a href='https://goto.arcgis.com/termsofuse/viewtermsofuse' target='_blank' rel='nofollow ugc noopener noreferrer'><b>View Terms of Use</b></a> </div><div><span style='line-height: 16.05px;'><br /></span></div><div><font color='#b22222'>Important Note:</font> This item requires an ArcGIS Online organizational subscription or an ArcGIS Developer account and does not consume credits. To access this item, you'll need to do one of the following: </div><div><ul><li>Sign in with an account that is a member of an organizational subscription </li><li>Sign in with a developer account </li><li><a href='https://goto.arcgis.com/termsofuse/registeranapplication' target='_blank' rel='nofollow ugc noopener noreferrer'>Register an application</a> and use your application's credentials.</li></ul>If you don't have an account, you can sign up for a <a href='https://goto.arcgis.com/features/trial' target='_blank' rel='nofollow ugc noopener noreferrer'>free trial of ArcGIS</a> or a <a href='https://goto.arcgis.com/developers/signup' target='_blank' rel='nofollow ugc noopener noreferrer'>free ArcGIS Developer account</a>.</div>",
			"distribution": [
				{
					"@type": "dcat:Distribution",
					"title": "ArcGIS Hub Dataset",
					"format": "Web Page",
					"mediaType": "text/html",
					"accessURL": "https://www.pacificgeoportal.com/datasets/esri::terrain-aspect-map-1"
				},
				{
					"@type": "dcat:Distribution",
					"title": "ArcGIS GeoService",
					"format": "ArcGIS GeoServices REST API",
					"mediaType": "application/json",
					"accessURL": "https://elevation.arcgis.com/arcgis/rest/services/WorldElevation/Terrain/ImageServer"
				}
			],
			"theme": [
				"geospatial"
			]
		},
		{
			"@type": "dcat:Dataset",
			"identifier": "https://www.arcgis.com/home/item.html?id=58a541efc59545e6b7137f961d7de883",
			"landingPage": "https://www.pacificgeoportal.com/datasets/esri::terrain",
			"title": "Terrain",
			"description": "<p>This dynamic World Elevation Terrain service provides numeric values representing ground surface heights, based on a digital terrain model (DTM). The ground heights are based on multiple sources. Heights are orthometric (sea level = 0), and water bodies that are above sea level have approximated nominal water heights.</p><p><font size='4'>What can you do with this layer?</font></p><p><b>Use for Visualization:</b> This layer is generally not optimal for direct visualization. By default, 32 bit floating point values are returned, resulting in higher bandwidth requirements. Therefore, usage should be limited to applications requiring elevation data values. Alternatively, client applications can select from numerous additional functions, applied on the server, that return rendered data. For visualizations such as <a href='https://www.arcgis.com/home/item.html?id=3cedfc19d7b941d89ee15b0e2f454070' target='_blank' rel='nofollow ugc noopener noreferrer'>multi-directional hillshade</a>, <a href='https://www.arcgis.com/home/item.html?id=c3587bd89d474dff8d306fefdc295083' target='_blank' rel='nofollow ugc noopener noreferrer'>hillshade</a>, <a href='https://www.arcgis.com/home/item.html?id=2729e694b9b34738a59075aed367dedd' target='_blank' rel='nofollow ugc noopener noreferrer'>elevation tinted hillshade</a>, and <a href='https://www.arcgis.com/home/item.html?id=a1ba14d09df14f42ad6ca3c4bcebf3b4' target='_blank' rel='nofollow ugc noopener noreferrer'>slope</a>, consider using the appropriate server-side function defined on this service.</p><p><b>Use for Analysis:</b> Yes. This layer provides data as floating point elevation values suitable for use in analysis.</p><p><b><span style='background-image:initial; background-position:initial; background-size:initial; background-repeat:initial; background-attachment:initial; background-origin:initial; background-clip:initial;'>Note:</span> </b>This image services\ncombine data from different sources and resample the data dynamically to the\nrequested projection, extent and pixel size. For analyses using ArcGIS Desktop,\nyou can filter a dataset, specify the projection, extent and cell size using\nthe <a href='https://pro.arcgis.com/en/pro-app/tool-reference/data-management/make-image-server-layer.htm' rel='nofollow ugc'>Make\nImage Server Layer</a> geoprocessing tool.<br /></p><p style='margin:12pt 0in; background-image:initial; background-position:initial; background-size:initial; background-repeat:initial; background-attachment:initial; background-origin:initial; background-clip:initial;'><span style='background-image:initial; background-position:initial; background-size:initial; background-repeat:initial; background-attachment:initial; background-origin:initial; background-clip:initial;'><b>Server Functions:</b></span><span style='background-image:initial; background-position:initial; background-size:initial; background-repeat:initial; background-attachment:initial; background-origin:initial; background-clip:initial;'> This layer has server functions defined for the following\nelevation derivatives. In ArcGIS desktop, server function can be invoked from\nLayer Properties - Processing Templates.</span></p><p>\n\n</p><ul>\n <li><a href='https://www.arcgis.com/home/item.html?id=af25a795273440deb449b336543602be' rel='nofollow ugc'>Slope\n     Degrees</a></li>\n <li><a href='https://www.arcgis.com/home/item.html?id=304e82c39ca14273b41c26f07e692e93' target='_blank' rel='nofollow ugc noopener noreferrer'>Slope Percent</a><br /></li>\n <li><a href='https://www.arcgis.com/home/item.html?id=9c426279db0e42559e947321b34bf1cd' rel='nofollow ugc'>Aspect</a></li>\n <li><a href='https://www.arcgis.com/home/item.html?id=2f88233f9ed54ea5ad78113061453b8a' rel='nofollow ugc'>Ellipsoidal\n     height</a></li>\n <li><a href='https://www.arcgis.com/home/item.html?id=c3587bd89d474dff8d306fefdc295083' rel='nofollow ugc'>Hillshade</a></li>\n <li><a href='https://www.arcgis.com/home/item.html?id=3cedfc19d7b941d89ee15b0e2f454070' rel='nofollow ugc'>Multi-Directional\n     Hillshade</a></li>\n <li><a href='https://www.arcgis.com/home/item.html?id=f513ac256fbe48f091b53182190a7d35' rel='nofollow ugc'>Dark\n     Multi-Directional Hillshade</a></li>\n <li><a href='https://www.arcgis.com/home/item.html?id=2729e694b9b34738a59075aed367dedd' rel='nofollow ugc'>Elevation\n     Tinted Hillshade</a></li>\n <li><a href='https://www.arcgis.com/home/item.html?id=a1ba14d09df14f42ad6ca3c4bcebf3b4' rel='nofollow ugc'>Slope\n     Map</a></li>\n <li><a href='https://www.arcgis.com/home/item.html?id=63fe6ad86c3d4536a3c44a0fbad0045e' rel='nofollow ugc'>Aspect\n     Map</a><font color='#4d4d4d'><span style='font-size:10.5pt;'></span></font></li>\n</ul><p></p><div><img src='https://downloads.esri.com/esri_content_doc/landscape/ElevBanner2.png' /><br /></div><div><div><p style='margin-bottom:0in; margin-bottom:.0001pt;'><span style='background-image:initial; background-position:initial; background-size:initial; background-repeat:initial; background-attachment:initial; background-origin:initial; background-clip:initial;'><b>Data Sources and Coverage:</b></span><span style='background-image:initial; background-position:initial; background-size:initial; background-repeat:initial; background-attachment:initial; background-origin:initial; background-clip:initial;'> This layer is compiled from a variety of best\navailable sources from several data providers. To see the coverage and extents of\nvarious datasets comprising this service in an interactive map, see </span><span style='background-image:initial; background-position:initial; background-size:initial; background-repeat:initial; background-attachment:initial; background-origin:initial; background-clip:initial;'><a href='https://www.arcgis.com/home/item.html?id=3af669838f594b378f90c10f98e46a7f' target='_blank' rel='nofollow ugc noopener noreferrer'>Elevation Coverage Map</a></span><span style='background-image:initial; background-position:initial; background-size:initial; background-repeat:initial; background-attachment:initial; background-origin:initial; background-clip:initial;'>.</span><span style='font-family:Arial, sans-serif; background-image:initial; background-position:initial; background-size:initial; background-repeat:initial; background-attachment:initial; background-origin:initial; background-clip:initial;'></span></p></div><div><b><br /></b></div><div><div><b>Mosaic Method:</b> This image service uses a default mosaic method of &quot;By Attribute”, using Field 'Best' and target of 0. Each of the rasters has been attributed with ‘Best’ field value that is generally a function of the pixel size such that higher resolution datasets are displayed at higher priority. Other mosaic methods can be set, but care should be taken as the order of the rasters may change. Where required, queries can also be set to display only specific datasets such as only NED or the lock raster mosaic rule used to lock to a specific dataset.<br /></div></div></div><div><br /></div><div><div><b>Accuracy:</b> The accuracy of these services will vary as a function of location and data source. Please refer to the metadata available in the services, and follow the links to the original sources for further details. An estimate of CE90 and LE90 are included as attributes, <span style='background-image:initial; background-position:initial; background-size:initial; background-repeat:initial; background-attachment:initial; background-origin:initial; background-clip:initial;'>where available.</span></div><div><br /></div><div>This layer allows query, identify, and export image requests. The layer is restricted to a 5,000 x 5,000 pixel limit in a single request.</div><div><br /></div><div>This layer is part of a larger collection of <a href='https://www.arcgis.com/home/group.html?owner=esri&amp;title=Elevation%20Layers' target='_blank' rel='nofollow ugc noopener noreferrer'>elevation layers</a> that you can use to perform a variety of mapping analysis tasks.</div></div>",
			"keyword": [
				"DEM",
				"Elevation",
				"land",
				"topography",
				"esri_elevation",
				"world_elevation",
				"world elevation",
				"DTM",
				"slope",
				"aspect",
				"multidirectional",
				"multi-directional",
				"hillshade",
				"bare earth"
			],
			"issued": "2013-07-04T19:32:39.000Z",
			"modified": "2024-04-05T03:21:55.000Z",
			"publisher": {
				"name": "Esri"
			},
			"contactPoint": {
				"@type": "vcard:Contact",
				"fn": "esri_elevation",
				"hasEmail": "{{orgContactEmail}}"
			},
			"accessLevel": "public",
			"spatial": "-180.0000,-89.0000,180.0000,85.0511",
			"license": "<img alt='' src='https://downloads.esri.com/blogs/arcgisonline/esrilogo_new.png' />This work is licensed under the Esri Master License Agreement. <br /><div><a href='https://goto.arcgis.com/termsofuse/viewsummary' target='_blank' rel='nofollow ugc noopener noreferrer'><b>View Summary</b></a> | <a href='https://goto.arcgis.com/termsofuse/viewtermsofuse' target='_blank' rel='nofollow ugc noopener noreferrer'><b>View Terms of Use</b></a> </div><div><span style='line-height: 16.05px;'><br /></span></div><div><font color='#b22222'>Important Note:</font> This item requires an ArcGIS Online organizational subscription or an ArcGIS Developer account and does not consume credits. To access this item, you'll need to do one of the following: </div><div><ul><li>Sign in with an account that is a member of an organizational subscription </li><li>Sign in with a developer account </li><li><a href='https://goto.arcgis.com/termsofuse/registeranapplication' target='_blank' rel='nofollow ugc noopener noreferrer'>Register an application</a> and use your application's credentials.</li></ul>If you don't have an account, you can sign up for a <a href='https://goto.arcgis.com/features/trial' target='_blank' rel='nofollow ugc noopener noreferrer'>free trial of ArcGIS</a> or a <a href='https://goto.arcgis.com/developers/signup' target='_blank' rel='nofollow ugc noopener noreferrer'>free ArcGIS Developer account</a>.</div>",
			"distribution": [
				{
					"@type": "dcat:Distribution",
					"title": "ArcGIS Hub Dataset",
					"format": "Web Page",
					"mediaType": "text/html",
					"accessURL": "https://www.pacificgeoportal.com/datasets/esri::terrain"
				},
				{
					"@type": "dcat:Distribution",
					"title": "ArcGIS GeoService",
					"format": "ArcGIS GeoServices REST API",
					"mediaType": "application/json",
					"accessURL": "https://elevation.arcgis.com/arcgis/rest/services/WorldElevation/Terrain/ImageServer"
				}
			],
			"theme": [
				"geospatial"
			]
		},
		{
			"@type": "dcat:Dataset",
			"identifier": "https://www.arcgis.com/home/item.html?id=898f58f2ee824b3c97bae0698563a4b3",
			"landingPage": "https://www.pacificgeoportal.com/maps/898f58f2ee824b3c97bae0698563a4b3",
			"title": "{{name}}",
			"description": "{{description}}",
			"keyword": [
				"basemap",
				"esri_basemap",
				"world",
				"global",
				"imagery",
				"satellite",
				"aerial",
				"community",
				"community basemap",
				"orthophotos",
				"AFA250_base",
				"maps",
				"baseimagery",
				"current",
				"WGS84",
				"GCS",
				"basemap imagery",
				"wkid 4326",
				"wi"
			],
			"issued": "2016-06-13T19:24:08.000Z",
			"modified": "{{modified:toISO}}",
			"publisher": {
				"name": "{{source}}"
			},
			"contactPoint": {
				"@type": "vcard:Contact",
				"fn": "esri",
				"hasEmail": "{{orgContactEmail}}"
			},
			"accessLevel": "public",
			"spatial": "",
			"license": "<p><img src='https://downloads.esri.com/blogs/arcgisonline/esrilogo_new.png' /> This work is licensed under the Esri Master License Agreement.</p><div><a target='_blank' href='https://goto.arcgis.com/termsofuse/viewsummary' rel='nofollow ugc noopener noreferrer'><strong>View Summary</strong></a>&nbsp;|&nbsp;<a target='_blank' href='https://goto.arcgis.com/termsofuse/viewtermsofuse' rel='nofollow ugc noopener noreferrer'><strong>View Terms of Use</strong></a></div><div>&nbsp;</div><div><strong>Export:</strong>&nbsp;This layer is not intended to be used to export tiles for offline.&nbsp;&nbsp;</div>",
			"distribution": [
				{
					"@type": "dcat:Distribution",
					"title": "ArcGIS Hub Dataset",
					"format": "Web Page",
					"mediaType": "text/html",
					"accessURL": "https://www.pacificgeoportal.com/maps/898f58f2ee824b3c97bae0698563a4b3"
				}
			],
			"theme": ""
		},
		{
			"@type": "dcat:Dataset",
			"identifier": "https://www.arcgis.com/home/item.html?id=a66bfb7dd3b14228bf7ba42b138fe2ea",
			"landingPage": "https://www.pacificgeoportal.com/maps/a66bfb7dd3b14228bf7ba42b138fe2ea",
			"title": "{{name}}",
			"description": "{{description}}",
			"keyword": [
				"basemap",
				"imagery",
				"Esri Basemaps",
				"Firefly Imagery",
				"esriFirefly",
				"baseimagery",
				"fly",
				"global",
				"raster"
			],
			"issued": "2018-05-16T17:24:56.000Z",
			"modified": "{{modified:toISO}}",
			"publisher": {
				"name": "{{source}}"
			},
			"contactPoint": {
				"@type": "vcard:Contact",
				"fn": "esri",
				"hasEmail": "{{orgContactEmail}}"
			},
			"accessLevel": "public",
			"spatial": "",
			"license": "<p><img src='https://downloads.esri.com/blogs/arcgisonline/esrilogo_new.png' /> This work is licensed under the Esri Master License Agreement.</p><div><a target='_blank' href='https://goto.arcgis.com/termsofuse/viewsummary' rel='nofollow ugc noopener noreferrer'><strong>View Summary</strong></a>&nbsp;|&nbsp;<a target='_blank' href='https://goto.arcgis.com/termsofuse/viewtermsofuse' rel='nofollow ugc noopener noreferrer'><strong>View Terms of Use</strong></a></div><div>&nbsp;</div><div><strong>Export:</strong>&nbsp;This layer is not intended to be used to export tiles for offline.</div>",
			"distribution": [
				{
					"@type": "dcat:Distribution",
					"title": "ArcGIS Hub Dataset",
					"format": "Web Page",
					"mediaType": "text/html",
					"accessURL": "https://www.pacificgeoportal.com/maps/a66bfb7dd3b14228bf7ba42b138fe2ea"
				}
			],
			"theme": ""
		},
		{
			"@type": "dcat:Dataset",
			"identifier": "https://www.arcgis.com/home/item.html?id=10df2279f9684e4a9f6a7f08febac2a9",
			"landingPage": "https://www.pacificgeoportal.com/maps/esri::world-imagery",
			"title": "World Imagery",
			"description": "<p>World Imagery provides one meter or better satellite and aerial imagery for most of the world’s landmass and lower resolution satellite imagery worldwide. The map is currently comprised of the following sources:</p><ul><li>Worldwide 15-m resolution TerraColor imagery at small and medium map scales.</li><li>Vantor imagery basemap products around the world: Vivid Premium at 15-cm HD resolution for select metropolitan areas, Vivid Advanced 30-cm HD for more than 1,000 metropolitan areas, and Vivid Standard from 1.2-m to 0.6-cm resolution for the most of the world, with 30-cm HD across the United States and parts of Western Europe. More information on the Vantor products is included below.&nbsp;</li><li>High-resolution aerial photography contributed by the GIS User Community. This imagery ranges from 30-cm to 3-cm resolution. You can contribute your imagery to this map and have it served by Esri via the&nbsp;<a target='_blank' href='https://livingatlas.arcgis.com/en/participate/#v=community&amp;subTab=what-to-contribute' rel='nofollow ugc noopener noreferrer'>Community Maps Program</a>.<br />&nbsp;</li></ul><p><span style='font-size:large;'>Vantor Basemap Products</span></p><p>Vivid Premium</p><p>Provides committed image currency in a high-resolution, high-quality image layer over defined metropolitan and high-interest areas across the globe. The product provides 15-cm HD resolution imagery.</p><p>Vivid Advanced</p><p>Provides committed image currency in a high-resolution, high-quality image layer over defined metropolitan and high-interest areas across the globe. The product includes a mix of native 30-cm and 30-cm HD resolution imagery.</p><p>Vivid Standard</p><p>Provides a visually consistent and continuous image layer over large areas through advanced image mosaicking techniques, including tonal balancing and seamline blending across thousands of image strips. Available from 1.2-m down to 30-cm HD.&nbsp;&nbsp;</p><div><a target='_blank' href='https://blog.maxar.com/leading-the-industry/2020/introducing-hd-see-more-do-more-with-high-definition-imagery' rel='nofollow ugc noopener noreferrer'>More on Vantor HD.</a></div><div>&nbsp;</div><div><span style='font-size:large;'>Imagery Updates</span><br />You can use the <a target='_blank' href='https://livingatlas.arcgis.com/wayback/#mapCenter=10.41504%2C17.77096%2C2&amp;mode=updates' rel='nofollow ugc noopener noreferrer'>Updates Mode</a> in the World Imagery Wayback app to learn more about recent and pending updates. Accessing this information requires a user login with an ArcGIS organizational account.</div><div>&nbsp;</div><div><span style='font-size:large;'>Citations</span><br />This layer includes imagery provider, collection date, resolution,&nbsp;accuracy, and source of the imagery. With the Identify tool in ArcGIS Desktop or the ArcGIS Online Map Viewer&nbsp;you can see imagery citations. Citations returned apply only to the available imagery at that location and scale. You may need to zoom in to view the best available imagery. Citations can also be accessed in the&nbsp;<a target='_blank' href='https://www.arcgis.com/home/item.html?id=c03a526d94704bfb839445e80de95495' rel='nofollow ugc noopener noreferrer'>World Imagery with Metadata web map</a>.</div><div>&nbsp;</div><div><span style='font-size:large;'>Use</span><br />You can add this layer to the ArcGIS Online Map Viewer, ArcGIS Desktop, or ArcGIS Pro. To view this layer with a useful reference overlay, open the&nbsp;<a target='_blank' href='https://www.arcgis.com/home/item.html?id=28f49811a6974659988fd279de5ce39f' rel='nofollow ugc noopener noreferrer'>Imagery Hybrid</a>&nbsp;web map.</div><div>&nbsp;</div><div><span style='font-size:large;'>Feedback</span><br />Have you ever seen a problem in the Esri World Imagery Map that you wanted to report? &nbsp;You can use the&nbsp;<a target='_blank' href='https://www.arcgis.com/home/item.html?id=ebdfa4146680410bb952c7d532ea5407' rel='nofollow ugc noopener noreferrer'>Imagery Map Feedback web map</a>&nbsp;to provide comments on issues. The feedback will be reviewed by the ArcGIS Online team and considered for one of our updates.</div><div>&nbsp;</div><div style='background-color:rgb(255, 255, 255); border:0px solid currentcolor; box-sizing:border-box; color:rgb(74, 74, 74); font-family:&quot;Avenir Next&quot;, Avenir, &quot;Helvetica Neue&quot;, sans-serif; font-size:16px; font-style:normal; font-variant-caps:normal; font-variant-ligatures:normal; font-weight:400; letter-spacing:normal; line-height:1.5; text-align:start; text-decoration-color:initial; text-decoration-style:initial; text-indent:0px; text-transform:none; word-spacing:0px;'><span style='font-size:large;'>Need Imagery?</span></div><div style='background-color:rgb(255, 255, 255); border:0px solid currentcolor; box-sizing:border-box; color:rgb(74, 74, 74); font-family:&quot;Avenir Next&quot;, Avenir, &quot;Helvetica Neue&quot;, sans-serif; font-size:16px; font-style:normal; font-variant-caps:normal; font-variant-ligatures:normal; font-weight:400; letter-spacing:normal; line-height:1.5; text-align:start; text-decoration-color:initial; text-decoration-style:initial; text-indent:0px; text-transform:none; word-spacing:0px;'>If you need to access more recent or higher resolution imagery, you can quickly discover, order, and access imagery in the <a style='border:0px solid currentcolor; box-sizing:border-box; color:rgb(0, 97, 155); font-family:inherit; line-height:1.5; text-decoration:none;' target='_blank' href='https://www.esri.com/arcgis-blog/products/arcgis-online/imagery/access-commercial-imagery-in-arcgis' rel='nofollow ugc noopener noreferrer'>Content Store for ArcGIS</a>&nbsp;app.</div><div style='background-color:rgb(255, 255, 255); border:0px solid currentcolor; box-sizing:border-box; color:rgb(74, 74, 74); font-family:&quot;Avenir Next&quot;, Avenir, &quot;Helvetica Neue&quot;, sans-serif; font-size:16px; font-style:normal; font-variant-caps:normal; font-variant-ligatures:normal; font-weight:400; letter-spacing:normal; line-height:1.5; text-align:start; text-decoration-color:initial; text-decoration-style:initial; text-indent:0px; text-transform:none; word-spacing:0px;'><ol><li><a style='border:0px solid currentcolor; box-sizing:border-box; color:rgb(0, 97, 155); font-family:inherit; line-height:1.5; text-decoration:none;' target='_blank' href='https://www.esri.com/arcgis-blog/products/arcgis-online/imagery/access-commercial-imagery-in-arcgis' rel='nofollow ugc noopener noreferrer'>Learn More</a></li><li><a style='border:0px solid currentcolor; box-sizing:border-box; color:rgb(0, 97, 155); font-family:inherit; line-height:1.5; text-decoration:none;' target='_blank' href='https://www.esri.com/en-us/arcgis-marketplace/listing/products/8632a64a287a4232ba44930e2d213e6b' rel='nofollow ugc noopener noreferrer'>Get Access</a></li><li><a style='border:0px solid currentcolor; box-sizing:border-box; color:rgb(0, 97, 155); font-family:inherit; line-height:1.5; text-decoration:none;' target='_blank' href='https://contentstore.skywatch.com/' rel='nofollow ugc noopener noreferrer'>Open App</a></li></ol></div>",
			"keyword": [
				"world",
				"imagery",
				"basemap",
				"satellite",
				"aerial",
				"community",
				"community basemap",
				"orthophotos",
				"esri_basemap"
			],
			"issued": "2009-12-12T19:01:57.000Z",
			"modified": "2026-10-29T15:27:50.000Z",
			"publisher": {
				"name": "Esri"
			},
			"contactPoint": {
				"@type": "vcard:Contact",
				"fn": "esri",
				"hasEmail": "{{orgContactEmail}}"
			},
			"accessLevel": "public",
			"spatial": "-180.0000,-85.0000,180.0000,85.0000",
			"license": "<p><img src='https://downloads.esri.com/blogs/arcgisonline/esrilogo_new.png' /> This work is licensed under the Esri Master License Agreement.</p><div><a target='_blank' href='https://goto.arcgis.com/termsofuse/viewsummary' rel='nofollow ugc noopener noreferrer'><strong>View Summary</strong></a> | <a target='_blank' href='https://goto.arcgis.com/termsofuse/viewtermsofuse' rel='nofollow ugc noopener noreferrer'><strong>View Terms of Use</strong></a></div><div>&nbsp;</div><div><div><strong>Export:</strong> This layer is not intended to be used to export tiles for offline.&nbsp; If you would like to export imagery for offline use in ArcGIS applications, you may use the&nbsp;<a target='_blank' href='https://www.arcgis.com/home/item.html?id=226d23f076da478bba4589e7eae95952' rel='nofollow ugc noopener noreferrer'>World Imagery (for Export)</a>&nbsp;layer, which is intended for this purpose.</div><div>&nbsp;</div><div><strong>Data Collection and Editing:</strong> This layer may be used in various ArcGIS apps to support data collection and editing, with the results used internally or shared with others, as described for these&nbsp;<a target='_blank' href='https://www.arcgis.com/home/item.html?id=8e90a00a0a6845a49262e0b756f57a10' rel='nofollow ugc noopener noreferrer'>use cases</a>.</div></div>",
			"distribution": [
				{
					"@type": "dcat:Distribution",
					"title": "ArcGIS Hub Dataset",
					"format": "Web Page",
					"mediaType": "text/html",
					"accessURL": "https://www.pacificgeoportal.com/maps/esri::world-imagery"
				},
				{
					"@type": "dcat:Distribution",
					"title": "ArcGIS GeoService",
					"format": "ArcGIS GeoServices REST API",
					"mediaType": "application/json",
					"accessURL": "https://services.arcgisonline.com/ArcGIS/rest/services/World_Imagery/MapServer"
				}
			],
			"theme": [
				"geospatial"
			]
		},
		{
			"@type": "dcat:Dataset",
			"identifier": "https://www.arcgis.com/home/item.html?id=10df2279f9684e4a9f6a7f08febac2a9&sublayer=0",
			"landingPage": "https://www.pacificgeoportal.com/datasets/esri::world-imagery",
			"title": "World Imagery",
			"description": "<p>World Imagery provides one meter or better satellite and aerial imagery for most of the world’s landmass and lower resolution satellite imagery worldwide. The map is currently comprised of the following sources:</p><ul><li>Worldwide 15-m resolution TerraColor imagery at small and medium map scales.</li><li>Vantor imagery basemap products around the world: Vivid Premium at 15-cm HD resolution for select metropolitan areas, Vivid Advanced 30-cm HD for more than 1,000 metropolitan areas, and Vivid Standard from 1.2-m to 0.6-cm resolution for the most of the world, with 30-cm HD across the United States and parts of Western Europe. More information on the Vantor products is included below.&nbsp;</li><li>High-resolution aerial photography contributed by the GIS User Community. This imagery ranges from 30-cm to 3-cm resolution. You can contribute your imagery to this map and have it served by Esri via the&nbsp;<a target='_blank' href='https://livingatlas.arcgis.com/en/participate/#v=community&amp;subTab=what-to-contribute' rel='nofollow ugc noopener noreferrer'>Community Maps Program</a>.<br />&nbsp;</li></ul><p><span style='font-size:large;'>Vantor Basemap Products</span></p><p>Vivid Premium</p><p>Provides committed image currency in a high-resolution, high-quality image layer over defined metropolitan and high-interest areas across the globe. The product provides 15-cm HD resolution imagery.</p><p>Vivid Advanced</p><p>Provides committed image currency in a high-resolution, high-quality image layer over defined metropolitan and high-interest areas across the globe. The product includes a mix of native 30-cm and 30-cm HD resolution imagery.</p><p>Vivid Standard</p><p>Provides a visually consistent and continuous image layer over large areas through advanced image mosaicking techniques, including tonal balancing and seamline blending across thousands of image strips. Available from 1.2-m down to 30-cm HD.&nbsp;&nbsp;</p><div><a target='_blank' href='https://blog.maxar.com/leading-the-industry/2020/introducing-hd-see-more-do-more-with-high-definition-imagery' rel='nofollow ugc noopener noreferrer'>More on Vantor HD.</a></div><div>&nbsp;</div><div><span style='font-size:large;'>Imagery Updates</span><br />You can use the <a target='_blank' href='https://livingatlas.arcgis.com/wayback/#mapCenter=10.41504%2C17.77096%2C2&amp;mode=updates' rel='nofollow ugc noopener noreferrer'>Updates Mode</a> in the World Imagery Wayback app to learn more about recent and pending updates. Accessing this information requires a user login with an ArcGIS organizational account.</div><div>&nbsp;</div><div><span style='font-size:large;'>Citations</span><br />This layer includes imagery provider, collection date, resolution,&nbsp;accuracy, and source of the imagery. With the Identify tool in ArcGIS Desktop or the ArcGIS Online Map Viewer&nbsp;you can see imagery citations. Citations returned apply only to the available imagery at that location and scale. You may need to zoom in to view the best available imagery. Citations can also be accessed in the&nbsp;<a target='_blank' href='https://www.arcgis.com/home/item.html?id=c03a526d94704bfb839445e80de95495' rel='nofollow ugc noopener noreferrer'>World Imagery with Metadata web map</a>.</div><div>&nbsp;</div><div><span style='font-size:large;'>Use</span><br />You can add this layer to the ArcGIS Online Map Viewer, ArcGIS Desktop, or ArcGIS Pro. To view this layer with a useful reference overlay, open the&nbsp;<a target='_blank' href='https://www.arcgis.com/home/item.html?id=28f49811a6974659988fd279de5ce39f' rel='nofollow ugc noopener noreferrer'>Imagery Hybrid</a>&nbsp;web map.</div><div>&nbsp;</div><div><span style='font-size:large;'>Feedback</span><br />Have you ever seen a problem in the Esri World Imagery Map that you wanted to report? &nbsp;You can use the&nbsp;<a target='_blank' href='https://www.arcgis.com/home/item.html?id=ebdfa4146680410bb952c7d532ea5407' rel='nofollow ugc noopener noreferrer'>Imagery Map Feedback web map</a>&nbsp;to provide comments on issues. The feedback will be reviewed by the ArcGIS Online team and considered for one of our updates.</div><div>&nbsp;</div><div style='background-color:rgb(255, 255, 255); border:0px solid currentcolor; box-sizing:border-box; color:rgb(74, 74, 74); font-family:&quot;Avenir Next&quot;, Avenir, &quot;Helvetica Neue&quot;, sans-serif; font-size:16px; font-style:normal; font-variant-caps:normal; font-variant-ligatures:normal; font-weight:400; letter-spacing:normal; line-height:1.5; text-align:start; text-decoration-color:initial; text-decoration-style:initial; text-indent:0px; text-transform:none; word-spacing:0px;'><span style='font-size:large;'>Need Imagery?</span></div><div style='background-color:rgb(255, 255, 255); border:0px solid currentcolor; box-sizing:border-box; color:rgb(74, 74, 74); font-family:&quot;Avenir Next&quot;, Avenir, &quot;Helvetica Neue&quot;, sans-serif; font-size:16px; font-style:normal; font-variant-caps:normal; font-variant-ligatures:normal; font-weight:400; letter-spacing:normal; line-height:1.5; text-align:start; text-decoration-color:initial; text-decoration-style:initial; text-indent:0px; text-transform:none; word-spacing:0px;'>If you need to access more recent or higher resolution imagery, you can quickly discover, order, and access imagery in the <a style='border:0px solid currentcolor; box-sizing:border-box; color:rgb(0, 97, 155); font-family:inherit; line-height:1.5; text-decoration:none;' target='_blank' href='https://www.esri.com/arcgis-blog/products/arcgis-online/imagery/access-commercial-imagery-in-arcgis' rel='nofollow ugc noopener noreferrer'>Content Store for ArcGIS</a>&nbsp;app.</div><div style='background-color:rgb(255, 255, 255); border:0px solid currentcolor; box-sizing:border-box; color:rgb(74, 74, 74); font-family:&quot;Avenir Next&quot;, Avenir, &quot;Helvetica Neue&quot;, sans-serif; font-size:16px; font-style:normal; font-variant-caps:normal; font-variant-ligatures:normal; font-weight:400; letter-spacing:normal; line-height:1.5; text-align:start; text-decoration-color:initial; text-decoration-style:initial; text-indent:0px; text-transform:none; word-spacing:0px;'><ol><li><a style='border:0px solid currentcolor; box-sizing:border-box; color:rgb(0, 97, 155); font-family:inherit; line-height:1.5; text-decoration:none;' target='_blank' href='https://www.esri.com/arcgis-blog/products/arcgis-online/imagery/access-commercial-imagery-in-arcgis' rel='nofollow ugc noopener noreferrer'>Learn More</a></li><li><a style='border:0px solid currentcolor; box-sizing:border-box; color:rgb(0, 97, 155); font-family:inherit; line-height:1.5; text-decoration:none;' target='_blank' href='https://www.esri.com/en-us/arcgis-marketplace/listing/products/8632a64a287a4232ba44930e2d213e6b' rel='nofollow ugc noopener noreferrer'>Get Access</a></li><li><a style='border:0px solid currentcolor; box-sizing:border-box; color:rgb(0, 97, 155); font-family:inherit; line-height:1.5; text-decoration:none;' target='_blank' href='https://contentstore.skywatch.com/' rel='nofollow ugc noopener noreferrer'>Open App</a></li></ol></div>",
			"keyword": [
				"world",
				"imagery",
				"basemap",
				"satellite",
				"aerial",
				"community",
				"community basemap",
				"orthophotos",
				"esri_basemap"
			],
			"issued": "2009-12-12T19:01:57.000Z",
			"modified": "2026-10-29T15:27:50.000Z",
			"publisher": {
				"name": "Esri"
			},
			"contactPoint": {
				"@type": "vcard:Contact",
				"fn": "esri",
				"hasEmail": "{{orgContactEmail}}"
			},
			"accessLevel": "public",
			"spatial": "-180.0000,-85.0511,180.0000,85.0511",
			"license": "<p><img src='https://downloads.esri.com/blogs/arcgisonline/esrilogo_new.png' /> This work is licensed under the Esri Master License Agreement.</p><div><a target='_blank' href='https://goto.arcgis.com/termsofuse/viewsummary' rel='nofollow ugc noopener noreferrer'><strong>View Summary</strong></a> | <a target='_blank' href='https://goto.arcgis.com/termsofuse/viewtermsofuse' rel='nofollow ugc noopener noreferrer'><strong>View Terms of Use</strong></a></div><div>&nbsp;</div><div><div><strong>Export:</strong> This layer is not intended to be used to export tiles for offline.&nbsp; If you would like to export imagery for offline use in ArcGIS applications, you may use the&nbsp;<a target='_blank' href='https://www.arcgis.com/home/item.html?id=226d23f076da478bba4589e7eae95952' rel='nofollow ugc noopener noreferrer'>World Imagery (for Export)</a>&nbsp;layer, which is intended for this purpose.</div><div>&nbsp;</div><div><strong>Data Collection and Editing:</strong> This layer may be used in various ArcGIS apps to support data collection and editing, with the results used internally or shared with others, as described for these&nbsp;<a target='_blank' href='https://www.arcgis.com/home/item.html?id=8e90a00a0a6845a49262e0b756f57a10' rel='nofollow ugc noopener noreferrer'>use cases</a>.</div></div>",
			"distribution": [
				{
					"@type": "dcat:Distribution",
					"title": "ArcGIS Hub Dataset",
					"format": "Web Page",
					"mediaType": "text/html",
					"accessURL": "https://www.pacificgeoportal.com/datasets/esri::world-imagery"
				},
				{
					"@type": "dcat:Distribution",
					"title": "ArcGIS GeoService",
					"format": "ArcGIS GeoServices REST API",
					"mediaType": "application/json",
					"accessURL": "https://services.arcgisonline.com/ArcGIS/rest/services/World_Imagery/MapServer/0"
				},
				{
					"@type": "dcat:Distribution",
					"title": "CSV",
					"format": "CSV",
					"mediaType": "text/csv",
					"accessURL": "https://www.pacificgeoportal.com/api/download/v1/items/10df2279f9684e4a9f6a7f08febac2a9/csv?layers=0"
				},
				{
					"@type": "dcat:Distribution",
					"title": "Shapefile",
					"format": "ZIP",
					"mediaType": "application/zip",
					"accessURL": "https://www.pacificgeoportal.com/api/download/v1/items/10df2279f9684e4a9f6a7f08febac2a9/shapefile?layers=0"
				},
				{
					"@type": "dcat:Distribution",
					"title": "GeoJSON",
					"format": "GeoJSON",
					"mediaType": "application/vnd.geo+json",
					"accessURL": "https://www.pacificgeoportal.com/api/download/v1/items/10df2279f9684e4a9f6a7f08febac2a9/geojson?layers=0"
				},
				{
					"@type": "dcat:Distribution",
					"title": "KML",
					"format": "KML",
					"mediaType": "application/vnd.google-earth.kml+xml",
					"accessURL": "https://www.pacificgeoportal.com/api/download/v1/items/10df2279f9684e4a9f6a7f08febac2a9/kml?layers=0"
				}
			],
			"theme": [
				"geospatial"
			]
		},
		{
			"@type": "dcat:Dataset",
			"identifier": "https://www.arcgis.com/home/item.html?id=10df2279f9684e4a9f6a7f08febac2a9&sublayer=1",
			"landingPage": "https://www.pacificgeoportal.com/datasets/esri::low-resolution-15m-imagery",
			"title": "Low Resolution 15m Imagery",
			"description": "<p>World Imagery provides one meter or better satellite and aerial imagery for most of the world’s landmass and lower resolution satellite imagery worldwide. The map is currently comprised of the following sources:</p><ul><li>Worldwide 15-m resolution TerraColor imagery at small and medium map scales.</li><li>Vantor imagery basemap products around the world: Vivid Premium at 15-cm HD resolution for select metropolitan areas, Vivid Advanced 30-cm HD for more than 1,000 metropolitan areas, and Vivid Standard from 1.2-m to 0.6-cm resolution for the most of the world, with 30-cm HD across the United States and parts of Western Europe. More information on the Vantor products is included below.&nbsp;</li><li>High-resolution aerial photography contributed by the GIS User Community. This imagery ranges from 30-cm to 3-cm resolution. You can contribute your imagery to this map and have it served by Esri via the&nbsp;<a target='_blank' href='https://livingatlas.arcgis.com/en/participate/#v=community&amp;subTab=what-to-contribute' rel='nofollow ugc noopener noreferrer'>Community Maps Program</a>.<br />&nbsp;</li></ul><p><span style='font-size:large;'>Vantor Basemap Products</span></p><p>Vivid Premium</p><p>Provides committed image currency in a high-resolution, high-quality image layer over defined metropolitan and high-interest areas across the globe. The product provides 15-cm HD resolution imagery.</p><p>Vivid Advanced</p><p>Provides committed image currency in a high-resolution, high-quality image layer over defined metropolitan and high-interest areas across the globe. The product includes a mix of native 30-cm and 30-cm HD resolution imagery.</p><p>Vivid Standard</p><p>Provides a visually consistent and continuous image layer over large areas through advanced image mosaicking techniques, including tonal balancing and seamline blending across thousands of image strips. Available from 1.2-m down to 30-cm HD.&nbsp;&nbsp;</p><div><a target='_blank' href='https://blog.maxar.com/leading-the-industry/2020/introducing-hd-see-more-do-more-with-high-definition-imagery' rel='nofollow ugc noopener noreferrer'>More on Vantor HD.</a></div><div>&nbsp;</div><div><span style='font-size:large;'>Imagery Updates</span><br />You can use the <a target='_blank' href='https://livingatlas.arcgis.com/wayback/#mapCenter=10.41504%2C17.77096%2C2&amp;mode=updates' rel='nofollow ugc noopener noreferrer'>Updates Mode</a> in the World Imagery Wayback app to learn more about recent and pending updates. Accessing this information requires a user login with an ArcGIS organizational account.</div><div>&nbsp;</div><div><span style='font-size:large;'>Citations</span><br />This layer includes imagery provider, collection date, resolution,&nbsp;accuracy, and source of the imagery. With the Identify tool in ArcGIS Desktop or the ArcGIS Online Map Viewer&nbsp;you can see imagery citations. Citations returned apply only to the available imagery at that location and scale. You may need to zoom in to view the best available imagery. Citations can also be accessed in the&nbsp;<a target='_blank' href='https://www.arcgis.com/home/item.html?id=c03a526d94704bfb839445e80de95495' rel='nofollow ugc noopener noreferrer'>World Imagery with Metadata web map</a>.</div><div>&nbsp;</div><div><span style='font-size:large;'>Use</span><br />You can add this layer to the ArcGIS Online Map Viewer, ArcGIS Desktop, or ArcGIS Pro. To view this layer with a useful reference overlay, open the&nbsp;<a target='_blank' href='https://www.arcgis.com/home/item.html?id=28f49811a6974659988fd279de5ce39f' rel='nofollow ugc noopener noreferrer'>Imagery Hybrid</a>&nbsp;web map.</div><div>&nbsp;</div><div><span style='font-size:large;'>Feedback</span><br />Have you ever seen a problem in the Esri World Imagery Map that you wanted to report? &nbsp;You can use the&nbsp;<a target='_blank' href='https://www.arcgis.com/home/item.html?id=ebdfa4146680410bb952c7d532ea5407' rel='nofollow ugc noopener noreferrer'>Imagery Map Feedback web map</a>&nbsp;to provide comments on issues. The feedback will be reviewed by the ArcGIS Online team and considered for one of our updates.</div><div>&nbsp;</div><div style='background-color:rgb(255, 255, 255); border:0px solid currentcolor; box-sizing:border-box; color:rgb(74, 74, 74); font-family:&quot;Avenir Next&quot;, Avenir, &quot;Helvetica Neue&quot;, sans-serif; font-size:16px; font-style:normal; font-variant-caps:normal; font-variant-ligatures:normal; font-weight:400; letter-spacing:normal; line-height:1.5; text-align:start; text-decoration-color:initial; text-decoration-style:initial; text-indent:0px; text-transform:none; word-spacing:0px;'><span style='font-size:large;'>Need Imagery?</span></div><div style='background-color:rgb(255, 255, 255); border:0px solid currentcolor; box-sizing:border-box; color:rgb(74, 74, 74); font-family:&quot;Avenir Next&quot;, Avenir, &quot;Helvetica Neue&quot;, sans-serif; font-size:16px; font-style:normal; font-variant-caps:normal; font-variant-ligatures:normal; font-weight:400; letter-spacing:normal; line-height:1.5; text-align:start; text-decoration-color:initial; text-decoration-style:initial; text-indent:0px; text-transform:none; word-spacing:0px;'>If you need to access more recent or higher resolution imagery, you can quickly discover, order, and access imagery in the <a style='border:0px solid currentcolor; box-sizing:border-box; color:rgb(0, 97, 155); font-family:inherit; line-height:1.5; text-decoration:none;' target='_blank' href='https://www.esri.com/arcgis-blog/products/arcgis-online/imagery/access-commercial-imagery-in-arcgis' rel='nofollow ugc noopener noreferrer'>Content Store for ArcGIS</a>&nbsp;app.</div><div style='background-color:rgb(255, 255, 255); border:0px solid currentcolor; box-sizing:border-box; color:rgb(74, 74, 74); font-family:&quot;Avenir Next&quot;, Avenir, &quot;Helvetica Neue&quot;, sans-serif; font-size:16px; font-style:normal; font-variant-caps:normal; font-variant-ligatures:normal; font-weight:400; letter-spacing:normal; line-height:1.5; text-align:start; text-decoration-color:initial; text-decoration-style:initial; text-indent:0px; text-transform:none; word-spacing:0px;'><ol><li><a style='border:0px solid currentcolor; box-sizing:border-box; color:rgb(0, 97, 155); font-family:inherit; line-height:1.5; text-decoration:none;' target='_blank' href='https://www.esri.com/arcgis-blog/products/arcgis-online/imagery/access-commercial-imagery-in-arcgis' rel='nofollow ugc noopener noreferrer'>Learn More</a></li><li><a style='border:0px solid currentcolor; box-sizing:border-box; color:rgb(0, 97, 155); font-family:inherit; line-height:1.5; text-decoration:none;' target='_blank' href='https://www.esri.com/en-us/arcgis-marketplace/listing/products/8632a64a287a4232ba44930e2d213e6b' rel='nofollow ugc noopener noreferrer'>Get Access</a></li><li><a style='border:0px solid currentcolor; box-sizing:border-box; color:rgb(0, 97, 155); font-family:inherit; line-height:1.5; text-decoration:none;' target='_blank' href='https://contentstore.skywatch.com/' rel='nofollow ugc noopener noreferrer'>Open App</a></li></ol></div>",
			"keyword": [
				"world",
				"imagery",
				"basemap",
				"satellite",
				"aerial",
				"community",
				"community basemap",
				"orthophotos",
				"esri_basemap"
			],
			"issued": "2009-12-12T19:01:57.000Z",
			"modified": "2026-10-29T15:27:50.000Z",
			"publisher": {
				"name": "Esri"
			},
			"contactPoint": {
				"@type": "vcard:Contact",
				"fn": "esri",
				"hasEmail": "{{orgContactEmail}}"
			},
			"accessLevel": "public",
			"spatial": "-180.0000,-85.0511,180.0000,85.0511",
			"license": "<p><img src='https://downloads.esri.com/blogs/arcgisonline/esrilogo_new.png' /> This work is licensed under the Esri Master License Agreement.</p><div><a target='_blank' href='https://goto.arcgis.com/termsofuse/viewsummary' rel='nofollow ugc noopener noreferrer'><strong>View Summary</strong></a> | <a target='_blank' href='https://goto.arcgis.com/termsofuse/viewtermsofuse' rel='nofollow ugc noopener noreferrer'><strong>View Terms of Use</strong></a></div><div>&nbsp;</div><div><div><strong>Export:</strong> This layer is not intended to be used to export tiles for offline.&nbsp; If you would like to export imagery for offline use in ArcGIS applications, you may use the&nbsp;<a target='_blank' href='https://www.arcgis.com/home/item.html?id=226d23f076da478bba4589e7eae95952' rel='nofollow ugc noopener noreferrer'>World Imagery (for Export)</a>&nbsp;layer, which is intended for this purpose.</div><div>&nbsp;</div><div><strong>Data Collection and Editing:</strong> This layer may be used in various ArcGIS apps to support data collection and editing, with the results used internally or shared with others, as described for these&nbsp;<a target='_blank' href='https://www.arcgis.com/home/item.html?id=8e90a00a0a6845a49262e0b756f57a10' rel='nofollow ugc noopener noreferrer'>use cases</a>.</div></div>",
			"distribution": [
				{
					"@type": "dcat:Distribution",
					"title": "ArcGIS Hub Dataset",
					"format": "Web Page",
					"mediaType": "text/html",
					"accessURL": "https://www.pacificgeoportal.com/datasets/esri::low-resolution-15m-imagery"
				},
				{
					"@type": "dcat:Distribution",
					"title": "ArcGIS GeoService",
					"format": "ArcGIS GeoServices REST API",
					"mediaType": "application/json",
					"accessURL": "https://services.arcgisonline.com/ArcGIS/rest/services/World_Imagery/MapServer/1"
				},
				{
					"@type": "dcat:Distribution",
					"title": "CSV",
					"format": "CSV",
					"mediaType": "text/csv",
					"accessURL": "https://www.pacificgeoportal.com/api/download/v1/items/10df2279f9684e4a9f6a7f08febac2a9/csv?layers=1"
				},
				{
					"@type": "dcat:Distribution",
					"title": "Shapefile",
					"format": "ZIP",
					"mediaType": "application/zip",
					"accessURL": "https://www.pacificgeoportal.com/api/download/v1/items/10df2279f9684e4a9f6a7f08febac2a9/shapefile?layers=1"
				},
				{
					"@type": "dcat:Distribution",
					"title": "GeoJSON",
					"format": "GeoJSON",
					"mediaType": "application/vnd.geo+json",
					"accessURL": "https://www.pacificgeoportal.com/api/download/v1/items/10df2279f9684e4a9f6a7f08febac2a9/geojson?layers=1"
				},
				{
					"@type": "dcat:Distribution",
					"title": "KML",
					"format": "KML",
					"mediaType": "application/vnd.google-earth.kml+xml",
					"accessURL": "https://www.pacificgeoportal.com/api/download/v1/items/10df2279f9684e4a9f6a7f08febac2a9/kml?layers=1"
				}
			],
			"theme": [
				"geospatial"
			]
		},
		{
			"@type": "dcat:Dataset",
			"identifier": "https://www.arcgis.com/home/item.html?id=10df2279f9684e4a9f6a7f08febac2a9&sublayer=10",
			"landingPage": "https://www.pacificgeoportal.com/datasets/esri::60cm-resolution-metadata-114",
			"title": "60cm Resolution Metadata",
			"description": "<p>World Imagery provides one meter or better satellite and aerial imagery for most of the world’s landmass and lower resolution satellite imagery worldwide. The map is currently comprised of the following sources:</p><ul><li>Worldwide 15-m resolution TerraColor imagery at small and medium map scales.</li><li>Vantor imagery basemap products around the world: Vivid Premium at 15-cm HD resolution for select metropolitan areas, Vivid Advanced 30-cm HD for more than 1,000 metropolitan areas, and Vivid Standard from 1.2-m to 0.6-cm resolution for the most of the world, with 30-cm HD across the United States and parts of Western Europe. More information on the Vantor products is included below.&nbsp;</li><li>High-resolution aerial photography contributed by the GIS User Community. This imagery ranges from 30-cm to 3-cm resolution. You can contribute your imagery to this map and have it served by Esri via the&nbsp;<a target='_blank' href='https://livingatlas.arcgis.com/en/participate/#v=community&amp;subTab=what-to-contribute' rel='nofollow ugc noopener noreferrer'>Community Maps Program</a>.<br />&nbsp;</li></ul><p><span style='font-size:large;'>Vantor Basemap Products</span></p><p>Vivid Premium</p><p>Provides committed image currency in a high-resolution, high-quality image layer over defined metropolitan and high-interest areas across the globe. The product provides 15-cm HD resolution imagery.</p><p>Vivid Advanced</p><p>Provides committed image currency in a high-resolution, high-quality image layer over defined metropolitan and high-interest areas across the globe. The product includes a mix of native 30-cm and 30-cm HD resolution imagery.</p><p>Vivid Standard</p><p>Provides a visually consistent and continuous image layer over large areas through advanced image mosaicking techniques, including tonal balancing and seamline blending across thousands of image strips. Available from 1.2-m down to 30-cm HD.&nbsp;&nbsp;</p><div><a target='_blank' href='https://blog.maxar.com/leading-the-industry/2020/introducing-hd-see-more-do-more-with-high-definition-imagery' rel='nofollow ugc noopener noreferrer'>More on Vantor HD.</a></div><div>&nbsp;</div><div><span style='font-size:large;'>Imagery Updates</span><br />You can use the <a target='_blank' href='https://livingatlas.arcgis.com/wayback/#mapCenter=10.41504%2C17.77096%2C2&amp;mode=updates' rel='nofollow ugc noopener noreferrer'>Updates Mode</a> in the World Imagery Wayback app to learn more about recent and pending updates. Accessing this information requires a user login with an ArcGIS organizational account.</div><div>&nbsp;</div><div><span style='font-size:large;'>Citations</span><br />This layer includes imagery provider, collection date, resolution,&nbsp;accuracy, and source of the imagery. With the Identify tool in ArcGIS Desktop or the ArcGIS Online Map Viewer&nbsp;you can see imagery citations. Citations returned apply only to the available imagery at that location and scale. You may need to zoom in to view the best available imagery. Citations can also be accessed in the&nbsp;<a target='_blank' href='https://www.arcgis.com/home/item.html?id=c03a526d94704bfb839445e80de95495' rel='nofollow ugc noopener noreferrer'>World Imagery with Metadata web map</a>.</div><div>&nbsp;</div><div><span style='font-size:large;'>Use</span><br />You can add this layer to the ArcGIS Online Map Viewer, ArcGIS Desktop, or ArcGIS Pro. To view this layer with a useful reference overlay, open the&nbsp;<a target='_blank' href='https://www.arcgis.com/home/item.html?id=28f49811a6974659988fd279de5ce39f' rel='nofollow ugc noopener noreferrer'>Imagery Hybrid</a>&nbsp;web map.</div><div>&nbsp;</div><div><span style='font-size:large;'>Feedback</span><br />Have you ever seen a problem in the Esri World Imagery Map that you wanted to report? &nbsp;You can use the&nbsp;<a target='_blank' href='https://www.arcgis.com/home/item.html?id=ebdfa4146680410bb952c7d532ea5407' rel='nofollow ugc noopener noreferrer'>Imagery Map Feedback web map</a>&nbsp;to provide comments on issues. The feedback will be reviewed by the ArcGIS Online team and considered for one of our updates.</div><div>&nbsp;</div><div style='background-color:rgb(255, 255, 255); border:0px solid currentcolor; box-sizing:border-box; color:rgb(74, 74, 74); font-family:&quot;Avenir Next&quot;, Avenir, &quot;Helvetica Neue&quot;, sans-serif; font-size:16px; font-style:normal; font-variant-caps:normal; font-variant-ligatures:normal; font-weight:400; letter-spacing:normal; line-height:1.5; text-align:start; text-decoration-color:initial; text-decoration-style:initial; text-indent:0px; text-transform:none; word-spacing:0px;'><span style='font-size:large;'>Need Imagery?</span></div><div style='background-color:rgb(255, 255, 255); border:0px solid currentcolor; box-sizing:border-box; color:rgb(74, 74, 74); font-family:&quot;Avenir Next&quot;, Avenir, &quot;Helvetica Neue&quot;, sans-serif; font-size:16px; font-style:normal; font-variant-caps:normal; font-variant-ligatures:normal; font-weight:400; letter-spacing:normal; line-height:1.5; text-align:start; text-decoration-color:initial; text-decoration-style:initial; text-indent:0px; text-transform:none; word-spacing:0px;'>If you need to access more recent or higher resolution imagery, you can quickly discover, order, and access imagery in the <a style='border:0px solid currentcolor; box-sizing:border-box; color:rgb(0, 97, 155); font-family:inherit; line-height:1.5; text-decoration:none;' target='_blank' href='https://www.esri.com/arcgis-blog/products/arcgis-online/imagery/access-commercial-imagery-in-arcgis' rel='nofollow ugc noopener noreferrer'>Content Store for ArcGIS</a>&nbsp;app.</div><div style='background-color:rgb(255, 255, 255); border:0px solid currentcolor; box-sizing:border-box; color:rgb(74, 74, 74); font-family:&quot;Avenir Next&quot;, Avenir, &quot;Helvetica Neue&quot;, sans-serif; font-size:16px; font-style:normal; font-variant-caps:normal; font-variant-ligatures:normal; font-weight:400; letter-spacing:normal; line-height:1.5; text-align:start; text-decoration-color:initial; text-decoration-style:initial; text-indent:0px; text-transform:none; word-spacing:0px;'><ol><li><a style='border:0px solid currentcolor; box-sizing:border-box; color:rgb(0, 97, 155); font-family:inherit; line-height:1.5; text-decoration:none;' target='_blank' href='https://www.esri.com/arcgis-blog/products/arcgis-online/imagery/access-commercial-imagery-in-arcgis' rel='nofollow ugc noopener noreferrer'>Learn More</a></li><li><a style='border:0px solid currentcolor; box-sizing:border-box; color:rgb(0, 97, 155); font-family:inherit; line-height:1.5; text-decoration:none;' target='_blank' href='https://www.esri.com/en-us/arcgis-marketplace/listing/products/8632a64a287a4232ba44930e2d213e6b' rel='nofollow ugc noopener noreferrer'>Get Access</a></li><li><a style='border:0px solid currentcolor; box-sizing:border-box; color:rgb(0, 97, 155); font-family:inherit; line-height:1.5; text-decoration:none;' target='_blank' href='https://contentstore.skywatch.com/' rel='nofollow ugc noopener noreferrer'>Open App</a></li></ol></div>",
			"keyword": [
				"world",
				"imagery",
				"basemap",
				"satellite",
				"aerial",
				"community",
				"community basemap",
				"orthophotos",
				"esri_basemap"
			],
			"issued": "2009-12-12T19:01:57.000Z",
			"modified": "2026-10-29T15:27:50.000Z",
			"publisher": {
				"name": "Esri"
			},
			"contactPoint": {
				"@type": "vcard:Contact",
				"fn": "esri",
				"hasEmail": "{{orgContactEmail}}"
			},
			"accessLevel": "public",
			"spatial": "-180.0000,-85.0511,180.0000,85.0511",
			"license": "<p><img src='https://downloads.esri.com/blogs/arcgisonline/esrilogo_new.png' /> This work is licensed under the Esri Master License Agreement.</p><div><a target='_blank' href='https://goto.arcgis.com/termsofuse/viewsummary' rel='nofollow ugc noopener noreferrer'><strong>View Summary</strong></a> | <a target='_blank' href='https://goto.arcgis.com/termsofuse/viewtermsofuse' rel='nofollow ugc noopener noreferrer'><strong>View Terms of Use</strong></a></div><div>&nbsp;</div><div><div><strong>Export:</strong> This layer is not intended to be used to export tiles for offline.&nbsp; If you would like to export imagery for offline use in ArcGIS applications, you may use the&nbsp;<a target='_blank' href='https://www.arcgis.com/home/item.html?id=226d23f076da478bba4589e7eae95952' rel='nofollow ugc noopener noreferrer'>World Imagery (for Export)</a>&nbsp;layer, which is intended for this purpose.</div><div>&nbsp;</div><div><strong>Data Collection and Editing:</strong> This layer may be used in various ArcGIS apps to support data collection and editing, with the results used internally or shared with others, as described for these&nbsp;<a target='_blank' href='https://www.arcgis.com/home/item.html?id=8e90a00a0a6845a49262e0b756f57a10' rel='nofollow ugc noopener noreferrer'>use cases</a>.</div></div>",
			"distribution": [
				{
					"@type": "dcat:Distribution",
					"title": "ArcGIS Hub Dataset",
					"format": "Web Page",
					"mediaType": "text/html",
					"accessURL": "https://www.pacificgeoportal.com/datasets/esri::60cm-resolution-metadata-114"
				},
				{
					"@type": "dcat:Distribution",
					"title": "ArcGIS GeoService",
					"format": "ArcGIS GeoServices REST API",
					"mediaType": "application/json",
					"accessURL": "https://services.arcgisonline.com/ArcGIS/rest/services/World_Imagery/MapServer/10"
				},
				{
					"@type": "dcat:Distribution",
					"title": "CSV",
					"format": "CSV",
					"mediaType": "text/csv",
					"accessURL": "https://www.pacificgeoportal.com/api/download/v1/items/10df2279f9684e4a9f6a7f08febac2a9/csv?layers=10"
				},
				{
					"@type": "dcat:Distribution",
					"title": "Shapefile",
					"format": "ZIP",
					"mediaType": "application/zip",
					"accessURL": "https://www.pacificgeoportal.com/api/download/v1/items/10df2279f9684e4a9f6a7f08febac2a9/shapefile?layers=10"
				},
				{
					"@type": "dcat:Distribution",
					"title": "GeoJSON",
					"format": "GeoJSON",
					"mediaType": "application/vnd.geo+json",
					"accessURL": "https://www.pacificgeoportal.com/api/download/v1/items/10df2279f9684e4a9f6a7f08febac2a9/geojson?layers=10"
				},
				{
					"@type": "dcat:Distribution",
					"title": "KML",
					"format": "KML",
					"mediaType": "application/vnd.google-earth.kml+xml",
					"accessURL": "https://www.pacificgeoportal.com/api/download/v1/items/10df2279f9684e4a9f6a7f08febac2a9/kml?layers=10"
				}
			],
			"theme": [
				"geospatial"
			]
		},
		{
			"@type": "dcat:Dataset",
			"identifier": "https://www.arcgis.com/home/item.html?id=10df2279f9684e4a9f6a7f08febac2a9&sublayer=11",
			"landingPage": "https://www.pacificgeoportal.com/datasets/esri::1-2m-resolution-metadata-114",
			"title": "1.2m Resolution Metadata",
			"description": "<p>World Imagery provides one meter or better satellite and aerial imagery for most of the world’s landmass and lower resolution satellite imagery worldwide. The map is currently comprised of the following sources:</p><ul><li>Worldwide 15-m resolution TerraColor imagery at small and medium map scales.</li><li>Vantor imagery basemap products around the world: Vivid Premium at 15-cm HD resolution for select metropolitan areas, Vivid Advanced 30-cm HD for more than 1,000 metropolitan areas, and Vivid Standard from 1.2-m to 0.6-cm resolution for the most of the world, with 30-cm HD across the United States and parts of Western Europe. More information on the Vantor products is included below.&nbsp;</li><li>High-resolution aerial photography contributed by the GIS User Community. This imagery ranges from 30-cm to 3-cm resolution. You can contribute your imagery to this map and have it served by Esri via the&nbsp;<a target='_blank' href='https://livingatlas.arcgis.com/en/participate/#v=community&amp;subTab=what-to-contribute' rel='nofollow ugc noopener noreferrer'>Community Maps Program</a>.<br />&nbsp;</li></ul><p><span style='font-size:large;'>Vantor Basemap Products</span></p><p>Vivid Premium</p><p>Provides committed image currency in a high-resolution, high-quality image layer over defined metropolitan and high-interest areas across the globe. The product provides 15-cm HD resolution imagery.</p><p>Vivid Advanced</p><p>Provides committed image currency in a high-resolution, high-quality image layer over defined metropolitan and high-interest areas across the globe. The product includes a mix of native 30-cm and 30-cm HD resolution imagery.</p><p>Vivid Standard</p><p>Provides a visually consistent and continuous image layer over large areas through advanced image mosaicking techniques, including tonal balancing and seamline blending across thousands of image strips. Available from 1.2-m down to 30-cm HD.&nbsp;&nbsp;</p><div><a target='_blank' href='https://blog.maxar.com/leading-the-industry/2020/introducing-hd-see-more-do-more-with-high-definition-imagery' rel='nofollow ugc noopener noreferrer'>More on Vantor HD.</a></div><div>&nbsp;</div><div><span style='font-size:large;'>Imagery Updates</span><br />You can use the <a target='_blank' href='https://livingatlas.arcgis.com/wayback/#mapCenter=10.41504%2C17.77096%2C2&amp;mode=updates' rel='nofollow ugc noopener noreferrer'>Updates Mode</a> in the World Imagery Wayback app to learn more about recent and pending updates. Accessing this information requires a user login with an ArcGIS organizational account.</div><div>&nbsp;</div><div><span style='font-size:large;'>Citations</span><br />This layer includes imagery provider, collection date, resolution,&nbsp;accuracy, and source of the imagery. With the Identify tool in ArcGIS Desktop or the ArcGIS Online Map Viewer&nbsp;you can see imagery citations. Citations returned apply only to the available imagery at that location and scale. You may need to zoom in to view the best available imagery. Citations can also be accessed in the&nbsp;<a target='_blank' href='https://www.arcgis.com/home/item.html?id=c03a526d94704bfb839445e80de95495' rel='nofollow ugc noopener noreferrer'>World Imagery with Metadata web map</a>.</div><div>&nbsp;</div><div><span style='font-size:large;'>Use</span><br />You can add this layer to the ArcGIS Online Map Viewer, ArcGIS Desktop, or ArcGIS Pro. To view this layer with a useful reference overlay, open the&nbsp;<a target='_blank' href='https://www.arcgis.com/home/item.html?id=28f49811a6974659988fd279de5ce39f' rel='nofollow ugc noopener noreferrer'>Imagery Hybrid</a>&nbsp;web map.</div><div>&nbsp;</div><div><span style='font-size:large;'>Feedback</span><br />Have you ever seen a problem in the Esri World Imagery Map that you wanted to report? &nbsp;You can use the&nbsp;<a target='_blank' href='https://www.arcgis.com/home/item.html?id=ebdfa4146680410bb952c7d532ea5407' rel='nofollow ugc noopener noreferrer'>Imagery Map Feedback web map</a>&nbsp;to provide comments on issues. The feedback will be reviewed by the ArcGIS Online team and considered for one of our updates.</div><div>&nbsp;</div><div style='background-color:rgb(255, 255, 255); border:0px solid currentcolor; box-sizing:border-box; color:rgb(74, 74, 74); font-family:&quot;Avenir Next&quot;, Avenir, &quot;Helvetica Neue&quot;, sans-serif; font-size:16px; font-style:normal; font-variant-caps:normal; font-variant-ligatures:normal; font-weight:400; letter-spacing:normal; line-height:1.5; text-align:start; text-decoration-color:initial; text-decoration-style:initial; text-indent:0px; text-transform:none; word-spacing:0px;'><span style='font-size:large;'>Need Imagery?</span></div><div style='background-color:rgb(255, 255, 255); border:0px solid currentcolor; box-sizing:border-box; color:rgb(74, 74, 74); font-family:&quot;Avenir Next&quot;, Avenir, &quot;Helvetica Neue&quot;, sans-serif; font-size:16px; font-style:normal; font-variant-caps:normal; font-variant-ligatures:normal; font-weight:400; letter-spacing:normal; line-height:1.5; text-align:start; text-decoration-color:initial; text-decoration-style:initial; text-indent:0px; text-transform:none; word-spacing:0px;'>If you need to access more recent or higher resolution imagery, you can quickly discover, order, and access imagery in the <a style='border:0px solid currentcolor; box-sizing:border-box; color:rgb(0, 97, 155); font-family:inherit; line-height:1.5; text-decoration:none;' target='_blank' href='https://www.esri.com/arcgis-blog/products/arcgis-online/imagery/access-commercial-imagery-in-arcgis' rel='nofollow ugc noopener noreferrer'>Content Store for ArcGIS</a>&nbsp;app.</div><div style='background-color:rgb(255, 255, 255); border:0px solid currentcolor; box-sizing:border-box; color:rgb(74, 74, 74); font-family:&quot;Avenir Next&quot;, Avenir, &quot;Helvetica Neue&quot;, sans-serif; font-size:16px; font-style:normal; font-variant-caps:normal; font-variant-ligatures:normal; font-weight:400; letter-spacing:normal; line-height:1.5; text-align:start; text-decoration-color:initial; text-decoration-style:initial; text-indent:0px; text-transform:none; word-spacing:0px;'><ol><li><a style='border:0px solid currentcolor; box-sizing:border-box; color:rgb(0, 97, 155); font-family:inherit; line-height:1.5; text-decoration:none;' target='_blank' href='https://www.esri.com/arcgis-blog/products/arcgis-online/imagery/access-commercial-imagery-in-arcgis' rel='nofollow ugc noopener noreferrer'>Learn More</a></li><li><a style='border:0px solid currentcolor; box-sizing:border-box; color:rgb(0, 97, 155); font-family:inherit; line-height:1.5; text-decoration:none;' target='_blank' href='https://www.esri.com/en-us/arcgis-marketplace/listing/products/8632a64a287a4232ba44930e2d213e6b' rel='nofollow ugc noopener noreferrer'>Get Access</a></li><li><a style='border:0px solid currentcolor; box-sizing:border-box; color:rgb(0, 97, 155); font-family:inherit; line-height:1.5; text-decoration:none;' target='_blank' href='https://contentstore.skywatch.com/' rel='nofollow ugc noopener noreferrer'>Open App</a></li></ol></div>",
			"keyword": [
				"world",
				"imagery",
				"basemap",
				"satellite",
				"aerial",
				"community",
				"community basemap",
				"orthophotos",
				"esri_basemap"
			],
			"issued": "2009-12-12T19:01:57.000Z",
			"modified": "2026-10-29T15:27:50.000Z",
			"publisher": {
				"name": "Esri"
			},
			"contactPoint": {
				"@type": "vcard:Contact",
				"fn": "esri",
				"hasEmail": "{{orgContactEmail}}"
			},
			"accessLevel": "public",
			"spatial": "-180.0000,-85.0511,180.0000,85.0511",
			"license": "<p><img src='https://downloads.esri.com/blogs/arcgisonline/esrilogo_new.png' /> This work is licensed under the Esri Master License Agreement.</p><div><a target='_blank' href='https://goto.arcgis.com/termsofuse/viewsummary' rel='nofollow ugc noopener noreferrer'><strong>View Summary</strong></a> | <a target='_blank' href='https://goto.arcgis.com/termsofuse/viewtermsofuse' rel='nofollow ugc noopener noreferrer'><strong>View Terms of Use</strong></a></div><div>&nbsp;</div><div><div><strong>Export:</strong> This layer is not intended to be used to export tiles for offline.&nbsp; If you would like to export imagery for offline use in ArcGIS applications, you may use the&nbsp;<a target='_blank' href='https://www.arcgis.com/home/item.html?id=226d23f076da478bba4589e7eae95952' rel='nofollow ugc noopener noreferrer'>World Imagery (for Export)</a>&nbsp;layer, which is intended for this purpose.</div><div>&nbsp;</div><div><strong>Data Collection and Editing:</strong> This layer may be used in various ArcGIS apps to support data collection and editing, with the results used internally or shared with others, as described for these&nbsp;<a target='_blank' href='https://www.arcgis.com/home/item.html?id=8e90a00a0a6845a49262e0b756f57a10' rel='nofollow ugc noopener noreferrer'>use cases</a>.</div></div>",
			"distribution": [
				{
					"@type": "dcat:Distribution",
					"title": "ArcGIS Hub Dataset",
					"format": "Web Page",
					"mediaType": "text/html",
					"accessURL": "https://www.pacificgeoportal.com/datasets/esri::1-2m-resolution-metadata-114"
				},
				{
					"@type": "dcat:Distribution",
					"title": "ArcGIS GeoService",
					"format": "ArcGIS GeoServices REST API",
					"mediaType": "application/json",
					"accessURL": "https://services.arcgisonline.com/ArcGIS/rest/services/World_Imagery/MapServer/11"
				},
				{
					"@type": "dcat:Distribution",
					"title": "CSV",
					"format": "CSV",
					"mediaType": "text/csv",
					"accessURL": "https://www.pacificgeoportal.com/api/download/v1/items/10df2279f9684e4a9f6a7f08febac2a9/csv?layers=11"
				},
				{
					"@type": "dcat:Distribution",
					"title": "Shapefile",
					"format": "ZIP",
					"mediaType": "application/zip",
					"accessURL": "https://www.pacificgeoportal.com/api/download/v1/items/10df2279f9684e4a9f6a7f08febac2a9/shapefile?layers=11"
				},
				{
					"@type": "dcat:Distribution",
					"title": "GeoJSON",
					"format": "GeoJSON",
					"mediaType": "application/vnd.geo+json",
					"accessURL": "https://www.pacificgeoportal.com/api/download/v1/items/10df2279f9684e4a9f6a7f08febac2a9/geojson?layers=11"
				},
				{
					"@type": "dcat:Distribution",
					"title": "KML",
					"format": "KML",
					"mediaType": "application/vnd.google-earth.kml+xml",
					"accessURL": "https://www.pacificgeoportal.com/api/download/v1/items/10df2279f9684e4a9f6a7f08febac2a9/kml?layers=11"
				}
			],
			"theme": [
				"geospatial"
			]
		},
		{
			"@type": "dcat:Dataset",
			"identifier": "https://www.arcgis.com/home/item.html?id=10df2279f9684e4a9f6a7f08febac2a9&sublayer=12",
			"landingPage": "https://www.pacificgeoportal.com/datasets/esri::2-4m-resolution-metadata-114",
			"title": "2.4m Resolution Metadata",
			"description": "<p>World Imagery provides one meter or better satellite and aerial imagery for most of the world’s landmass and lower resolution satellite imagery worldwide. The map is currently comprised of the following sources:</p><ul><li>Worldwide 15-m resolution TerraColor imagery at small and medium map scales.</li><li>Vantor imagery basemap products around the world: Vivid Premium at 15-cm HD resolution for select metropolitan areas, Vivid Advanced 30-cm HD for more than 1,000 metropolitan areas, and Vivid Standard from 1.2-m to 0.6-cm resolution for the most of the world, with 30-cm HD across the United States and parts of Western Europe. More information on the Vantor products is included below.&nbsp;</li><li>High-resolution aerial photography contributed by the GIS User Community. This imagery ranges from 30-cm to 3-cm resolution. You can contribute your imagery to this map and have it served by Esri via the&nbsp;<a target='_blank' href='https://livingatlas.arcgis.com/en/participate/#v=community&amp;subTab=what-to-contribute' rel='nofollow ugc noopener noreferrer'>Community Maps Program</a>.<br />&nbsp;</li></ul><p><span style='font-size:large;'>Vantor Basemap Products</span></p><p>Vivid Premium</p><p>Provides committed image currency in a high-resolution, high-quality image layer over defined metropolitan and high-interest areas across the globe. The product provides 15-cm HD resolution imagery.</p><p>Vivid Advanced</p><p>Provides committed image currency in a high-resolution, high-quality image layer over defined metropolitan and high-interest areas across the globe. The product includes a mix of native 30-cm and 30-cm HD resolution imagery.</p><p>Vivid Standard</p><p>Provides a visually consistent and continuous image layer over large areas through advanced image mosaicking techniques, including tonal balancing and seamline blending across thousands of image strips. Available from 1.2-m down to 30-cm HD.&nbsp;&nbsp;</p><div><a target='_blank' href='https://blog.maxar.com/leading-the-industry/2020/introducing-hd-see-more-do-more-with-high-definition-imagery' rel='nofollow ugc noopener noreferrer'>More on Vantor HD.</a></div><div>&nbsp;</div><div><span style='font-size:large;'>Imagery Updates</span><br />You can use the <a target='_blank' href='https://livingatlas.arcgis.com/wayback/#mapCenter=10.41504%2C17.77096%2C2&amp;mode=updates' rel='nofollow ugc noopener noreferrer'>Updates Mode</a> in the World Imagery Wayback app to learn more about recent and pending updates. Accessing this information requires a user login with an ArcGIS organizational account.</div><div>&nbsp;</div><div><span style='font-size:large;'>Citations</span><br />This layer includes imagery provider, collection date, resolution,&nbsp;accuracy, and source of the imagery. With the Identify tool in ArcGIS Desktop or the ArcGIS Online Map Viewer&nbsp;you can see imagery citations. Citations returned apply only to the available imagery at that location and scale. You may need to zoom in to view the best available imagery. Citations can also be accessed in the&nbsp;<a target='_blank' href='https://www.arcgis.com/home/item.html?id=c03a526d94704bfb839445e80de95495' rel='nofollow ugc noopener noreferrer'>World Imagery with Metadata web map</a>.</div><div>&nbsp;</div><div><span style='font-size:large;'>Use</span><br />You can add this layer to the ArcGIS Online Map Viewer, ArcGIS Desktop, or ArcGIS Pro. To view this layer with a useful reference overlay, open the&nbsp;<a target='_blank' href='https://www.arcgis.com/home/item.html?id=28f49811a6974659988fd279de5ce39f' rel='nofollow ugc noopener noreferrer'>Imagery Hybrid</a>&nbsp;web map.</div><div>&nbsp;</div><div><span style='font-size:large;'>Feedback</span><br />Have you ever seen a problem in the Esri World Imagery Map that you wanted to report? &nbsp;You can use the&nbsp;<a target='_blank' href='https://www.arcgis.com/home/item.html?id=ebdfa4146680410bb952c7d532ea5407' rel='nofollow ugc noopener noreferrer'>Imagery Map Feedback web map</a>&nbsp;to provide comments on issues. The feedback will be reviewed by the ArcGIS Online team and considered for one of our updates.</div><div>&nbsp;</div><div style='background-color:rgb(255, 255, 255); border:0px solid currentcolor; box-sizing:border-box; color:rgb(74, 74, 74); font-family:&quot;Avenir Next&quot;, Avenir, &quot;Helvetica Neue&quot;, sans-serif; font-size:16px; font-style:normal; font-variant-caps:normal; font-variant-ligatures:normal; font-weight:400; letter-spacing:normal; line-height:1.5; text-align:start; text-decoration-color:initial; text-decoration-style:initial; text-indent:0px; text-transform:none; word-spacing:0px;'><span style='font-size:large;'>Need Imagery?</span></div><div style='background-color:rgb(255, 255, 255); border:0px solid currentcolor; box-sizing:border-box; color:rgb(74, 74, 74); font-family:&quot;Avenir Next&quot;, Avenir, &quot;Helvetica Neue&quot;, sans-serif; font-size:16px; font-style:normal; font-variant-caps:normal; font-variant-ligatures:normal; font-weight:400; letter-spacing:normal; line-height:1.5; text-align:start; text-decoration-color:initial; text-decoration-style:initial; text-indent:0px; text-transform:none; word-spacing:0px;'>If you need to access more recent or higher resolution imagery, you can quickly discover, order, and access imagery in the <a style='border:0px solid currentcolor; box-sizing:border-box; color:rgb(0, 97, 155); font-family:inherit; line-height:1.5; text-decoration:none;' target='_blank' href='https://www.esri.com/arcgis-blog/products/arcgis-online/imagery/access-commercial-imagery-in-arcgis' rel='nofollow ugc noopener noreferrer'>Content Store for ArcGIS</a>&nbsp;app.</div><div style='background-color:rgb(255, 255, 255); border:0px solid currentcolor; box-sizing:border-box; color:rgb(74, 74, 74); font-family:&quot;Avenir Next&quot;, Avenir, &quot;Helvetica Neue&quot;, sans-serif; font-size:16px; font-style:normal; font-variant-caps:normal; font-variant-ligatures:normal; font-weight:400; letter-spacing:normal; line-height:1.5; text-align:start; text-decoration-color:initial; text-decoration-style:initial; text-indent:0px; text-transform:none; word-spacing:0px;'><ol><li><a style='border:0px solid currentcolor; box-sizing:border-box; color:rgb(0, 97, 155); font-family:inherit; line-height:1.5; text-decoration:none;' target='_blank' href='https://www.esri.com/arcgis-blog/products/arcgis-online/imagery/access-commercial-imagery-in-arcgis' rel='nofollow ugc noopener noreferrer'>Learn More</a></li><li><a style='border:0px solid currentcolor; box-sizing:border-box; color:rgb(0, 97, 155); font-family:inherit; line-height:1.5; text-decoration:none;' target='_blank' href='https://www.esri.com/en-us/arcgis-marketplace/listing/products/8632a64a287a4232ba44930e2d213e6b' rel='nofollow ugc noopener noreferrer'>Get Access</a></li><li><a style='border:0px solid currentcolor; box-sizing:border-box; color:rgb(0, 97, 155); font-family:inherit; line-height:1.5; text-decoration:none;' target='_blank' href='https://contentstore.skywatch.com/' rel='nofollow ugc noopener noreferrer'>Open App</a></li></ol></div>",
			"keyword": [
				"world",
				"imagery",
				"basemap",
				"satellite",
				"aerial",
				"community",
				"community basemap",
				"orthophotos",
				"esri_basemap"
			],
			"issued": "2009-12-12T19:01:57.000Z",
			"modified": "2026-10-29T15:27:50.000Z",
			"publisher": {
				"name": "Esri"
			},
			"contactPoint": {
				"@type": "vcard:Contact",
				"fn": "esri",
				"hasEmail": "{{orgContactEmail}}"
			},
			"accessLevel": "public",
			"spatial": "-180.0000,-85.0511,180.0000,85.0511",
			"license": "<p><img src='https://downloads.esri.com/blogs/arcgisonline/esrilogo_new.png' /> This work is licensed under the Esri Master License Agreement.</p><div><a target='_blank' href='https://goto.arcgis.com/termsofuse/viewsummary' rel='nofollow ugc noopener noreferrer'><strong>View Summary</strong></a> | <a target='_blank' href='https://goto.arcgis.com/termsofuse/viewtermsofuse' rel='nofollow ugc noopener noreferrer'><strong>View Terms of Use</strong></a></div><div>&nbsp;</div><div><div><strong>Export:</strong> This layer is not intended to be used to export tiles for offline.&nbsp; If you would like to export imagery for offline use in ArcGIS applications, you may use the&nbsp;<a target='_blank' href='https://www.arcgis.com/home/item.html?id=226d23f076da478bba4589e7eae95952' rel='nofollow ugc noopener noreferrer'>World Imagery (for Export)</a>&nbsp;layer, which is intended for this purpose.</div><div>&nbsp;</div><div><strong>Data Collection and Editing:</strong> This layer may be used in various ArcGIS apps to support data collection and editing, with the results used internally or shared with others, as described for these&nbsp;<a target='_blank' href='https://www.arcgis.com/home/item.html?id=8e90a00a0a6845a49262e0b756f57a10' rel='nofollow ugc noopener noreferrer'>use cases</a>.</div></div>",
			"distribution": [
				{
					"@type": "dcat:Distribution",
					"title": "ArcGIS Hub Dataset",
					"format": "Web Page",
					"mediaType": "text/html",
					"accessURL": "https://www.pacificgeoportal.com/datasets/esri::2-4m-resolution-metadata-114"
				},
				{
					"@type": "dcat:Distribution",
					"title": "ArcGIS GeoService",
					"format": "ArcGIS GeoServices REST API",
					"mediaType": "application/json",
					"accessURL": "https://services.arcgisonline.com/ArcGIS/rest/services/World_Imagery/MapServer/12"
				},
				{
					"@type": "dcat:Distribution",
					"title": "CSV",
					"format": "CSV",
					"mediaType": "text/csv",
					"accessURL": "https://www.pacificgeoportal.com/api/download/v1/items/10df2279f9684e4a9f6a7f08febac2a9/csv?layers=12"
				},
				{
					"@type": "dcat:Distribution",
					"title": "Shapefile",
					"format": "ZIP",
					"mediaType": "application/zip",
					"accessURL": "https://www.pacificgeoportal.com/api/download/v1/items/10df2279f9684e4a9f6a7f08febac2a9/shapefile?layers=12"
				},
				{
					"@type": "dcat:Distribution",
					"title": "GeoJSON",
					"format": "GeoJSON",
					"mediaType": "application/vnd.geo+json",
					"accessURL": "https://www.pacificgeoportal.com/api/download/v1/items/10df2279f9684e4a9f6a7f08febac2a9/geojson?layers=12"
				},
				{
					"@type": "dcat:Distribution",
					"title": "KML",
					"format": "KML",
					"mediaType": "application/vnd.google-earth.kml+xml",
					"accessURL": "https://www.pacificgeoportal.com/api/download/v1/items/10df2279f9684e4a9f6a7f08febac2a9/kml?layers=12"
				}
			],
			"theme": [
				"geospatial"
			]
		},
		{
			"@type": "dcat:Dataset",
			"identifier": "https://www.arcgis.com/home/item.html?id=10df2279f9684e4a9f6a7f08febac2a9&sublayer=13",
			"landingPage": "https://www.pacificgeoportal.com/datasets/esri::4-8m-resolution-metadata-114",
			"title": "4.8m Resolution Metadata",
			"description": "<p>World Imagery provides one meter or better satellite and aerial imagery for most of the world’s landmass and lower resolution satellite imagery worldwide. The map is currently comprised of the following sources:</p><ul><li>Worldwide 15-m resolution TerraColor imagery at small and medium map scales.</li><li>Vantor imagery basemap products around the world: Vivid Premium at 15-cm HD resolution for select metropolitan areas, Vivid Advanced 30-cm HD for more than 1,000 metropolitan areas, and Vivid Standard from 1.2-m to 0.6-cm resolution for the most of the world, with 30-cm HD across the United States and parts of Western Europe. More information on the Vantor products is included below.&nbsp;</li><li>High-resolution aerial photography contributed by the GIS User Community. This imagery ranges from 30-cm to 3-cm resolution. You can contribute your imagery to this map and have it served by Esri via the&nbsp;<a target='_blank' href='https://livingatlas.arcgis.com/en/participate/#v=community&amp;subTab=what-to-contribute' rel='nofollow ugc noopener noreferrer'>Community Maps Program</a>.<br />&nbsp;</li></ul><p><span style='font-size:large;'>Vantor Basemap Products</span></p><p>Vivid Premium</p><p>Provides committed image currency in a high-resolution, high-quality image layer over defined metropolitan and high-interest areas across the globe. The product provides 15-cm HD resolution imagery.</p><p>Vivid Advanced</p><p>Provides committed image currency in a high-resolution, high-quality image layer over defined metropolitan and high-interest areas across the globe. The product includes a mix of native 30-cm and 30-cm HD resolution imagery.</p><p>Vivid Standard</p><p>Provides a visually consistent and continuous image layer over large areas through advanced image mosaicking techniques, including tonal balancing and seamline blending across thousands of image strips. Available from 1.2-m down to 30-cm HD.&nbsp;&nbsp;</p><div><a target='_blank' href='https://blog.maxar.com/leading-the-industry/2020/introducing-hd-see-more-do-more-with-high-definition-imagery' rel='nofollow ugc noopener noreferrer'>More on Vantor HD.</a></div><div>&nbsp;</div><div><span style='font-size:large;'>Imagery Updates</span><br />You can use the <a target='_blank' href='https://livingatlas.arcgis.com/wayback/#mapCenter=10.41504%2C17.77096%2C2&amp;mode=updates' rel='nofollow ugc noopener noreferrer'>Updates Mode</a> in the World Imagery Wayback app to learn more about recent and pending updates. Accessing this information requires a user login with an ArcGIS organizational account.</div><div>&nbsp;</div><div><span style='font-size:large;'>Citations</span><br />This layer includes imagery provider, collection date, resolution,&nbsp;accuracy, and source of the imagery. With the Identify tool in ArcGIS Desktop or the ArcGIS Online Map Viewer&nbsp;you can see imagery citations. Citations returned apply only to the available imagery at that location and scale. You may need to zoom in to view the best available imagery. Citations can also be accessed in the&nbsp;<a target='_blank' href='https://www.arcgis.com/home/item.html?id=c03a526d94704bfb839445e80de95495' rel='nofollow ugc noopener noreferrer'>World Imagery with Metadata web map</a>.</div><div>&nbsp;</div><div><span style='font-size:large;'>Use</span><br />You can add this layer to the ArcGIS Online Map Viewer, ArcGIS Desktop, or ArcGIS Pro. To view this layer with a useful reference overlay, open the&nbsp;<a target='_blank' href='https://www.arcgis.com/home/item.html?id=28f49811a6974659988fd279de5ce39f' rel='nofollow ugc noopener noreferrer'>Imagery Hybrid</a>&nbsp;web map.</div><div>&nbsp;</div><div><span style='font-size:large;'>Feedback</span><br />Have you ever seen a problem in the Esri World Imagery Map that you wanted to report? &nbsp;You can use the&nbsp;<a target='_blank' href='https://www.arcgis.com/home/item.html?id=ebdfa4146680410bb952c7d532ea5407' rel='nofollow ugc noopener noreferrer'>Imagery Map Feedback web map</a>&nbsp;to provide comments on issues. The feedback will be reviewed by the ArcGIS Online team and considered for one of our updates.</div><div>&nbsp;</div><div style='background-color:rgb(255, 255, 255); border:0px solid currentcolor; box-sizing:border-box; color:rgb(74, 74, 74); font-family:&quot;Avenir Next&quot;, Avenir, &quot;Helvetica Neue&quot;, sans-serif; font-size:16px; font-style:normal; font-variant-caps:normal; font-variant-ligatures:normal; font-weight:400; letter-spacing:normal; line-height:1.5; text-align:start; text-decoration-color:initial; text-decoration-style:initial; text-indent:0px; text-transform:none; word-spacing:0px;'><span style='font-size:large;'>Need Imagery?</span></div><div style='background-color:rgb(255, 255, 255); border:0px solid currentcolor; box-sizing:border-box; color:rgb(74, 74, 74); font-family:&quot;Avenir Next&quot;, Avenir, &quot;Helvetica Neue&quot;, sans-serif; font-size:16px; font-style:normal; font-variant-caps:normal; font-variant-ligatures:normal; font-weight:400; letter-spacing:normal; line-height:1.5; text-align:start; text-decoration-color:initial; text-decoration-style:initial; text-indent:0px; text-transform:none; word-spacing:0px;'>If you need to access more recent or higher resolution imagery, you can quickly discover, order, and access imagery in the <a style='border:0px solid currentcolor; box-sizing:border-box; color:rgb(0, 97, 155); font-family:inherit; line-height:1.5; text-decoration:none;' target='_blank' href='https://www.esri.com/arcgis-blog/products/arcgis-online/imagery/access-commercial-imagery-in-arcgis' rel='nofollow ugc noopener noreferrer'>Content Store for ArcGIS</a>&nbsp;app.</div><div style='background-color:rgb(255, 255, 255); border:0px solid currentcolor; box-sizing:border-box; color:rgb(74, 74, 74); font-family:&quot;Avenir Next&quot;, Avenir, &quot;Helvetica Neue&quot;, sans-serif; font-size:16px; font-style:normal; font-variant-caps:normal; font-variant-ligatures:normal; font-weight:400; letter-spacing:normal; line-height:1.5; text-align:start; text-decoration-color:initial; text-decoration-style:initial; text-indent:0px; text-transform:none; word-spacing:0px;'><ol><li><a style='border:0px solid currentcolor; box-sizing:border-box; color:rgb(0, 97, 155); font-family:inherit; line-height:1.5; text-decoration:none;' target='_blank' href='https://www.esri.com/arcgis-blog/products/arcgis-online/imagery/access-commercial-imagery-in-arcgis' rel='nofollow ugc noopener noreferrer'>Learn More</a></li><li><a style='border:0px solid currentcolor; box-sizing:border-box; color:rgb(0, 97, 155); font-family:inherit; line-height:1.5; text-decoration:none;' target='_blank' href='https://www.esri.com/en-us/arcgis-marketplace/listing/products/8632a64a287a4232ba44930e2d213e6b' rel='nofollow ugc noopener noreferrer'>Get Access</a></li><li><a style='border:0px solid currentcolor; box-sizing:border-box; color:rgb(0, 97, 155); font-family:inherit; line-height:1.5; text-decoration:none;' target='_blank' href='https://contentstore.skywatch.com/' rel='nofollow ugc noopener noreferrer'>Open App</a></li></ol></div>",
			"keyword": [
				"world",
				"imagery",
				"basemap",
				"satellite",
				"aerial",
				"community",
				"community basemap",
				"orthophotos",
				"esri_basemap"
			],
			"issued": "2009-12-12T19:01:57.000Z",
			"modified": "2026-10-29T15:27:50.000Z",
			"publisher": {
				"name": "Esri"
			},
			"contactPoint": {
				"@type": "vcard:Contact",
				"fn": "esri",
				"hasEmail": "{{orgContactEmail}}"
			},
			"accessLevel": "public",
			"spatial": "-180.0000,-85.0511,180.0000,85.0511",
			"license": "<p><img src='https://downloads.esri.com/blogs/arcgisonline/esrilogo_new.png' /> This work is licensed under the Esri Master License Agreement.</p><div><a target='_blank' href='https://goto.arcgis.com/termsofuse/viewsummary' rel='nofollow ugc noopener noreferrer'><strong>View Summary</strong></a> | <a target='_blank' href='https://goto.arcgis.com/termsofuse/viewtermsofuse' rel='nofollow ugc noopener noreferrer'><strong>View Terms of Use</strong></a></div><div>&nbsp;</div><div><div><strong>Export:</strong> This layer is not intended to be used to export tiles for offline.&nbsp; If you would like to export imagery for offline use in ArcGIS applications, you may use the&nbsp;<a target='_blank' href='https://www.arcgis.com/home/item.html?id=226d23f076da478bba4589e7eae95952' rel='nofollow ugc noopener noreferrer'>World Imagery (for Export)</a>&nbsp;layer, which is intended for this purpose.</div><div>&nbsp;</div><div><strong>Data Collection and Editing:</strong> This layer may be used in various ArcGIS apps to support data collection and editing, with the results used internally or shared with others, as described for these&nbsp;<a target='_blank' href='https://www.arcgis.com/home/item.html?id=8e90a00a0a6845a49262e0b756f57a10' rel='nofollow ugc noopener noreferrer'>use cases</a>.</div></div>",
			"distribution": [
				{
					"@type": "dcat:Distribution",
					"title": "ArcGIS Hub Dataset",
					"format": "Web Page",
					"mediaType": "text/html",
					"accessURL": "https://www.pacificgeoportal.com/datasets/esri::4-8m-resolution-metadata-114"
				},
				{
					"@type": "dcat:Distribution",
					"title": "ArcGIS GeoService",
					"format": "ArcGIS GeoServices REST API",
					"mediaType": "application/json",
					"accessURL": "https://services.arcgisonline.com/ArcGIS/rest/services/World_Imagery/MapServer/13"
				},
				{
					"@type": "dcat:Distribution",
					"title": "CSV",
					"format": "CSV",
					"mediaType": "text/csv",
					"accessURL": "https://www.pacificgeoportal.com/api/download/v1/items/10df2279f9684e4a9f6a7f08febac2a9/csv?layers=13"
				},
				{
					"@type": "dcat:Distribution",
					"title": "Shapefile",
					"format": "ZIP",
					"mediaType": "application/zip",
					"accessURL": "https://www.pacificgeoportal.com/api/download/v1/items/10df2279f9684e4a9f6a7f08febac2a9/shapefile?layers=13"
				},
				{
					"@type": "dcat:Distribution",
					"title": "GeoJSON",
					"format": "GeoJSON",
					"mediaType": "application/vnd.geo+json",
					"accessURL": "https://www.pacificgeoportal.com/api/download/v1/items/10df2279f9684e4a9f6a7f08febac2a9/geojson?layers=13"
				},
				{
					"@type": "dcat:Distribution",
					"title": "KML",
					"format": "KML",
					"mediaType": "application/vnd.google-earth.kml+xml",
					"accessURL": "https://www.pacificgeoportal.com/api/download/v1/items/10df2279f9684e4a9f6a7f08febac2a9/kml?layers=13"
				}
			],
			"theme": [
				"geospatial"
			]
		},
		{
			"@type": "dcat:Dataset",
			"identifier": "https://www.arcgis.com/home/item.html?id=10df2279f9684e4a9f6a7f08febac2a9&sublayer=14",
			"landingPage": "https://www.pacificgeoportal.com/datasets/esri::9-6m-resolution-metadata-114",
			"title": "9.6m Resolution Metadata",
			"description": "<p>World Imagery provides one meter or better satellite and aerial imagery for most of the world’s landmass and lower resolution satellite imagery worldwide. The map is currently comprised of the following sources:</p><ul><li>Worldwide 15-m resolution TerraColor imagery at small and medium map scales.</li><li>Vantor imagery basemap products around the world: Vivid Premium at 15-cm HD resolution for select metropolitan areas, Vivid Advanced 30-cm HD for more than 1,000 metropolitan areas, and Vivid Standard from 1.2-m to 0.6-cm resolution for the most of the world, with 30-cm HD across the United States and parts of Western Europe. More information on the Vantor products is included below.&nbsp;</li><li>High-resolution aerial photography contributed by the GIS User Community. This imagery ranges from 30-cm to 3-cm resolution. You can contribute your imagery to this map and have it served by Esri via the&nbsp;<a target='_blank' href='https://livingatlas.arcgis.com/en/participate/#v=community&amp;subTab=what-to-contribute' rel='nofollow ugc noopener noreferrer'>Community Maps Program</a>.<br />&nbsp;</li></ul><p><span style='font-size:large;'>Vantor Basemap Products</span></p><p>Vivid Premium</p><p>Provides committed image currency in a high-resolution, high-quality image layer over defined metropolitan and high-interest areas across the globe. The product provides 15-cm HD resolution imagery.</p><p>Vivid Advanced</p><p>Provides committed image currency in a high-resolution, high-quality image layer over defined metropolitan and high-interest areas across the globe. The product includes a mix of native 30-cm and 30-cm HD resolution imagery.</p><p>Vivid Standard</p><p>Provides a visually consistent and continuous image layer over large areas through advanced image mosaicking techniques, including tonal balancing and seamline blending across thousands of image strips. Available from 1.2-m down to 30-cm HD.&nbsp;&nbsp;</p><div><a target='_blank' href='https://blog.maxar.com/leading-the-industry/2020/introducing-hd-see-more-do-more-with-high-definition-imagery' rel='nofollow ugc noopener noreferrer'>More on Vantor HD.</a></div><div>&nbsp;</div><div><span style='font-size:large;'>Imagery Updates</span><br />You can use the <a target='_blank' href='https://livingatlas.arcgis.com/wayback/#mapCenter=10.41504%2C17.77096%2C2&amp;mode=updates' rel='nofollow ugc noopener noreferrer'>Updates Mode</a> in the World Imagery Wayback app to learn more about recent and pending updates. Accessing this information requires a user login with an ArcGIS organizational account.</div><div>&nbsp;</div><div><span style='font-size:large;'>Citations</span><br />This layer includes imagery provider, collection date, resolution,&nbsp;accuracy, and source of the imagery. With the Identify tool in ArcGIS Desktop or the ArcGIS Online Map Viewer&nbsp;you can see imagery citations. Citations returned apply only to the available imagery at that location and scale. You may need to zoom in to view the best available imagery. Citations can also be accessed in the&nbsp;<a target='_blank' href='https://www.arcgis.com/home/item.html?id=c03a526d94704bfb839445e80de95495' rel='nofollow ugc noopener noreferrer'>World Imagery with Metadata web map</a>.</div><div>&nbsp;</div><div><span style='font-size:large;'>Use</span><br />You can add this layer to the ArcGIS Online Map Viewer, ArcGIS Desktop, or ArcGIS Pro. To view this layer with a useful reference overlay, open the&nbsp;<a target='_blank' href='https://www.arcgis.com/home/item.html?id=28f49811a6974659988fd279de5ce39f' rel='nofollow ugc noopener noreferrer'>Imagery Hybrid</a>&nbsp;web map.</div><div>&nbsp;</div><div><span style='font-size:large;'>Feedback</span><br />Have you ever seen a problem in the Esri World Imagery Map that you wanted to report? &nbsp;You can use the&nbsp;<a target='_blank' href='https://www.arcgis.com/home/item.html?id=ebdfa4146680410bb952c7d532ea5407' rel='nofollow ugc noopener noreferrer'>Imagery Map Feedback web map</a>&nbsp;to provide comments on issues. The feedback will be reviewed by the ArcGIS Online team and considered for one of our updates.</div><div>&nbsp;</div><div style='background-color:rgb(255, 255, 255); border:0px solid currentcolor; box-sizing:border-box; color:rgb(74, 74, 74); font-family:&quot;Avenir Next&quot;, Avenir, &quot;Helvetica Neue&quot;, sans-serif; font-size:16px; font-style:normal; font-variant-caps:normal; font-variant-ligatures:normal; font-weight:400; letter-spacing:normal; line-height:1.5; text-align:start; text-decoration-color:initial; text-decoration-style:initial; text-indent:0px; text-transform:none; word-spacing:0px;'><span style='font-size:large;'>Need Imagery?</span></div><div style='background-color:rgb(255, 255, 255); border:0px solid currentcolor; box-sizing:border-box; color:rgb(74, 74, 74); font-family:&quot;Avenir Next&quot;, Avenir, &quot;Helvetica Neue&quot;, sans-serif; font-size:16px; font-style:normal; font-variant-caps:normal; font-variant-ligatures:normal; font-weight:400; letter-spacing:normal; line-height:1.5; text-align:start; text-decoration-color:initial; text-decoration-style:initial; text-indent:0px; text-transform:none; word-spacing:0px;'>If you need to access more recent or higher resolution imagery, you can quickly discover, order, and access imagery in the <a style='border:0px solid currentcolor; box-sizing:border-box; color:rgb(0, 97, 155); font-family:inherit; line-height:1.5; text-decoration:none;' target='_blank' href='https://www.esri.com/arcgis-blog/products/arcgis-online/imagery/access-commercial-imagery-in-arcgis' rel='nofollow ugc noopener noreferrer'>Content Store for ArcGIS</a>&nbsp;app.</div><div style='background-color:rgb(255, 255, 255); border:0px solid currentcolor; box-sizing:border-box; color:rgb(74, 74, 74); font-family:&quot;Avenir Next&quot;, Avenir, &quot;Helvetica Neue&quot;, sans-serif; font-size:16px; font-style:normal; font-variant-caps:normal; font-variant-ligatures:normal; font-weight:400; letter-spacing:normal; line-height:1.5; text-align:start; text-decoration-color:initial; text-decoration-style:initial; text-indent:0px; text-transform:none; word-spacing:0px;'><ol><li><a style='border:0px solid currentcolor; box-sizing:border-box; color:rgb(0, 97, 155); font-family:inherit; line-height:1.5; text-decoration:none;' target='_blank' href='https://www.esri.com/arcgis-blog/products/arcgis-online/imagery/access-commercial-imagery-in-arcgis' rel='nofollow ugc noopener noreferrer'>Learn More</a></li><li><a style='border:0px solid currentcolor; box-sizing:border-box; color:rgb(0, 97, 155); font-family:inherit; line-height:1.5; text-decoration:none;' target='_blank' href='https://www.esri.com/en-us/arcgis-marketplace/listing/products/8632a64a287a4232ba44930e2d213e6b' rel='nofollow ugc noopener noreferrer'>Get Access</a></li><li><a style='border:0px solid currentcolor; box-sizing:border-box; color:rgb(0, 97, 155); font-family:inherit; line-height:1.5; text-decoration:none;' target='_blank' href='https://contentstore.skywatch.com/' rel='nofollow ugc noopener noreferrer'>Open App</a></li></ol></div>",
			"keyword": [
				"world",
				"imagery",
				"basemap",
				"satellite",
				"aerial",
				"community",
				"community basemap",
				"orthophotos",
				"esri_basemap"
			],
			"issued": "2009-12-12T19:01:57.000Z",
			"modified": "2026-10-29T15:27:50.000Z",
			"publisher": {
				"name": "Esri"
			},
			"contactPoint": {
				"@type": "vcard:Contact",
				"fn": "esri",
				"hasEmail": "{{orgContactEmail}}"
			},
			"accessLevel": "public",
			"spatial": "-180.0000,-85.0511,180.0000,85.0511",
			"license": "<p><img src='https://downloads.esri.com/blogs/arcgisonline/esrilogo_new.png' /> This work is licensed under the Esri Master License Agreement.</p><div><a target='_blank' href='https://goto.arcgis.com/termsofuse/viewsummary' rel='nofollow ugc noopener noreferrer'><strong>View Summary</strong></a> | <a target='_blank' href='https://goto.arcgis.com/termsofuse/viewtermsofuse' rel='nofollow ugc noopener noreferrer'><strong>View Terms of Use</strong></a></div><div>&nbsp;</div><div><div><strong>Export:</strong> This layer is not intended to be used to export tiles for offline.&nbsp; If you would like to export imagery for offline use in ArcGIS applications, you may use the&nbsp;<a target='_blank' href='https://www.arcgis.com/home/item.html?id=226d23f076da478bba4589e7eae95952' rel='nofollow ugc noopener noreferrer'>World Imagery (for Export)</a>&nbsp;layer, which is intended for this purpose.</div><div>&nbsp;</div><div><strong>Data Collection and Editing:</strong> This layer may be used in various ArcGIS apps to support data collection and editing, with the results used internally or shared with others, as described for these&nbsp;<a target='_blank' href='https://www.arcgis.com/home/item.html?id=8e90a00a0a6845a49262e0b756f57a10' rel='nofollow ugc noopener noreferrer'>use cases</a>.</div></div>",
			"distribution": [
				{
					"@type": "dcat:Distribution",
					"title": "ArcGIS Hub Dataset",
					"format": "Web Page",
					"mediaType": "text/html",
					"accessURL": "https://www.pacificgeoportal.com/datasets/esri::9-6m-resolution-metadata-114"
				},
				{
					"@type": "dcat:Distribution",
					"title": "ArcGIS GeoService",
					"format": "ArcGIS GeoServices REST API",
					"mediaType": "application/json",
					"accessURL": "https://services.arcgisonline.com/ArcGIS/rest/services/World_Imagery/MapServer/14"
				},
				{
					"@type": "dcat:Distribution",
					"title": "CSV",
					"format": "CSV",
					"mediaType": "text/csv",
					"accessURL": "https://www.pacificgeoportal.com/api/download/v1/items/10df2279f9684e4a9f6a7f08febac2a9/csv?layers=14"
				},
				{
					"@type": "dcat:Distribution",
					"title": "Shapefile",
					"format": "ZIP",
					"mediaType": "application/zip",
					"accessURL": "https://www.pacificgeoportal.com/api/download/v1/items/10df2279f9684e4a9f6a7f08febac2a9/shapefile?layers=14"
				},
				{
					"@type": "dcat:Distribution",
					"title": "GeoJSON",
					"format": "GeoJSON",
					"mediaType": "application/vnd.geo+json",
					"accessURL": "https://www.pacificgeoportal.com/api/download/v1/items/10df2279f9684e4a9f6a7f08febac2a9/geojson?layers=14"
				},
				{
					"@type": "dcat:Distribution",
					"title": "KML",
					"format": "KML",
					"mediaType": "application/vnd.google-earth.kml+xml",
					"accessURL": "https://www.pacificgeoportal.com/api/download/v1/items/10df2279f9684e4a9f6a7f08febac2a9/kml?layers=14"
				}
			],
			"theme": [
				"geospatial"
			]
		},
		{
			"@type": "dcat:Dataset",
			"identifier": "https://www.arcgis.com/home/item.html?id=10df2279f9684e4a9f6a7f08febac2a9&sublayer=15",
			"landingPage": "https://www.pacificgeoportal.com/datasets/esri::19m-resolution-metadata-114",
			"title": "19m Resolution Metadata",
			"description": "<p>World Imagery provides one meter or better satellite and aerial imagery for most of the world’s landmass and lower resolution satellite imagery worldwide. The map is currently comprised of the following sources:</p><ul><li>Worldwide 15-m resolution TerraColor imagery at small and medium map scales.</li><li>Vantor imagery basemap products around the world: Vivid Premium at 15-cm HD resolution for select metropolitan areas, Vivid Advanced 30-cm HD for more than 1,000 metropolitan areas, and Vivid Standard from 1.2-m to 0.6-cm resolution for the most of the world, with 30-cm HD across the United States and parts of Western Europe. More information on the Vantor products is included below.&nbsp;</li><li>High-resolution aerial photography contributed by the GIS User Community. This imagery ranges from 30-cm to 3-cm resolution. You can contribute your imagery to this map and have it served by Esri via the&nbsp;<a target='_blank' href='https://livingatlas.arcgis.com/en/participate/#v=community&amp;subTab=what-to-contribute' rel='nofollow ugc noopener noreferrer'>Community Maps Program</a>.<br />&nbsp;</li></ul><p><span style='font-size:large;'>Vantor Basemap Products</span></p><p>Vivid Premium</p><p>Provides committed image currency in a high-resolution, high-quality image layer over defined metropolitan and high-interest areas across the globe. The product provides 15-cm HD resolution imagery.</p><p>Vivid Advanced</p><p>Provides committed image currency in a high-resolution, high-quality image layer over defined metropolitan and high-interest areas across the globe. The product includes a mix of native 30-cm and 30-cm HD resolution imagery.</p><p>Vivid Standard</p><p>Provides a visually consistent and continuous image layer over large areas through advanced image mosaicking techniques, including tonal balancing and seamline blending across thousands of image strips. Available from 1.2-m down to 30-cm HD.&nbsp;&nbsp;</p><div><a target='_blank' href='https://blog.maxar.com/leading-the-industry/2020/introducing-hd-see-more-do-more-with-high-definition-imagery' rel='nofollow ugc noopener noreferrer'>More on Vantor HD.</a></div><div>&nbsp;</div><div><span style='font-size:large;'>Imagery Updates</span><br />You can use the <a target='_blank' href='https://livingatlas.arcgis.com/wayback/#mapCenter=10.41504%2C17.77096%2C2&amp;mode=updates' rel='nofollow ugc noopener noreferrer'>Updates Mode</a> in the World Imagery Wayback app to learn more about recent and pending updates. Accessing this information requires a user login with an ArcGIS organizational account.</div><div>&nbsp;</div><div><span style='font-size:large;'>Citations</span><br />This layer includes imagery provider, collection date, resolution,&nbsp;accuracy, and source of the imagery. With the Identify tool in ArcGIS Desktop or the ArcGIS Online Map Viewer&nbsp;you can see imagery citations. Citations returned apply only to the available imagery at that location and scale. You may need to zoom in to view the best available imagery. Citations can also be accessed in the&nbsp;<a target='_blank' href='https://www.arcgis.com/home/item.html?id=c03a526d94704bfb839445e80de95495' rel='nofollow ugc noopener noreferrer'>World Imagery with Metadata web map</a>.</div><div>&nbsp;</div><div><span style='font-size:large;'>Use</span><br />You can add this layer to the ArcGIS Online Map Viewer, ArcGIS Desktop, or ArcGIS Pro. To view this layer with a useful reference overlay, open the&nbsp;<a target='_blank' href='https://www.arcgis.com/home/item.html?id=28f49811a6974659988fd279de5ce39f' rel='nofollow ugc noopener noreferrer'>Imagery Hybrid</a>&nbsp;web map.</div><div>&nbsp;</div><div><span style='font-size:large;'>Feedback</span><br />Have you ever seen a problem in the Esri World Imagery Map that you wanted to report? &nbsp;You can use the&nbsp;<a target='_blank' href='https://www.arcgis.com/home/item.html?id=ebdfa4146680410bb952c7d532ea5407' rel='nofollow ugc noopener noreferrer'>Imagery Map Feedback web map</a>&nbsp;to provide comments on issues. The feedback will be reviewed by the ArcGIS Online team and considered for one of our updates.</div><div>&nbsp;</div><div style='background-color:rgb(255, 255, 255); border:0px solid currentcolor; box-sizing:border-box; color:rgb(74, 74, 74); font-family:&quot;Avenir Next&quot;, Avenir, &quot;Helvetica Neue&quot;, sans-serif; font-size:16px; font-style:normal; font-variant-caps:normal; font-variant-ligatures:normal; font-weight:400; letter-spacing:normal; line-height:1.5; text-align:start; text-decoration-color:initial; text-decoration-style:initial; text-indent:0px; text-transform:none; word-spacing:0px;'><span style='font-size:large;'>Need Imagery?</span></div><div style='background-color:rgb(255, 255, 255); border:0px solid currentcolor; box-sizing:border-box; color:rgb(74, 74, 74); font-family:&quot;Avenir Next&quot;, Avenir, &quot;Helvetica Neue&quot;, sans-serif; font-size:16px; font-style:normal; font-variant-caps:normal; font-variant-ligatures:normal; font-weight:400; letter-spacing:normal; line-height:1.5; text-align:start; text-decoration-color:initial; text-decoration-style:initial; text-indent:0px; text-transform:none; word-spacing:0px;'>If you need to access more recent or higher resolution imagery, you can quickly discover, order, and access imagery in the <a style='border:0px solid currentcolor; box-sizing:border-box; color:rgb(0, 97, 155); font-family:inherit; line-height:1.5; text-decoration:none;' target='_blank' href='https://www.esri.com/arcgis-blog/products/arcgis-online/imagery/access-commercial-imagery-in-arcgis' rel='nofollow ugc noopener noreferrer'>Content Store for ArcGIS</a>&nbsp;app.</div><div style='background-color:rgb(255, 255, 255); border:0px solid currentcolor; box-sizing:border-box; color:rgb(74, 74, 74); font-family:&quot;Avenir Next&quot;, Avenir, &quot;Helvetica Neue&quot;, sans-serif; font-size:16px; font-style:normal; font-variant-caps:normal; font-variant-ligatures:normal; font-weight:400; letter-spacing:normal; line-height:1.5; text-align:start; text-decoration-color:initial; text-decoration-style:initial; text-indent:0px; text-transform:none; word-spacing:0px;'><ol><li><a style='border:0px solid currentcolor; box-sizing:border-box; color:rgb(0, 97, 155); font-family:inherit; line-height:1.5; text-decoration:none;' target='_blank' href='https://www.esri.com/arcgis-blog/products/arcgis-online/imagery/access-commercial-imagery-in-arcgis' rel='nofollow ugc noopener noreferrer'>Learn More</a></li><li><a style='border:0px solid currentcolor; box-sizing:border-box; color:rgb(0, 97, 155); font-family:inherit; line-height:1.5; text-decoration:none;' target='_blank' href='https://www.esri.com/en-us/arcgis-marketplace/listing/products/8632a64a287a4232ba44930e2d213e6b' rel='nofollow ugc noopener noreferrer'>Get Access</a></li><li><a style='border:0px solid currentcolor; box-sizing:border-box; color:rgb(0, 97, 155); font-family:inherit; line-height:1.5; text-decoration:none;' target='_blank' href='https://contentstore.skywatch.com/' rel='nofollow ugc noopener noreferrer'>Open App</a></li></ol></div>",
			"keyword": [
				"world",
				"imagery",
				"basemap",
				"satellite",
				"aerial",
				"community",
				"community basemap",
				"orthophotos",
				"esri_basemap"
			],
			"issued": "2009-12-12T19:01:57.000Z",
			"modified": "2026-10-29T15:27:50.000Z",
			"publisher": {
				"name": "Esri"
			},
			"contactPoint": {
				"@type": "vcard:Contact",
				"fn": "esri",
				"hasEmail": "{{orgContactEmail}}"
			},
			"accessLevel": "public",
			"spatial": "-180.0000,-85.0511,180.0000,85.0511",
			"license": "<p><img src='https://downloads.esri.com/blogs/arcgisonline/esrilogo_new.png' /> This work is licensed under the Esri Master License Agreement.</p><div><a target='_blank' href='https://goto.arcgis.com/termsofuse/viewsummary' rel='nofollow ugc noopener noreferrer'><strong>View Summary</strong></a> | <a target='_blank' href='https://goto.arcgis.com/termsofuse/viewtermsofuse' rel='nofollow ugc noopener noreferrer'><strong>View Terms of Use</strong></a></div><div>&nbsp;</div><div><div><strong>Export:</strong> This layer is not intended to be used to export tiles for offline.&nbsp; If you would like to export imagery for offline use in ArcGIS applications, you may use the&nbsp;<a target='_blank' href='https://www.arcgis.com/home/item.html?id=226d23f076da478bba4589e7eae95952' rel='nofollow ugc noopener noreferrer'>World Imagery (for Export)</a>&nbsp;layer, which is intended for this purpose.</div><div>&nbsp;</div><div><strong>Data Collection and Editing:</strong> This layer may be used in various ArcGIS apps to support data collection and editing, with the results used internally or shared with others, as described for these&nbsp;<a target='_blank' href='https://www.arcgis.com/home/item.html?id=8e90a00a0a6845a49262e0b756f57a10' rel='nofollow ugc noopener noreferrer'>use cases</a>.</div></div>",
			"distribution": [
				{
					"@type": "dcat:Distribution",
					"title": "ArcGIS Hub Dataset",
					"format": "Web Page",
					"mediaType": "text/html",
					"accessURL": "https://www.pacificgeoportal.com/datasets/esri::19m-resolution-metadata-114"
				},
				{
					"@type": "dcat:Distribution",
					"title": "ArcGIS GeoService",
					"format": "ArcGIS GeoServices REST API",
					"mediaType": "application/json",
					"accessURL": "https://services.arcgisonline.com/ArcGIS/rest/services/World_Imagery/MapServer/15"
				},
				{
					"@type": "dcat:Distribution",
					"title": "CSV",
					"format": "CSV",
					"mediaType": "text/csv",
					"accessURL": "https://www.pacificgeoportal.com/api/download/v1/items/10df2279f9684e4a9f6a7f08febac2a9/csv?layers=15"
				},
				{
					"@type": "dcat:Distribution",
					"title": "Shapefile",
					"format": "ZIP",
					"mediaType": "application/zip",
					"accessURL": "https://www.pacificgeoportal.com/api/download/v1/items/10df2279f9684e4a9f6a7f08febac2a9/shapefile?layers=15"
				},
				{
					"@type": "dcat:Distribution",
					"title": "GeoJSON",
					"format": "GeoJSON",
					"mediaType": "application/vnd.geo+json",
					"accessURL": "https://www.pacificgeoportal.com/api/download/v1/items/10df2279f9684e4a9f6a7f08febac2a9/geojson?layers=15"
				},
				{
					"@type": "dcat:Distribution",
					"title": "KML",
					"format": "KML",
					"mediaType": "application/vnd.google-earth.kml+xml",
					"accessURL": "https://www.pacificgeoportal.com/api/download/v1/items/10df2279f9684e4a9f6a7f08febac2a9/kml?layers=15"
				}
			],
			"theme": [
				"geospatial"
			]
		},
		{
			"@type": "dcat:Dataset",
			"identifier": "https://www.arcgis.com/home/item.html?id=10df2279f9684e4a9f6a7f08febac2a9&sublayer=16",
			"landingPage": "https://www.pacificgeoportal.com/datasets/esri::38m-resolution-metadata-113",
			"title": "38m Resolution Metadata",
			"description": "<p>World Imagery provides one meter or better satellite and aerial imagery for most of the world’s landmass and lower resolution satellite imagery worldwide. The map is currently comprised of the following sources:</p><ul><li>Worldwide 15-m resolution TerraColor imagery at small and medium map scales.</li><li>Vantor imagery basemap products around the world: Vivid Premium at 15-cm HD resolution for select metropolitan areas, Vivid Advanced 30-cm HD for more than 1,000 metropolitan areas, and Vivid Standard from 1.2-m to 0.6-cm resolution for the most of the world, with 30-cm HD across the United States and parts of Western Europe. More information on the Vantor products is included below.&nbsp;</li><li>High-resolution aerial photography contributed by the GIS User Community. This imagery ranges from 30-cm to 3-cm resolution. You can contribute your imagery to this map and have it served by Esri via the&nbsp;<a target='_blank' href='https://livingatlas.arcgis.com/en/participate/#v=community&amp;subTab=what-to-contribute' rel='nofollow ugc noopener noreferrer'>Community Maps Program</a>.<br />&nbsp;</li></ul><p><span style='font-size:large;'>Vantor Basemap Products</span></p><p>Vivid Premium</p><p>Provides committed image currency in a high-resolution, high-quality image layer over defined metropolitan and high-interest areas across the globe. The product provides 15-cm HD resolution imagery.</p><p>Vivid Advanced</p><p>Provides committed image currency in a high-resolution, high-quality image layer over defined metropolitan and high-interest areas across the globe. The product includes a mix of native 30-cm and 30-cm HD resolution imagery.</p><p>Vivid Standard</p><p>Provides a visually consistent and continuous image layer over large areas through advanced image mosaicking techniques, including tonal balancing and seamline blending across thousands of image strips. Available from 1.2-m down to 30-cm HD.&nbsp;&nbsp;</p><div><a target='_blank' href='https://blog.maxar.com/leading-the-industry/2020/introducing-hd-see-more-do-more-with-high-definition-imagery' rel='nofollow ugc noopener noreferrer'>More on Vantor HD.</a></div><div>&nbsp;</div><div><span style='font-size:large;'>Imagery Updates</span><br />You can use the <a target='_blank' href='https://livingatlas.arcgis.com/wayback/#mapCenter=10.41504%2C17.77096%2C2&amp;mode=updates' rel='nofollow ugc noopener noreferrer'>Updates Mode</a> in the World Imagery Wayback app to learn more about recent and pending updates. Accessing this information requires a user login with an ArcGIS organizational account.</div><div>&nbsp;</div><div><span style='font-size:large;'>Citations</span><br />This layer includes imagery provider, collection date, resolution,&nbsp;accuracy, and source of the imagery. With the Identify tool in ArcGIS Desktop or the ArcGIS Online Map Viewer&nbsp;you can see imagery citations. Citations returned apply only to the available imagery at that location and scale. You may need to zoom in to view the best available imagery. Citations can also be accessed in the&nbsp;<a target='_blank' href='https://www.arcgis.com/home/item.html?id=c03a526d94704bfb839445e80de95495' rel='nofollow ugc noopener noreferrer'>World Imagery with Metadata web map</a>.</div><div>&nbsp;</div><div><span style='font-size:large;'>Use</span><br />You can add this layer to the ArcGIS Online Map Viewer, ArcGIS Desktop, or ArcGIS Pro. To view this layer with a useful reference overlay, open the&nbsp;<a target='_blank' href='https://www.arcgis.com/home/item.html?id=28f49811a6974659988fd279de5ce39f' rel='nofollow ugc noopener noreferrer'>Imagery Hybrid</a>&nbsp;web map.</div><div>&nbsp;</div><div><span style='font-size:large;'>Feedback</span><br />Have you ever seen a problem in the Esri World Imagery Map that you wanted to report? &nbsp;You can use the&nbsp;<a target='_blank' href='https://www.arcgis.com/home/item.html?id=ebdfa4146680410bb952c7d532ea5407' rel='nofollow ugc noopener noreferrer'>Imagery Map Feedback web map</a>&nbsp;to provide comments on issues. The feedback will be reviewed by the ArcGIS Online team and considered for one of our updates.</div><div>&nbsp;</div><div style='background-color:rgb(255, 255, 255); border:0px solid currentcolor; box-sizing:border-box; color:rgb(74, 74, 74); font-family:&quot;Avenir Next&quot;, Avenir, &quot;Helvetica Neue&quot;, sans-serif; font-size:16px; font-style:normal; font-variant-caps:normal; font-variant-ligatures:normal; font-weight:400; letter-spacing:normal; line-height:1.5; text-align:start; text-decoration-color:initial; text-decoration-style:initial; text-indent:0px; text-transform:none; word-spacing:0px;'><span style='font-size:large;'>Need Imagery?</span></div><div style='background-color:rgb(255, 255, 255); border:0px solid currentcolor; box-sizing:border-box; color:rgb(74, 74, 74); font-family:&quot;Avenir Next&quot;, Avenir, &quot;Helvetica Neue&quot;, sans-serif; font-size:16px; font-style:normal; font-variant-caps:normal; font-variant-ligatures:normal; font-weight:400; letter-spacing:normal; line-height:1.5; text-align:start; text-decoration-color:initial; text-decoration-style:initial; text-indent:0px; text-transform:none; word-spacing:0px;'>If you need to access more recent or higher resolution imagery, you can quickly discover, order, and access imagery in the <a style='border:0px solid currentcolor; box-sizing:border-box; color:rgb(0, 97, 155); font-family:inherit; line-height:1.5; text-decoration:none;' target='_blank' href='https://www.esri.com/arcgis-blog/products/arcgis-online/imagery/access-commercial-imagery-in-arcgis' rel='nofollow ugc noopener noreferrer'>Content Store for ArcGIS</a>&nbsp;app.</div><div style='background-color:rgb(255, 255, 255); border:0px solid currentcolor; box-sizing:border-box; color:rgb(74, 74, 74); font-family:&quot;Avenir Next&quot;, Avenir, &quot;Helvetica Neue&quot;, sans-serif; font-size:16px; font-style:normal; font-variant-caps:normal; font-variant-ligatures:normal; font-weight:400; letter-spacing:normal; line-height:1.5; text-align:start; text-decoration-color:initial; text-decoration-style:initial; text-indent:0px; text-transform:none; word-spacing:0px;'><ol><li><a style='border:0px solid currentcolor; box-sizing:border-box; color:rgb(0, 97, 155); font-family:inherit; line-height:1.5; text-decoration:none;' target='_blank' href='https://www.esri.com/arcgis-blog/products/arcgis-online/imagery/access-commercial-imagery-in-arcgis' rel='nofollow ugc noopener noreferrer'>Learn More</a></li><li><a style='border:0px solid currentcolor; box-sizing:border-box; color:rgb(0, 97, 155); font-family:inherit; line-height:1.5; text-decoration:none;' target='_blank' href='https://www.esri.com/en-us/arcgis-marketplace/listing/products/8632a64a287a4232ba44930e2d213e6b' rel='nofollow ugc noopener noreferrer'>Get Access</a></li><li><a style='border:0px solid currentcolor; box-sizing:border-box; color:rgb(0, 97, 155); font-family:inherit; line-height:1.5; text-decoration:none;' target='_blank' href='https://contentstore.skywatch.com/' rel='nofollow ugc noopener noreferrer'>Open App</a></li></ol></div>",
			"keyword": [
				"world",
				"imagery",
				"basemap",
				"satellite",
				"aerial",
				"community",
				"community basemap",
				"orthophotos",
				"esri_basemap"
			],
			"issued": "2009-12-12T19:01:57.000Z",
			"modified": "2026-10-29T15:27:50.000Z",
			"publisher": {
				"name": "Esri"
			},
			"contactPoint": {
				"@type": "vcard:Contact",
				"fn": "esri",
				"hasEmail": "{{orgContactEmail}}"
			},
			"accessLevel": "public",
			"spatial": "-180.0000,-85.0511,180.0000,85.0511",
			"license": "<p><img src='https://downloads.esri.com/blogs/arcgisonline/esrilogo_new.png' /> This work is licensed under the Esri Master License Agreement.</p><div><a target='_blank' href='https://goto.arcgis.com/termsofuse/viewsummary' rel='nofollow ugc noopener noreferrer'><strong>View Summary</strong></a> | <a target='_blank' href='https://goto.arcgis.com/termsofuse/viewtermsofuse' rel='nofollow ugc noopener noreferrer'><strong>View Terms of Use</strong></a></div><div>&nbsp;</div><div><div><strong>Export:</strong> This layer is not intended to be used to export tiles for offline.&nbsp; If you would like to export imagery for offline use in ArcGIS applications, you may use the&nbsp;<a target='_blank' href='https://www.arcgis.com/home/item.html?id=226d23f076da478bba4589e7eae95952' rel='nofollow ugc noopener noreferrer'>World Imagery (for Export)</a>&nbsp;layer, which is intended for this purpose.</div><div>&nbsp;</div><div><strong>Data Collection and Editing:</strong> This layer may be used in various ArcGIS apps to support data collection and editing, with the results used internally or shared with others, as described for these&nbsp;<a target='_blank' href='https://www.arcgis.com/home/item.html?id=8e90a00a0a6845a49262e0b756f57a10' rel='nofollow ugc noopener noreferrer'>use cases</a>.</div></div>",
			"distribution": [
				{
					"@type": "dcat:Distribution",
					"title": "ArcGIS Hub Dataset",
					"format": "Web Page",
					"mediaType": "text/html",
					"accessURL": "https://www.pacificgeoportal.com/datasets/esri::38m-resolution-metadata-113"
				},
				{
					"@type": "dcat:Distribution",
					"title": "ArcGIS GeoService",
					"format": "ArcGIS GeoServices REST API",
					"mediaType": "application/json",
					"accessURL": "https://services.arcgisonline.com/ArcGIS/rest/services/World_Imagery/MapServer/16"
				},
				{
					"@type": "dcat:Distribution",
					"title": "CSV",
					"format": "CSV",
					"mediaType": "text/csv",
					"accessURL": "https://www.pacificgeoportal.com/api/download/v1/items/10df2279f9684e4a9f6a7f08febac2a9/csv?layers=16"
				},
				{
					"@type": "dcat:Distribution",
					"title": "Shapefile",
					"format": "ZIP",
					"mediaType": "application/zip",
					"accessURL": "https://www.pacificgeoportal.com/api/download/v1/items/10df2279f9684e4a9f6a7f08febac2a9/shapefile?layers=16"
				},
				{
					"@type": "dcat:Distribution",
					"title": "GeoJSON",
					"format": "GeoJSON",
					"mediaType": "application/vnd.geo+json",
					"accessURL": "https://www.pacificgeoportal.com/api/download/v1/items/10df2279f9684e4a9f6a7f08febac2a9/geojson?layers=16"
				},
				{
					"@type": "dcat:Distribution",
					"title": "KML",
					"format": "KML",
					"mediaType": "application/vnd.google-earth.kml+xml",
					"accessURL": "https://www.pacificgeoportal.com/api/download/v1/items/10df2279f9684e4a9f6a7f08febac2a9/kml?layers=16"
				}
			],
			"theme": [
				"geospatial"
			]
		},
		{
			"@type": "dcat:Dataset",
			"identifier": "https://www.arcgis.com/home/item.html?id=10df2279f9684e4a9f6a7f08febac2a9&sublayer=17",
			"landingPage": "https://www.pacificgeoportal.com/datasets/esri::75m-resolution-metadata-114",
			"title": "75m Resolution Metadata",
			"description": "<p>World Imagery provides one meter or better satellite and aerial imagery for most of the world’s landmass and lower resolution satellite imagery worldwide. The map is currently comprised of the following sources:</p><ul><li>Worldwide 15-m resolution TerraColor imagery at small and medium map scales.</li><li>Vantor imagery basemap products around the world: Vivid Premium at 15-cm HD resolution for select metropolitan areas, Vivid Advanced 30-cm HD for more than 1,000 metropolitan areas, and Vivid Standard from 1.2-m to 0.6-cm resolution for the most of the world, with 30-cm HD across the United States and parts of Western Europe. More information on the Vantor products is included below.&nbsp;</li><li>High-resolution aerial photography contributed by the GIS User Community. This imagery ranges from 30-cm to 3-cm resolution. You can contribute your imagery to this map and have it served by Esri via the&nbsp;<a target='_blank' href='https://livingatlas.arcgis.com/en/participate/#v=community&amp;subTab=what-to-contribute' rel='nofollow ugc noopener noreferrer'>Community Maps Program</a>.<br />&nbsp;</li></ul><p><span style='font-size:large;'>Vantor Basemap Products</span></p><p>Vivid Premium</p><p>Provides committed image currency in a high-resolution, high-quality image layer over defined metropolitan and high-interest areas across the globe. The product provides 15-cm HD resolution imagery.</p><p>Vivid Advanced</p><p>Provides committed image currency in a high-resolution, high-quality image layer over defined metropolitan and high-interest areas across the globe. The product includes a mix of native 30-cm and 30-cm HD resolution imagery.</p><p>Vivid Standard</p><p>Provides a visually consistent and continuous image layer over large areas through advanced image mosaicking techniques, including tonal balancing and seamline blending across thousands of image strips. Available from 1.2-m down to 30-cm HD.&nbsp;&nbsp;</p><div><a target='_blank' href='https://blog.maxar.com/leading-the-industry/2020/introducing-hd-see-more-do-more-with-high-definition-imagery' rel='nofollow ugc noopener noreferrer'>More on Vantor HD.</a></div><div>&nbsp;</div><div><span style='font-size:large;'>Imagery Updates</span><br />You can use the <a target='_blank' href='https://livingatlas.arcgis.com/wayback/#mapCenter=10.41504%2C17.77096%2C2&amp;mode=updates' rel='nofollow ugc noopener noreferrer'>Updates Mode</a> in the World Imagery Wayback app to learn more about recent and pending updates. Accessing this information requires a user login with an ArcGIS organizational account.</div><div>&nbsp;</div><div><span style='font-size:large;'>Citations</span><br />This layer includes imagery provider, collection date, resolution,&nbsp;accuracy, and source of the imagery. With the Identify tool in ArcGIS Desktop or the ArcGIS Online Map Viewer&nbsp;you can see imagery citations. Citations returned apply only to the available imagery at that location and scale. You may need to zoom in to view the best available imagery. Citations can also be accessed in the&nbsp;<a target='_blank' href='https://www.arcgis.com/home/item.html?id=c03a526d94704bfb839445e80de95495' rel='nofollow ugc noopener noreferrer'>World Imagery with Metadata web map</a>.</div><div>&nbsp;</div><div><span style='font-size:large;'>Use</span><br />You can add this layer to the ArcGIS Online Map Viewer, ArcGIS Desktop, or ArcGIS Pro. To view this layer with a useful reference overlay, open the&nbsp;<a target='_blank' href='https://www.arcgis.com/home/item.html?id=28f49811a6974659988fd279de5ce39f' rel='nofollow ugc noopener noreferrer'>Imagery Hybrid</a>&nbsp;web map.</div><div>&nbsp;</div><div><span style='font-size:large;'>Feedback</span><br />Have you ever seen a problem in the Esri World Imagery Map that you wanted to report? &nbsp;You can use the&nbsp;<a target='_blank' href='https://www.arcgis.com/home/item.html?id=ebdfa4146680410bb952c7d532ea5407' rel='nofollow ugc noopener noreferrer'>Imagery Map Feedback web map</a>&nbsp;to provide comments on issues. The feedback will be reviewed by the ArcGIS Online team and considered for one of our updates.</div><div>&nbsp;</div><div style='background-color:rgb(255, 255, 255); border:0px solid currentcolor; box-sizing:border-box; color:rgb(74, 74, 74); font-family:&quot;Avenir Next&quot;, Avenir, &quot;Helvetica Neue&quot;, sans-serif; font-size:16px; font-style:normal; font-variant-caps:normal; font-variant-ligatures:normal; font-weight:400; letter-spacing:normal; line-height:1.5; text-align:start; text-decoration-color:initial; text-decoration-style:initial; text-indent:0px; text-transform:none; word-spacing:0px;'><span style='font-size:large;'>Need Imagery?</span></div><div style='background-color:rgb(255, 255, 255); border:0px solid currentcolor; box-sizing:border-box; color:rgb(74, 74, 74); font-family:&quot;Avenir Next&quot;, Avenir, &quot;Helvetica Neue&quot;, sans-serif; font-size:16px; font-style:normal; font-variant-caps:normal; font-variant-ligatures:normal; font-weight:400; letter-spacing:normal; line-height:1.5; text-align:start; text-decoration-color:initial; text-decoration-style:initial; text-indent:0px; text-transform:none; word-spacing:0px;'>If you need to access more recent or higher resolution imagery, you can quickly discover, order, and access imagery in the <a style='border:0px solid currentcolor; box-sizing:border-box; color:rgb(0, 97, 155); font-family:inherit; line-height:1.5; text-decoration:none;' target='_blank' href='https://www.esri.com/arcgis-blog/products/arcgis-online/imagery/access-commercial-imagery-in-arcgis' rel='nofollow ugc noopener noreferrer'>Content Store for ArcGIS</a>&nbsp;app.</div><div style='background-color:rgb(255, 255, 255); border:0px solid currentcolor; box-sizing:border-box; color:rgb(74, 74, 74); font-family:&quot;Avenir Next&quot;, Avenir, &quot;Helvetica Neue&quot;, sans-serif; font-size:16px; font-style:normal; font-variant-caps:normal; font-variant-ligatures:normal; font-weight:400; letter-spacing:normal; line-height:1.5; text-align:start; text-decoration-color:initial; text-decoration-style:initial; text-indent:0px; text-transform:none; word-spacing:0px;'><ol><li><a style='border:0px solid currentcolor; box-sizing:border-box; color:rgb(0, 97, 155); font-family:inherit; line-height:1.5; text-decoration:none;' target='_blank' href='https://www.esri.com/arcgis-blog/products/arcgis-online/imagery/access-commercial-imagery-in-arcgis' rel='nofollow ugc noopener noreferrer'>Learn More</a></li><li><a style='border:0px solid currentcolor; box-sizing:border-box; color:rgb(0, 97, 155); font-family:inherit; line-height:1.5; text-decoration:none;' target='_blank' href='https://www.esri.com/en-us/arcgis-marketplace/listing/products/8632a64a287a4232ba44930e2d213e6b' rel='nofollow ugc noopener noreferrer'>Get Access</a></li><li><a style='border:0px solid currentcolor; box-sizing:border-box; color:rgb(0, 97, 155); font-family:inherit; line-height:1.5; text-decoration:none;' target='_blank' href='https://contentstore.skywatch.com/' rel='nofollow ugc noopener noreferrer'>Open App</a></li></ol></div>",
			"keyword": [
				"world",
				"imagery",
				"basemap",
				"satellite",
				"aerial",
				"community",
				"community basemap",
				"orthophotos",
				"esri_basemap"
			],
			"issued": "2009-12-12T19:01:57.000Z",
			"modified": "2026-10-29T15:27:50.000Z",
			"publisher": {
				"name": "Esri"
			},
			"contactPoint": {
				"@type": "vcard:Contact",
				"fn": "esri",
				"hasEmail": "{{orgContactEmail}}"
			},
			"accessLevel": "public",
			"spatial": "-180.0000,-85.0511,180.0000,85.0511",
			"license": "<p><img src='https://downloads.esri.com/blogs/arcgisonline/esrilogo_new.png' /> This work is licensed under the Esri Master License Agreement.</p><div><a target='_blank' href='https://goto.arcgis.com/termsofuse/viewsummary' rel='nofollow ugc noopener noreferrer'><strong>View Summary</strong></a> | <a target='_blank' href='https://goto.arcgis.com/termsofuse/viewtermsofuse' rel='nofollow ugc noopener noreferrer'><strong>View Terms of Use</strong></a></div><div>&nbsp;</div><div><div><strong>Export:</strong> This layer is not intended to be used to export tiles for offline.&nbsp; If you would like to export imagery for offline use in ArcGIS applications, you may use the&nbsp;<a target='_blank' href='https://www.arcgis.com/home/item.html?id=226d23f076da478bba4589e7eae95952' rel='nofollow ugc noopener noreferrer'>World Imagery (for Export)</a>&nbsp;layer, which is intended for this purpose.</div><div>&nbsp;</div><div><strong>Data Collection and Editing:</strong> This layer may be used in various ArcGIS apps to support data collection and editing, with the results used internally or shared with others, as described for these&nbsp;<a target='_blank' href='https://www.arcgis.com/home/item.html?id=8e90a00a0a6845a49262e0b756f57a10' rel='nofollow ugc noopener noreferrer'>use cases</a>.</div></div>",
			"distribution": [
				{
					"@type": "dcat:Distribution",
					"title": "ArcGIS Hub Dataset",
					"format": "Web Page",
					"mediaType": "text/html",
					"accessURL": "https://www.pacificgeoportal.com/datasets/esri::75m-resolution-metadata-114"
				},
				{
					"@type": "dcat:Distribution",
					"title": "ArcGIS GeoService",
					"format": "ArcGIS GeoServices REST API",
					"mediaType": "application/json",
					"accessURL": "https://services.arcgisonline.com/ArcGIS/rest/services/World_Imagery/MapServer/17"
				},
				{
					"@type": "dcat:Distribution",
					"title": "CSV",
					"format": "CSV",
					"mediaType": "text/csv",
					"accessURL": "https://www.pacificgeoportal.com/api/download/v1/items/10df2279f9684e4a9f6a7f08febac2a9/csv?layers=17"
				},
				{
					"@type": "dcat:Distribution",
					"title": "Shapefile",
					"format": "ZIP",
					"mediaType": "application/zip",
					"accessURL": "https://www.pacificgeoportal.com/api/download/v1/items/10df2279f9684e4a9f6a7f08febac2a9/shapefile?layers=17"
				},
				{
					"@type": "dcat:Distribution",
					"title": "GeoJSON",
					"format": "GeoJSON",
					"mediaType": "application/vnd.geo+json",
					"accessURL": "https://www.pacificgeoportal.com/api/download/v1/items/10df2279f9684e4a9f6a7f08febac2a9/geojson?layers=17"
				},
				{
					"@type": "dcat:Distribution",
					"title": "KML",
					"format": "KML",
					"mediaType": "application/vnd.google-earth.kml+xml",
					"accessURL": "https://www.pacificgeoportal.com/api/download/v1/items/10df2279f9684e4a9f6a7f08febac2a9/kml?layers=17"
				}
			],
			"theme": [
				"geospatial"
			]
		},
		{
			"@type": "dcat:Dataset",
			"identifier": "https://www.arcgis.com/home/item.html?id=10df2279f9684e4a9f6a7f08febac2a9&sublayer=18",
			"landingPage": "https://www.pacificgeoportal.com/datasets/esri::150m-resolution-metadata-114",
			"title": "150m Resolution Metadata",
			"description": "<p>World Imagery provides one meter or better satellite and aerial imagery for most of the world’s landmass and lower resolution satellite imagery worldwide. The map is currently comprised of the following sources:</p><ul><li>Worldwide 15-m resolution TerraColor imagery at small and medium map scales.</li><li>Vantor imagery basemap products around the world: Vivid Premium at 15-cm HD resolution for select metropolitan areas, Vivid Advanced 30-cm HD for more than 1,000 metropolitan areas, and Vivid Standard from 1.2-m to 0.6-cm resolution for the most of the world, with 30-cm HD across the United States and parts of Western Europe. More information on the Vantor products is included below.&nbsp;</li><li>High-resolution aerial photography contributed by the GIS User Community. This imagery ranges from 30-cm to 3-cm resolution. You can contribute your imagery to this map and have it served by Esri via the&nbsp;<a target='_blank' href='https://livingatlas.arcgis.com/en/participate/#v=community&amp;subTab=what-to-contribute' rel='nofollow ugc noopener noreferrer'>Community Maps Program</a>.<br />&nbsp;</li></ul><p><span style='font-size:large;'>Vantor Basemap Products</span></p><p>Vivid Premium</p><p>Provides committed image currency in a high-resolution, high-quality image layer over defined metropolitan and high-interest areas across the globe. The product provides 15-cm HD resolution imagery.</p><p>Vivid Advanced</p><p>Provides committed image currency in a high-resolution, high-quality image layer over defined metropolitan and high-interest areas across the globe. The product includes a mix of native 30-cm and 30-cm HD resolution imagery.</p><p>Vivid Standard</p><p>Provides a visually consistent and continuous image layer over large areas through advanced image mosaicking techniques, including tonal balancing and seamline blending across thousands of image strips. Available from 1.2-m down to 30-cm HD.&nbsp;&nbsp;</p><div><a target='_blank' href='https://blog.maxar.com/leading-the-industry/2020/introducing-hd-see-more-do-more-with-high-definition-imagery' rel='nofollow ugc noopener noreferrer'>More on Vantor HD.</a></div><div>&nbsp;</div><div><span style='font-size:large;'>Imagery Updates</span><br />You can use the <a target='_blank' href='https://livingatlas.arcgis.com/wayback/#mapCenter=10.41504%2C17.77096%2C2&amp;mode=updates' rel='nofollow ugc noopener noreferrer'>Updates Mode</a> in the World Imagery Wayback app to learn more about recent and pending updates. Accessing this information requires a user login with an ArcGIS organizational account.</div><div>&nbsp;</div><div><span style='font-size:large;'>Citations</span><br />This layer includes imagery provider, collection date, resolution,&nbsp;accuracy, and source of the imagery. With the Identify tool in ArcGIS Desktop or the ArcGIS Online Map Viewer&nbsp;you can see imagery citations. Citations returned apply only to the available imagery at that location and scale. You may need to zoom in to view the best available imagery. Citations can also be accessed in the&nbsp;<a target='_blank' href='https://www.arcgis.com/home/item.html?id=c03a526d94704bfb839445e80de95495' rel='nofollow ugc noopener noreferrer'>World Imagery with Metadata web map</a>.</div><div>&nbsp;</div><div><span style='font-size:large;'>Use</span><br />You can add this layer to the ArcGIS Online Map Viewer, ArcGIS Desktop, or ArcGIS Pro. To view this layer with a useful reference overlay, open the&nbsp;<a target='_blank' href='https://www.arcgis.com/home/item.html?id=28f49811a6974659988fd279de5ce39f' rel='nofollow ugc noopener noreferrer'>Imagery Hybrid</a>&nbsp;web map.</div><div>&nbsp;</div><div><span style='font-size:large;'>Feedback</span><br />Have you ever seen a problem in the Esri World Imagery Map that you wanted to report? &nbsp;You can use the&nbsp;<a target='_blank' href='https://www.arcgis.com/home/item.html?id=ebdfa4146680410bb952c7d532ea5407' rel='nofollow ugc noopener noreferrer'>Imagery Map Feedback web map</a>&nbsp;to provide comments on issues. The feedback will be reviewed by the ArcGIS Online team and considered for one of our updates.</div><div>&nbsp;</div><div style='background-color:rgb(255, 255, 255); border:0px solid currentcolor; box-sizing:border-box; color:rgb(74, 74, 74); font-family:&quot;Avenir Next&quot;, Avenir, &quot;Helvetica Neue&quot;, sans-serif; font-size:16px; font-style:normal; font-variant-caps:normal; font-variant-ligatures:normal; font-weight:400; letter-spacing:normal; line-height:1.5; text-align:start; text-decoration-color:initial; text-decoration-style:initial; text-indent:0px; text-transform:none; word-spacing:0px;'><span style='font-size:large;'>Need Imagery?</span></div><div style='background-color:rgb(255, 255, 255); border:0px solid currentcolor; box-sizing:border-box; color:rgb(74, 74, 74); font-family:&quot;Avenir Next&quot;, Avenir, &quot;Helvetica Neue&quot;, sans-serif; font-size:16px; font-style:normal; font-variant-caps:normal; font-variant-ligatures:normal; font-weight:400; letter-spacing:normal; line-height:1.5; text-align:start; text-decoration-color:initial; text-decoration-style:initial; text-indent:0px; text-transform:none; word-spacing:0px;'>If you need to access more recent or higher resolution imagery, you can quickly discover, order, and access imagery in the <a style='border:0px solid currentcolor; box-sizing:border-box; color:rgb(0, 97, 155); font-family:inherit; line-height:1.5; text-decoration:none;' target='_blank' href='https://www.esri.com/arcgis-blog/products/arcgis-online/imagery/access-commercial-imagery-in-arcgis' rel='nofollow ugc noopener noreferrer'>Content Store for ArcGIS</a>&nbsp;app.</div><div style='background-color:rgb(255, 255, 255); border:0px solid currentcolor; box-sizing:border-box; color:rgb(74, 74, 74); font-family:&quot;Avenir Next&quot;, Avenir, &quot;Helvetica Neue&quot;, sans-serif; font-size:16px; font-style:normal; font-variant-caps:normal; font-variant-ligatures:normal; font-weight:400; letter-spacing:normal; line-height:1.5; text-align:start; text-decoration-color:initial; text-decoration-style:initial; text-indent:0px; text-transform:none; word-spacing:0px;'><ol><li><a style='border:0px solid currentcolor; box-sizing:border-box; color:rgb(0, 97, 155); font-family:inherit; line-height:1.5; text-decoration:none;' target='_blank' href='https://www.esri.com/arcgis-blog/products/arcgis-online/imagery/access-commercial-imagery-in-arcgis' rel='nofollow ugc noopener noreferrer'>Learn More</a></li><li><a style='border:0px solid currentcolor; box-sizing:border-box; color:rgb(0, 97, 155); font-family:inherit; line-height:1.5; text-decoration:none;' target='_blank' href='https://www.esri.com/en-us/arcgis-marketplace/listing/products/8632a64a287a4232ba44930e2d213e6b' rel='nofollow ugc noopener noreferrer'>Get Access</a></li><li><a style='border:0px solid currentcolor; box-sizing:border-box; color:rgb(0, 97, 155); font-family:inherit; line-height:1.5; text-decoration:none;' target='_blank' href='https://contentstore.skywatch.com/' rel='nofollow ugc noopener noreferrer'>Open App</a></li></ol></div>",
			"keyword": [
				"world",
				"imagery",
				"basemap",
				"satellite",
				"aerial",
				"community",
				"community basemap",
				"orthophotos",
				"esri_basemap"
			],
			"issued": "2009-12-12T19:01:57.000Z",
			"modified": "2026-10-29T15:27:50.000Z",
			"publisher": {
				"name": "Esri"
			},
			"contactPoint": {
				"@type": "vcard:Contact",
				"fn": "esri",
				"hasEmail": "{{orgContactEmail}}"
			},
			"accessLevel": "public",
			"spatial": "-180.0000,-85.0511,180.0000,85.0511",
			"license": "<p><img src='https://downloads.esri.com/blogs/arcgisonline/esrilogo_new.png' /> This work is licensed under the Esri Master License Agreement.</p><div><a target='_blank' href='https://goto.arcgis.com/termsofuse/viewsummary' rel='nofollow ugc noopener noreferrer'><strong>View Summary</strong></a> | <a target='_blank' href='https://goto.arcgis.com/termsofuse/viewtermsofuse' rel='nofollow ugc noopener noreferrer'><strong>View Terms of Use</strong></a></div><div>&nbsp;</div><div><div><strong>Export:</strong> This layer is not intended to be used to export tiles for offline.&nbsp; If you would like to export imagery for offline use in ArcGIS applications, you may use the&nbsp;<a target='_blank' href='https://www.arcgis.com/home/item.html?id=226d23f076da478bba4589e7eae95952' rel='nofollow ugc noopener noreferrer'>World Imagery (for Export)</a>&nbsp;layer, which is intended for this purpose.</div><div>&nbsp;</div><div><strong>Data Collection and Editing:</strong> This layer may be used in various ArcGIS apps to support data collection and editing, with the results used internally or shared with others, as described for these&nbsp;<a target='_blank' href='https://www.arcgis.com/home/item.html?id=8e90a00a0a6845a49262e0b756f57a10' rel='nofollow ugc noopener noreferrer'>use cases</a>.</div></div>",
			"distribution": [
				{
					"@type": "dcat:Distribution",
					"title": "ArcGIS Hub Dataset",
					"format": "Web Page",
					"mediaType": "text/html",
					"accessURL": "https://www.pacificgeoportal.com/datasets/esri::150m-resolution-metadata-114"
				},
				{
					"@type": "dcat:Distribution",
					"title": "ArcGIS GeoService",
					"format": "ArcGIS GeoServices REST API",
					"mediaType": "application/json",
					"accessURL": "https://services.arcgisonline.com/ArcGIS/rest/services/World_Imagery/MapServer/18"
				},
				{
					"@type": "dcat:Distribution",
					"title": "CSV",
					"format": "CSV",
					"mediaType": "text/csv",
					"accessURL": "https://www.pacificgeoportal.com/api/download/v1/items/10df2279f9684e4a9f6a7f08febac2a9/csv?layers=18"
				},
				{
					"@type": "dcat:Distribution",
					"title": "Shapefile",
					"format": "ZIP",
					"mediaType": "application/zip",
					"accessURL": "https://www.pacificgeoportal.com/api/download/v1/items/10df2279f9684e4a9f6a7f08febac2a9/shapefile?layers=18"
				},
				{
					"@type": "dcat:Distribution",
					"title": "GeoJSON",
					"format": "GeoJSON",
					"mediaType": "application/vnd.geo+json",
					"accessURL": "https://www.pacificgeoportal.com/api/download/v1/items/10df2279f9684e4a9f6a7f08febac2a9/geojson?layers=18"
				},
				{
					"@type": "dcat:Distribution",
					"title": "KML",
					"format": "KML",
					"mediaType": "application/vnd.google-earth.kml+xml",
					"accessURL": "https://www.pacificgeoportal.com/api/download/v1/items/10df2279f9684e4a9f6a7f08febac2a9/kml?layers=18"
				}
			],
			"theme": [
				"geospatial"
			]
		},
		{
			"@type": "dcat:Dataset",
			"identifier": "https://www.arcgis.com/home/item.html?id=10df2279f9684e4a9f6a7f08febac2a9&sublayer=2",
			"landingPage": "https://www.pacificgeoportal.com/datasets/esri::high-resolution-60cm-imagery",
			"title": "High Resolution 60cm Imagery",
			"description": "<p>World Imagery provides one meter or better satellite and aerial imagery for most of the world’s landmass and lower resolution satellite imagery worldwide. The map is currently comprised of the following sources:</p><ul><li>Worldwide 15-m resolution TerraColor imagery at small and medium map scales.</li><li>Vantor imagery basemap products around the world: Vivid Premium at 15-cm HD resolution for select metropolitan areas, Vivid Advanced 30-cm HD for more than 1,000 metropolitan areas, and Vivid Standard from 1.2-m to 0.6-cm resolution for the most of the world, with 30-cm HD across the United States and parts of Western Europe. More information on the Vantor products is included below.&nbsp;</li><li>High-resolution aerial photography contributed by the GIS User Community. This imagery ranges from 30-cm to 3-cm resolution. You can contribute your imagery to this map and have it served by Esri via the&nbsp;<a target='_blank' href='https://livingatlas.arcgis.com/en/participate/#v=community&amp;subTab=what-to-contribute' rel='nofollow ugc noopener noreferrer'>Community Maps Program</a>.<br />&nbsp;</li></ul><p><span style='font-size:large;'>Vantor Basemap Products</span></p><p>Vivid Premium</p><p>Provides committed image currency in a high-resolution, high-quality image layer over defined metropolitan and high-interest areas across the globe. The product provides 15-cm HD resolution imagery.</p><p>Vivid Advanced</p><p>Provides committed image currency in a high-resolution, high-quality image layer over defined metropolitan and high-interest areas across the globe. The product includes a mix of native 30-cm and 30-cm HD resolution imagery.</p><p>Vivid Standard</p><p>Provides a visually consistent and continuous image layer over large areas through advanced image mosaicking techniques, including tonal balancing and seamline blending across thousands of image strips. Available from 1.2-m down to 30-cm HD.&nbsp;&nbsp;</p><div><a target='_blank' href='https://blog.maxar.com/leading-the-industry/2020/introducing-hd-see-more-do-more-with-high-definition-imagery' rel='nofollow ugc noopener noreferrer'>More on Vantor HD.</a></div><div>&nbsp;</div><div><span style='font-size:large;'>Imagery Updates</span><br />You can use the <a target='_blank' href='https://livingatlas.arcgis.com/wayback/#mapCenter=10.41504%2C17.77096%2C2&amp;mode=updates' rel='nofollow ugc noopener noreferrer'>Updates Mode</a> in the World Imagery Wayback app to learn more about recent and pending updates. Accessing this information requires a user login with an ArcGIS organizational account.</div><div>&nbsp;</div><div><span style='font-size:large;'>Citations</span><br />This layer includes imagery provider, collection date, resolution,&nbsp;accuracy, and source of the imagery. With the Identify tool in ArcGIS Desktop or the ArcGIS Online Map Viewer&nbsp;you can see imagery citations. Citations returned apply only to the available imagery at that location and scale. You may need to zoom in to view the best available imagery. Citations can also be accessed in the&nbsp;<a target='_blank' href='https://www.arcgis.com/home/item.html?id=c03a526d94704bfb839445e80de95495' rel='nofollow ugc noopener noreferrer'>World Imagery with Metadata web map</a>.</div><div>&nbsp;</div><div><span style='font-size:large;'>Use</span><br />You can add this layer to the ArcGIS Online Map Viewer, ArcGIS Desktop, or ArcGIS Pro. To view this layer with a useful reference overlay, open the&nbsp;<a target='_blank' href='https://www.arcgis.com/home/item.html?id=28f49811a6974659988fd279de5ce39f' rel='nofollow ugc noopener noreferrer'>Imagery Hybrid</a>&nbsp;web map.</div><div>&nbsp;</div><div><span style='font-size:large;'>Feedback</span><br />Have you ever seen a problem in the Esri World Imagery Map that you wanted to report? &nbsp;You can use the&nbsp;<a target='_blank' href='https://www.arcgis.com/home/item.html?id=ebdfa4146680410bb952c7d532ea5407' rel='nofollow ugc noopener noreferrer'>Imagery Map Feedback web map</a>&nbsp;to provide comments on issues. The feedback will be reviewed by the ArcGIS Online team and considered for one of our updates.</div><div>&nbsp;</div><div style='background-color:rgb(255, 255, 255); border:0px solid currentcolor; box-sizing:border-box; color:rgb(74, 74, 74); font-family:&quot;Avenir Next&quot;, Avenir, &quot;Helvetica Neue&quot;, sans-serif; font-size:16px; font-style:normal; font-variant-caps:normal; font-variant-ligatures:normal; font-weight:400; letter-spacing:normal; line-height:1.5; text-align:start; text-decoration-color:initial; text-decoration-style:initial; text-indent:0px; text-transform:none; word-spacing:0px;'><span style='font-size:large;'>Need Imagery?</span></div><div style='background-color:rgb(255, 255, 255); border:0px solid currentcolor; box-sizing:border-box; color:rgb(74, 74, 74); font-family:&quot;Avenir Next&quot;, Avenir, &quot;Helvetica Neue&quot;, sans-serif; font-size:16px; font-style:normal; font-variant-caps:normal; font-variant-ligatures:normal; font-weight:400; letter-spacing:normal; line-height:1.5; text-align:start; text-decoration-color:initial; text-decoration-style:initial; text-indent:0px; text-transform:none; word-spacing:0px;'>If you need to access more recent or higher resolution imagery, you can quickly discover, order, and access imagery in the <a style='border:0px solid currentcolor; box-sizing:border-box; color:rgb(0, 97, 155); font-family:inherit; line-height:1.5; text-decoration:none;' target='_blank' href='https://www.esri.com/arcgis-blog/products/arcgis-online/imagery/access-commercial-imagery-in-arcgis' rel='nofollow ugc noopener noreferrer'>Content Store for ArcGIS</a>&nbsp;app.</div><div style='background-color:rgb(255, 255, 255); border:0px solid currentcolor; box-sizing:border-box; color:rgb(74, 74, 74); font-family:&quot;Avenir Next&quot;, Avenir, &quot;Helvetica Neue&quot;, sans-serif; font-size:16px; font-style:normal; font-variant-caps:normal; font-variant-ligatures:normal; font-weight:400; letter-spacing:normal; line-height:1.5; text-align:start; text-decoration-color:initial; text-decoration-style:initial; text-indent:0px; text-transform:none; word-spacing:0px;'><ol><li><a style='border:0px solid currentcolor; box-sizing:border-box; color:rgb(0, 97, 155); font-family:inherit; line-height:1.5; text-decoration:none;' target='_blank' href='https://www.esri.com/arcgis-blog/products/arcgis-online/imagery/access-commercial-imagery-in-arcgis' rel='nofollow ugc noopener noreferrer'>Learn More</a></li><li><a style='border:0px solid currentcolor; box-sizing:border-box; color:rgb(0, 97, 155); font-family:inherit; line-height:1.5; text-decoration:none;' target='_blank' href='https://www.esri.com/en-us/arcgis-marketplace/listing/products/8632a64a287a4232ba44930e2d213e6b' rel='nofollow ugc noopener noreferrer'>Get Access</a></li><li><a style='border:0px solid currentcolor; box-sizing:border-box; color:rgb(0, 97, 155); font-family:inherit; line-height:1.5; text-decoration:none;' target='_blank' href='https://contentstore.skywatch.com/' rel='nofollow ugc noopener noreferrer'>Open App</a></li></ol></div>",
			"keyword": [
				"world",
				"imagery",
				"basemap",
				"satellite",
				"aerial",
				"community",
				"community basemap",
				"orthophotos",
				"esri_basemap"
			],
			"issued": "2009-12-12T19:01:57.000Z",
			"modified": "2026-10-29T15:27:50.000Z",
			"publisher": {
				"name": "Esri"
			},
			"contactPoint": {
				"@type": "vcard:Contact",
				"fn": "esri",
				"hasEmail": "{{orgContactEmail}}"
			},
			"accessLevel": "public",
			"spatial": "-180.0000,-85.0511,180.0000,85.0511",
			"license": "<p><img src='https://downloads.esri.com/blogs/arcgisonline/esrilogo_new.png' /> This work is licensed under the Esri Master License Agreement.</p><div><a target='_blank' href='https://goto.arcgis.com/termsofuse/viewsummary' rel='nofollow ugc noopener noreferrer'><strong>View Summary</strong></a> | <a target='_blank' href='https://goto.arcgis.com/termsofuse/viewtermsofuse' rel='nofollow ugc noopener noreferrer'><strong>View Terms of Use</strong></a></div><div>&nbsp;</div><div><div><strong>Export:</strong> This layer is not intended to be used to export tiles for offline.&nbsp; If you would like to export imagery for offline use in ArcGIS applications, you may use the&nbsp;<a target='_blank' href='https://www.arcgis.com/home/item.html?id=226d23f076da478bba4589e7eae95952' rel='nofollow ugc noopener noreferrer'>World Imagery (for Export)</a>&nbsp;layer, which is intended for this purpose.</div><div>&nbsp;</div><div><strong>Data Collection and Editing:</strong> This layer may be used in various ArcGIS apps to support data collection and editing, with the results used internally or shared with others, as described for these&nbsp;<a target='_blank' href='https://www.arcgis.com/home/item.html?id=8e90a00a0a6845a49262e0b756f57a10' rel='nofollow ugc noopener noreferrer'>use cases</a>.</div></div>",
			"distribution": [
				{
					"@type": "dcat:Distribution",
					"title": "ArcGIS Hub Dataset",
					"format": "Web Page",
					"mediaType": "text/html",
					"accessURL": "https://www.pacificgeoportal.com/datasets/esri::high-resolution-60cm-imagery"
				},
				{
					"@type": "dcat:Distribution",
					"title": "ArcGIS GeoService",
					"format": "ArcGIS GeoServices REST API",
					"mediaType": "application/json",
					"accessURL": "https://services.arcgisonline.com/ArcGIS/rest/services/World_Imagery/MapServer/2"
				},
				{
					"@type": "dcat:Distribution",
					"title": "CSV",
					"format": "CSV",
					"mediaType": "text/csv",
					"accessURL": "https://www.pacificgeoportal.com/api/download/v1/items/10df2279f9684e4a9f6a7f08febac2a9/csv?layers=2"
				},
				{
					"@type": "dcat:Distribution",
					"title": "Shapefile",
					"format": "ZIP",
					"mediaType": "application/zip",
					"accessURL": "https://www.pacificgeoportal.com/api/download/v1/items/10df2279f9684e4a9f6a7f08febac2a9/shapefile?layers=2"
				},
				{
					"@type": "dcat:Distribution",
					"title": "GeoJSON",
					"format": "GeoJSON",
					"mediaType": "application/vnd.geo+json",
					"accessURL": "https://www.pacificgeoportal.com/api/download/v1/items/10df2279f9684e4a9f6a7f08febac2a9/geojson?layers=2"
				},
				{
					"@type": "dcat:Distribution",
					"title": "KML",
					"format": "KML",
					"mediaType": "application/vnd.google-earth.kml+xml",
					"accessURL": "https://www.pacificgeoportal.com/api/download/v1/items/10df2279f9684e4a9f6a7f08febac2a9/kml?layers=2"
				}
			],
			"theme": [
				"geospatial"
			]
		},
		{
			"@type": "dcat:Dataset",
			"identifier": "https://www.arcgis.com/home/item.html?id=10df2279f9684e4a9f6a7f08febac2a9&sublayer=3",
			"landingPage": "https://www.pacificgeoportal.com/datasets/esri::high-resolution-30cm-imagery",
			"title": "High Resolution 30cm Imagery",
			"description": "<p>World Imagery provides one meter or better satellite and aerial imagery for most of the world’s landmass and lower resolution satellite imagery worldwide. The map is currently comprised of the following sources:</p><ul><li>Worldwide 15-m resolution TerraColor imagery at small and medium map scales.</li><li>Vantor imagery basemap products around the world: Vivid Premium at 15-cm HD resolution for select metropolitan areas, Vivid Advanced 30-cm HD for more than 1,000 metropolitan areas, and Vivid Standard from 1.2-m to 0.6-cm resolution for the most of the world, with 30-cm HD across the United States and parts of Western Europe. More information on the Vantor products is included below.&nbsp;</li><li>High-resolution aerial photography contributed by the GIS User Community. This imagery ranges from 30-cm to 3-cm resolution. You can contribute your imagery to this map and have it served by Esri via the&nbsp;<a target='_blank' href='https://livingatlas.arcgis.com/en/participate/#v=community&amp;subTab=what-to-contribute' rel='nofollow ugc noopener noreferrer'>Community Maps Program</a>.<br />&nbsp;</li></ul><p><span style='font-size:large;'>Vantor Basemap Products</span></p><p>Vivid Premium</p><p>Provides committed image currency in a high-resolution, high-quality image layer over defined metropolitan and high-interest areas across the globe. The product provides 15-cm HD resolution imagery.</p><p>Vivid Advanced</p><p>Provides committed image currency in a high-resolution, high-quality image layer over defined metropolitan and high-interest areas across the globe. The product includes a mix of native 30-cm and 30-cm HD resolution imagery.</p><p>Vivid Standard</p><p>Provides a visually consistent and continuous image layer over large areas through advanced image mosaicking techniques, including tonal balancing and seamline blending across thousands of image strips. Available from 1.2-m down to 30-cm HD.&nbsp;&nbsp;</p><div><a target='_blank' href='https://blog.maxar.com/leading-the-industry/2020/introducing-hd-see-more-do-more-with-high-definition-imagery' rel='nofollow ugc noopener noreferrer'>More on Vantor HD.</a></div><div>&nbsp;</div><div><span style='font-size:large;'>Imagery Updates</span><br />You can use the <a target='_blank' href='https://livingatlas.arcgis.com/wayback/#mapCenter=10.41504%2C17.77096%2C2&amp;mode=updates' rel='nofollow ugc noopener noreferrer'>Updates Mode</a> in the World Imagery Wayback app to learn more about recent and pending updates. Accessing this information requires a user login with an ArcGIS organizational account.</div><div>&nbsp;</div><div><span style='font-size:large;'>Citations</span><br />This layer includes imagery provider, collection date, resolution,&nbsp;accuracy, and source of the imagery. With the Identify tool in ArcGIS Desktop or the ArcGIS Online Map Viewer&nbsp;you can see imagery citations. Citations returned apply only to the available imagery at that location and scale. You may need to zoom in to view the best available imagery. Citations can also be accessed in the&nbsp;<a target='_blank' href='https://www.arcgis.com/home/item.html?id=c03a526d94704bfb839445e80de95495' rel='nofollow ugc noopener noreferrer'>World Imagery with Metadata web map</a>.</div><div>&nbsp;</div><div><span style='font-size:large;'>Use</span><br />You can add this layer to the ArcGIS Online Map Viewer, ArcGIS Desktop, or ArcGIS Pro. To view this layer with a useful reference overlay, open the&nbsp;<a target='_blank' href='https://www.arcgis.com/home/item.html?id=28f49811a6974659988fd279de5ce39f' rel='nofollow ugc noopener noreferrer'>Imagery Hybrid</a>&nbsp;web map.</div><div>&nbsp;</div><div><span style='font-size:large;'>Feedback</span><br />Have you ever seen a problem in the Esri World Imagery Map that you wanted to report? &nbsp;You can use the&nbsp;<a target='_blank' href='https://www.arcgis.com/home/item.html?id=ebdfa4146680410bb952c7d532ea5407' rel='nofollow ugc noopener noreferrer'>Imagery Map Feedback web map</a>&nbsp;to provide comments on issues. The feedback will be reviewed by the ArcGIS Online team and considered for one of our updates.</div><div>&nbsp;</div><div style='background-color:rgb(255, 255, 255); border:0px solid currentcolor; box-sizing:border-box; color:rgb(74, 74, 74); font-family:&quot;Avenir Next&quot;, Avenir, &quot;Helvetica Neue&quot;, sans-serif; font-size:16px; font-style:normal; font-variant-caps:normal; font-variant-ligatures:normal; font-weight:400; letter-spacing:normal; line-height:1.5; text-align:start; text-decoration-color:initial; text-decoration-style:initial; text-indent:0px; text-transform:none; word-spacing:0px;'><span style='font-size:large;'>Need Imagery?</span></div><div style='background-color:rgb(255, 255, 255); border:0px solid currentcolor; box-sizing:border-box; color:rgb(74, 74, 74); font-family:&quot;Avenir Next&quot;, Avenir, &quot;Helvetica Neue&quot;, sans-serif; font-size:16px; font-style:normal; font-variant-caps:normal; font-variant-ligatures:normal; font-weight:400; letter-spacing:normal; line-height:1.5; text-align:start; text-decoration-color:initial; text-decoration-style:initial; text-indent:0px; text-transform:none; word-spacing:0px;'>If you need to access more recent or higher resolution imagery, you can quickly discover, order, and access imagery in the <a style='border:0px solid currentcolor; box-sizing:border-box; color:rgb(0, 97, 155); font-family:inherit; line-height:1.5; text-decoration:none;' target='_blank' href='https://www.esri.com/arcgis-blog/products/arcgis-online/imagery/access-commercial-imagery-in-arcgis' rel='nofollow ugc noopener noreferrer'>Content Store for ArcGIS</a>&nbsp;app.</div><div style='background-color:rgb(255, 255, 255); border:0px solid currentcolor; box-sizing:border-box; color:rgb(74, 74, 74); font-family:&quot;Avenir Next&quot;, Avenir, &quot;Helvetica Neue&quot;, sans-serif; font-size:16px; font-style:normal; font-variant-caps:normal; font-variant-ligatures:normal; font-weight:400; letter-spacing:normal; line-height:1.5; text-align:start; text-decoration-color:initial; text-decoration-style:initial; text-indent:0px; text-transform:none; word-spacing:0px;'><ol><li><a style='border:0px solid currentcolor; box-sizing:border-box; color:rgb(0, 97, 155); font-family:inherit; line-height:1.5; text-decoration:none;' target='_blank' href='https://www.esri.com/arcgis-blog/products/arcgis-online/imagery/access-commercial-imagery-in-arcgis' rel='nofollow ugc noopener noreferrer'>Learn More</a></li><li><a style='border:0px solid currentcolor; box-sizing:border-box; color:rgb(0, 97, 155); font-family:inherit; line-height:1.5; text-decoration:none;' target='_blank' href='https://www.esri.com/en-us/arcgis-marketplace/listing/products/8632a64a287a4232ba44930e2d213e6b' rel='nofollow ugc noopener noreferrer'>Get Access</a></li><li><a style='border:0px solid currentcolor; box-sizing:border-box; color:rgb(0, 97, 155); font-family:inherit; line-height:1.5; text-decoration:none;' target='_blank' href='https://contentstore.skywatch.com/' rel='nofollow ugc noopener noreferrer'>Open App</a></li></ol></div>",
			"keyword": [
				"world",
				"imagery",
				"basemap",
				"satellite",
				"aerial",
				"community",
				"community basemap",
				"orthophotos",
				"esri_basemap"
			],
			"issued": "2009-12-12T19:01:57.000Z",
			"modified": "2026-10-29T15:27:50.000Z",
			"publisher": {
				"name": "Esri"
			},
			"contactPoint": {
				"@type": "vcard:Contact",
				"fn": "esri",
				"hasEmail": "{{orgContactEmail}}"
			},
			"accessLevel": "public",
			"spatial": "-180.0000,-85.0511,180.0000,85.0511",
			"license": "<p><img src='https://downloads.esri.com/blogs/arcgisonline/esrilogo_new.png' /> This work is licensed under the Esri Master License Agreement.</p><div><a target='_blank' href='https://goto.arcgis.com/termsofuse/viewsummary' rel='nofollow ugc noopener noreferrer'><strong>View Summary</strong></a> | <a target='_blank' href='https://goto.arcgis.com/termsofuse/viewtermsofuse' rel='nofollow ugc noopener noreferrer'><strong>View Terms of Use</strong></a></div><div>&nbsp;</div><div><div><strong>Export:</strong> This layer is not intended to be used to export tiles for offline.&nbsp; If you would like to export imagery for offline use in ArcGIS applications, you may use the&nbsp;<a target='_blank' href='https://www.arcgis.com/home/item.html?id=226d23f076da478bba4589e7eae95952' rel='nofollow ugc noopener noreferrer'>World Imagery (for Export)</a>&nbsp;layer, which is intended for this purpose.</div><div>&nbsp;</div><div><strong>Data Collection and Editing:</strong> This layer may be used in various ArcGIS apps to support data collection and editing, with the results used internally or shared with others, as described for these&nbsp;<a target='_blank' href='https://www.arcgis.com/home/item.html?id=8e90a00a0a6845a49262e0b756f57a10' rel='nofollow ugc noopener noreferrer'>use cases</a>.</div></div>",
			"distribution": [
				{
					"@type": "dcat:Distribution",
					"title": "ArcGIS Hub Dataset",
					"format": "Web Page",
					"mediaType": "text/html",
					"accessURL": "https://www.pacificgeoportal.com/datasets/esri::high-resolution-30cm-imagery"
				},
				{
					"@type": "dcat:Distribution",
					"title": "ArcGIS GeoService",
					"format": "ArcGIS GeoServices REST API",
					"mediaType": "application/json",
					"accessURL": "https://services.arcgisonline.com/ArcGIS/rest/services/World_Imagery/MapServer/3"
				},
				{
					"@type": "dcat:Distribution",
					"title": "CSV",
					"format": "CSV",
					"mediaType": "text/csv",
					"accessURL": "https://www.pacificgeoportal.com/api/download/v1/items/10df2279f9684e4a9f6a7f08febac2a9/csv?layers=3"
				},
				{
					"@type": "dcat:Distribution",
					"title": "Shapefile",
					"format": "ZIP",
					"mediaType": "application/zip",
					"accessURL": "https://www.pacificgeoportal.com/api/download/v1/items/10df2279f9684e4a9f6a7f08febac2a9/shapefile?layers=3"
				},
				{
					"@type": "dcat:Distribution",
					"title": "GeoJSON",
					"format": "GeoJSON",
					"mediaType": "application/vnd.geo+json",
					"accessURL": "https://www.pacificgeoportal.com/api/download/v1/items/10df2279f9684e4a9f6a7f08febac2a9/geojson?layers=3"
				},
				{
					"@type": "dcat:Distribution",
					"title": "KML",
					"format": "KML",
					"mediaType": "application/vnd.google-earth.kml+xml",
					"accessURL": "https://www.pacificgeoportal.com/api/download/v1/items/10df2279f9684e4a9f6a7f08febac2a9/kml?layers=3"
				}
			],
			"theme": [
				"geospatial"
			]
		},
		{
			"@type": "dcat:Dataset",
			"identifier": "https://www.arcgis.com/home/item.html?id=10df2279f9684e4a9f6a7f08febac2a9&sublayer=4",
			"landingPage": "https://www.pacificgeoportal.com/datasets/esri::citations",
			"title": "Citations",
			"description": "<p>World Imagery provides one meter or better satellite and aerial imagery for most of the world’s landmass and lower resolution satellite imagery worldwide. The map is currently comprised of the following sources:</p><ul><li>Worldwide 15-m resolution TerraColor imagery at small and medium map scales.</li><li>Vantor imagery basemap products around the world: Vivid Premium at 15-cm HD resolution for select metropolitan areas, Vivid Advanced 30-cm HD for more than 1,000 metropolitan areas, and Vivid Standard from 1.2-m to 0.6-cm resolution for the most of the world, with 30-cm HD across the United States and parts of Western Europe. More information on the Vantor products is included below.&nbsp;</li><li>High-resolution aerial photography contributed by the GIS User Community. This imagery ranges from 30-cm to 3-cm resolution. You can contribute your imagery to this map and have it served by Esri via the&nbsp;<a target='_blank' href='https://livingatlas.arcgis.com/en/participate/#v=community&amp;subTab=what-to-contribute' rel='nofollow ugc noopener noreferrer'>Community Maps Program</a>.<br />&nbsp;</li></ul><p><span style='font-size:large;'>Vantor Basemap Products</span></p><p>Vivid Premium</p><p>Provides committed image currency in a high-resolution, high-quality image layer over defined metropolitan and high-interest areas across the globe. The product provides 15-cm HD resolution imagery.</p><p>Vivid Advanced</p><p>Provides committed image currency in a high-resolution, high-quality image layer over defined metropolitan and high-interest areas across the globe. The product includes a mix of native 30-cm and 30-cm HD resolution imagery.</p><p>Vivid Standard</p><p>Provides a visually consistent and continuous image layer over large areas through advanced image mosaicking techniques, including tonal balancing and seamline blending across thousands of image strips. Available from 1.2-m down to 30-cm HD.&nbsp;&nbsp;</p><div><a target='_blank' href='https://blog.maxar.com/leading-the-industry/2020/introducing-hd-see-more-do-more-with-high-definition-imagery' rel='nofollow ugc noopener noreferrer'>More on Vantor HD.</a></div><div>&nbsp;</div><div><span style='font-size:large;'>Imagery Updates</span><br />You can use the <a target='_blank' href='https://livingatlas.arcgis.com/wayback/#mapCenter=10.41504%2C17.77096%2C2&amp;mode=updates' rel='nofollow ugc noopener noreferrer'>Updates Mode</a> in the World Imagery Wayback app to learn more about recent and pending updates. Accessing this information requires a user login with an ArcGIS organizational account.</div><div>&nbsp;</div><div><span style='font-size:large;'>Citations</span><br />This layer includes imagery provider, collection date, resolution,&nbsp;accuracy, and source of the imagery. With the Identify tool in ArcGIS Desktop or the ArcGIS Online Map Viewer&nbsp;you can see imagery citations. Citations returned apply only to the available imagery at that location and scale. You may need to zoom in to view the best available imagery. Citations can also be accessed in the&nbsp;<a target='_blank' href='https://www.arcgis.com/home/item.html?id=c03a526d94704bfb839445e80de95495' rel='nofollow ugc noopener noreferrer'>World Imagery with Metadata web map</a>.</div><div>&nbsp;</div><div><span style='font-size:large;'>Use</span><br />You can add this layer to the ArcGIS Online Map Viewer, ArcGIS Desktop, or ArcGIS Pro. To view this layer with a useful reference overlay, open the&nbsp;<a target='_blank' href='https://www.arcgis.com/home/item.html?id=28f49811a6974659988fd279de5ce39f' rel='nofollow ugc noopener noreferrer'>Imagery Hybrid</a>&nbsp;web map.</div><div>&nbsp;</div><div><span style='font-size:large;'>Feedback</span><br />Have you ever seen a problem in the Esri World Imagery Map that you wanted to report? &nbsp;You can use the&nbsp;<a target='_blank' href='https://www.arcgis.com/home/item.html?id=ebdfa4146680410bb952c7d532ea5407' rel='nofollow ugc noopener noreferrer'>Imagery Map Feedback web map</a>&nbsp;to provide comments on issues. The feedback will be reviewed by the ArcGIS Online team and considered for one of our updates.</div><div>&nbsp;</div><div style='background-color:rgb(255, 255, 255); border:0px solid currentcolor; box-sizing:border-box; color:rgb(74, 74, 74); font-family:&quot;Avenir Next&quot;, Avenir, &quot;Helvetica Neue&quot;, sans-serif; font-size:16px; font-style:normal; font-variant-caps:normal; font-variant-ligatures:normal; font-weight:400; letter-spacing:normal; line-height:1.5; text-align:start; text-decoration-color:initial; text-decoration-style:initial; text-indent:0px; text-transform:none; word-spacing:0px;'><span style='font-size:large;'>Need Imagery?</span></div><div style='background-color:rgb(255, 255, 255); border:0px solid currentcolor; box-sizing:border-box; color:rgb(74, 74, 74); font-family:&quot;Avenir Next&quot;, Avenir, &quot;Helvetica Neue&quot;, sans-serif; font-size:16px; font-style:normal; font-variant-caps:normal; font-variant-ligatures:normal; font-weight:400; letter-spacing:normal; line-height:1.5; text-align:start; text-decoration-color:initial; text-decoration-style:initial; text-indent:0px; text-transform:none; word-spacing:0px;'>If you need to access more recent or higher resolution imagery, you can quickly discover, order, and access imagery in the <a style='border:0px solid currentcolor; box-sizing:border-box; color:rgb(0, 97, 155); font-family:inherit; line-height:1.5; text-decoration:none;' target='_blank' href='https://www.esri.com/arcgis-blog/products/arcgis-online/imagery/access-commercial-imagery-in-arcgis' rel='nofollow ugc noopener noreferrer'>Content Store for ArcGIS</a>&nbsp;app.</div><div style='background-color:rgb(255, 255, 255); border:0px solid currentcolor; box-sizing:border-box; color:rgb(74, 74, 74); font-family:&quot;Avenir Next&quot;, Avenir, &quot;Helvetica Neue&quot;, sans-serif; font-size:16px; font-style:normal; font-variant-caps:normal; font-variant-ligatures:normal; font-weight:400; letter-spacing:normal; line-height:1.5; text-align:start; text-decoration-color:initial; text-decoration-style:initial; text-indent:0px; text-transform:none; word-spacing:0px;'><ol><li><a style='border:0px solid currentcolor; box-sizing:border-box; color:rgb(0, 97, 155); font-family:inherit; line-height:1.5; text-decoration:none;' target='_blank' href='https://www.esri.com/arcgis-blog/products/arcgis-online/imagery/access-commercial-imagery-in-arcgis' rel='nofollow ugc noopener noreferrer'>Learn More</a></li><li><a style='border:0px solid currentcolor; box-sizing:border-box; color:rgb(0, 97, 155); font-family:inherit; line-height:1.5; text-decoration:none;' target='_blank' href='https://www.esri.com/en-us/arcgis-marketplace/listing/products/8632a64a287a4232ba44930e2d213e6b' rel='nofollow ugc noopener noreferrer'>Get Access</a></li><li><a style='border:0px solid currentcolor; box-sizing:border-box; color:rgb(0, 97, 155); font-family:inherit; line-height:1.5; text-decoration:none;' target='_blank' href='https://contentstore.skywatch.com/' rel='nofollow ugc noopener noreferrer'>Open App</a></li></ol></div>",
			"keyword": [
				"world",
				"imagery",
				"basemap",
				"satellite",
				"aerial",
				"community",
				"community basemap",
				"orthophotos",
				"esri_basemap"
			],
			"issued": "2009-12-12T19:01:57.000Z",
			"modified": "2026-10-29T15:27:50.000Z",
			"publisher": {
				"name": "Esri"
			},
			"contactPoint": {
				"@type": "vcard:Contact",
				"fn": "esri",
				"hasEmail": "{{orgContactEmail}}"
			},
			"accessLevel": "public",
			"spatial": "-180.0000,-85.0511,180.0000,85.0511",
			"license": "<p><img src='https://downloads.esri.com/blogs/arcgisonline/esrilogo_new.png' /> This work is licensed under the Esri Master License Agreement.</p><div><a target='_blank' href='https://goto.arcgis.com/termsofuse/viewsummary' rel='nofollow ugc noopener noreferrer'><strong>View Summary</strong></a> | <a target='_blank' href='https://goto.arcgis.com/termsofuse/viewtermsofuse' rel='nofollow ugc noopener noreferrer'><strong>View Terms of Use</strong></a></div><div>&nbsp;</div><div><div><strong>Export:</strong> This layer is not intended to be used to export tiles for offline.&nbsp; If you would like to export imagery for offline use in ArcGIS applications, you may use the&nbsp;<a target='_blank' href='https://www.arcgis.com/home/item.html?id=226d23f076da478bba4589e7eae95952' rel='nofollow ugc noopener noreferrer'>World Imagery (for Export)</a>&nbsp;layer, which is intended for this purpose.</div><div>&nbsp;</div><div><strong>Data Collection and Editing:</strong> This layer may be used in various ArcGIS apps to support data collection and editing, with the results used internally or shared with others, as described for these&nbsp;<a target='_blank' href='https://www.arcgis.com/home/item.html?id=8e90a00a0a6845a49262e0b756f57a10' rel='nofollow ugc noopener noreferrer'>use cases</a>.</div></div>",
			"distribution": [
				{
					"@type": "dcat:Distribution",
					"title": "ArcGIS Hub Dataset",
					"format": "Web Page",
					"mediaType": "text/html",
					"accessURL": "https://www.pacificgeoportal.com/datasets/esri::citations"
				},
				{
					"@type": "dcat:Distribution",
					"title": "ArcGIS GeoService",
					"format": "ArcGIS GeoServices REST API",
					"mediaType": "application/json",
					"accessURL": "https://services.arcgisonline.com/ArcGIS/rest/services/World_Imagery/MapServer/4"
				},
				{
					"@type": "dcat:Distribution",
					"title": "CSV",
					"format": "CSV",
					"mediaType": "text/csv",
					"accessURL": "https://www.pacificgeoportal.com/api/download/v1/items/10df2279f9684e4a9f6a7f08febac2a9/csv?layers=4"
				},
				{
					"@type": "dcat:Distribution",
					"title": "Shapefile",
					"format": "ZIP",
					"mediaType": "application/zip",
					"accessURL": "https://www.pacificgeoportal.com/api/download/v1/items/10df2279f9684e4a9f6a7f08febac2a9/shapefile?layers=4"
				},
				{
					"@type": "dcat:Distribution",
					"title": "GeoJSON",
					"format": "GeoJSON",
					"mediaType": "application/vnd.geo+json",
					"accessURL": "https://www.pacificgeoportal.com/api/download/v1/items/10df2279f9684e4a9f6a7f08febac2a9/geojson?layers=4"
				},
				{
					"@type": "dcat:Distribution",
					"title": "KML",
					"format": "KML",
					"mediaType": "application/vnd.google-earth.kml+xml",
					"accessURL": "https://www.pacificgeoportal.com/api/download/v1/items/10df2279f9684e4a9f6a7f08febac2a9/kml?layers=4"
				}
			],
			"theme": [
				"geospatial"
			]
		},
		{
			"@type": "dcat:Dataset",
			"identifier": "https://www.arcgis.com/home/item.html?id=10df2279f9684e4a9f6a7f08febac2a9&sublayer=5",
			"landingPage": "https://www.pacificgeoportal.com/datasets/esri::1-9cm-resolution-metadata-114",
			"title": "1.9cm Resolution Metadata",
			"description": "<p>World Imagery provides one meter or better satellite and aerial imagery for most of the world’s landmass and lower resolution satellite imagery worldwide. The map is currently comprised of the following sources:</p><ul><li>Worldwide 15-m resolution TerraColor imagery at small and medium map scales.</li><li>Vantor imagery basemap products around the world: Vivid Premium at 15-cm HD resolution for select metropolitan areas, Vivid Advanced 30-cm HD for more than 1,000 metropolitan areas, and Vivid Standard from 1.2-m to 0.6-cm resolution for the most of the world, with 30-cm HD across the United States and parts of Western Europe. More information on the Vantor products is included below.&nbsp;</li><li>High-resolution aerial photography contributed by the GIS User Community. This imagery ranges from 30-cm to 3-cm resolution. You can contribute your imagery to this map and have it served by Esri via the&nbsp;<a target='_blank' href='https://livingatlas.arcgis.com/en/participate/#v=community&amp;subTab=what-to-contribute' rel='nofollow ugc noopener noreferrer'>Community Maps Program</a>.<br />&nbsp;</li></ul><p><span style='font-size:large;'>Vantor Basemap Products</span></p><p>Vivid Premium</p><p>Provides committed image currency in a high-resolution, high-quality image layer over defined metropolitan and high-interest areas across the globe. The product provides 15-cm HD resolution imagery.</p><p>Vivid Advanced</p><p>Provides committed image currency in a high-resolution, high-quality image layer over defined metropolitan and high-interest areas across the globe. The product includes a mix of native 30-cm and 30-cm HD resolution imagery.</p><p>Vivid Standard</p><p>Provides a visually consistent and continuous image layer over large areas through advanced image mosaicking techniques, including tonal balancing and seamline blending across thousands of image strips. Available from 1.2-m down to 30-cm HD.&nbsp;&nbsp;</p><div><a target='_blank' href='https://blog.maxar.com/leading-the-industry/2020/introducing-hd-see-more-do-more-with-high-definition-imagery' rel='nofollow ugc noopener noreferrer'>More on Vantor HD.</a></div><div>&nbsp;</div><div><span style='font-size:large;'>Imagery Updates</span><br />You can use the <a target='_blank' href='https://livingatlas.arcgis.com/wayback/#mapCenter=10.41504%2C17.77096%2C2&amp;mode=updates' rel='nofollow ugc noopener noreferrer'>Updates Mode</a> in the World Imagery Wayback app to learn more about recent and pending updates. Accessing this information requires a user login with an ArcGIS organizational account.</div><div>&nbsp;</div><div><span style='font-size:large;'>Citations</span><br />This layer includes imagery provider, collection date, resolution,&nbsp;accuracy, and source of the imagery. With the Identify tool in ArcGIS Desktop or the ArcGIS Online Map Viewer&nbsp;you can see imagery citations. Citations returned apply only to the available imagery at that location and scale. You may need to zoom in to view the best available imagery. Citations can also be accessed in the&nbsp;<a target='_blank' href='https://www.arcgis.com/home/item.html?id=c03a526d94704bfb839445e80de95495' rel='nofollow ugc noopener noreferrer'>World Imagery with Metadata web map</a>.</div><div>&nbsp;</div><div><span style='font-size:large;'>Use</span><br />You can add this layer to the ArcGIS Online Map Viewer, ArcGIS Desktop, or ArcGIS Pro. To view this layer with a useful reference overlay, open the&nbsp;<a target='_blank' href='https://www.arcgis.com/home/item.html?id=28f49811a6974659988fd279de5ce39f' rel='nofollow ugc noopener noreferrer'>Imagery Hybrid</a>&nbsp;web map.</div><div>&nbsp;</div><div><span style='font-size:large;'>Feedback</span><br />Have you ever seen a problem in the Esri World Imagery Map that you wanted to report? &nbsp;You can use the&nbsp;<a target='_blank' href='https://www.arcgis.com/home/item.html?id=ebdfa4146680410bb952c7d532ea5407' rel='nofollow ugc noopener noreferrer'>Imagery Map Feedback web map</a>&nbsp;to provide comments on issues. The feedback will be reviewed by the ArcGIS Online team and considered for one of our updates.</div><div>&nbsp;</div><div style='background-color:rgb(255, 255, 255); border:0px solid currentcolor; box-sizing:border-box; color:rgb(74, 74, 74); font-family:&quot;Avenir Next&quot;, Avenir, &quot;Helvetica Neue&quot;, sans-serif; font-size:16px; font-style:normal; font-variant-caps:normal; font-variant-ligatures:normal; font-weight:400; letter-spacing:normal; line-height:1.5; text-align:start; text-decoration-color:initial; text-decoration-style:initial; text-indent:0px; text-transform:none; word-spacing:0px;'><span style='font-size:large;'>Need Imagery?</span></div><div style='background-color:rgb(255, 255, 255); border:0px solid currentcolor; box-sizing:border-box; color:rgb(74, 74, 74); font-family:&quot;Avenir Next&quot;, Avenir, &quot;Helvetica Neue&quot;, sans-serif; font-size:16px; font-style:normal; font-variant-caps:normal; font-variant-ligatures:normal; font-weight:400; letter-spacing:normal; line-height:1.5; text-align:start; text-decoration-color:initial; text-decoration-style:initial; text-indent:0px; text-transform:none; word-spacing:0px;'>If you need to access more recent or higher resolution imagery, you can quickly discover, order, and access imagery in the <a style='border:0px solid currentcolor; box-sizing:border-box; color:rgb(0, 97, 155); font-family:inherit; line-height:1.5; text-decoration:none;' target='_blank' href='https://www.esri.com/arcgis-blog/products/arcgis-online/imagery/access-commercial-imagery-in-arcgis' rel='nofollow ugc noopener noreferrer'>Content Store for ArcGIS</a>&nbsp;app.</div><div style='background-color:rgb(255, 255, 255); border:0px solid currentcolor; box-sizing:border-box; color:rgb(74, 74, 74); font-family:&quot;Avenir Next&quot;, Avenir, &quot;Helvetica Neue&quot;, sans-serif; font-size:16px; font-style:normal; font-variant-caps:normal; font-variant-ligatures:normal; font-weight:400; letter-spacing:normal; line-height:1.5; text-align:start; text-decoration-color:initial; text-decoration-style:initial; text-indent:0px; text-transform:none; word-spacing:0px;'><ol><li><a style='border:0px solid currentcolor; box-sizing:border-box; color:rgb(0, 97, 155); font-family:inherit; line-height:1.5; text-decoration:none;' target='_blank' href='https://www.esri.com/arcgis-blog/products/arcgis-online/imagery/access-commercial-imagery-in-arcgis' rel='nofollow ugc noopener noreferrer'>Learn More</a></li><li><a style='border:0px solid currentcolor; box-sizing:border-box; color:rgb(0, 97, 155); font-family:inherit; line-height:1.5; text-decoration:none;' target='_blank' href='https://www.esri.com/en-us/arcgis-marketplace/listing/products/8632a64a287a4232ba44930e2d213e6b' rel='nofollow ugc noopener noreferrer'>Get Access</a></li><li><a style='border:0px solid currentcolor; box-sizing:border-box; color:rgb(0, 97, 155); font-family:inherit; line-height:1.5; text-decoration:none;' target='_blank' href='https://contentstore.skywatch.com/' rel='nofollow ugc noopener noreferrer'>Open App</a></li></ol></div>",
			"keyword": [
				"world",
				"imagery",
				"basemap",
				"satellite",
				"aerial",
				"community",
				"community basemap",
				"orthophotos",
				"esri_basemap"
			],
			"issued": "2009-12-12T19:01:57.000Z",
			"modified": "2026-10-29T15:27:50.000Z",
			"publisher": {
				"name": "Esri"
			},
			"contactPoint": {
				"@type": "vcard:Contact",
				"fn": "esri",
				"hasEmail": "{{orgContactEmail}}"
			},
			"accessLevel": "public",
			"spatial": "-180.0000,-85.0511,180.0000,85.0511",
			"license": "<p><img src='https://downloads.esri.com/blogs/arcgisonline/esrilogo_new.png' /> This work is licensed under the Esri Master License Agreement.</p><div><a target='_blank' href='https://goto.arcgis.com/termsofuse/viewsummary' rel='nofollow ugc noopener noreferrer'><strong>View Summary</strong></a> | <a target='_blank' href='https://goto.arcgis.com/termsofuse/viewtermsofuse' rel='nofollow ugc noopener noreferrer'><strong>View Terms of Use</strong></a></div><div>&nbsp;</div><div><div><strong>Export:</strong> This layer is not intended to be used to export tiles for offline.&nbsp; If you would like to export imagery for offline use in ArcGIS applications, you may use the&nbsp;<a target='_blank' href='https://www.arcgis.com/home/item.html?id=226d23f076da478bba4589e7eae95952' rel='nofollow ugc noopener noreferrer'>World Imagery (for Export)</a>&nbsp;layer, which is intended for this purpose.</div><div>&nbsp;</div><div><strong>Data Collection and Editing:</strong> This layer may be used in various ArcGIS apps to support data collection and editing, with the results used internally or shared with others, as described for these&nbsp;<a target='_blank' href='https://www.arcgis.com/home/item.html?id=8e90a00a0a6845a49262e0b756f57a10' rel='nofollow ugc noopener noreferrer'>use cases</a>.</div></div>",
			"distribution": [
				{
					"@type": "dcat:Distribution",
					"title": "ArcGIS Hub Dataset",
					"format": "Web Page",
					"mediaType": "text/html",
					"accessURL": "https://www.pacificgeoportal.com/datasets/esri::1-9cm-resolution-metadata-114"
				},
				{
					"@type": "dcat:Distribution",
					"title": "ArcGIS GeoService",
					"format": "ArcGIS GeoServices REST API",
					"mediaType": "application/json",
					"accessURL": "https://services.arcgisonline.com/ArcGIS/rest/services/World_Imagery/MapServer/5"
				},
				{
					"@type": "dcat:Distribution",
					"title": "CSV",
					"format": "CSV",
					"mediaType": "text/csv",
					"accessURL": "https://www.pacificgeoportal.com/api/download/v1/items/10df2279f9684e4a9f6a7f08febac2a9/csv?layers=5"
				},
				{
					"@type": "dcat:Distribution",
					"title": "Shapefile",
					"format": "ZIP",
					"mediaType": "application/zip",
					"accessURL": "https://www.pacificgeoportal.com/api/download/v1/items/10df2279f9684e4a9f6a7f08febac2a9/shapefile?layers=5"
				},
				{
					"@type": "dcat:Distribution",
					"title": "GeoJSON",
					"format": "GeoJSON",
					"mediaType": "application/vnd.geo+json",
					"accessURL": "https://www.pacificgeoportal.com/api/download/v1/items/10df2279f9684e4a9f6a7f08febac2a9/geojson?layers=5"
				},
				{
					"@type": "dcat:Distribution",
					"title": "KML",
					"format": "KML",
					"mediaType": "application/vnd.google-earth.kml+xml",
					"accessURL": "https://www.pacificgeoportal.com/api/download/v1/items/10df2279f9684e4a9f6a7f08febac2a9/kml?layers=5"
				}
			],
			"theme": [
				"geospatial"
			]
		},
		{
			"@type": "dcat:Dataset",
			"identifier": "https://www.arcgis.com/home/item.html?id=10df2279f9684e4a9f6a7f08febac2a9&sublayer=6",
			"landingPage": "https://www.pacificgeoportal.com/datasets/esri::3-7cm-resolution-metadata-114",
			"title": "3.7cm Resolution Metadata",
			"description": "<p>World Imagery provides one meter or better satellite and aerial imagery for most of the world’s landmass and lower resolution satellite imagery worldwide. The map is currently comprised of the following sources:</p><ul><li>Worldwide 15-m resolution TerraColor imagery at small and medium map scales.</li><li>Vantor imagery basemap products around the world: Vivid Premium at 15-cm HD resolution for select metropolitan areas, Vivid Advanced 30-cm HD for more than 1,000 metropolitan areas, and Vivid Standard from 1.2-m to 0.6-cm resolution for the most of the world, with 30-cm HD across the United States and parts of Western Europe. More information on the Vantor products is included below.&nbsp;</li><li>High-resolution aerial photography contributed by the GIS User Community. This imagery ranges from 30-cm to 3-cm resolution. You can contribute your imagery to this map and have it served by Esri via the&nbsp;<a target='_blank' href='https://livingatlas.arcgis.com/en/participate/#v=community&amp;subTab=what-to-contribute' rel='nofollow ugc noopener noreferrer'>Community Maps Program</a>.<br />&nbsp;</li></ul><p><span style='font-size:large;'>Vantor Basemap Products</span></p><p>Vivid Premium</p><p>Provides committed image currency in a high-resolution, high-quality image layer over defined metropolitan and high-interest areas across the globe. The product provides 15-cm HD resolution imagery.</p><p>Vivid Advanced</p><p>Provides committed image currency in a high-resolution, high-quality image layer over defined metropolitan and high-interest areas across the globe. The product includes a mix of native 30-cm and 30-cm HD resolution imagery.</p><p>Vivid Standard</p><p>Provides a visually consistent and continuous image layer over large areas through advanced image mosaicking techniques, including tonal balancing and seamline blending across thousands of image strips. Available from 1.2-m down to 30-cm HD.&nbsp;&nbsp;</p><div><a target='_blank' href='https://blog.maxar.com/leading-the-industry/2020/introducing-hd-see-more-do-more-with-high-definition-imagery' rel='nofollow ugc noopener noreferrer'>More on Vantor HD.</a></div><div>&nbsp;</div><div><span style='font-size:large;'>Imagery Updates</span><br />You can use the <a target='_blank' href='https://livingatlas.arcgis.com/wayback/#mapCenter=10.41504%2C17.77096%2C2&amp;mode=updates' rel='nofollow ugc noopener noreferrer'>Updates Mode</a> in the World Imagery Wayback app to learn more about recent and pending updates. Accessing this information requires a user login with an ArcGIS organizational account.</div><div>&nbsp;</div><div><span style='font-size:large;'>Citations</span><br />This layer includes imagery provider, collection date, resolution,&nbsp;accuracy, and source of the imagery. With the Identify tool in ArcGIS Desktop or the ArcGIS Online Map Viewer&nbsp;you can see imagery citations. Citations returned apply only to the available imagery at that location and scale. You may need to zoom in to view the best available imagery. Citations can also be accessed in the&nbsp;<a target='_blank' href='https://www.arcgis.com/home/item.html?id=c03a526d94704bfb839445e80de95495' rel='nofollow ugc noopener noreferrer'>World Imagery with Metadata web map</a>.</div><div>&nbsp;</div><div><span style='font-size:large;'>Use</span><br />You can add this layer to the ArcGIS Online Map Viewer, ArcGIS Desktop, or ArcGIS Pro. To view this layer with a useful reference overlay, open the&nbsp;<a target='_blank' href='https://www.arcgis.com/home/item.html?id=28f49811a6974659988fd279de5ce39f' rel='nofollow ugc noopener noreferrer'>Imagery Hybrid</a>&nbsp;web map.</div><div>&nbsp;</div><div><span style='font-size:large;'>Feedback</span><br />Have you ever seen a problem in the Esri World Imagery Map that you wanted to report? &nbsp;You can use the&nbsp;<a target='_blank' href='https://www.arcgis.com/home/item.html?id=ebdfa4146680410bb952c7d532ea5407' rel='nofollow ugc noopener noreferrer'>Imagery Map Feedback web map</a>&nbsp;to provide comments on issues. The feedback will be reviewed by the ArcGIS Online team and considered for one of our updates.</div><div>&nbsp;</div><div style='background-color:rgb(255, 255, 255); border:0px solid currentcolor; box-sizing:border-box; color:rgb(74, 74, 74); font-family:&quot;Avenir Next&quot;, Avenir, &quot;Helvetica Neue&quot;, sans-serif; font-size:16px; font-style:normal; font-variant-caps:normal; font-variant-ligatures:normal; font-weight:400; letter-spacing:normal; line-height:1.5; text-align:start; text-decoration-color:initial; text-decoration-style:initial; text-indent:0px; text-transform:none; word-spacing:0px;'><span style='font-size:large;'>Need Imagery?</span></div><div style='background-color:rgb(255, 255, 255); border:0px solid currentcolor; box-sizing:border-box; color:rgb(74, 74, 74); font-family:&quot;Avenir Next&quot;, Avenir, &quot;Helvetica Neue&quot;, sans-serif; font-size:16px; font-style:normal; font-variant-caps:normal; font-variant-ligatures:normal; font-weight:400; letter-spacing:normal; line-height:1.5; text-align:start; text-decoration-color:initial; text-decoration-style:initial; text-indent:0px; text-transform:none; word-spacing:0px;'>If you need to access more recent or higher resolution imagery, you can quickly discover, order, and access imagery in the <a style='border:0px solid currentcolor; box-sizing:border-box; color:rgb(0, 97, 155); font-family:inherit; line-height:1.5; text-decoration:none;' target='_blank' href='https://www.esri.com/arcgis-blog/products/arcgis-online/imagery/access-commercial-imagery-in-arcgis' rel='nofollow ugc noopener noreferrer'>Content Store for ArcGIS</a>&nbsp;app.</div><div style='background-color:rgb(255, 255, 255); border:0px solid currentcolor; box-sizing:border-box; color:rgb(74, 74, 74); font-family:&quot;Avenir Next&quot;, Avenir, &quot;Helvetica Neue&quot;, sans-serif; font-size:16px; font-style:normal; font-variant-caps:normal; font-variant-ligatures:normal; font-weight:400; letter-spacing:normal; line-height:1.5; text-align:start; text-decoration-color:initial; text-decoration-style:initial; text-indent:0px; text-transform:none; word-spacing:0px;'><ol><li><a style='border:0px solid currentcolor; box-sizing:border-box; color:rgb(0, 97, 155); font-family:inherit; line-height:1.5; text-decoration:none;' target='_blank' href='https://www.esri.com/arcgis-blog/products/arcgis-online/imagery/access-commercial-imagery-in-arcgis' rel='nofollow ugc noopener noreferrer'>Learn More</a></li><li><a style='border:0px solid currentcolor; box-sizing:border-box; color:rgb(0, 97, 155); font-family:inherit; line-height:1.5; text-decoration:none;' target='_blank' href='https://www.esri.com/en-us/arcgis-marketplace/listing/products/8632a64a287a4232ba44930e2d213e6b' rel='nofollow ugc noopener noreferrer'>Get Access</a></li><li><a style='border:0px solid currentcolor; box-sizing:border-box; color:rgb(0, 97, 155); font-family:inherit; line-height:1.5; text-decoration:none;' target='_blank' href='https://contentstore.skywatch.com/' rel='nofollow ugc noopener noreferrer'>Open App</a></li></ol></div>",
			"keyword": [
				"world",
				"imagery",
				"basemap",
				"satellite",
				"aerial",
				"community",
				"community basemap",
				"orthophotos",
				"esri_basemap"
			],
			"issued": "2009-12-12T19:01:57.000Z",
			"modified": "2026-10-29T15:27:50.000Z",
			"publisher": {
				"name": "Esri"
			},
			"contactPoint": {
				"@type": "vcard:Contact",
				"fn": "esri",
				"hasEmail": "{{orgContactEmail}}"
			},
			"accessLevel": "public",
			"spatial": "-180.0000,-85.0511,180.0000,85.0511",
			"license": "<p><img src='https://downloads.esri.com/blogs/arcgisonline/esrilogo_new.png' /> This work is licensed under the Esri Master License Agreement.</p><div><a target='_blank' href='https://goto.arcgis.com/termsofuse/viewsummary' rel='nofollow ugc noopener noreferrer'><strong>View Summary</strong></a> | <a target='_blank' href='https://goto.arcgis.com/termsofuse/viewtermsofuse' rel='nofollow ugc noopener noreferrer'><strong>View Terms of Use</strong></a></div><div>&nbsp;</div><div><div><strong>Export:</strong> This layer is not intended to be used to export tiles for offline.&nbsp; If you would like to export imagery for offline use in ArcGIS applications, you may use the&nbsp;<a target='_blank' href='https://www.arcgis.com/home/item.html?id=226d23f076da478bba4589e7eae95952' rel='nofollow ugc noopener noreferrer'>World Imagery (for Export)</a>&nbsp;layer, which is intended for this purpose.</div><div>&nbsp;</div><div><strong>Data Collection and Editing:</strong> This layer may be used in various ArcGIS apps to support data collection and editing, with the results used internally or shared with others, as described for these&nbsp;<a target='_blank' href='https://www.arcgis.com/home/item.html?id=8e90a00a0a6845a49262e0b756f57a10' rel='nofollow ugc noopener noreferrer'>use cases</a>.</div></div>",
			"distribution": [
				{
					"@type": "dcat:Distribution",
					"title": "ArcGIS Hub Dataset",
					"format": "Web Page",
					"mediaType": "text/html",
					"accessURL": "https://www.pacificgeoportal.com/datasets/esri::3-7cm-resolution-metadata-114"
				},
				{
					"@type": "dcat:Distribution",
					"title": "ArcGIS GeoService",
					"format": "ArcGIS GeoServices REST API",
					"mediaType": "application/json",
					"accessURL": "https://services.arcgisonline.com/ArcGIS/rest/services/World_Imagery/MapServer/6"
				},
				{
					"@type": "dcat:Distribution",
					"title": "CSV",
					"format": "CSV",
					"mediaType": "text/csv",
					"accessURL": "https://www.pacificgeoportal.com/api/download/v1/items/10df2279f9684e4a9f6a7f08febac2a9/csv?layers=6"
				},
				{
					"@type": "dcat:Distribution",
					"title": "Shapefile",
					"format": "ZIP",
					"mediaType": "application/zip",
					"accessURL": "https://www.pacificgeoportal.com/api/download/v1/items/10df2279f9684e4a9f6a7f08febac2a9/shapefile?layers=6"
				},
				{
					"@type": "dcat:Distribution",
					"title": "GeoJSON",
					"format": "GeoJSON",
					"mediaType": "application/vnd.geo+json",
					"accessURL": "https://www.pacificgeoportal.com/api/download/v1/items/10df2279f9684e4a9f6a7f08febac2a9/geojson?layers=6"
				},
				{
					"@type": "dcat:Distribution",
					"title": "KML",
					"format": "KML",
					"mediaType": "application/vnd.google-earth.kml+xml",
					"accessURL": "https://www.pacificgeoportal.com/api/download/v1/items/10df2279f9684e4a9f6a7f08febac2a9/kml?layers=6"
				}
			],
			"theme": [
				"geospatial"
			]
		},
		{
			"@type": "dcat:Dataset",
			"identifier": "https://www.arcgis.com/home/item.html?id=10df2279f9684e4a9f6a7f08febac2a9&sublayer=7",
			"landingPage": "https://www.pacificgeoportal.com/datasets/esri::7-5cm-resolution-metadata-114",
			"title": "7.5cm Resolution Metadata",
			"description": "<p>World Imagery provides one meter or better satellite and aerial imagery for most of the world’s landmass and lower resolution satellite imagery worldwide. The map is currently comprised of the following sources:</p><ul><li>Worldwide 15-m resolution TerraColor imagery at small and medium map scales.</li><li>Vantor imagery basemap products around the world: Vivid Premium at 15-cm HD resolution for select metropolitan areas, Vivid Advanced 30-cm HD for more than 1,000 metropolitan areas, and Vivid Standard from 1.2-m to 0.6-cm resolution for the most of the world, with 30-cm HD across the United States and parts of Western Europe. More information on the Vantor products is included below.&nbsp;</li><li>High-resolution aerial photography contributed by the GIS User Community. This imagery ranges from 30-cm to 3-cm resolution. You can contribute your imagery to this map and have it served by Esri via the&nbsp;<a target='_blank' href='https://livingatlas.arcgis.com/en/participate/#v=community&amp;subTab=what-to-contribute' rel='nofollow ugc noopener noreferrer'>Community Maps Program</a>.<br />&nbsp;</li></ul><p><span style='font-size:large;'>Vantor Basemap Products</span></p><p>Vivid Premium</p><p>Provides committed image currency in a high-resolution, high-quality image layer over defined metropolitan and high-interest areas across the globe. The product provides 15-cm HD resolution imagery.</p><p>Vivid Advanced</p><p>Provides committed image currency in a high-resolution, high-quality image layer over defined metropolitan and high-interest areas across the globe. The product includes a mix of native 30-cm and 30-cm HD resolution imagery.</p><p>Vivid Standard</p><p>Provides a visually consistent and continuous image layer over large areas through advanced image mosaicking techniques, including tonal balancing and seamline blending across thousands of image strips. Available from 1.2-m down to 30-cm HD.&nbsp;&nbsp;</p><div><a target='_blank' href='https://blog.maxar.com/leading-the-industry/2020/introducing-hd-see-more-do-more-with-high-definition-imagery' rel='nofollow ugc noopener noreferrer'>More on Vantor HD.</a></div><div>&nbsp;</div><div><span style='font-size:large;'>Imagery Updates</span><br />You can use the <a target='_blank' href='https://livingatlas.arcgis.com/wayback/#mapCenter=10.41504%2C17.77096%2C2&amp;mode=updates' rel='nofollow ugc noopener noreferrer'>Updates Mode</a> in the World Imagery Wayback app to learn more about recent and pending updates. Accessing this information requires a user login with an ArcGIS organizational account.</div><div>&nbsp;</div><div><span style='font-size:large;'>Citations</span><br />This layer includes imagery provider, collection date, resolution,&nbsp;accuracy, and source of the imagery. With the Identify tool in ArcGIS Desktop or the ArcGIS Online Map Viewer&nbsp;you can see imagery citations. Citations returned apply only to the available imagery at that location and scale. You may need to zoom in to view the best available imagery. Citations can also be accessed in the&nbsp;<a target='_blank' href='https://www.arcgis.com/home/item.html?id=c03a526d94704bfb839445e80de95495' rel='nofollow ugc noopener noreferrer'>World Imagery with Metadata web map</a>.</div><div>&nbsp;</div><div><span style='font-size:large;'>Use</span><br />You can add this layer to the ArcGIS Online Map Viewer, ArcGIS Desktop, or ArcGIS Pro. To view this layer with a useful reference overlay, open the&nbsp;<a target='_blank' href='https://www.arcgis.com/home/item.html?id=28f49811a6974659988fd279de5ce39f' rel='nofollow ugc noopener noreferrer'>Imagery Hybrid</a>&nbsp;web map.</div><div>&nbsp;</div><div><span style='font-size:large;'>Feedback</span><br />Have you ever seen a problem in the Esri World Imagery Map that you wanted to report? &nbsp;You can use the&nbsp;<a target='_blank' href='https://www.arcgis.com/home/item.html?id=ebdfa4146680410bb952c7d532ea5407' rel='nofollow ugc noopener noreferrer'>Imagery Map Feedback web map</a>&nbsp;to provide comments on issues. The feedback will be reviewed by the ArcGIS Online team and considered for one of our updates.</div><div>&nbsp;</div><div style='background-color:rgb(255, 255, 255); border:0px solid currentcolor; box-sizing:border-box; color:rgb(74, 74, 74); font-family:&quot;Avenir Next&quot;, Avenir, &quot;Helvetica Neue&quot;, sans-serif; font-size:16px; font-style:normal; font-variant-caps:normal; font-variant-ligatures:normal; font-weight:400; letter-spacing:normal; line-height:1.5; text-align:start; text-decoration-color:initial; text-decoration-style:initial; text-indent:0px; text-transform:none; word-spacing:0px;'><span style='font-size:large;'>Need Imagery?</span></div><div style='background-color:rgb(255, 255, 255); border:0px solid currentcolor; box-sizing:border-box; color:rgb(74, 74, 74); font-family:&quot;Avenir Next&quot;, Avenir, &quot;Helvetica Neue&quot;, sans-serif; font-size:16px; font-style:normal; font-variant-caps:normal; font-variant-ligatures:normal; font-weight:400; letter-spacing:normal; line-height:1.5; text-align:start; text-decoration-color:initial; text-decoration-style:initial; text-indent:0px; text-transform:none; word-spacing:0px;'>If you need to access more recent or higher resolution imagery, you can quickly discover, order, and access imagery in the <a style='border:0px solid currentcolor; box-sizing:border-box; color:rgb(0, 97, 155); font-family:inherit; line-height:1.5; text-decoration:none;' target='_blank' href='https://www.esri.com/arcgis-blog/products/arcgis-online/imagery/access-commercial-imagery-in-arcgis' rel='nofollow ugc noopener noreferrer'>Content Store for ArcGIS</a>&nbsp;app.</div><div style='background-color:rgb(255, 255, 255); border:0px solid currentcolor; box-sizing:border-box; color:rgb(74, 74, 74); font-family:&quot;Avenir Next&quot;, Avenir, &quot;Helvetica Neue&quot;, sans-serif; font-size:16px; font-style:normal; font-variant-caps:normal; font-variant-ligatures:normal; font-weight:400; letter-spacing:normal; line-height:1.5; text-align:start; text-decoration-color:initial; text-decoration-style:initial; text-indent:0px; text-transform:none; word-spacing:0px;'><ol><li><a style='border:0px solid currentcolor; box-sizing:border-box; color:rgb(0, 97, 155); font-family:inherit; line-height:1.5; text-decoration:none;' target='_blank' href='https://www.esri.com/arcgis-blog/products/arcgis-online/imagery/access-commercial-imagery-in-arcgis' rel='nofollow ugc noopener noreferrer'>Learn More</a></li><li><a style='border:0px solid currentcolor; box-sizing:border-box; color:rgb(0, 97, 155); font-family:inherit; line-height:1.5; text-decoration:none;' target='_blank' href='https://www.esri.com/en-us/arcgis-marketplace/listing/products/8632a64a287a4232ba44930e2d213e6b' rel='nofollow ugc noopener noreferrer'>Get Access</a></li><li><a style='border:0px solid currentcolor; box-sizing:border-box; color:rgb(0, 97, 155); font-family:inherit; line-height:1.5; text-decoration:none;' target='_blank' href='https://contentstore.skywatch.com/' rel='nofollow ugc noopener noreferrer'>Open App</a></li></ol></div>",
			"keyword": [
				"world",
				"imagery",
				"basemap",
				"satellite",
				"aerial",
				"community",
				"community basemap",
				"orthophotos",
				"esri_basemap"
			],
			"issued": "2009-12-12T19:01:57.000Z",
			"modified": "2026-10-29T15:27:50.000Z",
			"publisher": {
				"name": "Esri"
			},
			"contactPoint": {
				"@type": "vcard:Contact",
				"fn": "esri",
				"hasEmail": "{{orgContactEmail}}"
			},
			"accessLevel": "public",
			"spatial": "-180.0000,-85.0511,180.0000,85.0511",
			"license": "<p><img src='https://downloads.esri.com/blogs/arcgisonline/esrilogo_new.png' /> This work is licensed under the Esri Master License Agreement.</p><div><a target='_blank' href='https://goto.arcgis.com/termsofuse/viewsummary' rel='nofollow ugc noopener noreferrer'><strong>View Summary</strong></a> | <a target='_blank' href='https://goto.arcgis.com/termsofuse/viewtermsofuse' rel='nofollow ugc noopener noreferrer'><strong>View Terms of Use</strong></a></div><div>&nbsp;</div><div><div><strong>Export:</strong> This layer is not intended to be used to export tiles for offline.&nbsp; If you would like to export imagery for offline use in ArcGIS applications, you may use the&nbsp;<a target='_blank' href='https://www.arcgis.com/home/item.html?id=226d23f076da478bba4589e7eae95952' rel='nofollow ugc noopener noreferrer'>World Imagery (for Export)</a>&nbsp;layer, which is intended for this purpose.</div><div>&nbsp;</div><div><strong>Data Collection and Editing:</strong> This layer may be used in various ArcGIS apps to support data collection and editing, with the results used internally or shared with others, as described for these&nbsp;<a target='_blank' href='https://www.arcgis.com/home/item.html?id=8e90a00a0a6845a49262e0b756f57a10' rel='nofollow ugc noopener noreferrer'>use cases</a>.</div></div>",
			"distribution": [
				{
					"@type": "dcat:Distribution",
					"title": "ArcGIS Hub Dataset",
					"format": "Web Page",
					"mediaType": "text/html",
					"accessURL": "https://www.pacificgeoportal.com/datasets/esri::7-5cm-resolution-metadata-114"
				},
				{
					"@type": "dcat:Distribution",
					"title": "ArcGIS GeoService",
					"format": "ArcGIS GeoServices REST API",
					"mediaType": "application/json",
					"accessURL": "https://services.arcgisonline.com/ArcGIS/rest/services/World_Imagery/MapServer/7"
				},
				{
					"@type": "dcat:Distribution",
					"title": "CSV",
					"format": "CSV",
					"mediaType": "text/csv",
					"accessURL": "https://www.pacificgeoportal.com/api/download/v1/items/10df2279f9684e4a9f6a7f08febac2a9/csv?layers=7"
				},
				{
					"@type": "dcat:Distribution",
					"title": "Shapefile",
					"format": "ZIP",
					"mediaType": "application/zip",
					"accessURL": "https://www.pacificgeoportal.com/api/download/v1/items/10df2279f9684e4a9f6a7f08febac2a9/shapefile?layers=7"
				},
				{
					"@type": "dcat:Distribution",
					"title": "GeoJSON",
					"format": "GeoJSON",
					"mediaType": "application/vnd.geo+json",
					"accessURL": "https://www.pacificgeoportal.com/api/download/v1/items/10df2279f9684e4a9f6a7f08febac2a9/geojson?layers=7"
				},
				{
					"@type": "dcat:Distribution",
					"title": "KML",
					"format": "KML",
					"mediaType": "application/vnd.google-earth.kml+xml",
					"accessURL": "https://www.pacificgeoportal.com/api/download/v1/items/10df2279f9684e4a9f6a7f08febac2a9/kml?layers=7"
				}
			],
			"theme": [
				"geospatial"
			]
		},
		{
			"@type": "dcat:Dataset",
			"identifier": "https://www.arcgis.com/home/item.html?id=10df2279f9684e4a9f6a7f08febac2a9&sublayer=8",
			"landingPage": "https://www.pacificgeoportal.com/datasets/esri::15cm-resolution-metadata-114",
			"title": "15cm Resolution Metadata",
			"description": "<p>World Imagery provides one meter or better satellite and aerial imagery for most of the world’s landmass and lower resolution satellite imagery worldwide. The map is currently comprised of the following sources:</p><ul><li>Worldwide 15-m resolution TerraColor imagery at small and medium map scales.</li><li>Vantor imagery basemap products around the world: Vivid Premium at 15-cm HD resolution for select metropolitan areas, Vivid Advanced 30-cm HD for more than 1,000 metropolitan areas, and Vivid Standard from 1.2-m to 0.6-cm resolution for the most of the world, with 30-cm HD across the United States and parts of Western Europe. More information on the Vantor products is included below.&nbsp;</li><li>High-resolution aerial photography contributed by the GIS User Community. This imagery ranges from 30-cm to 3-cm resolution. You can contribute your imagery to this map and have it served by Esri via the&nbsp;<a target='_blank' href='https://livingatlas.arcgis.com/en/participate/#v=community&amp;subTab=what-to-contribute' rel='nofollow ugc noopener noreferrer'>Community Maps Program</a>.<br />&nbsp;</li></ul><p><span style='font-size:large;'>Vantor Basemap Products</span></p><p>Vivid Premium</p><p>Provides committed image currency in a high-resolution, high-quality image layer over defined metropolitan and high-interest areas across the globe. The product provides 15-cm HD resolution imagery.</p><p>Vivid Advanced</p><p>Provides committed image currency in a high-resolution, high-quality image layer over defined metropolitan and high-interest areas across the globe. The product includes a mix of native 30-cm and 30-cm HD resolution imagery.</p><p>Vivid Standard</p><p>Provides a visually consistent and continuous image layer over large areas through advanced image mosaicking techniques, including tonal balancing and seamline blending across thousands of image strips. Available from 1.2-m down to 30-cm HD.&nbsp;&nbsp;</p><div><a target='_blank' href='https://blog.maxar.com/leading-the-industry/2020/introducing-hd-see-more-do-more-with-high-definition-imagery' rel='nofollow ugc noopener noreferrer'>More on Vantor HD.</a></div><div>&nbsp;</div><div><span style='font-size:large;'>Imagery Updates</span><br />You can use the <a target='_blank' href='https://livingatlas.arcgis.com/wayback/#mapCenter=10.41504%2C17.77096%2C2&amp;mode=updates' rel='nofollow ugc noopener noreferrer'>Updates Mode</a> in the World Imagery Wayback app to learn more about recent and pending updates. Accessing this information requires a user login with an ArcGIS organizational account.</div><div>&nbsp;</div><div><span style='font-size:large;'>Citations</span><br />This layer includes imagery provider, collection date, resolution,&nbsp;accuracy, and source of the imagery. With the Identify tool in ArcGIS Desktop or the ArcGIS Online Map Viewer&nbsp;you can see imagery citations. Citations returned apply only to the available imagery at that location and scale. You may need to zoom in to view the best available imagery. Citations can also be accessed in the&nbsp;<a target='_blank' href='https://www.arcgis.com/home/item.html?id=c03a526d94704bfb839445e80de95495' rel='nofollow ugc noopener noreferrer'>World Imagery with Metadata web map</a>.</div><div>&nbsp;</div><div><span style='font-size:large;'>Use</span><br />You can add this layer to the ArcGIS Online Map Viewer, ArcGIS Desktop, or ArcGIS Pro. To view this layer with a useful reference overlay, open the&nbsp;<a target='_blank' href='https://www.arcgis.com/home/item.html?id=28f49811a6974659988fd279de5ce39f' rel='nofollow ugc noopener noreferrer'>Imagery Hybrid</a>&nbsp;web map.</div><div>&nbsp;</div><div><span style='font-size:large;'>Feedback</span><br />Have you ever seen a problem in the Esri World Imagery Map that you wanted to report? &nbsp;You can use the&nbsp;<a target='_blank' href='https://www.arcgis.com/home/item.html?id=ebdfa4146680410bb952c7d532ea5407' rel='nofollow ugc noopener noreferrer'>Imagery Map Feedback web map</a>&nbsp;to provide comments on issues. The feedback will be reviewed by the ArcGIS Online team and considered for one of our updates.</div><div>&nbsp;</div><div style='background-color:rgb(255, 255, 255); border:0px solid currentcolor; box-sizing:border-box; color:rgb(74, 74, 74); font-family:&quot;Avenir Next&quot;, Avenir, &quot;Helvetica Neue&quot;, sans-serif; font-size:16px; font-style:normal; font-variant-caps:normal; font-variant-ligatures:normal; font-weight:400; letter-spacing:normal; line-height:1.5; text-align:start; text-decoration-color:initial; text-decoration-style:initial; text-indent:0px; text-transform:none; word-spacing:0px;'><span style='font-size:large;'>Need Imagery?</span></div><div style='background-color:rgb(255, 255, 255); border:0px solid currentcolor; box-sizing:border-box; color:rgb(74, 74, 74); font-family:&quot;Avenir Next&quot;, Avenir, &quot;Helvetica Neue&quot;, sans-serif; font-size:16px; font-style:normal; font-variant-caps:normal; font-variant-ligatures:normal; font-weight:400; letter-spacing:normal; line-height:1.5; text-align:start; text-decoration-color:initial; text-decoration-style:initial; text-indent:0px; text-transform:none; word-spacing:0px;'>If you need to access more recent or higher resolution imagery, you can quickly discover, order, and access imagery in the <a style='border:0px solid currentcolor; box-sizing:border-box; color:rgb(0, 97, 155); font-family:inherit; line-height:1.5; text-decoration:none;' target='_blank' href='https://www.esri.com/arcgis-blog/products/arcgis-online/imagery/access-commercial-imagery-in-arcgis' rel='nofollow ugc noopener noreferrer'>Content Store for ArcGIS</a>&nbsp;app.</div><div style='background-color:rgb(255, 255, 255); border:0px solid currentcolor; box-sizing:border-box; color:rgb(74, 74, 74); font-family:&quot;Avenir Next&quot;, Avenir, &quot;Helvetica Neue&quot;, sans-serif; font-size:16px; font-style:normal; font-variant-caps:normal; font-variant-ligatures:normal; font-weight:400; letter-spacing:normal; line-height:1.5; text-align:start; text-decoration-color:initial; text-decoration-style:initial; text-indent:0px; text-transform:none; word-spacing:0px;'><ol><li><a style='border:0px solid currentcolor; box-sizing:border-box; color:rgb(0, 97, 155); font-family:inherit; line-height:1.5; text-decoration:none;' target='_blank' href='https://www.esri.com/arcgis-blog/products/arcgis-online/imagery/access-commercial-imagery-in-arcgis' rel='nofollow ugc noopener noreferrer'>Learn More</a></li><li><a style='border:0px solid currentcolor; box-sizing:border-box; color:rgb(0, 97, 155); font-family:inherit; line-height:1.5; text-decoration:none;' target='_blank' href='https://www.esri.com/en-us/arcgis-marketplace/listing/products/8632a64a287a4232ba44930e2d213e6b' rel='nofollow ugc noopener noreferrer'>Get Access</a></li><li><a style='border:0px solid currentcolor; box-sizing:border-box; color:rgb(0, 97, 155); font-family:inherit; line-height:1.5; text-decoration:none;' target='_blank' href='https://contentstore.skywatch.com/' rel='nofollow ugc noopener noreferrer'>Open App</a></li></ol></div>",
			"keyword": [
				"world",
				"imagery",
				"basemap",
				"satellite",
				"aerial",
				"community",
				"community basemap",
				"orthophotos",
				"esri_basemap"
			],
			"issued": "2009-12-12T19:01:57.000Z",
			"modified": "2026-10-29T15:27:50.000Z",
			"publisher": {
				"name": "Esri"
			},
			"contactPoint": {
				"@type": "vcard:Contact",
				"fn": "esri",
				"hasEmail": "{{orgContactEmail}}"
			},
			"accessLevel": "public",
			"spatial": "-180.0000,-85.0511,180.0000,85.0511",
			"license": "<p><img src='https://downloads.esri.com/blogs/arcgisonline/esrilogo_new.png' /> This work is licensed under the Esri Master License Agreement.</p><div><a target='_blank' href='https://goto.arcgis.com/termsofuse/viewsummary' rel='nofollow ugc noopener noreferrer'><strong>View Summary</strong></a> | <a target='_blank' href='https://goto.arcgis.com/termsofuse/viewtermsofuse' rel='nofollow ugc noopener noreferrer'><strong>View Terms of Use</strong></a></div><div>&nbsp;</div><div><div><strong>Export:</strong> This layer is not intended to be used to export tiles for offline.&nbsp; If you would like to export imagery for offline use in ArcGIS applications, you may use the&nbsp;<a target='_blank' href='https://www.arcgis.com/home/item.html?id=226d23f076da478bba4589e7eae95952' rel='nofollow ugc noopener noreferrer'>World Imagery (for Export)</a>&nbsp;layer, which is intended for this purpose.</div><div>&nbsp;</div><div><strong>Data Collection and Editing:</strong> This layer may be used in various ArcGIS apps to support data collection and editing, with the results used internally or shared with others, as described for these&nbsp;<a target='_blank' href='https://www.arcgis.com/home/item.html?id=8e90a00a0a6845a49262e0b756f57a10' rel='nofollow ugc noopener noreferrer'>use cases</a>.</div></div>",
			"distribution": [
				{
					"@type": "dcat:Distribution",
					"title": "ArcGIS Hub Dataset",
					"format": "Web Page",
					"mediaType": "text/html",
					"accessURL": "https://www.pacificgeoportal.com/datasets/esri::15cm-resolution-metadata-114"
				},
				{
					"@type": "dcat:Distribution",
					"title": "ArcGIS GeoService",
					"format": "ArcGIS GeoServices REST API",
					"mediaType": "application/json",
					"accessURL": "https://services.arcgisonline.com/ArcGIS/rest/services/World_Imagery/MapServer/8"
				},
				{
					"@type": "dcat:Distribution",
					"title": "CSV",
					"format": "CSV",
					"mediaType": "text/csv",
					"accessURL": "https://www.pacificgeoportal.com/api/download/v1/items/10df2279f9684e4a9f6a7f08febac2a9/csv?layers=8"
				},
				{
					"@type": "dcat:Distribution",
					"title": "Shapefile",
					"format": "ZIP",
					"mediaType": "application/zip",
					"accessURL": "https://www.pacificgeoportal.com/api/download/v1/items/10df2279f9684e4a9f6a7f08febac2a9/shapefile?layers=8"
				},
				{
					"@type": "dcat:Distribution",
					"title": "GeoJSON",
					"format": "GeoJSON",
					"mediaType": "application/vnd.geo+json",
					"accessURL": "https://www.pacificgeoportal.com/api/download/v1/items/10df2279f9684e4a9f6a7f08febac2a9/geojson?layers=8"
				},
				{
					"@type": "dcat:Distribution",
					"title": "KML",
					"format": "KML",
					"mediaType": "application/vnd.google-earth.kml+xml",
					"accessURL": "https://www.pacificgeoportal.com/api/download/v1/items/10df2279f9684e4a9f6a7f08febac2a9/kml?layers=8"
				}
			],
			"theme": [
				"geospatial"
			]
		},
		{
			"@type": "dcat:Dataset",
			"identifier": "https://www.arcgis.com/home/item.html?id=10df2279f9684e4a9f6a7f08febac2a9&sublayer=9",
			"landingPage": "https://www.pacificgeoportal.com/datasets/esri::30cm-resolution-metadata-114",
			"title": "30cm Resolution Metadata",
			"description": "<p>World Imagery provides one meter or better satellite and aerial imagery for most of the world’s landmass and lower resolution satellite imagery worldwide. The map is currently comprised of the following sources:</p><ul><li>Worldwide 15-m resolution TerraColor imagery at small and medium map scales.</li><li>Vantor imagery basemap products around the world: Vivid Premium at 15-cm HD resolution for select metropolitan areas, Vivid Advanced 30-cm HD for more than 1,000 metropolitan areas, and Vivid Standard from 1.2-m to 0.6-cm resolution for the most of the world, with 30-cm HD across the United States and parts of Western Europe. More information on the Vantor products is included below.&nbsp;</li><li>High-resolution aerial photography contributed by the GIS User Community. This imagery ranges from 30-cm to 3-cm resolution. You can contribute your imagery to this map and have it served by Esri via the&nbsp;<a target='_blank' href='https://livingatlas.arcgis.com/en/participate/#v=community&amp;subTab=what-to-contribute' rel='nofollow ugc noopener noreferrer'>Community Maps Program</a>.<br />&nbsp;</li></ul><p><span style='font-size:large;'>Vantor Basemap Products</span></p><p>Vivid Premium</p><p>Provides committed image currency in a high-resolution, high-quality image layer over defined metropolitan and high-interest areas across the globe. The product provides 15-cm HD resolution imagery.</p><p>Vivid Advanced</p><p>Provides committed image currency in a high-resolution, high-quality image layer over defined metropolitan and high-interest areas across the globe. The product includes a mix of native 30-cm and 30-cm HD resolution imagery.</p><p>Vivid Standard</p><p>Provides a visually consistent and continuous image layer over large areas through advanced image mosaicking techniques, including tonal balancing and seamline blending across thousands of image strips. Available from 1.2-m down to 30-cm HD.&nbsp;&nbsp;</p><div><a target='_blank' href='https://blog.maxar.com/leading-the-industry/2020/introducing-hd-see-more-do-more-with-high-definition-imagery' rel='nofollow ugc noopener noreferrer'>More on Vantor HD.</a></div><div>&nbsp;</div><div><span style='font-size:large;'>Imagery Updates</span><br />You can use the <a target='_blank' href='https://livingatlas.arcgis.com/wayback/#mapCenter=10.41504%2C17.77096%2C2&amp;mode=updates' rel='nofollow ugc noopener noreferrer'>Updates Mode</a> in the World Imagery Wayback app to learn more about recent and pending updates. Accessing this information requires a user login with an ArcGIS organizational account.</div><div>&nbsp;</div><div><span style='font-size:large;'>Citations</span><br />This layer includes imagery provider, collection date, resolution,&nbsp;accuracy, and source of the imagery. With the Identify tool in ArcGIS Desktop or the ArcGIS Online Map Viewer&nbsp;you can see imagery citations. Citations returned apply only to the available imagery at that location and scale. You may need to zoom in to view the best available imagery. Citations can also be accessed in the&nbsp;<a target='_blank' href='https://www.arcgis.com/home/item.html?id=c03a526d94704bfb839445e80de95495' rel='nofollow ugc noopener noreferrer'>World Imagery with Metadata web map</a>.</div><div>&nbsp;</div><div><span style='font-size:large;'>Use</span><br />You can add this layer to the ArcGIS Online Map Viewer, ArcGIS Desktop, or ArcGIS Pro. To view this layer with a useful reference overlay, open the&nbsp;<a target='_blank' href='https://www.arcgis.com/home/item.html?id=28f49811a6974659988fd279de5ce39f' rel='nofollow ugc noopener noreferrer'>Imagery Hybrid</a>&nbsp;web map.</div><div>&nbsp;</div><div><span style='font-size:large;'>Feedback</span><br />Have you ever seen a problem in the Esri World Imagery Map that you wanted to report? &nbsp;You can use the&nbsp;<a target='_blank' href='https://www.arcgis.com/home/item.html?id=ebdfa4146680410bb952c7d532ea5407' rel='nofollow ugc noopener noreferrer'>Imagery Map Feedback web map</a>&nbsp;to provide comments on issues. The feedback will be reviewed by the ArcGIS Online team and considered for one of our updates.</div><div>&nbsp;</div><div style='background-color:rgb(255, 255, 255); border:0px solid currentcolor; box-sizing:border-box; color:rgb(74, 74, 74); font-family:&quot;Avenir Next&quot;, Avenir, &quot;Helvetica Neue&quot;, sans-serif; font-size:16px; font-style:normal; font-variant-caps:normal; font-variant-ligatures:normal; font-weight:400; letter-spacing:normal; line-height:1.5; text-align:start; text-decoration-color:initial; text-decoration-style:initial; text-indent:0px; text-transform:none; word-spacing:0px;'><span style='font-size:large;'>Need Imagery?</span></div><div style='background-color:rgb(255, 255, 255); border:0px solid currentcolor; box-sizing:border-box; color:rgb(74, 74, 74); font-family:&quot;Avenir Next&quot;, Avenir, &quot;Helvetica Neue&quot;, sans-serif; font-size:16px; font-style:normal; font-variant-caps:normal; font-variant-ligatures:normal; font-weight:400; letter-spacing:normal; line-height:1.5; text-align:start; text-decoration-color:initial; text-decoration-style:initial; text-indent:0px; text-transform:none; word-spacing:0px;'>If you need to access more recent or higher resolution imagery, you can quickly discover, order, and access imagery in the <a style='border:0px solid currentcolor; box-sizing:border-box; color:rgb(0, 97, 155); font-family:inherit; line-height:1.5; text-decoration:none;' target='_blank' href='https://www.esri.com/arcgis-blog/products/arcgis-online/imagery/access-commercial-imagery-in-arcgis' rel='nofollow ugc noopener noreferrer'>Content Store for ArcGIS</a>&nbsp;app.</div><div style='background-color:rgb(255, 255, 255); border:0px solid currentcolor; box-sizing:border-box; color:rgb(74, 74, 74); font-family:&quot;Avenir Next&quot;, Avenir, &quot;Helvetica Neue&quot;, sans-serif; font-size:16px; font-style:normal; font-variant-caps:normal; font-variant-ligatures:normal; font-weight:400; letter-spacing:normal; line-height:1.5; text-align:start; text-decoration-color:initial; text-decoration-style:initial; text-indent:0px; text-transform:none; word-spacing:0px;'><ol><li><a style='border:0px solid currentcolor; box-sizing:border-box; color:rgb(0, 97, 155); font-family:inherit; line-height:1.5; text-decoration:none;' target='_blank' href='https://www.esri.com/arcgis-blog/products/arcgis-online/imagery/access-commercial-imagery-in-arcgis' rel='nofollow ugc noopener noreferrer'>Learn More</a></li><li><a style='border:0px solid currentcolor; box-sizing:border-box; color:rgb(0, 97, 155); font-family:inherit; line-height:1.5; text-decoration:none;' target='_blank' href='https://www.esri.com/en-us/arcgis-marketplace/listing/products/8632a64a287a4232ba44930e2d213e6b' rel='nofollow ugc noopener noreferrer'>Get Access</a></li><li><a style='border:0px solid currentcolor; box-sizing:border-box; color:rgb(0, 97, 155); font-family:inherit; line-height:1.5; text-decoration:none;' target='_blank' href='https://contentstore.skywatch.com/' rel='nofollow ugc noopener noreferrer'>Open App</a></li></ol></div>",
			"keyword": [
				"world",
				"imagery",
				"basemap",
				"satellite",
				"aerial",
				"community",
				"community basemap",
				"orthophotos",
				"esri_basemap"
			],
			"issued": "2009-12-12T19:01:57.000Z",
			"modified": "2026-10-29T15:27:50.000Z",
			"publisher": {
				"name": "Esri"
			},
			"contactPoint": {
				"@type": "vcard:Contact",
				"fn": "esri",
				"hasEmail": "{{orgContactEmail}}"
			},
			"accessLevel": "public",
			"spatial": "-180.0000,-85.0511,180.0000,85.0511",
			"license": "<p><img src='https://downloads.esri.com/blogs/arcgisonline/esrilogo_new.png' /> This work is licensed under the Esri Master License Agreement.</p><div><a target='_blank' href='https://goto.arcgis.com/termsofuse/viewsummary' rel='nofollow ugc noopener noreferrer'><strong>View Summary</strong></a> | <a target='_blank' href='https://goto.arcgis.com/termsofuse/viewtermsofuse' rel='nofollow ugc noopener noreferrer'><strong>View Terms of Use</strong></a></div><div>&nbsp;</div><div><div><strong>Export:</strong> This layer is not intended to be used to export tiles for offline.&nbsp; If you would like to export imagery for offline use in ArcGIS applications, you may use the&nbsp;<a target='_blank' href='https://www.arcgis.com/home/item.html?id=226d23f076da478bba4589e7eae95952' rel='nofollow ugc noopener noreferrer'>World Imagery (for Export)</a>&nbsp;layer, which is intended for this purpose.</div><div>&nbsp;</div><div><strong>Data Collection and Editing:</strong> This layer may be used in various ArcGIS apps to support data collection and editing, with the results used internally or shared with others, as described for these&nbsp;<a target='_blank' href='https://www.arcgis.com/home/item.html?id=8e90a00a0a6845a49262e0b756f57a10' rel='nofollow ugc noopener noreferrer'>use cases</a>.</div></div>",
			"distribution": [
				{
					"@type": "dcat:Distribution",
					"title": "ArcGIS Hub Dataset",
					"format": "Web Page",
					"mediaType": "text/html",
					"accessURL": "https://www.pacificgeoportal.com/datasets/esri::30cm-resolution-metadata-114"
				},
				{
					"@type": "dcat:Distribution",
					"title": "ArcGIS GeoService",
					"format": "ArcGIS GeoServices REST API",
					"mediaType": "application/json",
					"accessURL": "https://services.arcgisonline.com/ArcGIS/rest/services/World_Imagery/MapServer/9"
				},
				{
					"@type": "dcat:Distribution",
					"title": "CSV",
					"format": "CSV",
					"mediaType": "text/csv",
					"accessURL": "https://www.pacificgeoportal.com/api/download/v1/items/10df2279f9684e4a9f6a7f08febac2a9/csv?layers=9"
				},
				{
					"@type": "dcat:Distribution",
					"title": "Shapefile",
					"format": "ZIP",
					"mediaType": "application/zip",
					"accessURL": "https://www.pacificgeoportal.com/api/download/v1/items/10df2279f9684e4a9f6a7f08febac2a9/shapefile?layers=9"
				},
				{
					"@type": "dcat:Distribution",
					"title": "GeoJSON",
					"format": "GeoJSON",
					"mediaType": "application/vnd.geo+json",
					"accessURL": "https://www.pacificgeoportal.com/api/download/v1/items/10df2279f9684e4a9f6a7f08febac2a9/geojson?layers=9"
				},
				{
					"@type": "dcat:Distribution",
					"title": "KML",
					"format": "KML",
					"mediaType": "application/vnd.google-earth.kml+xml",
					"accessURL": "https://www.pacificgeoportal.com/api/download/v1/items/10df2279f9684e4a9f6a7f08febac2a9/kml?layers=9"
				}
			],
			"theme": [
				"geospatial"
			]
		},
		{
			"@type": "dcat:Dataset",
			"identifier": "https://www.arcgis.com/home/item.html?id=2ce4fe7d77024e719f8a04d2155b3fd2",
			"landingPage": "https://www.pacificgeoportal.com/datasets/eaglegis::nz-elevation",
			"title": "NZ Elevation",
			"description": "<div><strong>Will be updated as new data becomes available</strong></div><div><br />&nbsp;</div><p><strong>Projection</strong><br />New Zealand Transverse Mercator 2000 (NZTM2000).</p><div>&nbsp;</div><div><strong>Vertical Datum</strong></div><div>New Zealand Vertical Datum 2016 (NZVD2016).</div><div><div>&nbsp;</div><div>The NZ Elevation layer is an elevation surface for use in 3D applications in the NZTM projection. By adding this layer to a Scene in ArcGIS Pro or in the Scene Viewer it will be define the base height in your application.</div><div>&nbsp;</div><div>See the metadata layer with information about the data&nbsp;<a target='_blank' href='https://www.arcgis.com/home/item.html?id=1db3f4f7fd3d4ca3ba61c38d7f58fbf7' rel='nofollow ugc noopener noreferrer'>here</a>.</div><div>&nbsp;</div><div>NZTM Basemaps can be used on top of this service, providing it shares the same tiling scheme. When combining it with the NZ Basemaps provided by Eagle Technolgy, make sure to use the raster basemaps with the updated tiling scheme or one of the vector basemaps. All the compatible basemaps can be found in this <a target='_blank' href='https://www.arcgis.com/home/group.html?id=c8d07daebe3942e69fbda649fee68a9f#overview' rel='nofollow ugc noopener noreferrer'>group</a>.</div><div>&nbsp;</div><div>When creating your own basemap or tiled layer make sure to use the tiling scheme provided <a target='_blank' href='https://eaglegis.maps.arcgis.com/home/item.html?id=75d8c2aec505409ead3c07f6e89f56fb' rel='nofollow ugc noopener noreferrer'>here</a>.</div><div>&nbsp;</div><div>The elevation service is made up of the available publicly-owned 1m and 2m dems. For areas where 1m/2m elevation data is not available the<a target='_blank' href='https://data.linz.govt.nz/layer/51768-nz-8m-digital-elevation-model-2012/' rel='nofollow ugc noopener noreferrer'> 8m dem</a> provided by LINZ is being used. Outside of the coverage of the 8m dem, a 0m dem is used for visual purposes.</div><div>&nbsp;</div><p>This service is offered by Eagle Technology (Official Esri Distributor). Eagle Technology offers layers and maps that can be used in the ArcGIS platform. The Content team at Eagle Technology updates the layers on a regular basis and regularly adds new content to the Living Atlas. By using this content and combining it with other data you can create new information products quickly and easily.<br /><br />If you have any questions or remarks about the content, please let us now at <a href='mailto:livingatlas@eagle.co.nz' target='_blank' rel='nofollow ugc noopener noreferrer'>livingatlas@eagle.co.nz</a></p></div>",
			"keyword": [
				"Aotearoa",
				"NZ",
				"Elevation",
				"Surface",
				"NZTM",
				"New Zealand",
				"3D",
				"Scene",
				"Ground",
				"terrain",
				"eaglegis",
				"basemap"
			],
			"issued": "2019-08-05T23:58:41.000Z",
			"modified": "2022-08-30T10:08:32.000Z",
			"publisher": {
				"name": "Eagle Technology Group Ltd"
			},
			"contactPoint": {
				"@type": "vcard:Contact",
				"fn": "eaglegis",
				"hasEmail": "mailto:ts@eaglegis.co.nz"
			},
			"accessLevel": "public",
			"spatial": "130.2002,-48.5073,-157.3628,-22.3063",
			"license": "https://creativecommons.org/licenses/by/4.0",
			"distribution": [
				{
					"@type": "dcat:Distribution",
					"title": "ArcGIS Hub Dataset",
					"format": "Web Page",
					"mediaType": "text/html",
					"accessURL": "https://www.pacificgeoportal.com/datasets/eaglegis::nz-elevation"
				},
				{
					"@type": "dcat:Distribution",
					"title": "ArcGIS GeoService",
					"format": "ArcGIS GeoServices REST API",
					"mediaType": "application/json",
					"accessURL": "https://services1.arcgisonline.co.nz/arcgis/rest/services/Elevation/New_Zealand_Elevation/ImageServer"
				}
			],
			"theme": [
				"geospatial"
			]
		},
		{
			"@type": "dcat:Dataset",
			"identifier": "https://www.arcgis.com/home/item.html?id=250b76590c9941a5b051437ca2e93c6d&sublayer=0",
			"landingPage": "https://www.pacificgeoportal.com/datasets/eaglegis::nz-early-childhood-services-directory",
			"title": "NZ Early Childhood Services Directory",
			"description": "<div><div style='font-family:&quot;Avenir Next W01&quot;, &quot;Avenir Next W00&quot;, &quot;Avenir Next&quot;, Avenir, &quot;Helvetica Neue&quot;, Helvetica, Arial, sans-serif !important; font-size:17px;'><div style='font-size:17px; font-family:&quot;Avenir Next W01&quot;, &quot;Avenir Next W00&quot;, &quot;Avenir Next&quot;, Avenir, &quot;Helvetica Neue&quot;, Helvetica, Arial, sans-serif !important;'><font size='3'>Topicality: Updated daily through </font><a href='https://doc.arcgis.com/en/data-pipelines/latest/get-started/about-data-pipelines.htm' target='_blank' rel='nofollow ugc noopener noreferrer'>ArcGIS Data Pipelines</a><font size='3'><br /></font></div><div><font size='3'><span style='font-size:medium;'>Projection: New Zealand Transverse Mercator (NZTM)</span></font></div><br /><font color='#2f4f4f' size='3'><span>This layer contains </span></font><font color='#2f4f4f' size='3'><span><span>early childhood education services </span>in New Zealand sourced from the Ministry of Education. This layer shows the location of </span></font><font color='#2f4f4f' size='3'><span><span>early childhood education services</span>, address information and key figures.</span></font></div><div style='font-family:&quot;Avenir Next W01&quot;, &quot;Avenir Next W00&quot;, &quot;Avenir Next&quot;, Avenir, &quot;Helvetica Neue&quot;, Helvetica, Arial, sans-serif !important; font-size:17px;'><font color='#2f4f4f' size='3'><span><br /></span></font></div><div style='font-family:&quot;Avenir Next W01&quot;, &quot;Avenir Next W00&quot;, &quot;Avenir Next&quot;, Avenir, &quot;Helvetica Neue&quot;, Helvetica, Arial, sans-serif !important; font-size:17px;'><font color='#2f4f4f' size='3'><span>The source data and metadata about the attributes can be found <a href='https://www.educationcounts.govt.nz/data-services/directories/api-new-zealand-schools' target='_blank' rel='nofollow ugc noopener noreferrer'>here</a>. </span></font><font color='#2f4f4f' size='3'><span><font color='#2f4f4f' size='3'><span>If you would like to update the details for a school please email <a href='mailto:information.officer@education.govt.nz?subject=Information%20enquiry.&amp;Body=%0D%0A%0D%0A%0D%0AYou%20have%20received%20the%20above%20enquiry%20from%20Education%20Counts%20regarding%20the%20below%20webpage.%0D%0A%0D%0ATitle:%20New Zealand Schools.%0D%0A%0D%0ALink%20on%20Education%20Counts:%20https://www.educationcounts.govt.nz/data-services/directories/list-of-nz-schools' target='_blank' rel='nofollow ugc noopener noreferrer'>education.officer@education.govt.nz</a>.</span></font></span></font></div><div style='font-family:&quot;Avenir Next W01&quot;, &quot;Avenir Next W00&quot;, &quot;Avenir Next&quot;, Avenir, &quot;Helvetica Neue&quot;, Helvetica, Arial, sans-serif !important; font-size:17px;'><font color='#2f4f4f' size='3'><br /></font></div><div style='font-family:&quot;Avenir Next W01&quot;, &quot;Avenir Next W00&quot;, &quot;Avenir Next&quot;, Avenir, &quot;Helvetica Neue&quot;, Helvetica, Arial, sans-serif !important; font-size:17px;'><div><font color='#000000' size='3' style='font-family:inherit;'>As of August 2024, the following fields have been deprecated by the source:</font></div><div><ul><li><font color='#000000' size='3' style='font-family:inherit;'>Area Unit</font></li></ul></div><div><font color='#000000' size='3' style='font-family:inherit;'>The following fields have been added by the source:</font></div></div><div><ul><li><font color='#000000' size='3' style='font-family:inherit;'>KME Peak Body</font></li><li><span style='font-family:inherit;'><font color='#000000' style='font-family:inherit;'><span style='font-family:&quot;Avenir Next W01&quot;, &quot;Avenir Next W00&quot;, &quot;Avenir Next&quot;, Avenir, &quot;Helvetica Neue&quot;, sans-serif; font-size:16px; text-wrap:nowrap;'>Takiwā</span><br /></font></span></li><li><span style='font-family:&quot;Avenir Next W01&quot;, &quot;Avenir Next W00&quot;, &quot;Avenir Next&quot;, Avenir, &quot;Helvetica Neue&quot;, sans-serif; font-size:16px; text-wrap:nowrap;'><font color='#000000' style='font-family:inherit;'>Statistical Area 2 Code</font></span></li><li><span style='font-family:&quot;Avenir Next W01&quot;, &quot;Avenir Next W00&quot;, &quot;Avenir Next&quot;, Avenir, &quot;Helvetica Neue&quot;, sans-serif; font-size:16px; text-wrap:nowrap;'><font color='#000000' style='font-family:inherit;'>Statistical Area 2 Description</font></span></li><li><font color='#000000' face='Avenir Next W01, Avenir Next W00, Avenir Next, Avenir, Helvetica Neue, sans-serif'><span style='font-size:16px; text-wrap:nowrap;'>Roll Date</span></font></li></ul></div><div style='font-family:&quot;Avenir Next W01&quot;, &quot;Avenir Next W00&quot;, &quot;Avenir Next&quot;, Avenir, &quot;Helvetica Neue&quot;, Helvetica, Arial, sans-serif !important; font-size:17px;'><font color='#2f4f4f' size='3'>This layer is offered by Eagle Technology (Official Esri Distributor). Eagle Technology offers services that can be used in the ArcGIS platform. The Content team at Eagle Technology updates the layers on a regular basis and regularly adds new content to the Living Atlas. By using this content and combining it with other data you can create new information products quickly and easily.</font></div><div style='font-family:&quot;Avenir Next W01&quot;, &quot;Avenir Next W00&quot;, &quot;Avenir Next&quot;, Avenir, &quot;Helvetica Neue&quot;, Helvetica, Arial, sans-serif !important; font-size:17px;'><font color='#2f4f4f' size='3'><br /></font></div><div style='font-family:&quot;Avenir Next W01&quot;, &quot;Avenir Next W00&quot;, &quot;Avenir Next&quot;, Avenir, &quot;Helvetica Neue&quot;, Helvetica, Arial, sans-serif !important; font-size:17px;'><font color='#2f4f4f' size='3'>If you have any questions or comments about the content, please let us now  at </font><font size='3'><a href='mailto:livingatlas@eagle.co.nz' style='color:rgb(0, 121, 193); text-decoration-line:none;' target='_blank' rel='nofollow ugc noopener noreferrer'>livingatlas@eagle.co.nz</a>.</font></div></div>",
			"keyword": [
				"Schools",
				"New Zealand",
				"NZ",
				"Kiwi",
				"Education",
				"student",
				"students",
				"teachers",
				"teacher",
				"early childhood services",
				"daycare",
				"kindergarten",
				"child care",
				"childcare",
				"day care",
				"eaglegis",
				"ece",
				"dr"
			],
			"issued": "2020-03-25T02:13:01.000Z",
			"modified": "2026-11-11T05:16:07.206Z",
			"publisher": {
				"name": "Eagle Technology Group Ltd"
			},
			"contactPoint": {
				"@type": "vcard:Contact",
				"fn": "eaglegis",
				"hasEmail": "mailto:ts@eaglegis.co.nz"
			},
			"accessLevel": "public",
			"spatial": "167.5758,-46.8741,-177.8900,-34.1793",
			"license": "<span style='font-family:&quot;Avenir Next W01&quot;, &quot;Avenir Next W00&quot;, &quot;Avenir Next&quot;, Avenir, &quot;Helvetica Neue&quot;, sans-serif; font-size:17px;'><font size='3'>By using this layer you conform to the Eagle Technology web services terms of use.</font></span><ul><li><font size='3'>Fair Use</font></li><li><font size='3'>Use in combination with ArcGIS software</font></li><li><font size='3'>The data is sourced from third parties. </font></li><li><font size='3'>Eagle Technology gives no warranties in relation to the web services.</font></li></ul><font size='3'><i>Contains data sourced from the <a href='https://www.educationcounts.govt.nz/directories' target='_blank' rel='nofollow ugc noopener noreferrer'>Minstry of Education</a>.</i><span style='color:rgb(0, 121, 193);'><span style='color:rgb(76, 76, 76);'><span style='font-style:italic;'></span></span><br /></span></font>",
			"distribution": [
				{
					"@type": "dcat:Distribution",
					"title": "ArcGIS Hub Dataset",
					"format": "Web Page",
					"mediaType": "text/html",
					"accessURL": "https://www.pacificgeoportal.com/datasets/eaglegis::nz-early-childhood-services-directory"
				},
				{
					"@type": "dcat:Distribution",
					"title": "ArcGIS GeoService",
					"format": "ArcGIS GeoServices REST API",
					"mediaType": "application/json",
					"accessURL": "https://services.arcgis.com/XTtANUDT8Va4DLwI/arcgis/rest/services/Early_Childhood_Directory_New_Zealand/FeatureServer/0"
				},
				{
					"@type": "dcat:Distribution",
					"title": "CSV",
					"format": "CSV",
					"mediaType": "text/csv",
					"accessURL": "https://www.pacificgeoportal.com/api/download/v1/items/250b76590c9941a5b051437ca2e93c6d/csv?layers=0"
				},
				{
					"@type": "dcat:Distribution",
					"title": "Shapefile",
					"format": "ZIP",
					"mediaType": "application/zip",
					"accessURL": "https://www.pacificgeoportal.com/api/download/v1/items/250b76590c9941a5b051437ca2e93c6d/shapefile?layers=0"
				},
				{
					"@type": "dcat:Distribution",
					"title": "GeoJSON",
					"format": "GeoJSON",
					"mediaType": "application/vnd.geo+json",
					"accessURL": "https://www.pacificgeoportal.com/api/download/v1/items/250b76590c9941a5b051437ca2e93c6d/geojson?layers=0"
				},
				{
					"@type": "dcat:Distribution",
					"title": "KML",
					"format": "KML",
					"mediaType": "application/vnd.google-earth.kml+xml",
					"accessURL": "https://www.pacificgeoportal.com/api/download/v1/items/250b76590c9941a5b051437ca2e93c6d/kml?layers=0"
				},
				{
					"@type": "dcat:Distribution",
					"title": "File Geodatabase",
					"format": "ZIP",
					"mediaType": "application/zip",
					"accessURL": "https://www.pacificgeoportal.com/api/download/v1/items/250b76590c9941a5b051437ca2e93c6d/filegdb?layers=0"
				},
				{
					"@type": "dcat:Distribution",
					"title": "Feature Collection",
					"format": "TXT",
					"mediaType": "text/plain",
					"accessURL": "https://www.pacificgeoportal.com/api/download/v1/items/250b76590c9941a5b051437ca2e93c6d/featureCollection?layers=0"
				},
				{
					"@type": "dcat:Distribution",
					"title": "Excel",
					"format": "XLSX",
					"mediaType": "application/vnd.ms-excel",
					"accessURL": "https://www.pacificgeoportal.com/api/download/v1/items/250b76590c9941a5b051437ca2e93c6d/excel?layers=0"
				},
				{
					"@type": "dcat:Distribution",
					"title": "GeoPackage",
					"format": "GPKG",
					"mediaType": "application/geopackage+sqlite3",
					"accessURL": "https://www.pacificgeoportal.com/api/download/v1/items/250b76590c9941a5b051437ca2e93c6d/geoPackage?layers=0"
				},
				{
					"@type": "dcat:Distribution",
					"title": "SQLite Geodatabase",
					"format": "GDB",
					"mediaType": "application/geopackage+sqlite3",
					"accessURL": "https://www.pacificgeoportal.com/api/download/v1/items/250b76590c9941a5b051437ca2e93c6d/sqlite?layers=0"
				}
			],
			"theme": [
				"geospatial"
			]
		},
		{
			"@type": "dcat:Dataset",
			"identifier": "https://www.arcgis.com/home/item.html?id=9f488a22f7894933b37fb0d8566c18e1&sublayer=0",
			"landingPage": "https://www.pacificgeoportal.com/datasets/eaglegis::new-zealand-land-cover-lcdb",
			"title": "New Zealand Land Cover (LCDB)",
			"description": "<p><span style='font-family:&quot;Avenir Next W01&quot;, &quot;Avenir Next W00&quot;, &quot;Avenir Next&quot;, Avenir, &quot;Helvetica Neue&quot;, sans-serif; font-size:16px;'>Projection: New Zealand Transverse Mercator (NZTM)</span></p><div style='font-family:&quot;Avenir Next W01&quot;, &quot;Avenir Next W00&quot;, &quot;Avenir Next&quot;, Avenir, &quot;Helvetica Neue&quot;, sans-serif; font-size:16px;'>&nbsp;</div><div style='font-family:&quot;Avenir Next W01&quot;, &quot;Avenir Next W00&quot;, &quot;Avenir Next&quot;, Avenir, &quot;Helvetica Neue&quot;, sans-serif; font-size:16px;'>This layer contains Land Cover classifications for Aotearoa/New Zealand sourced from Manaaki Whenua. This layer shows generalised locations of land cover and provides information on the type of land cover between 1996 and 2023.<br />&nbsp;</div><div style='font-family:&quot;Avenir Next W01&quot;, &quot;Avenir Next W00&quot;, &quot;Avenir Next&quot;, Avenir, &quot;Helvetica Neue&quot;, sans-serif; font-size:16px;'>&nbsp;</div><div style='font-family:&quot;Avenir Next W01&quot;, &quot;Avenir Next W00&quot;, &quot;Avenir Next&quot;, Avenir, &quot;Helvetica Neue&quot;, sans-serif; font-size:16px;'>This layer was created using the most recent version of the Land Cover Database (LCDB v6.0). The data in this layer has been diced to have a maximum of 50000 vertices while maintaining the original shape and then simplified using the Retain Critical Points method with a simplification tolerance of 15 metres.</div><div style='font-family:&quot;Avenir Next W01&quot;, &quot;Avenir Next W00&quot;, &quot;Avenir Next&quot;, Avenir, &quot;Helvetica Neue&quot;, sans-serif; font-size:16px;'>&nbsp;</div><div style='font-family:&quot;Avenir Next W01&quot;, &quot;Avenir Next W00&quot;, &quot;Avenir Next&quot;, Avenir, &quot;Helvetica Neue&quot;, sans-serif; font-size:16px;'>The source data and metadata about the attributes can be found&nbsp;<a target='_blank' href='https://lris.scinfo.org.nz/layer/123148-lcdb-v60-land-cover-database-version-60-mainland-new-zealand/' rel='nofollow ugc noopener noreferrer'>here</a> and&nbsp;<a target='_blank' href='https://lris.scinfo.org.nz/layer/123145-lcdb-v60-land-cover-database-version-60-chatham-islands/' rel='nofollow ugc noopener noreferrer'>here</a>.</div><div style='font-family:&quot;Avenir Next W01&quot;, &quot;Avenir Next W00&quot;, &quot;Avenir Next&quot;, Avenir, &quot;Helvetica Neue&quot;, sans-serif; font-size:16px;'>&nbsp;</div><div style='font-family:&quot;Avenir Next W01&quot;, &quot;Avenir Next W00&quot;, &quot;Avenir Next&quot;, Avenir, &quot;Helvetica Neue&quot;, sans-serif; font-size:16px;'><div style='font-family:&quot;Avenir Next W01&quot;, &quot;Avenir Next W00&quot;, &quot;Avenir Next&quot;, Avenir, &quot;Helvetica Neue&quot;, Helvetica, Arial, sans-serif; font-size:17px;'><span style='color:#2f4f4f; font-size:medium;'><font style='font-family:inherit;'>This layer is offered by Eagle Technology (Official Esri Distributor). Eagle Technology offers services that can be used in the ArcGIS platform. The Content team at Eagle Technology regularly adds new content to the Living Atlas. By using this content and combining it with other data you can create new information products quickly and easily.</font></span></div><div style='font-family:&quot;Avenir Next W01&quot;, &quot;Avenir Next W00&quot;, &quot;Avenir Next&quot;, Avenir, &quot;Helvetica Neue&quot;, Helvetica, Arial, sans-serif; font-size:17px;'><br />&nbsp;</div><div style='font-family:&quot;Avenir Next W01&quot;, &quot;Avenir Next W00&quot;, &quot;Avenir Next&quot;, Avenir, &quot;Helvetica Neue&quot;, Helvetica, Arial, sans-serif; font-size:17px;'><span style='color:#2f4f4f; font-size:medium;'><font style='font-family:inherit;'>If you have any questions or comments about the content, please let us now at&nbsp;</font></span><a style='color:rgb(0, 121, 193); font-family:inherit; text-decoration-line:none;' href='mailto:livingatlas@eagle.co.nz' target='_blank' rel='nofollow ugc noopener noreferrer'><span style='font-size:medium;'><font style='font-family:inherit;'>livingatlas@eagle.co.nz</font></span></a><span style='font-size:medium;'><font style='font-family:inherit;'>.</font></span></div></div>",
			"keyword": [
				"eaglegis",
				"Land Cover",
				"Manaaki Whenua",
				"NZ",
				"New Zealand",
				"Aotearoa",
				"Kiwi",
				"Map",
				"Maplayers",
				"Data",
				"Open Data",
				"land use",
				"landuse",
				"Landcare",
				"database",
				"landcover",
				"LCDB",
				"LCDB v6"
			],
			"issued": "2022-07-28T01:27:29.000Z",
			"modified": "2026-10-23T04:28:45.985Z",
			"publisher": {
				"name": "Eagle Technology Group Ltd"
			},
			"contactPoint": {
				"@type": "vcard:Contact",
				"fn": "eaglegis",
				"hasEmail": "mailto:ts@eaglegis.co.nz"
			},
			"accessLevel": "public",
			"spatial": "166.2620,-47.2231,-177.6146,-33.7734",
			"license": "https://creativecommons.org/licenses/by/4.0",
			"distribution": [
				{
					"@type": "dcat:Distribution",
					"title": "ArcGIS Hub Dataset",
					"format": "Web Page",
					"mediaType": "text/html",
					"accessURL": "https://www.pacificgeoportal.com/datasets/eaglegis::new-zealand-land-cover-lcdb"
				},
				{
					"@type": "dcat:Distribution",
					"title": "ArcGIS GeoService",
					"format": "ArcGIS GeoServices REST API",
					"mediaType": "application/json",
					"accessURL": "https://services.arcgis.com/XTtANUDT8Va4DLwI/arcgis/rest/services/New_Zealand_Land_Cover/FeatureServer/0"
				},
				{
					"@type": "dcat:Distribution",
					"title": "CSV",
					"format": "CSV",
					"mediaType": "text/csv",
					"accessURL": "https://www.pacificgeoportal.com/api/download/v1/items/9f488a22f7894933b37fb0d8566c18e1/csv?layers=0"
				},
				{
					"@type": "dcat:Distribution",
					"title": "Shapefile",
					"format": "ZIP",
					"mediaType": "application/zip",
					"accessURL": "https://www.pacificgeoportal.com/api/download/v1/items/9f488a22f7894933b37fb0d8566c18e1/shapefile?layers=0"
				},
				{
					"@type": "dcat:Distribution",
					"title": "GeoJSON",
					"format": "GeoJSON",
					"mediaType": "application/vnd.geo+json",
					"accessURL": "https://www.pacificgeoportal.com/api/download/v1/items/9f488a22f7894933b37fb0d8566c18e1/geojson?layers=0"
				},
				{
					"@type": "dcat:Distribution",
					"title": "KML",
					"format": "KML",
					"mediaType": "application/vnd.google-earth.kml+xml",
					"accessURL": "https://www.pacificgeoportal.com/api/download/v1/items/9f488a22f7894933b37fb0d8566c18e1/kml?layers=0"
				},
				{
					"@type": "dcat:Distribution",
					"title": "File Geodatabase",
					"format": "ZIP",
					"mediaType": "application/zip",
					"accessURL": "https://www.pacificgeoportal.com/api/download/v1/items/9f488a22f7894933b37fb0d8566c18e1/filegdb?layers=0"
				},
				{
					"@type": "dcat:Distribution",
					"title": "Feature Collection",
					"format": "TXT",
					"mediaType": "text/plain",
					"accessURL": "https://www.pacificgeoportal.com/api/download/v1/items/9f488a22f7894933b37fb0d8566c18e1/featureCollection?layers=0"
				},
				{
					"@type": "dcat:Distribution",
					"title": "Excel",
					"format": "XLSX",
					"mediaType": "application/vnd.ms-excel",
					"accessURL": "https://www.pacificgeoportal.com/api/download/v1/items/9f488a22f7894933b37fb0d8566c18e1/excel?layers=0"
				},
				{
					"@type": "dcat:Distribution",
					"title": "GeoPackage",
					"format": "GPKG",
					"mediaType": "application/geopackage+sqlite3",
					"accessURL": "https://www.pacificgeoportal.com/api/download/v1/items/9f488a22f7894933b37fb0d8566c18e1/geoPackage?layers=0"
				},
				{
					"@type": "dcat:Distribution",
					"title": "SQLite Geodatabase",
					"format": "GDB",
					"mediaType": "application/geopackage+sqlite3",
					"accessURL": "https://www.pacificgeoportal.com/api/download/v1/items/9f488a22f7894933b37fb0d8566c18e1/sqlite?layers=0"
				}
			],
			"theme": [
				"geospatial"
			]
		},
		{
			"@type": "dcat:Dataset",
			"identifier": "https://www.arcgis.com/home/item.html?id=7dc6cea0b1764a1f9af2e679f642f0f5",
			"landingPage": "https://www.pacificgeoportal.com/maps/esri::world-topographic-map-1",
			"title": "World Topographic Map",
			"description": "<p style='margin-top:0px; margin-bottom:1.55rem; padding:0px; line-height:1.5em;'>This <span style='line-height:26.35px;'>vector tile layer presents the </span><b>World Topographic Map</b> style (<span style='line-height:26.35px;'>World Edition) and </span>provides a basemap for the world, symbolized with a classic Esri topographic map style.  This layer includes highways, major roads, minor roads, railways, water features, cities, parks, landmarks, building footprints, and administrative boundaries, designed for use with <a href='https://www.arcgis.com/home/item.html?id=1b243539f4514b6ba35e7d995890db1d' target='_blank' rel='nofollow ugc noopener noreferrer'>World Hillshade</a> for added context. This vector tile layer provides unique capabilities for customization, high-resolution display, and use in mobile devices.</p><div>This vector tile layer is built using the same data sources used for other Esri Vector Basemaps. For details on data sources contributed by the GIS community, view the map of <a href='https://goto.arcgis.com/vectorbasemaps/community' target='_blank' rel='nofollow ugc noopener noreferrer'>Community Maps Basemap Contributors</a>. Esri Vector Basemaps are updated monthly.</div><div><br /></div><div>This layer is used in the <a href='https://www.arcgis.com/home/item.html?id=67372ff42cd145319639a99152b15bc3' style='line-height:1.38462;' target='_blank' rel='nofollow ugc noopener noreferrer'>Topographic</a> web map included in ArcGIS Living Atlas of the World.</div><div><div style='margin:0px; padding:0px;'><span style='line-height:1.38462;'><div style='margin:0px; padding:0px;'><br /></div><div style='margin:0px; padding:0px;'>See the <a href='https://www.arcgis.com/home/group.html?id=30de8da907d240a0bccd5ad3ff25ef4a' target='_blank' rel='nofollow ugc noopener noreferrer'>Vector Basemaps</a> group for other vector tile layers, including <a href='https://www.arcgis.com/home/item.html?id=18d32a699af64bfba4e78eba5a4dd705' target='_blank' rel='nofollow ugc noopener noreferrer'>Topographic (with Contours and Hillshade)</a> <b>multisource</b> tile layer.</div><div style='margin:0px; padding:0px;'><span style='font-family:&quot;Avenir Next W01&quot;, &quot;Avenir Next W00&quot;, &quot;Avenir Next&quot;, Avenir, &quot;Helvetica Neue&quot;, sans-serif; font-size:16px;'><br /></span></div><div style='margin:0px; padding:0px;'><div><font size='4'>Customize this Style</font></div><div><br /></div></div></span></div></div><p style='margin-top:0px; margin-bottom:1.55rem; padding:0px; line-height:1.5em;'>Learn more about customizing this vector basemap style using the <a href='https://vtse.arcgis.com/' target='_blank' rel='nofollow ugc noopener noreferrer'>Vector Tile Style Editor</a>. Additional details are available in <a href='https://www.esri.com/arcgis-blog/?s=#&amp;tag=basemaps' target='_blank' rel='nofollow ugc noopener noreferrer'>ArcGIS Online Blogs</a> and the <a href='https://www.arcgis.com/home/item.html?id=c908722b0841404ba6a87d6221f201e4' target='_blank' rel='nofollow ugc noopener noreferrer'>Esri Vector Basemaps Reference Document</a>.</p>",
			"keyword": [
				"basemap",
				"Esri Basemaps",
				"Topographic",
				"esriTopographic",
				"wma",
				"vector",
				"World"
			],
			"issued": "2017-10-26T17:05:43.000Z",
			"modified": "2026-10-23T02:12:18.000Z",
			"publisher": {
				"name": "Esri"
			},
			"contactPoint": {
				"@type": "vcard:Contact",
				"fn": "esri_vector",
				"hasEmail": "{{orgContactEmail}}"
			},
			"accessLevel": "public",
			"spatial": "-180.0000,-85.0000,180.0000,85.0000",
			"license": "<div><img src='https://downloads.esri.com/blogs/arcgisonline/esrilogo_new.png' /> This work is licensed under the Esri Master License Agreement.<br /><div><a href='https://goto.arcgis.com/termsofuse/viewsummary' target='_blank' rel='nofollow ugc noopener noreferrer'><b>View Summary</b></a> | <b><a href='https://goto.arcgis.com/termsofuse/viewtermsofuse' target='_blank' rel='nofollow ugc noopener noreferrer'>View Terms of Use</a></b></div><div><br /></div><div>Alignment of boundaries is a presentation of the feature provided by our data vendors and does not imply endorsement by Esri or any governing authority.<br /></div><div><br /></div><div>For details on data sources contributed by the GIS community, view the map of <a href='https://goto.arcgis.com/vectorbasemaps/community' target='_blank' rel='nofollow ugc noopener noreferrer'>Community Maps Basemap Contributors</a>.<br /></div><div><br /></div><div><span style='line-height:1.38462;'>Fonts available for use in the style resource directory are under the </span><a href='https://scripts.sil.org/cms/scripts/page.php?site_id=nrsi&amp;id=OFL_web' style='line-height:26.35px;' target='_blank' rel='nofollow ugc noopener noreferrer'>OFL, Open Font License.</a></div></div>",
			"distribution": [
				{
					"@type": "dcat:Distribution",
					"title": "ArcGIS Hub Dataset",
					"format": "Web Page",
					"mediaType": "text/html",
					"accessURL": "https://www.pacificgeoportal.com/maps/esri::world-topographic-map-1"
				},
				{
					"@type": "dcat:Distribution",
					"title": "ArcGIS GeoService",
					"format": "ArcGIS GeoServices REST API",
					"mediaType": "application/json",
					"accessURL": "https://basemaps.arcgis.com/arcgis/rest/services/World_Basemap_v2/VectorTileServer"
				}
			],
			"theme": [
				"geospatial"
			]
		},
		{
			"@type": "dcat:Dataset",
			"identifier": "https://www.arcgis.com/home/item.html?id=67372ff42cd145319639a99152b15bc3",
			"landingPage": "https://www.pacificgeoportal.com/maps/esri::topographic-1",
			"title": "Topographic",
			"description": "<div>The <b>Topographic </b>(World Edition) web map is presented with a classic Esri topographic map style including a shaded relief layer for added context.  This comprehensive topographic map includes landform labels, highways, major roads, minor roads, railways, water features, cities, parks, landmarks, building footprints, and administrative boundaries, designed for use with shaded relief for added context. </div><div style='max-width:100%; display:inherit;'><br /></div><div style='max-width:100%; display:inherit;'>This basemap, included in the ArcGIS Living Atlas of the World, uses the <a href='https://www.arcgis.com/home/item.html?id=7dc6cea0b1764a1f9af2e679f642f0f5' target='_blank' rel='nofollow ugc noopener noreferrer'>World Topographic Map</a> vector tile layer and <a href='https://www.arcgis.com/home/item.html?id=1b243539f4514b6ba35e7d995890db1d' target='_blank' rel='nofollow ugc noopener noreferrer'>World Hillshade</a>. For a topographic basemap that includes vector contours and vector hillshade, see the <a href='https://www.arcgis.com/home/item.html?id=7378ae8b471940cb9f9d114b67cd09b8' target='_blank' rel='nofollow ugc noopener noreferrer'>Topographic (Vector)</a> web map.</div><div style='max-width:100%; display:inherit;'><br /></div><div style='max-width:100%; display:inherit;'><div>The vector tile layer in this web map is built using the same data sources used for other Esri Vector Basemaps. For details on data sources contributed by the GIS community, view the map of <a href='https://goto.arcgis.com/vectorbasemaps/community' target='_blank' rel='nofollow ugc noopener noreferrer'>Community Maps Basemap Contributors</a>. Esri Vector Basemaps are updated monthly.<br /></div><div><br /></div><div><div><font size='4'>Use this Map</font></div><div><font size='3'><br /></font></div><div>This map is designed to be used as a basemap for overlaying other layers of information or as a stand-alone reference map.  You can add layers to this web map and save as your own map.  If you like, you can add this web map to a custom basemap gallery for others in your organization to use in creating web maps.  If you would like to add this map as a layer in other maps you are creating, you may use the tile layers referenced in this map.</div></div></div>",
			"keyword": [
				"basemap",
				"Esri Basemaps",
				"Topographic",
				"Hillshade",
				"esriTopographic",
				"esriHillshadeRaster",
				"wma",
				"vector",
				"World"
			],
			"issued": "2015-11-13T23:36:28.000Z",
			"modified": "2026-10-23T02:09:46.000Z",
			"publisher": {
				"name": "Esri"
			},
			"contactPoint": {
				"@type": "vcard:Contact",
				"fn": "esri_vector",
				"hasEmail": "{{orgContactEmail}}"
			},
			"accessLevel": "public",
			"spatial": "-158.6953,1.2855,71.9296,77.2084",
			"license": "<div><img src='https://downloads.esri.com/blogs/arcgisonline/esrilogo_new.png' /> This work is licensed under the Esri Master License Agreement.<br /><div><a href='https://goto.arcgis.com/termsofuse/viewsummary' target='_blank' rel='nofollow ugc noopener noreferrer'><b>View Summary</b></a> | <b><a href='https://goto.arcgis.com/termsofuse/viewtermsofuse' target='_blank' rel='nofollow ugc noopener noreferrer'>View Terms of Use</a></b></div><div><br /></div><div>Alignment of boundaries is a presentation of the feature provided by our data vendors and does not imply endorsement by Esri or any governing authority.<br /></div><div><br /></div><div>For details on data sources contributed by the GIS community, view the map of <a href='https://goto.arcgis.com/vectorbasemaps/community' target='_blank' rel='nofollow ugc noopener noreferrer'>Community Maps Basemap Contributors</a>.</div></div>",
			"distribution": [
				{
					"@type": "dcat:Distribution",
					"title": "ArcGIS Hub Dataset",
					"format": "Web Page",
					"mediaType": "text/html",
					"accessURL": "https://www.pacificgeoportal.com/maps/esri::topographic-1"
				}
			],
			"theme": [
				"geospatial"
			]
		},
		{
			"@type": "dcat:Dataset",
			"identifier": "https://www.arcgis.com/home/item.html?id=a52ab98763904006aa382d90e906fdd5",
			"landingPage": "https://www.pacificgeoportal.com/maps/esri::terrain-with-labels",
			"title": "Terrain with Labels",
			"description": "<div>The <b>Terrain with Labels</b> (World Edition) web map includes populated places, admin areas, boundary lines and roads overlaying an artistic multidirectional hillshade. The minimal features and styling is designed to draw attention to your thematic content. </div><div style='max-width:100%; display:inherit;'><div style='max-width:100%; display:inherit;'><br /></div><div style='max-width:100%; display:inherit;'>This basemap, included in the ArcGIS Living Atlas of the World, the <a href='https://www.arcgis.com/home/item.html?id=14fbc125ccc9488888b014db09f35f67' target='_blank' rel='nofollow ugc noopener noreferrer'>World Terrain Reference</a> and <a href='https://www.arcgis.com/home/item.html?id=33064a20de0c48d2bb61efa8faca93a8' target='_blank' rel='nofollow ugc noopener noreferrer'>World Terrain Base</a> vector tile layers and <a href='https://www.arcgis.com/home/item.html?id=1b243539f4514b6ba35e7d995890db1d' target='_blank' rel='nofollow ugc noopener noreferrer'>World Hillshade</a>.</div><div style='max-width:100%; display:inherit;'><br /></div><div style='max-width:100%; display:inherit;'><div>The vector tile layers in this web map are built using the same data sources used for other Esri Vector Basemaps. For details on data sources contributed by the GIS community, view the map of <a href='https://goto.arcgis.com/vectorbasemaps/community' target='_blank' rel='nofollow ugc noopener noreferrer'>Community Maps Basemap Contributors</a>. Esri Vector Basemaps are updated monthly.<br /></div><div><br /></div><div><div><font size='4'>Use this Map</font></div><div><font size='3'><br /></font></div><div>This map is designed to be used as a basemap for overlaying other layers of information or as a stand-alone reference map.  You can add layers to this web map and save as your own map.  If you like, you can add this web map to a custom basemap gallery for others in your organization to use in creating web maps.  If you would like to add this map as a layer in other maps you are creating, you may use the tile layers referenced in this map.</div></div></div></div>",
			"keyword": [
				"basemap",
				"Esri Basemaps",
				"Terrain",
				"Hillshade",
				"esriTerrainbase",
				"esriTerrainreference",
				"esriHillshadeRaster",
				"wma",
				"vector",
				"World"
			],
			"issued": "2016-06-09T23:17:25.000Z",
			"modified": "2026-10-23T02:09:37.000Z",
			"publisher": {
				"name": "Esri"
			},
			"contactPoint": {
				"@type": "vcard:Contact",
				"fn": "esri_vector",
				"hasEmail": "{{orgContactEmail}}"
			},
			"accessLevel": "public",
			"spatial": "-173.5663,-7.7106,86.0627,79.0719",
			"license": "<div><img src='https://downloads.esri.com/blogs/arcgisonline/esrilogo_new.png' /> This work is licensed under the Esri Master License Agreement.<br /><div><a href='https://goto.arcgis.com/termsofuse/viewsummary' target='_blank' rel='nofollow ugc noopener noreferrer'><b>View Summary</b></a> | <b><a href='https://goto.arcgis.com/termsofuse/viewtermsofuse' target='_blank' rel='nofollow ugc noopener noreferrer'>View Terms of Use</a></b></div><div><br /></div><div>Alignment of boundaries is a presentation of the feature provided by our data vendors and does not imply endorsement by Esri or any governing authority.<br /></div><div><br /></div><div>For details on data sources contributed by the GIS community, view the map of <a href='https://goto.arcgis.com/vectorbasemaps/community' target='_blank' rel='nofollow ugc noopener noreferrer'>Community Maps Basemap Contributors</a>.</div></div>",
			"distribution": [
				{
					"@type": "dcat:Distribution",
					"title": "ArcGIS Hub Dataset",
					"format": "Web Page",
					"mediaType": "text/html",
					"accessURL": "https://www.pacificgeoportal.com/maps/esri::terrain-with-labels"
				}
			],
			"theme": [
				"geospatial"
			]
		},
		{
			"@type": "dcat:Dataset",
			"identifier": "https://www.arcgis.com/home/item.html?id=7e2b9be8a9c94e45b7f87857d8d168d6",
			"landingPage": "https://www.pacificgeoportal.com/maps/esri::streets-night",
			"title": "Streets (Night)",
			"description": "<div>The <b>Streets (Night)</b> (World Edition) web map is presented with a custom street map style that is designed for use at night or in other low-light environments.  This comprehensive street map includes highways, major roads, minor roads, railways, water features, cities, parks, landmarks, building footprints, and administrative boundaries. </div><div><p style='margin-top:0px; margin-bottom:0.775rem; max-width:100%;'><br /></p><p style='margin-top:0px; margin-bottom:0.775rem; max-width:100%;'>This basemap, included in the ArcGIS Living Atlas of the World, uses the <a href='https://www.arcgis.com/home/item.html?id=86f556a2d1fd468181855a35e344567f' target='_blank' rel='nofollow ugc noopener noreferrer'>World Street Map (Night)</a> vector tile layer.</p><div><br /></div><div><div>The vector tile layer in this web map is built using the same data sources used for other Esri Vector Basemaps. For details on data sources contributed by the GIS community, view the map of <a href='https://goto.arcgis.com/vectorbasemaps/community' target='_blank' rel='nofollow ugc noopener noreferrer'>Community Maps Basemap Contributors</a>. Esri Vector Basemaps are updated monthly.<br /></div><div><br /></div><div><div><font size='4'>Use this Map</font></div><div><font size='3'><br /></font></div><div>This map is designed to be used as a basemap for overlaying other layers of information or as a stand-alone reference map.  You can add layers to this web map and save as your own map.  If you like, you can add this web map to a custom basemap gallery for others in your organization to use in creating web maps.  If you would like to add this map as a layer in other maps you are creating, you may use the tile layer referenced in this map.</div></div></div></div>",
			"keyword": [
				"basemap",
				"Esri Basemaps",
				"Streets Night",
				"esriStreetsnight",
				"wma",
				"vector",
				"World"
			],
			"issued": "2015-11-13T23:38:00.000Z",
			"modified": "2026-10-23T02:09:11.000Z",
			"publisher": {
				"name": "Esri"
			},
			"contactPoint": {
				"@type": "vcard:Contact",
				"fn": "esri_vector",
				"hasEmail": "{{orgContactEmail}}"
			},
			"accessLevel": "public",
			"spatial": "-173.7246,-7.9722,85.9043,79.0217",
			"license": "<div><img src='https://downloads.esri.com/blogs/arcgisonline/esrilogo_new.png' /> This work is licensed under the Esri Master License Agreement.<br /><div><a href='https://goto.arcgis.com/termsofuse/viewsummary' target='_blank' rel='nofollow ugc noopener noreferrer'><b>View Summary</b></a> | <b><a href='https://goto.arcgis.com/termsofuse/viewtermsofuse' target='_blank' rel='nofollow ugc noopener noreferrer'>View Terms of Use</a></b></div><div><br /></div><div>Alignment of boundaries is a presentation of the feature provided by our data vendors and does not imply endorsement by Esri or any governing authority.<br /></div><div><br /></div><div>For details on data sources contributed by the GIS community, view the map of <a href='https://goto.arcgis.com/vectorbasemaps/community' target='_blank' rel='nofollow ugc noopener noreferrer'>Community Maps Basemap Contributors</a>.</div></div>",
			"distribution": [
				{
					"@type": "dcat:Distribution",
					"title": "ArcGIS Hub Dataset",
					"format": "Web Page",
					"mediaType": "text/html",
					"accessURL": "https://www.pacificgeoportal.com/maps/esri::streets-night"
				}
			],
			"theme": [
				"geospatial"
			]
		},
		{
			"@type": "dcat:Dataset",
			"identifier": "https://www.arcgis.com/home/item.html?id=55ebf90799fa4a3fa57562700a68c405",
			"landingPage": "https://www.pacificgeoportal.com/maps/esri::streets-1",
			"title": "Streets",
			"description": "<div>The <b>Streets </b>(World Edition) web map is presented with a classic Esri street map style. The comprehensive street map includes highways, major roads, minor roads, railways, water features, cities, parks, landmarks, building footprints, and administrative boundaries.  </div><div><br /></div><div>This basemap, included in the ArcGIS Living Atlas of the World, uses the <a href='https://www.arcgis.com/home/item.html?id=de26a3cf4cc9451298ea173c4b324736' target='_blank' rel='nofollow ugc noopener noreferrer'>World Street Map</a> vector tile layer.</div><div><br /></div><div><div>The vector tile layer in this web map is built using the same data sources used for other Esri Vector Basemaps. For details on data sources contributed by the GIS community, view the map of <a href='https://goto.arcgis.com/vectorbasemaps/community' target='_blank' rel='nofollow ugc noopener noreferrer'>Community Maps Basemap Contributors</a>. Esri Vector Basemaps are updated monthly.<br /></div><div><br /></div><div><div><font size='4'>Use this Map</font></div><div><font size='3'><br /></font></div><div>This map is designed to be used as a basemap for overlaying other layers of information or as a stand-alone reference map.  You can add layers to this web map and save as your own map.  If you like, you can add this web map to a custom basemap gallery for others in your organization to use in creating web maps.  If you would like to add this map as a layer in other maps you are creating, you may use the tile layer referenced in this map.</div></div></div>",
			"keyword": [
				"basemap",
				"Esri Basemaps",
				"Streets",
				"esriStreets",
				"wma",
				"vector",
				"World"
			],
			"issued": "2015-11-13T23:37:15.000Z",
			"modified": "2026-10-23T02:08:48.000Z",
			"publisher": {
				"name": "Esri"
			},
			"contactPoint": {
				"@type": "vcard:Contact",
				"fn": "esri_vector",
				"hasEmail": "{{orgContactEmail}}"
			},
			"accessLevel": "public",
			"spatial": "-173.3731,-8.3201,86.2559,78.9546",
			"license": "<div><img src='https://downloads.esri.com/blogs/arcgisonline/esrilogo_new.png' /> This work is licensed under the Esri Master License Agreement.<br /><div><a href='https://goto.arcgis.com/termsofuse/viewsummary' target='_blank' rel='nofollow ugc noopener noreferrer'><b>View Summary</b></a> | <b><a href='https://goto.arcgis.com/termsofuse/viewtermsofuse' target='_blank' rel='nofollow ugc noopener noreferrer'>View Terms of Use</a></b></div><div><br /></div><div>Alignment of boundaries is a presentation of the feature provided by our data vendors and does not imply endorsement by Esri or any governing authority.<br /></div><div><br /></div><div>For details on data sources contributed by the GIS community, view the map of <a href='https://goto.arcgis.com/vectorbasemaps/community' target='_blank' rel='nofollow ugc noopener noreferrer'>Community Maps Basemap Contributors</a>.</div></div>",
			"distribution": [
				{
					"@type": "dcat:Distribution",
					"title": "ArcGIS Hub Dataset",
					"format": "Web Page",
					"mediaType": "text/html",
					"accessURL": "https://www.pacificgeoportal.com/maps/esri::streets-1"
				}
			],
			"theme": [
				"geospatial"
			]
		},
		{
			"@type": "dcat:Dataset",
			"identifier": "https://www.arcgis.com/home/item.html?id=75f4dfdff19e445395653121a95a85db",
			"landingPage": "https://www.pacificgeoportal.com/maps/esri::nova",
			"title": "Nova",
			"description": "This vector tile layer presents the <b>Nova</b> style (World Edition) and provides a detailed basemap for the world, featuring a dark background with glowing blue symbology. The Nova map uses color scheme, with a grid pattern across the ocean and stripes or square stippled patterns for land use features visible at larger scales. The colors are reminiscent of science-fiction shows, where one is looking at a map of the world on a 'head's up' device or a map that would be projected from a transparent glass wall. Additional graphics in the oceans presents a futuristic user interface. The futuristic and less terrestrial feel theme continues with the geometric patterns, starburst city dot symbols, and cool color scheme. The fonts displayed are clean and squarish (san serif) with a futuristic, science-fiction, or high technology appearance. This vector tile layer provides unique capabilities for customization, high-resolution display, and use in mobile devices.<div><br /></div><div>This vector tile layer is built using the same data sources used for other Esri Vector Basemaps. For details on data sources contributed by the GIS community, view the map of <a href='https://goto.arcgis.com/vectorbasemaps/community' target='_blank' rel='nofollow ugc noopener noreferrer'>Community Maps Basemap Contributors</a>. Esri Vector Basemaps are updated monthly.</div><div><br /></div><div>This layer is used in the <a href='https://www.arcgis.com/home/item.html?id=8d91bd39e873417ea21673e0fee87604' target='_blank' rel='nofollow ugc noopener noreferrer'>Nova Map</a> web map included in ArcGIS Living Atlas of the World.</div><div><div style='margin:0px; padding:0px;'><span style='line-height:1.38462;'><div style='margin:0px; padding:0px;'><br /></div><div style='margin:0px; padding:0px;'>See the <a href='https://www.arcgis.com/home/group.html?id=30de8da907d240a0bccd5ad3ff25ef4a' target='_blank' rel='nofollow ugc noopener noreferrer'>Vector Basemaps</a> group for other vector tile layers. </div><div style='margin:0px; padding:0px;'><span style='font-family:&quot;Avenir Next W01&quot;, &quot;Avenir Next W00&quot;, &quot;Avenir Next&quot;, Avenir, &quot;Helvetica Neue&quot;, sans-serif; font-size:16px;'><br /></span></div><div style='margin:0px; padding:0px;'><div><font size='4'>Customize this Style</font></div><div><br /></div><div>Learn more about customizing this vector basemap style using the <a href='https://vtse.arcgis.com/' target='_blank' rel='nofollow ugc noopener noreferrer'>Vector Tile Style Editor</a>. Additional details are available in <a href='https://www.esri.com/arcgis-blog/?s=#&amp;tag=basemaps' target='_blank' rel='nofollow ugc noopener noreferrer'>ArcGIS Online Blogs</a> and the <a href='https://www.arcgis.com/home/item.html?id=c908722b0841404ba6a87d6221f201e4' target='_blank' rel='nofollow ugc noopener noreferrer'>Esri Vector Basemaps Reference Document</a>.</div></div></span></div></div>",
			"keyword": [
				"basemap",
				"Esri Basemaps",
				"Nova",
				"esriNova",
				"wma",
				"vector",
				"World"
			],
			"issued": "2017-11-06T05:53:30.000Z",
			"modified": "2026-10-23T02:07:54.000Z",
			"publisher": {
				"name": "Esri"
			},
			"contactPoint": {
				"@type": "vcard:Contact",
				"fn": "esri_vector",
				"hasEmail": "{{orgContactEmail}}"
			},
			"accessLevel": "public",
			"spatial": "-180.0000,-85.0000,180.0000,85.0000",
			"license": "<div><img src='https://downloads.esri.com/blogs/arcgisonline/esrilogo_new.png' /> This work is licensed under the Esri Master License Agreement.<br /><div><a href='https://goto.arcgis.com/termsofuse/viewsummary' target='_blank' rel='nofollow ugc noopener noreferrer'><b>View Summary</b></a> | <b><a href='https://goto.arcgis.com/termsofuse/viewtermsofuse' target='_blank' rel='nofollow ugc noopener noreferrer'>View Terms of Use</a></b></div><div><br /></div><div>Alignment of boundaries is a presentation of the feature provided by our data vendors and does not imply endorsement by Esri or any governing authority.<br /></div><div><br /></div><div>For details on data sources contributed by the GIS community, view the map of <a href='https://goto.arcgis.com/vectorbasemaps/community' target='_blank' rel='nofollow ugc noopener noreferrer'>Community Maps Basemap Contributors</a>.<br /></div><div><br /></div><div><span style='line-height:1.38462;'>Fonts available for use in the style resource directory are under the </span><a href='https://scripts.sil.org/cms/scripts/page.php?site_id=nrsi&amp;id=OFL_web' style='line-height:26.35px;' target='_blank' rel='nofollow ugc noopener noreferrer'>OFL, Open Font License.</a></div></div>",
			"distribution": [
				{
					"@type": "dcat:Distribution",
					"title": "ArcGIS Hub Dataset",
					"format": "Web Page",
					"mediaType": "text/html",
					"accessURL": "https://www.pacificgeoportal.com/maps/esri::nova"
				},
				{
					"@type": "dcat:Distribution",
					"title": "ArcGIS GeoService",
					"format": "ArcGIS GeoServices REST API",
					"mediaType": "application/json",
					"accessURL": "https://basemaps.arcgis.com/arcgis/rest/services/World_Basemap_v2/VectorTileServer"
				}
			],
			"theme": [
				"geospatial"
			]
		},
		{
			"@type": "dcat:Dataset",
			"identifier": "https://www.arcgis.com/home/item.html?id=75a3ce8990674a5ebd5b9ab66bdab893",
			"landingPage": "https://www.pacificgeoportal.com/maps/esri::newspaper-map",
			"title": "Newspaper Map",
			"description": "<div style='overflow:auto; padding-bottom:0.375rem; max-width:100%; display:inherit;'>The <b>Newspaper Map </b>(World Edition) web map provides a customized world basemap symbolized with a unique &quot;newspaper&quot; style. It has a black &amp; white appearance with select features highlighted in red.  Many of the area fills have halftone patterns commonly found in traditional newspaper printing. The comprehensive map data includes highways, major roads, minor roads, railways, water features, cities, parks, landmarks, building footprints, and administrative boundaries. </div><div><br /></div><div>This basemap, included in the ArcGIS Living Atlas of the World, uses the <a href='https://www.arcgis.com/home/item.html?id=dfb04de5f3144a80bc3f9f336228d24a' target='_blank' rel='nofollow ugc noopener noreferrer'>Newspaper</a> vector tile layer.</div><div><br /></div><div><div>The vector tile layer in this web map is built using the same data sources used for other Esri Vector Basemaps. For details on data sources contributed by the GIS community, view the map of <a href='https://goto.arcgis.com/vectorbasemaps/community' target='_blank' rel='nofollow ugc noopener noreferrer'>Community Maps Basemap Contributors</a>. Esri Vector Basemaps are updated monthly.<br /></div><div><br /></div><div><div><font size='4'>Use this Map</font></div><div><font size='3'><br /></font></div><div>This map is designed to be used as a basemap for overlaying other layers of information or as a stand-alone reference map.  You can add layers to this web map and save as your own map.  If you like, you can add this web map to a custom basemap gallery for others in your organization to use in creating web maps.  If you would like to add this map as a layer in other maps you are creating, you may use the tile layer referenced in this map.<br /></div></div></div>",
			"keyword": [
				"basemap",
				"Esri Basemaps",
				"Newspaper",
				"esriNewspaper",
				"wma",
				"vector",
				"World"
			],
			"issued": "2016-06-27T15:40:20.000Z",
			"modified": "2026-10-23T02:07:48.000Z",
			"publisher": {
				"name": "Esri"
			},
			"contactPoint": {
				"@type": "vcard:Contact",
				"fn": "esri_vector",
				"hasEmail": "{{orgContactEmail}}"
			},
			"accessLevel": "public",
			"spatial": "-132.5708,-46.5126,127.0581,66.3292",
			"license": "<div><img src='https://downloads.esri.com/blogs/arcgisonline/esrilogo_new.png' /> This work is licensed under the Esri Master License Agreement.<br /><div><a href='https://goto.arcgis.com/termsofuse/viewsummary' target='_blank' rel='nofollow ugc noopener noreferrer'><b>View Summary</b></a> | <b><a href='https://goto.arcgis.com/termsofuse/viewtermsofuse' target='_blank' rel='nofollow ugc noopener noreferrer'>View Terms of Use</a></b></div><div><br /></div><div>Alignment of boundaries is a presentation of the feature provided by our data vendors and does not imply endorsement by Esri or any governing authority.<br /></div><div><br /></div><div>For details on data sources contributed by the GIS community, view the map of <a href='https://goto.arcgis.com/vectorbasemaps/community' target='_blank' rel='nofollow ugc noopener noreferrer'>Community Maps Basemap Contributors</a>.</div></div>",
			"distribution": [
				{
					"@type": "dcat:Distribution",
					"title": "ArcGIS Hub Dataset",
					"format": "Web Page",
					"mediaType": "text/html",
					"accessURL": "https://www.pacificgeoportal.com/maps/esri::newspaper-map"
				}
			],
			"theme": [
				"geospatial"
			]
		},
		{
			"@type": "dcat:Dataset",
			"identifier": "https://www.arcgis.com/home/item.html?id=dfb04de5f3144a80bc3f9f336228d24a",
			"landingPage": "https://www.pacificgeoportal.com/maps/esri::newspaper",
			"title": "Newspaper",
			"description": "<div>This vector tile layer presents the <b>Newspaper</b> style (World Edition) and provides a detailed basemap for the world, symbolized with a unique black &amp; white appearance with select features highlighted in red. Many of the area fills have halftone patterns commonly found in traditional newspaper printing. The comprehensive map data includes highways, major roads, minor roads, railways, water features, cities, parks, landmarks, building footprints, and administrative boundaries. This vector tile layer provides unique capabilities for customization, high-resolution display, and use in mobile devices.</div><div><br /></div><div>This vector tile layer is built using the same data sources used for other Esri Vector Basemaps. For details on data sources contributed by the GIS community, view the map of <a href='https://goto.arcgis.com/vectorbasemaps/community' target='_blank' rel='nofollow ugc noopener noreferrer'>Community Maps Basemap Contributors</a>. Esri Vector Basemaps are updated monthly.</div><div><br /></div><div>This layer is used in the <a href='https://www.arcgis.com/home/item.html?id=75a3ce8990674a5ebd5b9ab66bdab893' target='_blank' rel='nofollow ugc noopener noreferrer'>Newspaper Map</a> web map included in ArcGIS Living Atlas of the World.</div><div><div style='margin:0px; padding:0px;'><span style='line-height:1.38462;'><div style='margin:0px; padding:0px;'><br /></div><div style='margin:0px; padding:0px;'>See the <a href='https://www.arcgis.com/home/group.html?id=30de8da907d240a0bccd5ad3ff25ef4a' target='_blank' rel='nofollow ugc noopener noreferrer'>Vector Basemaps</a> group for other vector tile layers. </div><div style='margin:0px; padding:0px;'><span style='font-family:&quot;Avenir Next W01&quot;, &quot;Avenir Next W00&quot;, &quot;Avenir Next&quot;, Avenir, &quot;Helvetica Neue&quot;, sans-serif; font-size:16px;'><br /></span></div><div style='margin:0px; padding:0px;'><div><font size='4'>Customize this Style</font></div><div><br /></div><div>Learn more about customizing this vector basemap style using the <a href='https://vtse.arcgis.com/' target='_blank' rel='nofollow ugc noopener noreferrer'>Vector Tile Style Editor</a>. Additional details are available in <a href='https://www.esri.com/arcgis-blog/?s=#&amp;tag=basemaps' target='_blank' rel='nofollow ugc noopener noreferrer'>ArcGIS Online Blogs</a> and the <a href='https://www.arcgis.com/home/item.html?id=c908722b0841404ba6a87d6221f201e4' target='_blank' rel='nofollow ugc noopener noreferrer'>Esri Vector Basemaps Reference Document</a>.</div></div></span></div></div>",
			"keyword": [
				"basemap",
				"Esri Basemaps",
				"Newspaper",
				"esriNewspaper",
				"wma",
				"vector",
				"World"
			],
			"issued": "2017-11-07T15:18:34.000Z",
			"modified": "2026-10-23T02:07:38.000Z",
			"publisher": {
				"name": "Esri"
			},
			"contactPoint": {
				"@type": "vcard:Contact",
				"fn": "esri_vector",
				"hasEmail": "{{orgContactEmail}}"
			},
			"accessLevel": "public",
			"spatial": "-180.0000,-85.0000,180.0000,85.0000",
			"license": "<div><img src='https://downloads.esri.com/blogs/arcgisonline/esrilogo_new.png' /> This work is licensed under the Esri Master License Agreement.<br /><div><a href='https://goto.arcgis.com/termsofuse/viewsummary' target='_blank' rel='nofollow ugc noopener noreferrer'><b>View Summary</b></a> | <b><a href='https://goto.arcgis.com/termsofuse/viewtermsofuse' target='_blank' rel='nofollow ugc noopener noreferrer'>View Terms of Use</a></b></div><div><br /></div><div>Alignment of boundaries is a presentation of the feature provided by our data vendors and does not imply endorsement by Esri or any governing authority.<br /></div><div><br /></div><div>For details on data sources contributed by the GIS community, view the map of <a href='https://goto.arcgis.com/vectorbasemaps/community' target='_blank' rel='nofollow ugc noopener noreferrer'>Community Maps Basemap Contributors</a>.<br /></div><div><br /></div><div><span style='line-height:1.38462;'>Fonts available for use in the style resource directory are under the </span><a href='https://scripts.sil.org/cms/scripts/page.php?site_id=nrsi&amp;id=OFL_web' style='line-height:26.35px;' target='_blank' rel='nofollow ugc noopener noreferrer'>OFL, Open Font License.</a></div></div>",
			"distribution": [
				{
					"@type": "dcat:Distribution",
					"title": "ArcGIS Hub Dataset",
					"format": "Web Page",
					"mediaType": "text/html",
					"accessURL": "https://www.pacificgeoportal.com/maps/esri::newspaper"
				},
				{
					"@type": "dcat:Distribution",
					"title": "ArcGIS GeoService",
					"format": "ArcGIS GeoServices REST API",
					"mediaType": "application/json",
					"accessURL": "https://basemaps.arcgis.com/arcgis/rest/services/World_Basemap_v2/VectorTileServer"
				}
			],
			"theme": [
				"geospatial"
			]
		},
		{
			"@type": "dcat:Dataset",
			"identifier": "https://www.arcgis.com/home/item.html?id=c50de463235e4161b206d000587af18b",
			"landingPage": "https://www.pacificgeoportal.com/maps/esri::navigation",
			"title": "Navigation",
			"description": "<p style='margin-top:0px; margin-bottom:0.775rem; max-width:100%;'><span style='max-width:100%; display:inherit;'>The <b>Navigation</b> (World Edition) web map provides a detailed basemap for the world symbolized with a custom navigation map style that is designed for use during the day in mobile devices. This map includes highways, major roads, minor roads, railways, water features, cities, parks, landmarks, building footprints, and administrative boundaries.  </span></p><div><br /></div><div>This basemap, included in the ArcGIS Living Atlas of the World, uses the <a href='https://www.arcgis.com/home/item.html?id=63c47b7177f946b49902c24129b87252' target='_blank' rel='nofollow ugc noopener noreferrer'>World Navigation Map</a> vector tile layer.</div><div><div><br /></div><div>The vector tile layer in this web map is built using the same data sources used for other Esri Vector Basemaps. For details on data sources contributed by the GIS community, view the map of <a href='https://goto.arcgis.com/vectorbasemaps/community' target='_blank' rel='nofollow ugc noopener noreferrer'>Community Maps Basemap Contributors</a>. Esri Vector Basemaps are updated monthly.<br /></div><div><br /></div><div><div><font size='4'>Use this Map</font></div><div><font size='3'><br /></font></div><div>This map is designed to be used as a basemap for overlaying other layers of information or as a stand-alone reference map.  You can add layers to this web map and save as your own map.  If you like, you can add this web map to a custom basemap gallery for others in your organization to use in creating web maps.  If you would like to add this map as a layer in other maps you are creating, you may use the tile layer referenced in this map.</div></div></div>",
			"keyword": [
				"basemap",
				"Esri Basemaps",
				"Navigation",
				"esriNavigation",
				"wma",
				"vector",
				"World"
			],
			"issued": "2015-11-13T23:37:50.000Z",
			"modified": "2026-10-23T02:07:01.000Z",
			"publisher": {
				"name": "Esri"
			},
			"contactPoint": {
				"@type": "vcard:Contact",
				"fn": "esri_vector",
				"hasEmail": "{{orgContactEmail}}"
			},
			"accessLevel": "public",
			"spatial": "-173.5488,-7.6238,86.0801,79.0885",
			"license": "<div><img src='https://downloads.esri.com/blogs/arcgisonline/esrilogo_new.png' /> This work is licensed under the Esri Master License Agreement.<br /><div><a href='https://goto.arcgis.com/termsofuse/viewsummary' target='_blank' rel='nofollow ugc noopener noreferrer'><b>View Summary</b></a> | <b><a href='https://goto.arcgis.com/termsofuse/viewtermsofuse' target='_blank' rel='nofollow ugc noopener noreferrer'>View Terms of Use</a></b></div><div><br /></div><div>Alignment of boundaries is a presentation of the feature provided by our data vendors and does not imply endorsement by Esri or any governing authority.<br /></div><div><br /></div><div>For details on data sources contributed by the GIS community, view the map of <a href='https://goto.arcgis.com/vectorbasemaps/community' target='_blank' rel='nofollow ugc noopener noreferrer'>Community Maps Basemap Contributors</a>.</div></div>",
			"distribution": [
				{
					"@type": "dcat:Distribution",
					"title": "ArcGIS Hub Dataset",
					"format": "Web Page",
					"mediaType": "text/html",
					"accessURL": "https://www.pacificgeoportal.com/maps/esri::navigation"
				}
			],
			"theme": [
				"geospatial"
			]
		},
		{
			"@type": "dcat:Dataset",
			"identifier": "https://www.arcgis.com/home/item.html?id=effe3475f05a4d608e66fd6eeb2113c0",
			"landingPage": "https://www.pacificgeoportal.com/maps/esri::modern-antique",
			"title": "Modern Antique",
			"description": "<div>This vector tile layer presents the <b>Modern Antique</b> style (World Edition) and provides a detailed basemap for the world, symbolized with a unique antique styled map, with a modern flair -- including the benefit of multi-scale mapping. The comprehensive map data includes highways, major roads, minor roads, railways, water features, cities, parks, landmarks, building footprints, and administrative boundaries. This vector tile layer provides unique capabilities for customization, high-resolution display, and use in mobile devices.</div><div><br /></div><div>This vector tile layer is built using the same data sources used for other Esri Vector Basemaps. For details on data sources contributed by the GIS community, view the map of <a href='https://goto.arcgis.com/vectorbasemaps/community' target='_blank' rel='nofollow ugc noopener noreferrer'>Community Maps Basemap Contributors</a>. Esri Vector Basemaps are updated monthly.</div><div><br /></div><div>This layer is used in the <a href='https://www.arcgis.com/home/item.html?id=f35ef07c9ed24020aadd65c8a65d3754' target='_blank' rel='nofollow ugc noopener noreferrer'>Modern Antique Map</a> web map included in ArcGIS Living Atlas of the World.</div><div><div style='margin:0px; padding:0px;'><span style='line-height:1.38462;'><div style='margin:0px; padding:0px;'><br /></div><div style='margin:0px; padding:0px;'>See the <a href='https://www.arcgis.com/home/group.html?id=30de8da907d240a0bccd5ad3ff25ef4a' target='_blank' rel='nofollow ugc noopener noreferrer'>Vector Basemaps</a> group for other vector tile layers. </div><div style='margin:0px; padding:0px;'><span style='font-family:&quot;Avenir Next W01&quot;, &quot;Avenir Next W00&quot;, &quot;Avenir Next&quot;, Avenir, &quot;Helvetica Neue&quot;, sans-serif; font-size:16px;'><br /></span></div><div style='margin:0px; padding:0px;'><div><font size='4'>Customize this Style</font></div><div><br /></div><div>Learn more about customizing this vector basemap style using the <a href='https://vtse.arcgis.com/' target='_blank' rel='nofollow ugc noopener noreferrer'>Vector Tile Style Editor</a>. Additional details are available in <a href='https://www.esri.com/arcgis-blog/?s=#&amp;tag=basemaps' target='_blank' rel='nofollow ugc noopener noreferrer'>ArcGIS Online Blogs</a> and the <a href='https://www.arcgis.com/home/item.html?id=c908722b0841404ba6a87d6221f201e4' target='_blank' rel='nofollow ugc noopener noreferrer'>Esri Vector Basemaps Reference Document</a>.</div></div></span></div></div>",
			"keyword": [
				"basemap",
				"Esri Basemaps",
				"Modern Antique",
				"esriModernantique",
				"wma",
				"vector",
				"World"
			],
			"issued": "2017-11-06T05:53:18.000Z",
			"modified": "2026-10-23T02:06:19.000Z",
			"publisher": {
				"name": "Esri"
			},
			"contactPoint": {
				"@type": "vcard:Contact",
				"fn": "esri_vector",
				"hasEmail": "{{orgContactEmail}}"
			},
			"accessLevel": "public",
			"spatial": "-180.0000,-85.0000,180.0000,85.0000",
			"license": "<div><img src='https://downloads.esri.com/blogs/arcgisonline/esrilogo_new.png' /> This work is licensed under the Esri Master License Agreement.<br /><div><a href='https://goto.arcgis.com/termsofuse/viewsummary' target='_blank' rel='nofollow ugc noopener noreferrer'><b>View Summary</b></a> | <b><a href='https://goto.arcgis.com/termsofuse/viewtermsofuse' target='_blank' rel='nofollow ugc noopener noreferrer'>View Terms of Use</a></b></div><div><br /></div><div>Alignment of boundaries is a presentation of the feature provided by our data vendors and does not imply endorsement by Esri or any governing authority.<br /></div><div><br /></div><div>For details on data sources contributed by the GIS community, view the map of <a href='https://goto.arcgis.com/vectorbasemaps/community' target='_blank' rel='nofollow ugc noopener noreferrer'>Community Maps Basemap Contributors</a>.<br /></div><div><br /></div><div><span style='line-height:1.38462;'>Fonts available for use in the style resource directory are under the </span><a href='https://scripts.sil.org/cms/scripts/page.php?site_id=nrsi&amp;id=OFL_web' style='line-height:26.35px;' target='_blank' rel='nofollow ugc noopener noreferrer'>OFL, Open Font License.</a></div></div>",
			"distribution": [
				{
					"@type": "dcat:Distribution",
					"title": "ArcGIS Hub Dataset",
					"format": "Web Page",
					"mediaType": "text/html",
					"accessURL": "https://www.pacificgeoportal.com/maps/esri::modern-antique"
				},
				{
					"@type": "dcat:Distribution",
					"title": "ArcGIS GeoService",
					"format": "ArcGIS GeoServices REST API",
					"mediaType": "application/json",
					"accessURL": "https://basemaps.arcgis.com/arcgis/rest/services/World_Basemap_v2/VectorTileServer"
				}
			],
			"theme": [
				"geospatial"
			]
		},
		{
			"@type": "dcat:Dataset",
			"identifier": "https://www.arcgis.com/home/item.html?id=ff52218580f94d89851563f50cd1a2b2",
			"landingPage": "https://www.pacificgeoportal.com/maps/esri::imagery-hybrid-local-language",
			"title": "Imagery Hybrid (Local Language)",
			"description": "<div>The <b>Imagery Hybrid (Local Language)</b> (World Edition) web map provides a world reference map with highways, major roads, minor roads, railways, water features, cities, parks, landmarks, and administrative boundaries overlaid on one meter or better satellite and aerial imagery in many parts of the world and lower resolution satellite imagery worldwide. <span style='font-family:&quot;Avenir Next W01&quot;, &quot;Avenir Next W00&quot;, &quot;Avenir Next&quot;, Avenir, &quot;Helvetica Neue&quot;, sans-serif; font-size:16px;'>Labels are in local languages at large scale.</span></div><div><div><br /></div><div><div>This basemap, included in the ArcGIS Living Atlas of the World, uses the <a href='https://www.arcgis.com/home/item.html?id=2a2e806e6e654ea78ecb705149ceae9f' target='_blank' rel='nofollow ugc noopener noreferrer'>Hybrid Reference Layer (Local Language)</a> vector tile layer and <a href='https://goto.arcgisonline.com/maps/World_Imagery' target='_blank' rel='nofollow ugc noopener noreferrer'>World Imagery</a>. </div><div><br /></div><div>The vector tile layer in this web map is built using the same data sources used for other Esri Vector Basemaps. For details on data sources contributed by the GIS community, view the map of <a href='https://goto.arcgis.com/vectorbasemaps/community' target='_blank' rel='nofollow ugc noopener noreferrer'>Community Maps Basemap Contributors</a>. Esri Vector Basemaps and World Imagery are updated monthly.<br /><br /></div><div><font size='4'>Use this Map</font></div><div><font size='3'><br /></font></div><div>This map is designed to be used as a basemap for overlaying other layers of information or as a stand-alone reference map.  You can add layers to this web map and save as your own map.  If you like, you can add this web map to a custom basemap gallery for others in your organization to use in creating web maps.  If you would like to add this map as a layer in other maps you are creating, you may use the tile layer item referenced in this map.<br /></div></div></div>",
			"keyword": [
				"basemap",
				"Esri Basemaps",
				"Hybrid Reference",
				"Imagery",
				"esriHybridLocal",
				"esriImagery",
				"wma",
				"vector",
				"World"
			],
			"issued": "2018-04-25T13:28:36.000Z",
			"modified": "2026-10-23T02:05:08.000Z",
			"publisher": {
				"name": "Esri"
			},
			"contactPoint": {
				"@type": "vcard:Contact",
				"fn": "esri_vector",
				"hasEmail": "{{orgContactEmail}}"
			},
			"accessLevel": "public",
			"spatial": "23.3166,37.7555,24.2030,38.1772",
			"license": "<div><img src='https://downloads.esri.com/blogs/arcgisonline/esrilogo_new.png' /> This work is licensed under the Esri Master License Agreement.<br /><div><a href='https://goto.arcgis.com/termsofuse/viewsummary' target='_blank' rel='nofollow ugc noopener noreferrer'><b>View Summary</b></a> | <b><a href='https://goto.arcgis.com/termsofuse/viewtermsofuse' target='_blank' rel='nofollow ugc noopener noreferrer'>View Terms of Use</a></b></div><div><br /></div><div>Alignment of boundaries is a presentation of the feature provided by our data vendors and does not imply endorsement by Esri or any governing authority.<br /></div><div><br /></div><div>For details on data sources contributed by the GIS community, view the map of <a href='https://goto.arcgis.com/vectorbasemaps/community' target='_blank' rel='nofollow ugc noopener noreferrer'>Community Maps Basemap Contributors</a>.</div></div>",
			"distribution": [
				{
					"@type": "dcat:Distribution",
					"title": "ArcGIS Hub Dataset",
					"format": "Web Page",
					"mediaType": "text/html",
					"accessURL": "https://www.pacificgeoportal.com/maps/esri::imagery-hybrid-local-language"
				}
			],
			"theme": [
				"geospatial"
			]
		},
		{
			"@type": "dcat:Dataset",
			"identifier": "https://www.arcgis.com/home/item.html?id=86265e5a4bbb4187a59719cf134e0018",
			"landingPage": "https://www.pacificgeoportal.com/maps/esri::imagery-hybrid-1",
			"title": "Imagery Hybrid",
			"description": "<p style='padding:0px;'>This web map contains the new <a href='https://www.arcgis.com/home/item.html?id=af6063d6906c4eb589dfe03819610660' target='_blank'>Hybrid Reference Layer</a><font><span style='background-color:rgb(255, 255, 255);'> vector tile layer, which is designed to be used to overlay imagery.  </span></font>The vector tile layer is similar in content and style to the popular <a href='https://www.arcgis.com/home/item.html?id=716b600dbbac433faa4bec9220c76b3a' target='_blank'>Imagery with Labels</a> map, which is delivered as a map service with raster tiles, with additional labels for transportation features.<br /></p><p style='padding:0px;'>The 'Imagery with Labels' basemap contains the <a href='https://www.arcgis.com/home/item.html?id=10df2279f9684e4a9f6a7f08febac2a9' target='_self'>World Imagery map service</a> and the <a href='https://www.arcgis.com/home/item.html?id=a842e359856a4365b1ddf8cc34fde079' target='_self'>World Boundaries and Places map service</a>, so when you use that basemap you get boundaries and places, but you don't get highways and streets at small scales or street labels at large scale.</p><p style='padding:0px;'><font><span style='background-color:rgb(255, 255, 255);'>If you prefer a map that uses raster tiles for both boundary and transportation features, you can use the </span></font><a href='https://www.arcgis.com/home/item.html?id=d802f08316e84c6592ef681c50178f17' target='_blank'>Imagery with Labels and Transportation</a> map.</p>",
			"keyword": [
				"Imagery Hybrid. world",
				"imagery",
				"transportation",
				"hybrid",
				"satellite",
				"air photos",
				"world imagery",
				"satellite imagery",
				"air photographs",
				"air photography",
				"roads",
				"streets",
				"labels",
				"ILT",
				"baseimagery",
				"basemap",
				"current",
				"boundaries",
				"esriHybrid",
				"esriImagery",
				"Esri Basemaps",
				"Imagery",
				"Hybrid Reference"
			],
			"issued": "2013-03-29T00:28:37.000Z",
			"modified": "2026-10-23T02:05:00.000Z",
			"publisher": {
				"name": "Esri"
			},
			"contactPoint": {
				"@type": "vcard:Contact",
				"fn": "esri",
				"hasEmail": "{{orgContactEmail}}"
			},
			"accessLevel": "public",
			"spatial": "-127.2217,-44.7155,65.6104,68.8477",
			"license": "<p><img src='https://downloads.esri.com/blogs/arcgisonline/esrilogo_new.png' /> This work is licensed under the Esri Master License Agreement.</p><div><a target='_blank' href='https://goto.arcgis.com/termsofuse/viewsummary' rel='nofollow ugc noopener noreferrer'><strong>View Summary</strong></a> | <a target='_blank' href='https://goto.arcgis.com/termsofuse/viewtermsofuse' rel='nofollow ugc noopener noreferrer'><strong>View Terms of Use</strong></a></div>",
			"distribution": [
				{
					"@type": "dcat:Distribution",
					"title": "ArcGIS Hub Dataset",
					"format": "Web Page",
					"mediaType": "text/html",
					"accessURL": "https://www.pacificgeoportal.com/maps/esri::imagery-hybrid-1"
				}
			],
			"theme": [
				"geospatial"
			]
		},
		{
			"@type": "dcat:Dataset",
			"identifier": "https://www.arcgis.com/home/item.html?id=3582b744bba84668b52a16b0b6942544",
			"landingPage": "https://www.pacificgeoportal.com/maps/esri::human-geography-map",
			"title": "Human Geography Map",
			"description": "<div>The <b>Human Geography Map</b> (World Edition) web map provides a detailed vector basemap with a monochromatic style and content adjusted to support Human Geography information. Where possible, the map content has been adjusted so that it observes WCAG contrast criteria.</div><div><br /></div><div>This basemap, included in the ArcGIS Living Atlas of the World, uses 3 vector tile layers:</div><div><ul><li><a href='https://www.arcgis.com/home/item.html?id=ba52238d338745b1a355407ec9df6768' target='_blank' rel='nofollow ugc noopener noreferrer'>Human Geography Label</a>, a label reference layer including cities and communities, countries, administrative units, and at larger scales street names.</li><li><a href='https://www.arcgis.com/home/item.html?id=97fa1365da1e43eabb90d0364326bc2d' target='_blank' rel='nofollow ugc noopener noreferrer'>Human Geography Detail</a>, a detail reference layer including administrative boundaries, roads and highways, and larger bodies of water. This layer is designed to be used with a high degree of transparency so that the detail does not compete with your information. It is set at approximately 50% in this web map, but can be adjusted.</li><li><a href='https://www.arcgis.com/home/item.html?id=2afe5b807fa74006be6363fd243ffb30' target='_blank' rel='nofollow ugc noopener noreferrer'>Human Geography Base</a>, a simple basemap consisting of land areas in a very light gray only.</li></ul><div><div><span style='font-family:&quot;Avenir Next W01&quot;, &quot;Avenir Next W00&quot;, &quot;Avenir Next&quot;, Avenir, &quot;Helvetica Neue&quot;, sans-serif;'>The vector tile layers in this web map are</span> built using the same data sources used for other Esri Vector Basemaps. For details on data sources contributed by the GIS community, view the map of <a href='https://goto.arcgis.com/vectorbasemaps/community' target='_blank' rel='nofollow ugc noopener noreferrer'>Community Maps Basemap Contributors</a>. Esri Vector Basemaps are updated monthly.</div><div><br /></div><div>Learn more about this basemap from the cartographic designer in <a href='https://blogs.esri.com/esri/arcgis/2017/02/08/introducing-a-human-geography-basemap/' target='_blank' rel='nofollow ugc noopener noreferrer'>Introducing a Human Geography Basemap</a>.</div><div><br /></div><div><font size='4'>Use this Map</font></div><div><font size='3'><br /></font></div><div>This map is designed to be used as a basemap for overlaying other layers of information or as a stand-alone reference map.  You can add layers to this web map and save as your own map.  If you like, you can add this web map to a custom basemap gallery for others in your organization to use in creating web maps.  If you would like to add this map as a layer in other maps you are creating, you may use the tile layer item referenced in this map.</div></div></div>",
			"keyword": [
				"basemap",
				"Esri Basemaps",
				"Human Geography",
				"esriHumangeographybase",
				"esriHumangeographydetail",
				"esriHumangeographylabel",
				"wma",
				"vector",
				"World"
			],
			"issued": "2017-02-02T08:58:45.000Z",
			"modified": "2026-10-23T02:04:27.000Z",
			"publisher": {
				"name": "Esri"
			},
			"contactPoint": {
				"@type": "vcard:Contact",
				"fn": "esri_vector",
				"hasEmail": "{{orgContactEmail}}"
			},
			"accessLevel": "public",
			"spatial": "-155.1660,-45.5959,104.4629,66.8540",
			"license": "<img src='https://downloads.esri.com/blogs/arcgisonline/esrilogo_new.png' /> This work is licensed under the Esri Master License Agreement.<br /><div><a href='https://goto.arcgis.com/termsofuse/viewsummary' target='_blank' rel='nofollow ugc noopener noreferrer'><b>View Summary</b></a> | <b><a href='https://goto.arcgis.com/termsofuse/viewtermsofuse' target='_blank' rel='nofollow ugc noopener noreferrer'>View Terms of Use</a></b></div><div><br /></div><div>Alignment of boundaries is a presentation of the feature provided by our data vendors and does not imply endorsement by Esri or any governing authority.<br /></div><div><br /></div><div>For details on data sources contributed by the GIS community, view the map of <a href='https://goto.arcgis.com/vectorbasemaps/community' target='_blank' rel='nofollow ugc noopener noreferrer'>Community Maps Basemap Contributors</a>.</div>",
			"distribution": [
				{
					"@type": "dcat:Distribution",
					"title": "ArcGIS Hub Dataset",
					"format": "Web Page",
					"mediaType": "text/html",
					"accessURL": "https://www.pacificgeoportal.com/maps/esri::human-geography-map"
				}
			],
			"theme": [
				"geospatial"
			]
		},
		{
			"@type": "dcat:Dataset",
			"identifier": "https://www.arcgis.com/home/item.html?id=4f2e99ba65e34bb8af49733d9778fb8e",
			"landingPage": "https://www.pacificgeoportal.com/maps/esri::human-geography-dark-map",
			"title": "Human Geography Dark Map",
			"description": "<div style='overflow:auto; padding-bottom:0.375rem; max-width:100%; display:inherit;'>The <b>Human Geography Dark Map</b> (World Edition) web map provides a detailed world basemap with a dark monochromatic style and content adjusted to support human geography information.  Where possible, the map content has been adjusted so that it observes WCAG contrast criteria.</div><div style='overflow:auto; padding-bottom:0.375rem; max-width:100%; display:inherit;'><br /></div><div><div>This basemap, included in the ArcGIS Living Atlas of the World, uses 3 vector tile layers:</div><div><ul><li><a href='https://www.arcgis.com/home/item.html?id=4a3922d6d15f405d8c2b7a448a7fbad2' target='_blank' rel='nofollow ugc noopener noreferrer'>Human Geography Dark Label</a>, a label reference layer including cities and communities, countries, administrative units, and at larger scales street names.</li><li><a href='https://www.arcgis.com/home/item.html?id=1ddbb25aa29c4811aaadd94de469856a' target='_blank' rel='nofollow ugc noopener noreferrer'>Human Geography Dark Detail</a>, a detail reference layer including administrative boundaries, roads and highways, and larger bodies of water. This layer is designed to be used with a high degree of transparency so that the detail does not compete with your information. It is set at approximately 50% in this web map, but can be adjusted.</li><li><a href='https://www.arcgis.com/home/item.html?id=d7397603e9274052808839b70812be50' target='_blank' rel='nofollow ugc noopener noreferrer'>Human Geography Dark Base</a>, a simple basemap consisting of land areas in a very dark gray only.</li></ul><div><div>The vector tile layers in this web map are built using the same data sources used for other Esri Vector Basemaps. For details on data sources contributed by the GIS community, view the map of <a href='https://goto.arcgis.com/vectorbasemaps/community' target='_blank' rel='nofollow ugc noopener noreferrer'>Community Maps Basemap Contributors</a>. Esri Vector Basemaps are updated monthly.</div><div style='font-family:inherit;'><br /></div><div style='font-family:inherit;'>Learn more about this basemap from the cartographic designer in <a href='https://blogs.esri.com/esri/arcgis/2017/05/04/a-dark-version-of-the-human-geography-basemap/' target='_blank' rel='nofollow ugc noopener noreferrer'>A Dark Version of the Human Geography Basemap</a>.</div><div style='font-family:inherit;'><br /></div><div style='font-family:inherit;'><font size='4'>Use this Map</font></div><div style='font-family:inherit;'><font size='3'><br /></font></div><div style='font-family:inherit;'>This map is designed to be used as a basemap for overlaying other layers of information or as a stand-alone reference map.  You can add layers to this web map and save as your own map.  If you like, you can add this web map to a custom basemap gallery for others in your organization to use in creating web maps.  If you would like to add this map as a layer in other maps you are creating, you may use the tile layers referenced in this map.<br /></div></div></div></div>",
			"keyword": [
				"basemap",
				"Esri Basemaps",
				"Human Geography Dark",
				"esriHumangeographydarkbase",
				"esriHumangeographydarkdetail",
				"esriHumangeographydarklabel",
				"wma",
				"vector",
				"World"
			],
			"issued": "2017-05-04T13:09:41.000Z",
			"modified": "2026-10-23T02:03:56.000Z",
			"publisher": {
				"name": "Esri"
			},
			"contactPoint": {
				"@type": "vcard:Contact",
				"fn": "esri_vector",
				"hasEmail": "{{orgContactEmail}}"
			},
			"accessLevel": "public",
			"spatial": "-155.1660,-45.5959,104.4629,66.8540",
			"license": "<img src='https://downloads.esri.com/blogs/arcgisonline/esrilogo_new.png' /> This work is licensed under the Esri Master License Agreement.<br /><div><a href='https://goto.arcgis.com/termsofuse/viewsummary' target='_blank' rel='nofollow ugc noopener noreferrer'><b>View Summary</b></a> | <b><a href='https://goto.arcgis.com/termsofuse/viewtermsofuse' target='_blank' rel='nofollow ugc noopener noreferrer'>View Terms of Use</a></b></div><div><br /></div><div>Alignment of boundaries is a presentation of the feature provided by our data vendors and does not imply endorsement by Esri or any governing authority.<br /></div><div><br /></div><div>For details on data sources contributed by the GIS community, view the map of <a href='https://goto.arcgis.com/vectorbasemaps/community' target='_blank' rel='nofollow ugc noopener noreferrer'>Community Maps Basemap Contributors</a>.</div>",
			"distribution": [
				{
					"@type": "dcat:Distribution",
					"title": "ArcGIS Hub Dataset",
					"format": "Web Page",
					"mediaType": "text/html",
					"accessURL": "https://www.pacificgeoportal.com/maps/esri::human-geography-dark-map"
				}
			],
			"theme": [
				"geospatial"
			]
		},
		{
			"@type": "dcat:Dataset",
			"identifier": "https://www.arcgis.com/home/item.html?id=d3f68ffad1b843beaea51aadf621f82a&sublayer=0",
			"landingPage": "https://www.pacificgeoportal.com/datasets/publicsafetyqld::qfes-current-incidents-public-view",
			"title": "QFES Current Incidents Public View",
			"description": "<div>This information is extracted from the Queensland Emergency Services Computer Aided Dispatch (ESCAD) QFES database. It is not 'real time' information, but is provided as a general indication of current activity. The symbols represent the general area of the incident.<br /></div><div><br /></div><div>Incidents are limited to incident types approved for public sharing.</div><div><div><br /></div><div>This service is updating every 5 - 10 minutes.  The <i>Timestamp</i> field displays the last time the service was updated.</div><div><br /></div><div>Although every care is taken to ensure that all information on this web site is accurate and up to date, QFES cannot accept any responsibility for mistakes or omissions.<br /></div><div><br /></div><div>Refer to QFES website more information <a href='https://www.qfes.qld.gov.au' rel='nofollow ugc' target='_blank'>https://www.qfes.qld.gov.au</a></div><div><br /></div><div>Further data schema information:</div><div><br /></div><div>Response Date: date and time of entry into the dispatch.</div><div>Last Update: date and time of the last update in the dispatch.</div><div>Vehicles Assigned: vehicles assigned but not on Route or on Scene.</div><div>Vehicles on Route: vehicles that have on way to scene.</div><div>Vehicles on Scene: vehicles who have arrived on scene.</div><div>Locality: Queensland locality of incident</div><div>Location: Rough description of the location of the incident.</div><div>Master Incident Number: unique identifier of incident.</div><div>Current Status: whether the incident is Going (active), Controlled (no new resources required) or Patrolled (left unattended).</div><div>Jurisdiction: QFES region incident is in.</div><div>FME Timestamp: last update to the hosted data.</div><div><br /></div><div><br /></div></div>",
			"keyword": [
				"QFES",
				"ESCAD",
				"incident",
				"fire",
				"rescue"
			],
			"issued": "2021-03-22T22:32:57.000Z",
			"modified": "2026-11-11T09:44:06.614Z",
			"publisher": {
				"name": "Public Safety Business Agency"
			},
			"contactPoint": {
				"@type": "vcard:Contact",
				"fn": "PublicSafetyQld_Data",
				"hasEmail": "mailto:giskedron@fire.qld.gov.au"
			},
			"accessLevel": "public",
			"spatial": "180.0000,-90.0000,153.5510,-9.3779",
			"license": "<div>QFES current incidents information has been published in good faith and reasonable effort has been made to ensure its accuracy. The Queensland Fire and Emergency Service accepts no responsibility for any loss or damage incurred as a result of inaccuracies in the information.</div><div><br /></div><div><a href='https://www.qfes.qld.gov.au/copyright' rel='nofollow ugc' target='_blank'>https://www.qfes.qld.gov.au/copyright</a><br /></div>",
			"distribution": [
				{
					"@type": "dcat:Distribution",
					"title": "ArcGIS Hub Dataset",
					"format": "Web Page",
					"mediaType": "text/html",
					"accessURL": "https://www.pacificgeoportal.com/datasets/publicsafetyqld::qfes-current-incidents-public-view"
				},
				{
					"@type": "dcat:Distribution",
					"title": "ArcGIS GeoService",
					"format": "ArcGIS GeoServices REST API",
					"mediaType": "application/json",
					"accessURL": "https://services1.arcgis.com/vkTwD8kHw2woKBqV/arcgis/rest/services/ESCAD_Current_Incidents_Public/FeatureServer/0"
				},
				{
					"@type": "dcat:Distribution",
					"title": "CSV",
					"format": "CSV",
					"mediaType": "text/csv",
					"accessURL": "https://www.pacificgeoportal.com/api/download/v1/items/d3f68ffad1b843beaea51aadf621f82a/csv?layers=0"
				},
				{
					"@type": "dcat:Distribution",
					"title": "Shapefile",
					"format": "ZIP",
					"mediaType": "application/zip",
					"accessURL": "https://www.pacificgeoportal.com/api/download/v1/items/d3f68ffad1b843beaea51aadf621f82a/shapefile?layers=0"
				},
				{
					"@type": "dcat:Distribution",
					"title": "GeoJSON",
					"format": "GeoJSON",
					"mediaType": "application/vnd.geo+json",
					"accessURL": "https://www.pacificgeoportal.com/api/download/v1/items/d3f68ffad1b843beaea51aadf621f82a/geojson?layers=0"
				},
				{
					"@type": "dcat:Distribution",
					"title": "KML",
					"format": "KML",
					"mediaType": "application/vnd.google-earth.kml+xml",
					"accessURL": "https://www.pacificgeoportal.com/api/download/v1/items/d3f68ffad1b843beaea51aadf621f82a/kml?layers=0"
				}
			],
			"theme": [
				"geospatial"
			]
		},
		{
			"@type": "dcat:Dataset",
			"identifier": "https://www.arcgis.com/home/item.html?id=7da8fbcdd23541c4ab0464a685e2b3de&sublayer=0",
			"landingPage": "https://www.pacificgeoportal.com/datasets/publicsafetyqld::qfes-ocs-warnings-areas-public-view",
			"title": "QFES OCS Warnings Areas Public View",
			"description": "Manually entered warnings updated on demand.<div><br /></div><div>Authoritative source of bushfire warnings from the QFES OCS system.</div><div><br /></div><div>Although every care is taken to ensure that all information on this web site is accurate and up to date, QFES cannot accept any responsibility for mistakes or omissions.<br /></div><div><br /></div><div>Stay informed by following QFES on Facebook and Twitter, listening to your local radio station, and checking this service regularly. <br /></div><div><br /></div><div><span style='font-family:&quot;Avenir Next W01&quot;, &quot;Avenir Next W00&quot;, &quot;Avenir Next&quot;, Avenir, &quot;Helvetica Neue&quot;, sans-serif; font-size:16px;'>The official map for bushfire current incidents is available at </span><a href='https://www.qfes.qld.gov.au/Current-Incidents' rel='nofollow ugc' target='_blank'>https://www.qfes.qld.gov.au/Current-Incidents</a><br /></div><div><span style='color:black; font-size:12pt;'><br /></span></div><div><span style='color:black; font-size:12pt;'>Further Information:</span></div><div><p>-\n<a href='https://www.qfes.qld.gov.au/Current-Incidents' rel='nofollow ugc' target='_blank'>Click\nhere for current QFES incidents and warnings</a></p><p>- <a href='https://www.qfes.qld.gov.au/prepare/bushfire/prepare-for-bushfire-season' rel='nofollow ugc' target='_blank'>Click\nhere for bushfire preparation tips</a></p><p>- <a href='https://apps.des.qld.gov.au/air-quality/#health_levels_info' rel='nofollow ugc' target='_blank'>Click\nhere for smoke information</a></p><p>-\nFollow QFES on <a href='https://www.facebook.com/QldFireandEmergencyServices' rel='nofollow ugc' target='_blank'>Facebook</a> and <a href='https://twitter.com/qldfes' rel='nofollow ugc' target='_blank'>Twitter</a></p><p>\n\n\n\n</p><p>- <a href='https://qldtraffic.qld.gov.au/' rel='nofollow ugc' target='_blank'>Click\nhere for road closure information</a> or call 13 19 40</p></div><div><br /></div>",
			"keyword": [
				"Warnings",
				"QFES",
				"Bushfire",
				"Alerts"
			],
			"issued": "2021-04-21T00:13:53.000Z",
			"modified": "2026-11-11T14:54:49.941Z",
			"publisher": {
				"name": "Public Safety Business Agency"
			},
			"contactPoint": {
				"@type": "vcard:Contact",
				"fn": "qfes_FIMS",
				"hasEmail": "mailto:giskedron@fire.qld.gov.au"
			},
			"accessLevel": "public",
			"spatial": "139.3886,-28.9706,153.4644,-10.8196",
			"license": "<span style='font-family:&quot;Avenir Next W01&quot;, &quot;Avenir Next W00&quot;, &quot;Avenir Next&quot;, Avenir, &quot;Helvetica Neue&quot;, sans-serif; font-size:16px;'>QFES current incidents information has been published in good faith and reasonable effort has been made to ensure its accuracy. The Queensland Fire and Emergency Service accepts no responsibility for any loss or damage incurred as a result of inaccuracies in the information.</span><div><font><span style='font-size:16px;'><br /></span></font></div><div><a href='https://www.qfes.qld.gov.au/copyright' rel='nofollow ugc' target='_blank'>https://www.qfes.qld.gov.au/copyright</a></div>",
			"distribution": [
				{
					"@type": "dcat:Distribution",
					"title": "ArcGIS Hub Dataset",
					"format": "Web Page",
					"mediaType": "text/html",
					"accessURL": "https://www.pacificgeoportal.com/datasets/publicsafetyqld::qfes-ocs-warnings-areas-public-view"
				},
				{
					"@type": "dcat:Distribution",
					"title": "ArcGIS GeoService",
					"format": "ArcGIS GeoServices REST API",
					"mediaType": "application/json",
					"accessURL": "https://services1.arcgis.com/vkTwD8kHw2woKBqV/arcgis/rest/services/OCSWarnings_PublicView/FeatureServer/0"
				},
				{
					"@type": "dcat:Distribution",
					"title": "CSV",
					"format": "CSV",
					"mediaType": "text/csv",
					"accessURL": "https://www.pacificgeoportal.com/api/download/v1/items/7da8fbcdd23541c4ab0464a685e2b3de/csv?layers=0"
				},
				{
					"@type": "dcat:Distribution",
					"title": "Shapefile",
					"format": "ZIP",
					"mediaType": "application/zip",
					"accessURL": "https://www.pacificgeoportal.com/api/download/v1/items/7da8fbcdd23541c4ab0464a685e2b3de/shapefile?layers=0"
				},
				{
					"@type": "dcat:Distribution",
					"title": "GeoJSON",
					"format": "GeoJSON",
					"mediaType": "application/vnd.geo+json",
					"accessURL": "https://www.pacificgeoportal.com/api/download/v1/items/7da8fbcdd23541c4ab0464a685e2b3de/geojson?layers=0"
				},
				{
					"@type": "dcat:Distribution",
					"title": "KML",
					"format": "KML",
					"mediaType": "application/vnd.google-earth.kml+xml",
					"accessURL": "https://www.pacificgeoportal.com/api/download/v1/items/7da8fbcdd23541c4ab0464a685e2b3de/kml?layers=0"
				},
				{
					"@type": "dcat:Distribution",
					"title": "File Geodatabase",
					"format": "ZIP",
					"mediaType": "application/zip",
					"accessURL": "https://www.pacificgeoportal.com/api/download/v1/items/7da8fbcdd23541c4ab0464a685e2b3de/filegdb?layers=0"
				},
				{
					"@type": "dcat:Distribution",
					"title": "Feature Collection",
					"format": "TXT",
					"mediaType": "text/plain",
					"accessURL": "https://www.pacificgeoportal.com/api/download/v1/items/7da8fbcdd23541c4ab0464a685e2b3de/featureCollection?layers=0"
				},
				{
					"@type": "dcat:Distribution",
					"title": "Excel",
					"format": "XLSX",
					"mediaType": "application/vnd.ms-excel",
					"accessURL": "https://www.pacificgeoportal.com/api/download/v1/items/7da8fbcdd23541c4ab0464a685e2b3de/excel?layers=0"
				},
				{
					"@type": "dcat:Distribution",
					"title": "GeoPackage",
					"format": "GPKG",
					"mediaType": "application/geopackage+sqlite3",
					"accessURL": "https://www.pacificgeoportal.com/api/download/v1/items/7da8fbcdd23541c4ab0464a685e2b3de/geoPackage?layers=0"
				},
				{
					"@type": "dcat:Distribution",
					"title": "SQLite Geodatabase",
					"format": "GDB",
					"mediaType": "application/geopackage+sqlite3",
					"accessURL": "https://www.pacificgeoportal.com/api/download/v1/items/7da8fbcdd23541c4ab0464a685e2b3de/sqlite?layers=0"
				}
			],
			"theme": [
				"geospatial"
			]
		},
		{
			"@type": "dcat:Dataset",
			"identifier": "https://www.arcgis.com/home/item.html?id=0f9edcd883c34137ad4e760a41665941",
			"landingPage": "https://www.pacificgeoportal.com/apps/pacificcore::coastal-line-change-impacts-buildings",
			"title": "Coastal Line Change Impacts Buildings",
			"description": "<p>In the southern part of the image, the coastline moved out towards the lagoon, with initial changes visible in the 2014 coastline, and the full, stable change visible in the 2017 coastline in northern part of image, the coastline has moved out towards the lagoon between 2021 and 2022.</p>",
			"keyword": [
				"tuvalu",
				"pgp"
			],
			"issued": "2023-10-19T21:55:05.000Z",
			"modified": "2026-10-22T19:57:43.000Z",
			"publisher": {
				"name": "Pacific GeoPortal - Core Organization"
			},
			"contactPoint": {
				"@type": "vcard:Contact",
				"fn": "dkaragulle_pacificcore",
				"hasEmail": "mailto:pacific_geoportal@esri.com"
			},
			"accessLevel": "public",
			"spatial": "",
			"license": "",
			"distribution": [
				{
					"@type": "dcat:Distribution",
					"title": "ArcGIS Hub Dataset",
					"format": "Web Page",
					"mediaType": "text/html",
					"accessURL": "https://www.pacificgeoportal.com/apps/pacificcore::coastal-line-change-impacts-buildings"
				},
				{
					"@type": "dcat:Distribution",
					"title": "ArcGIS GeoService",
					"format": "ArcGIS GeoServices REST API",
					"mediaType": "application/json",
					"accessURL": "https://storymaps.arcgis.com/stories/0f9edcd883c34137ad4e760a41665941"
				}
			],
			"theme": ""
		},
		{
			"@type": "dcat:Dataset",
			"identifier": "https://www.arcgis.com/home/item.html?id=f8b59c55f66c47bba486354a122a5489",
			"landingPage": "https://www.pacificgeoportal.com/datasets/NASA::power-monthly-radiation",
			"title": "POWER Monthly Radiation",
			"description": "<p style='font-family:&quot;Avenir Next W01&quot;, &quot;Avenir Next W00&quot;, &quot;Avenir Next&quot;, Avenir, &quot;Helvetica Neue&quot;, sans-serif; font-size:16px; margin-bottom:0in; margin-top:0px;'><span style='color:black; font-family:Arial, sans-serif; font-size:medium;'><font style='font-family:inherit;'><span style='background-attachment:initial; background-clip:initial; background-image:initial; background-origin:initial; background-position:initial; background-repeat:initial; background-size:initial;'>The</span></font></span><span style='font-family:Arial, sans-serif; font-size:medium;'><font style='font-family:inherit;'><span style='background-attachment:initial; background-clip:initial; background-image:initial; background-origin:initial; background-position:initial; background-repeat:initial; background-size:initial;'>&nbsp;</span></font></span><a style='color:rgb(0, 97, 155); font-family:inherit; text-decoration-line:none;' target='_blank' href='https://power.larc.nasa.gov/' rel='nofollow ugc noopener noreferrer'><span style='color:rgb(0,121,193); font-family:inherit; font-size:medium;'><font style='font-family:inherit;'><span style='background-attachment:initial; background-clip:initial; background-image:initial; background-origin:initial; background-position:initial; background-repeat:initial; background-size:initial;'>Prediction Of Worldwide Energy Resource (POWER)</span></font></span></a><span style='font-family:inherit; font-size:medium;'><font style='font-family:inherit;'><span style='background-attachment:initial; background-clip:initial; background-image:initial; background-origin:initial; background-position:initial; background-repeat:initial; background-size:initial;'>&nbsp;</span></font></span><span style='color:black; font-family:inherit; font-size:medium;'><font style='font-family:inherit;'><span style='background-attachment:initial; background-clip:initial; background-image:initial; background-origin:initial; background-position:initial; background-repeat:initial; background-size:initial;'>Project</span></font></span><span style='font-family:Arial, sans-serif; font-size:medium;'><font style='font-family:inherit;'>&nbsp;</font></span><span style='color:black; font-family:inherit; font-size:medium;'><font style='font-family:inherit;'><span style='background-attachment:initial; background-clip:initial; background-image:initial; background-origin:initial; background-position:initial; background-repeat:initial; background-size:initial;'>gathers NASA Earth Observation data and parameters related to the fields of surface solar irradiance and meteorology to serve the public in several free, easy-to-access, and easy-to-use methods. POWER helps communities become resilient amid observed climate variability by improving data accessibility, aiding research in renewable energy development, building energy efficiency, and agriculture sustainability. POWER is funded through the NASA Earth Action Program within the Earth Science Mission Directorate at NASA Langley Research Center (LaRC).</span></font></span></p><p style='font-family:&quot;Avenir Next W01&quot;, &quot;Avenir Next W00&quot;, &quot;Avenir Next&quot;, Avenir, &quot;Helvetica Neue&quot;, sans-serif; font-size:16px; margin-bottom:0in; margin-top:0px;'><span style='color:#000000; font-size:medium;'><font style='font-family:inherit;'><strong>-----------------</strong></font></span><strong>----------------------------------------------------------------------------------------------------------------------------------------------------------------------</strong></p><p style='font-family:&quot;Avenir Next W01&quot;, &quot;Avenir Next W00&quot;, &quot;Avenir Next&quot;, Avenir, &quot;Helvetica Neue&quot;, sans-serif; font-size:16px; margin-bottom:0in; margin-top:0px;'>&nbsp;</p><p style='font-family:&quot;Avenir Next W01&quot;, &quot;Avenir Next W00&quot;, &quot;Avenir Next&quot;, Avenir, &quot;Helvetica Neue&quot;, sans-serif; font-size:16px; margin-bottom:0in; margin-top:0px;'><span style='color:#000000; font-family:Arial, sans-serif; font-size:medium;'><font style='font-family:inherit;'>This monthly radiation service provides time-enabled global Analysis Ready Data (ARD) parameters from 1984 to 2025 for the NASA POWER Project's communities.</font></span></p><p style='background-attachment:initial; background-clip:initial; background-image:initial; background-origin:initial; background-position:initial; background-repeat:initial; background-size:initial; font-family:&quot;Avenir Next W01&quot;, &quot;Avenir Next W00&quot;, &quot;Avenir Next&quot;, Avenir, &quot;Helvetica Neue&quot;, sans-serif; font-size:16px; margin-bottom:0in; margin-top:0px;'>&nbsp;</p><ul><li><span style='color:black; font-family:Arial, sans-serif; font-size:medium;'><font style='font-family:inherit;'><strong>Time Interval:</strong>&nbsp;Monthly</font></span></li><li><span style='color:black; font-family:Arial, sans-serif; font-size:medium;'><font style='font-family:inherit;'><strong>Time Extent:&nbsp;</strong>1984/01/01 to 2025/12/31</font></span></li><li><span style='color:black; font-family:Arial, sans-serif; font-size:medium;'><font style='font-family:inherit;'><strong>Time Standard:&nbsp;</strong>Local Sidereal Time (LST)</font></span></li><li><span style='color:black; font-family:Arial, sans-serif; font-size:medium;'><font style='font-family:inherit;'><strong>Grid Size:&nbsp;</strong>1.0 X 1.0 Degree</font></span></li><li><span style='color:black; font-family:Arial, sans-serif; font-size:medium;'><font style='font-family:inherit;'><strong>Projection:</strong>&nbsp;GCS WGS84</font></span></li><li><span style='color:black; font-family:Arial, sans-serif; font-size:medium;'><font style='font-family:inherit;'><strong>Extent:&nbsp;</strong>Global</font></span></li><li><span style='color:black; font-family:Arial, sans-serif; font-size:medium;'><font style='font-family:inherit;'><strong>Source:</strong>&nbsp;</font></span><a style='color:rgb(0, 97, 155); font-family:inherit; text-decoration-line:none;' target='_blank' href='https://power.larc.nasa.gov/' rel='nofollow ugc noopener noreferrer'><span style='font-family:Arial, sans-serif; font-size:medium;'><font style='font-family:inherit;'>NASA Prediction Of Worldwide Energy Resources (POWER)</font></span></a></li></ul><div style='font-family:&quot;Avenir Next W01&quot;, &quot;Avenir Next W00&quot;, &quot;Avenir Next&quot;, Avenir, &quot;Helvetica Neue&quot;, sans-serif; font-size:16px;'><br />&nbsp;</div><p style='font-family:&quot;Avenir Next W01&quot;, &quot;Avenir Next W00&quot;, &quot;Avenir Next&quot;, Avenir, &quot;Helvetica Neue&quot;, sans-serif; font-size:16px; margin-bottom:0px; margin-top:0px;'>&nbsp;</p><p style='background-attachment:initial; background-clip:initial; background-image:initial; background-origin:initial; background-position:initial; background-repeat:initial; background-size:initial; font-family:&quot;Avenir Next W01&quot;, &quot;Avenir Next W00&quot;, &quot;Avenir Next&quot;, Avenir, &quot;Helvetica Neue&quot;, sans-serif; font-size:16px; margin-bottom:0in; margin-top:0px;'><span style='color:black; font-family:Arial, sans-serif; font-size:medium;'><font style='font-family:inherit;'><strong>Radiation Data Sources:</strong></font></span></p><ul><li><span style='color:black; font-family:Arial, sans-serif; font-size:medium;'><font style='font-family:inherit;'>NASA's</font></span><span style='font-family:Arial, sans-serif; font-size:medium;'><font style='font-family:inherit;'>&nbsp;</font></span><a style='color:rgb(0, 97, 155); font-family:inherit; text-decoration-line:none;' target='_blank' href='https://gewex-srb.larc.nasa.gov/' rel='nofollow ugc noopener noreferrer'><span style='color:rgb(0,121,193); font-family:inherit; font-size:medium;'><font style='font-family:inherit;'>GEWEX/SRB release 4.0</font></span></a><span style='font-family:Arial, sans-serif; font-size:medium;'><font style='font-family:inherit;'>&nbsp;</font></span><span style='color:black; font-family:Arial, sans-serif; font-size:medium;'><font style='font-family:inherit;'>archive (Jan. 1, 1984 – Dec. 31, 2000)</font></span></li><li><span style='color:black; font-family:Arial, sans-serif; font-size:medium;'><font style='font-family:inherit;'>NASA's</font></span><span style='font-family:Arial, sans-serif; font-size:medium;'><font style='font-family:inherit;'>&nbsp;</font></span><a style='color:rgb(0, 97, 155); font-family:inherit; text-decoration-line:none;' target='_blank' href='https://ceres.larc.nasa.gov/data/' rel='nofollow ugc noopener noreferrer'><span style='color:rgb(0,121,193); font-family:inherit; font-size:medium;'><font style='font-family:inherit;'>CERES SYN1deg</font></span></a><span style='font-family:Arial, sans-serif; font-size:medium;'><font style='font-family:inherit;'>&nbsp;</font></span><span style='color:black; font-family:Arial, sans-serif; font-size:medium;'><font style='font-family:inherit;'>(Jan. 1, 2001 – Dec. 31, 2025)</font></span></li></ul><p style='background-attachment:initial; background-clip:initial; background-image:initial; background-origin:initial; background-position:initial; background-repeat:initial; background-size:initial; font-family:&quot;Avenir Next W01&quot;, &quot;Avenir Next W00&quot;, &quot;Avenir Next&quot;, Avenir, &quot;Helvetica Neue&quot;, sans-serif; font-size:16px; margin-bottom:0in; margin-top:0px;'><span style='color:black; font-family:Arial, sans-serif; font-size:medium;'><font style='font-family:inherit;'><i>For questions or issues please email:</i></font></span><span style='font-family:Arial, sans-serif; font-size:medium;'><font style='font-family:inherit;'><i>&nbsp;</i></font></span><a style='color:rgb(0, 97, 155); font-family:inherit; text-decoration-line:none;' href='mailto:larc-power-project@mail.nasa.gov' target='_blank' rel='nofollow ugc noopener noreferrer'><span style='color:rgb(0,121,193); font-family:inherit; font-size:medium;'><font style='font-family:inherit;'><i>larc-power-project@mail.nasa.gov</i></font></span></a></p><p style='background-attachment:initial; background-clip:initial; background-image:initial; background-origin:initial; background-position:initial; background-repeat:initial; background-size:initial; font-family:&quot;Avenir Next W01&quot;, &quot;Avenir Next W00&quot;, &quot;Avenir Next&quot;, Avenir, &quot;Helvetica Neue&quot;, sans-serif; font-size:16px; margin-bottom:0in; margin-top:0px;'><br />&nbsp;</p><p style='background-attachment:initial; background-clip:initial; background-image:initial; background-origin:initial; background-position:initial; background-repeat:initial; background-size:initial; font-family:&quot;Avenir Next W01&quot;, &quot;Avenir Next W00&quot;, &quot;Avenir Next&quot;, Avenir, &quot;Helvetica Neue&quot;, sans-serif; font-size:16px; margin-bottom:0in; margin-top:0px;'><span style='color:black; font-family:Arial, sans-serif; font-size:medium;'><font style='font-family:inherit;'><strong>Radiation Data Parameters:</strong></font></span></p><p style='background-attachment:initial; background-clip:initial; background-image:initial; background-origin:initial; background-position:initial; background-repeat:initial; background-size:initial; font-family:&quot;Avenir Next W01&quot;, &quot;Avenir Next W00&quot;, &quot;Avenir Next&quot;, Avenir, &quot;Helvetica Neue&quot;, sans-serif; font-size:16px; margin-bottom:0in; margin-top:0px;'>&nbsp;</p><ul><li><span style='color:black; font-family:Arial, sans-serif;'><strong>ALLSKY_KT</strong>&nbsp;(<i>All Sky Insolation Clearness Index):</i>&nbsp;A fraction representing clearness of the atmosphere; the all sky insolation that is transmitted through the atmosphere to strike the surface of the earth divided by the average of top of the atmosphere total solar irradiance incident.</span></li><li><span style='color:black; font-family:Arial, sans-serif;'><strong>ALLSKY_SFC_LW_DWN</strong>&nbsp;(<i>All Sky Surface Longwave Downward Irradiance):</i>&nbsp;The downward thermal infrared irradiance under all sky conditions reaching a horizontal plane the surface of the earth. Also known as Horizontal Infrared Radiation Intensity from Sky.</span></li><li><span style='color:black; font-family:Arial, sans-serif;'><strong>ALLSKY_SFC_LW_UP</strong>&nbsp;(<i>All Sky Surface Longwave Upward Irradiance):</i>&nbsp;The upward thermal infrared irradiance under all sky conditions.</span></li><li><span style='color:black; font-family:Arial, sans-serif;'><strong>ALLSKY_SFC_PAR_TOT</strong>&nbsp;(<i>All Sky Surface PAR Total):</i>&nbsp;The total Photosynthetically Active Radiation (PAR) incident on a horizontal plane at the surface of the earth under all sky conditions.</span></li><li><span style='color:black; font-family:Arial, sans-serif;'><strong>ALLSKY_SFC_SW_DIFF</strong>&nbsp;(<i>All Sky Surface Shortwave Diffuse Irradiance):</i>&nbsp;The diffuse (light energy scattered out of the direction of the sun) solar irradiance incident on a horizontal plane at the surface of the earth under all sky conditions.</span></li><li><span style='color:black; font-family:Arial, sans-serif;'><strong>ALLSKY_SFC_SW_DNI</strong>&nbsp;(<i>All Sky Surface Shortwave Downward Direct Normal Irradiance)</i>: The direct solar irradiance incident to a horizontal plane normal (perpendicular) to the direction of the sun's position under all sky conditions.</span></li><li><span style='color:black; font-family:Arial, sans-serif;'><strong>ALLSKY_SFC_SW_DWN&nbsp;</strong><i>(All Sky Surface Shortwave Downward Irradiance)</i>: The total solar irradiance incident (direct plus diffuse) on a horizontal plane at the surface of the earth under all sky conditions. An alternative term for the total solar irradiance is the \"Global Horizontal Irradiance\" or GHI.</span></li><li><span style='color:black; font-family:Arial, sans-serif;'><strong>ALLSKY_SFC_SW_UP&nbsp;</strong><i>(All Sky Surface Shortwave Upward Irradiance)</i>: The upward shortwave irradiance under all sky conditions.</span></li><li><span style='color:black; font-family:Arial, sans-serif;'><strong>ALLSKY_SFC_UV_INDEX&nbsp;</strong><i>(All Sky Surface UV Index)</i>: The ultraviolet radiation exposure index.</span></li><li><span style='color:black; font-family:Arial, sans-serif;'><strong>ALLSKY_SFC_UVA</strong>&nbsp;<i>(All Sky Surface UVA Irradiance)</i>: The ultraviolet A (UVA 315nm-400nm) irradiance under all sky conditions.</span></li><li><span style='color:black; font-family:Arial, sans-serif;'><strong>ALLSKY_SFC_UVB</strong>&nbsp;<i>(All Sky Surface UVB Irradiance)</i>: The ultraviolet B (UVB 280nm-315nm) irradiance under all sky conditions.</span></li><li><span style='color:black; font-family:Arial, sans-serif;'><strong>ALLSKY_SRF_ALB&nbsp;</strong><i>(All Sky Surface Albedo)</i>: The all sky rate of reflectivity of the earth's surface; the ratio of the solar energy reflected by the surface of the earth compared to the total solar energy incident reaching the surface of the earth.</span></li><li><span style='color:black; font-family:Arial, sans-serif;'><strong>AOD_55&nbsp;</strong><i>(Aerosol Optical Depth 55)</i>: The optical thickness at 0.55 um measured vertically; the component of the atmosphere to quantify the removal of radiant energy from an incident beam.</span></li><li><span style='color:black; font-family:Arial, sans-serif;'><strong>AOD_55_ADJ&nbsp;</strong><i>(Adjusted Aerosol Optical Depth 55)</i>: The adjusted optical thickness at 0.55 um measured vertically; the component of the atmosphere to quantify the removal of radiant energy from an incident beam.</span></li><li><span style='color:black; font-family:Arial, sans-serif;'><strong>CLOUD_AMT&nbsp;</strong><i>(Cloud Amount)</i>: The average percent of cloud amount during the temporal period.</span></li><li><span style='color:black; font-family:Arial, sans-serif;'><strong>CLOUD_AMT_DAY&nbsp;</strong><i>(Cloud Amount at Daytime)</i>: The average percent of cloud amount during daylight.</span></li><li><span style='color:black; font-family:Arial, sans-serif;'><strong>CLOUD_AMT_NIGHT&nbsp;</strong><i>(Cloud Amount at Nighttime)</i>: The average percent of cloud amount during nighttime.</span></li><li><span style='color:black; font-family:Arial, sans-serif;'><strong>CLOUD_OD</strong>&nbsp;<i>(Cloud Optical Visible Depth)</i>: The vertical optical thickness between the top and bottom of a cloud.</span></li><li><span style='color:black; font-family:Arial, sans-serif;'><strong>CLRSKY_DAYS&nbsp;</strong><i>(Clear Sky Day)</i>: The number of Clear Sky Days if the daytime cloud amount is less than 10 percent.</span></li><li><span style='color:black; font-family:Arial, sans-serif;'><strong>CLRSKY_KT&nbsp;</strong><i>(Clear Sky Insolation Clearness Index)</i>: A fraction representing clearness of the atmosphere; the clear sky insolation that is transmitted through the atmosphere to strike the surface of the earth divided by the average of top of the atmosphere total solar irradiance incident.</span></li><li><span style='color:black; font-family:Arial, sans-serif;'><strong>CLRSKY_SFC_LW_DWN&nbsp;</strong><i>(Clear Sky Surface Longwave Downward Irradiance)</i>:&nbsp; The downward thermal infrared irradiance under clear sky conditions reaching a horizontal plane the surface of the earth. Also known as Horizontal Infrared Radiation Intensity from Sky.</span></li><li><span style='color:black; font-family:Arial, sans-serif;'><strong>CLRSKY_SFC_LW_UP&nbsp;</strong><i>(Clear Sky Surface Longwave Upward Irradiance)</i>: The upward thermal infrared irradiance under clear sky conditions.</span></li><li><span style='color:black; font-family:Arial, sans-serif;'><strong>CLRSKY_SFC_PAR_TOT&nbsp;</strong><i>(Clear Sky Surface PAR Total)</i>: The total Photosynthetically Active Radiation (PAR) incident on a horizontal plane at the surface of the earth under clear sky conditions.</span></li><li><span style='color:black; font-family:Arial, sans-serif;'><strong>CLRSKY_SFC_SW_DIFF&nbsp;</strong><i>(Clear Sky Surface Shortwave Downward Diffuse Horizontal Irradiance)</i>: The diffuse (light energy scattered out of the direction of the sun) solar irradiance incident on a horizontal plane at the surface of the earth under clear sky conditions.</span></li><li><span style='color:black; font-family:Arial, sans-serif;'><strong>CLRSKY_SFC_SW_DNI&nbsp;</strong><i>(Clear Sky Surface Shortwave Downward Direct Normal Irradiance)</i>: The direct solar irradiance incident to a horizontal plane normal (perpendicular) to the direction of the sun's position under clear sky conditions.</span></li><li><span style='color:black; font-family:Arial, sans-serif;'><strong>CLRSKY_SFC_SW_DWN&nbsp;</strong><i>(Clear Sky Surface Shortwave Downward Irradiance)</i>: The total solar irradiance incident (direct plus diffuse) on a horizontal plane at the surface of the earth under clear sky conditions. An alternative term for the total solar irradiance is the \"Global Horizontal Irradiance\" or GHI.</span></li><li><span style='color:black; font-family:Arial, sans-serif;'><strong>CLRSKY_SFC_SW_UP&nbsp;</strong><i>(Clear Sky Surface Shortwave Upward Irradiance)</i>: The upward shortwave irradiance under clearsky conditions.</span></li><li><span style='color:black; font-family:Arial, sans-serif;'><strong>CLRSKY_SRF_ALB&nbsp;</strong><i>(Clear Sky Surface Albedo)</i>: The clear sky rate of reflectivity of the earth's surface; the ratio of the solar energy reflected by the surface of the earth compared to the total solar energy incident reaching the surface of the earth.</span></li><li><span style='color:black; font-family:Arial, sans-serif;'><strong>MIDDAY_INSOL&nbsp;</strong><i>(Midday Insolation Incident)</i>: The total amount of solar irradiance (i.e. direct plus diffuse) incident on a horizontal plane at the earth's surface during the solar noon hour midday period.</span></li><li><span style='color:black; font-family:Arial, sans-serif;'><strong>PW&nbsp;</strong><i>(Precipitable Water)</i>: The total atmospheric water vapor contained in a vertical column of the atmosphere.</span></li><li><span style='color:black; font-family:Arial, sans-serif;'><strong>TOA_SW_DNI&nbsp;</strong><i>(Top-Of-Atmosphere Shortwave Direct Normal Radiation)</i>: The total solar irradiance incident (direct plus diffuse) on a horizontal plane where oriented to the sun's position at the top of the atmosphere (extraterrestrial radiation).</span></li><li><span style='color:black; font-family:Arial, sans-serif;'><strong>TOA_SW_DWN&nbsp;</strong><i>(Top-Of-Atmosphere Shortwave Downward Irradiance)</i>: The total solar irradiance incident (direct plus diffuse) on a horizontal plane at the top of the atmosphere (extraterrestrial radiation).</span></li><li><span style='color:black; font-family:Arial, sans-serif;'><strong>TS_ADJ&nbsp;</strong><i>(Earth Skin Temperature Adjusted)</i>: The adjusted average temperature at the earth's surface.</span></li></ul>",
			"keyword": [
				"NASA",
				"POWER",
				"Prediction Of Worldwide Energy Resources",
				"Langley Research Center",
				"LaRC",
				"Earth",
				"Earth Data",
				"Earth Science",
				"Earth Observations",
				"Analysis Ready Data",
				"Climate",
				"Radiation",
				"Renewable Energy",
				"Sustainable Buildings",
				"Agroclimatology",
				"Global Energy and Water Cycle Experiment",
				"GEWEX",
				"Surface Radiation Budget",
				"SRB",
				"Clouds and the Earth's Radiant Energy System",
				"CERES",
				"Global Modeling and Assimilation Office",
				"GMAO",
				"Irradiance",
				"Time-enabled",
				"Monthly"
			],
			"issued": "2021-11-30T20:05:31.000Z",
			"modified": "2026-10-19T13:48:57.000Z",
			"publisher": {
				"name": "NASA ArcGIS Online"
			},
			"contactPoint": {
				"@type": "vcard:Contact",
				"fn": "bmacpher_NASA",
				"hasEmail": "mailto:hq-smd-esri-software-support@mail.nasa.gov"
			},
			"accessLevel": "public",
			"spatial": "-180.0000,-90.0000,180.0000,90.0000",
			"license": "<div style='font-family:&quot;Avenir Next W01&quot;, &quot;Avenir Next W00&quot;, &quot;Avenir Next&quot;, Avenir, &quot;Helvetica Neue&quot;, sans-serif; font-size:16px;'><font color='#000000'><b>Data </b><b>Use</b><b>: </b>When POWER data products are used in a publication, we request the following acknowledgment be included: <i>&quot;These data were obtained from the NASA Langley Research Center POWER Project funded through the NASA Earth Science Directorate Earth Action Program.&quot;</i></font></div><div style='font-family:&quot;Avenir Next W01&quot;, &quot;Avenir Next W00&quot;, &quot;Avenir Next&quot;, Avenir, &quot;Helvetica Neue&quot;, sans-serif; font-size:16px;'><i><font color='#000000'><br /></font></i></div><div style='font-family:&quot;Avenir Next W01&quot;, &quot;Avenir Next W00&quot;, &quot;Avenir Next&quot;, Avenir, &quot;Helvetica Neue&quot;, sans-serif; font-size:16px;'><font color='#000000'><b>Data </b><b>Redistribution</b><b>: </b>To assist the POWER Project in providing the best service to the scientific community, we request notification if you transmit POWER data to other researchers.</font></div><div style='font-family:&quot;Avenir Next W01&quot;, &quot;Avenir Next W00&quot;, &quot;Avenir Next&quot;, Avenir, &quot;Helvetica Neue&quot;, sans-serif; font-size:16px;'><font color='#000000'><br /></font></div><div><font color='#000000' style='font-family:&quot;Avenir Next W01&quot;, &quot;Avenir Next W00&quot;, &quot;Avenir Next&quot;, Avenir, &quot;Helvetica Neue&quot;, sans-serif; font-size:16px;'><b><span style='font-family:&quot;Avenir Next W01&quot;, &quot;Avenir Next W00&quot;, &quot;Avenir Next&quot;, Avenir, &quot;Helvetica Neue&quot;, Helvetica, Arial, sans-serif; font-size:17px;'>Publication</span><span style='font-family:&quot;Avenir Next W01&quot;, &quot;Avenir Next W00&quot;, &quot;Avenir Next&quot;, Avenir, &quot;Helvetica Neue&quot;, Helvetica, Arial, sans-serif; font-size:17px;'> </span>Reprints: </b>The POWER Project requests a reprint of any published papers or reports or a brief description of other uses (e.g., posters, oral presentations, etc.) of data products that we have distributed. This will help us determine the use of data that we distribute, which is helpful in optimizing product development. It also helps us to keep our product-related references current. Please contact us at </font><a href='mailto:larc-power-project@mail.nasa.gov' target='_blank' rel='nofollow ugc noopener noreferrer'>larc-power-project@mail.nasa.gov</a><span style='font-family:&quot;Avenir Next W01&quot;, &quot;Avenir Next W00&quot;, &quot;Avenir Next&quot;, Avenir, &quot;Helvetica Neue&quot;, sans-serif; font-size:16px; color:rgb(0, 0, 0);'> for instructions on mailing reprints.</span></div><div style='font-family:&quot;Avenir Next W01&quot;, &quot;Avenir Next W00&quot;, &quot;Avenir Next&quot;, Avenir, &quot;Helvetica Neue&quot;, sans-serif; font-size:16px;'><font color='#000000'><br /></font></div><div style='font-family:&quot;Avenir Next W01&quot;, &quot;Avenir Next W00&quot;, &quot;Avenir Next&quot;, Avenir, &quot;Helvetica Neue&quot;, sans-serif; font-size:16px;'><font color='#000000'><b>Acknowledgements: </b>The POWER team could not have completed this task without both technical and scientific inputs from the following Earth Science Mission Directorate teams: The World Climate Research Programme (WCRP) Global Energy and Water Cycle Experiment's (GEWEX) Surface Radiation Budget (NASA/GEWEX SRB) and the Clouds and the Earth's Radiant Energy System (CERES) projects at NASA Langley Research Center and the Global Modeling and Assimilation Office at the NASA Goddard Space Flight Center.</font></div>",
			"distribution": [
				{
					"@type": "dcat:Distribution",
					"title": "ArcGIS Hub Dataset",
					"format": "Web Page",
					"mediaType": "text/html",
					"accessURL": "https://www.pacificgeoportal.com/datasets/NASA::power-monthly-radiation"
				},
				{
					"@type": "dcat:Distribution",
					"title": "ArcGIS GeoService",
					"format": "ArcGIS GeoServices REST API",
					"mediaType": "application/json",
					"accessURL": "https://gis.earthdata.nasa.gov/portal/rest/services/POWER/POWER_MONTHLY_RADIATION_LST/ImageServer"
				}
			],
			"theme": [
				"geospatial"
			]
		},
		{
			"@type": "dcat:Dataset",
			"identifier": "https://www.arcgis.com/home/item.html?id=fdcbea85edc5446da0bbc6c913fcd46e&sublayer=0",
			"landingPage": "https://www.pacificgeoportal.com/datasets/esri2::anti-shipping-activity-messages-archive",
			"title": "Anti-Shipping Activity Messages Archive",
			"description": "<p>*** <strong>The funding for the Anti-shipping Activity Messages (ASAM) database ended in June 30, 2024; as a result we are no longer updating the ASAM database or the GIS data on our web page. The Office of Naval Intelligence does have PDF files of ASAM events on their Worldwide Threat to Shipping page</strong> -&nbsp;<a target='_blank' href='https://www.oni.navy.mil/ONI-Reports/Shipping-Threat-Reports/Worldwide-Threat-to-Shipping/' rel='nofollow ugc noopener noreferrer'><strong>https://www.oni.navy.mil/ONI-Reports/Shipping-Threat-Reports/Worldwide-Threat-to-Shipping/</strong></a><strong>&nbsp;[oni.navy.mil]. ***</strong><br />&nbsp;</p><div><p>The United Nations Convention on the Law of the Sea (UNCLOS) defines \"Piracy\" and:&nbsp;</p><div style='padding-left:30px;'>(a) any illegal acts of violence or detention, or any act of depredation, committed for private ends by the crew or the passengers of a private ship or a private aircraft, and directed:&nbsp;</div><div style='padding-left:60px;'>(i) on the high seas, against another ship or aircraft, or against persons or property on board such ship or aircraft;&nbsp;</div><div style='padding-left:60px;'>(ii) against a ship, aircraft, persons or property in a place outside the jurisdiction of any State;&nbsp;</div><p style='padding-left:30px;'>(b) any act of voluntary participation in the operation of a ship or of an aircraft with knowledge of facts making it a pirate ship or aircraft;&nbsp;</p><p style='padding-left:30px;'>(c) any act of inciting or of intentionally facilitating an act described in subparagraph (a) or (b).</p><div><p>Pirate attacks affect many different parties, including the flag state of the vessel that is attacked, the states of nationality of the crew members aboard the attacked vessel, the state from which the pirates originate, the state in whose waters (if any) the attack occurs, the states of the ship and cargo owners, and the states for which cargo on attacked vessels is destined. In addition to their immediate impacts on the vessels, individuals, and cargo involved in an attack, sustained episodes of piracy can affect international shipping rates (by leading to the diversion of cargoes to other shipping lanes) and lead to increases in insurance rates. Further, they can isolate those states from which the piracy is originating if vessels refuse to make port calls in those nations.</p><p>Anti-shipping Activity Messages (ASAM) include the locations and descriptive accounts of specific hostile acts against ships and mariners. The reports may be useful for recognition, prevention and avoidance of potential hostile activity.</p><p>This layer can be searched using ASAM reference number(s), sub region, or occurrence date(s). Each record includes the date of occurrence, an ASAM reference number, the number identifying the geographical subregion, the latitude and longitude of the geographical location, the aggressor if known, the type of vessel victimized, the name of the vessel victimized and a detailed description of the occurrence.</p><p><strong>Source</strong>: Data are checked daily and updated accordingly :&nbsp; <a target='_blank' href='https://msi.nga.mil/Piracy' rel='nofollow ugc noopener noreferrer'><strong>https://msi.nga.mil/Piracy</strong></a></p><p><strong>Related Documents</strong>:&nbsp;<a target='_blank' href='https://www.hsdl.org/?view&amp;did=755125' rel='nofollow ugc noopener noreferrer'>United States Counter Piracy and Maritime Security Action Plan</a>,&nbsp;<a target='_blank' href='https://www.oni.navy.mil/News/Shipping-Threat-Reports/' rel='nofollow ugc noopener noreferrer'>Worldwide Threat to Shipping</a>,&nbsp;<a target='_blank' href='https://www.hsdl.org/?view&amp;did=12005' rel='nofollow ugc noopener noreferrer'>Piracy: A Legal Definition</a>,&nbsp;<a target='_blank' href='https://www.hsdl.org/?abstract&amp;did=36978' rel='nofollow ugc noopener noreferrer'>International Piracy on the High Seas</a></p><p><strong>Revisions</strong></p><ul><li><strong>Apr 17, 2026</strong>: Added field descriptions and value types, revised popup and summary.</li></ul></div></div>",
			"keyword": [
				"Maritime Safety Information",
				"Piracy",
				"Anti-Piracy",
				"Anti-shipping",
				"Maritime Safety",
				"environment",
				"esri_environment",
				"hosted",
				"ocean",
				"oceans"
			],
			"issued": "2020-05-28T15:21:02.000Z",
			"modified": "2026-04-17T23:17:12.631Z",
			"publisher": {
				"name": "Esri"
			},
			"contactPoint": {
				"@type": "vcard:Contact",
				"fn": "esri_livefeeds2",
				"hasEmail": "{{orgContactEmail}}"
			},
			"accessLevel": "public",
			"spatial": "-174.0000,-44.0000,178.4333,67.7833",
			"license": "<img alt='' src='https://downloads.esri.com/blogs/arcgisonline/esrilogo_new.png' /> This work is licensed under the Esri Master License Agreement.<br /><div><a href='https://goto.arcgis.com/termsofuse/viewsummary' target='_blank' rel='nofollow ugc noopener noreferrer'><b>View Summary</b></a> | <a href='https://goto.arcgis.com/termsofuse/viewtermsofuse' target='_blank' rel='nofollow ugc noopener noreferrer'><b>View Terms of Use</b></a></div>",
			"distribution": [
				{
					"@type": "dcat:Distribution",
					"title": "ArcGIS Hub Dataset",
					"format": "Web Page",
					"mediaType": "text/html",
					"accessURL": "https://www.pacificgeoportal.com/datasets/esri2::anti-shipping-activity-messages-archive"
				},
				{
					"@type": "dcat:Distribution",
					"title": "ArcGIS GeoService",
					"format": "ArcGIS GeoServices REST API",
					"mediaType": "application/json",
					"accessURL": "https://services9.arcgis.com/RHVPKKiFTONKtxq3/arcgis/rest/services/ASAM_events_V1/FeatureServer/0"
				},
				{
					"@type": "dcat:Distribution",
					"title": "CSV",
					"format": "CSV",
					"mediaType": "text/csv",
					"accessURL": "https://www.pacificgeoportal.com/api/download/v1/items/fdcbea85edc5446da0bbc6c913fcd46e/csv?layers=0"
				},
				{
					"@type": "dcat:Distribution",
					"title": "Shapefile",
					"format": "ZIP",
					"mediaType": "application/zip",
					"accessURL": "https://www.pacificgeoportal.com/api/download/v1/items/fdcbea85edc5446da0bbc6c913fcd46e/shapefile?layers=0"
				},
				{
					"@type": "dcat:Distribution",
					"title": "GeoJSON",
					"format": "GeoJSON",
					"mediaType": "application/vnd.geo+json",
					"accessURL": "https://www.pacificgeoportal.com/api/download/v1/items/fdcbea85edc5446da0bbc6c913fcd46e/geojson?layers=0"
				},
				{
					"@type": "dcat:Distribution",
					"title": "KML",
					"format": "KML",
					"mediaType": "application/vnd.google-earth.kml+xml",
					"accessURL": "https://www.pacificgeoportal.com/api/download/v1/items/fdcbea85edc5446da0bbc6c913fcd46e/kml?layers=0"
				}
			],
			"theme": [
				"geospatial"
			]
		},
		{
			"@type": "dcat:Dataset",
			"identifier": "https://www.arcgis.com/home/item.html?id=933e8f24fe9140f99dfb57173087f27d",
			"landingPage": "https://www.pacificgeoportal.com/apps/NIWA::new-zealand-river-flood-statistics-app",
			"title": "New Zealand River Flood Statistics App",
			"description": "<font color='#000000' size='3'>\n\n</font><p style='margin: 0cm 0cm 0pt;'><span style='color: rgb(76, 76, 76); font-family: &quot;Arial&quot;,sans-serif; font-size: 12pt;'><a href='https://niwa.maps.arcgis.com/home/item.html?id=ae4316ef6bc842c4aed6a76b10b0c39e' target='_blank' rel='nofollow ugc noopener noreferrer'>A map service</a> and web application where users can extract flood\nstatistics from a regional flood model, at-site flood statistics and annual\nmaximum flows from flow recorders used in the model development, flood\nestimates based on rain intensity for use in the Rational Method.</span></p><p style='margin: 0cm 0cm 0pt;'><br /></p><p><b> 1. Modelled flood frequency estimates on river lines.</b></p><ul><li><div style='margin-right: 0px;'>NZREACH NZ digital network 1 ID no.</div></li><li><div style='margin-right: 0px;'>River name where available</div></li><li><div style='margin-right: 0px;'>Areakm2 catchment area draining to the downstream end of this reach (square kilometres)</div></li><li><div style='margin-right: 0px;'>q100_reach ratio of Q100 (1% aep flood) to mean annual flood</div></li><li><div style='margin-right: 0px;'>H&amp;C18_MAF mean annual flood (cumecs)</div></li><li><div style='margin-right: 0px;'>H&amp;C18_5-yr 5-yr (20% aep) flood (cumecs)</div></li><li><div style='margin-right: 0px;'>H&amp;C18_10y 10-yr (10% aep) flood (cumecs)</div></li><li><div style='margin-right: 0px;'>H&amp;C18_20y 20-yr (5% aep) flood (cumecs)</div></li><li><div style='margin-right: 0px;'>H&amp;C18_50y 50-yr (2% aep) flood (cumecs)</div></li><li><div style='margin-right: 0px;'>H&amp;C18_100y 100-yr (1% aep) flood (cumecs)</div></li><li><div style='margin-right: 0px;'>H&amp;C18_1000y 1000-yr (0.1% aep) flood (cumecs)</div></li><li><div style='margin-right: 0px;'>HCse_MAF standard error of mean annual flood (cumecs)</div></li><li><div style='margin-right: 0px;'>HCse_5y standard error of 5-yr (20% aep) flood (cumecs)</div></li><li><div style='margin-right: 0px;'>HCse_10y standard error of 10-yr (10% aep) flood (cumecs) </div></li><li><div style='margin-right: 0px;'>HCse_20y standard error of 20-yr (5% aep) flood (cumecs)</div></li><li><div style='margin-right: 0px;'>HCse_50y standard error of 50-yr (2% aep) flood (cumecs)</div></li><li><div style='margin-right: 0px;'>HCse_100y standard error of 100-yr (1% aep) flood (cumecs)</div></li><li><div style='margin-right: 0px;'>HCse_1000y standard error of 1000-yr (0.1% aep) flood (cumecs)</div></li><li><div style='margin-right: 0px;'>Strm_Order Strahler stream order (1=headwater, two ones join to make an order 2, etc.) 2.</div></li></ul><p><b> 2. At-site flood statistics at flow recorders used in the model development</b></p><ul><li>\n\nSiteno NIWA reference number for flow recorder </li><li>Name Flow recorder name generally 'river' at 'location' </li><li>NZTM_E NZTM easting NZTM_N NZTM northing</li><li>Region Regional council or unitary authority territory</li><li>Operator Organisation that oprates the flow recorder Funder Organisation that funds the flow recorder (can be more than one)</li><li>Area_km2 catchment area draining to the flow recorder (square kilometers)</li><li>No_years Number of years in the annual flood series (allowing for years with missing data)</li><li>L1_mean Mean of the annual flood series (linear moment 1)</li><li>L2 Linear moment 2 of the annual flood series (analogous to standard deviation)</li><li>Lcv Linear CV of the annual flood series (L2/L1) </li><li>T3_Lskew Linear skew ratio of the annual flood series </li><li>T4_Lkurt Linear kurtosis ratio of the annual flood series </li><li>Gumb_u Gumbel distribution u of the annual flood series </li><li>Gumb_alpha Gumbel distribution alpha of the annual flood series </li><li>GEV_u Generalised Extreme Value u of the annual flood series</li><li>GEV_alpha Generalised Extreme Value alpha of the annual flood series </li><li>GEV_k Generalised Extreme Value k of the annual flood series </li><li>GEV_z Hosking-Wallis normal standard variate to test significance of GEV-k (is the at-site distribution Gumbel or not?)</li><li>Data 2.33y mean annual flood (2.33-yr assuming Gumbel, or 43% aep)</li><li>Data 5y 5-yr (20% aep) flood (cumecs)</li><li>Data 10y 10-yr (10% aep) flood (cumecs)</li><li>Data 20y 20-yr (5% aep) flood (cumecs)</li><li>Data 50y 50-yr (2% aep) flood (cumecs)</li><li>Data 100y 100-yr (1% aep) flood (cumecs)</li><li>Data 250y 250-yr (0.4% aep) flood (cumecs)</li><li>Data 500y 500-yr (0.2% aep) flood (cumecs) </li><li>Data 1000y 1000-yr (0.1% aep) flood (cumecs)</li><li>se_2.33y standard error of mean annual flood (%) </li><li>se_5y standard error of 5-yr (20% aep) flood (%)</li><li>se_10y standard error of 10-yr (10% aep) flood (%)</li><li>se_20y standard error of 20-yr (5% aep) flood (%)</li><li>se_50y standard error of 50-yr (2% aep) flood (%)</li><li>se_100y standard error of 100-yr (1% aep) flood (%)</li><li>se_250y standard error of 250-yr (0.4% aep) flood (%)</li><li>se_500y standard error of 500-yr (0.2% aep) flood (%) </li><li>se_1000y standard error of 1000-yr (0.1% aep) flood (%)</li></ul><p><b>\n\n 3. Return period estimates of the area-rain intensity values for small \ncatchments. \nWhere results display '-1' the catchment is greater than 30 square \nkilometres and no answer is available. Numbers need to be multiplied by \nthe Rational Method 'C' factor to give the required flood magnitude.</b>\n</p><ul><li>NZREACH NZ digital network 1 ID no. </li><li>AREA_km2 catchment area draining to the flow recorder (square kilometers)</li><li>QIA_5y 5-yr (20% aep) IA estimate</li><li>QIA_10y 10-yr (10% aep) IA estimate </li><li>QIA_20y 20-yr (5% aep) IA estimate</li><li>QIA_50y 50-yr (2% aep) IA estimate</li><li>QIA_100y 100-yr (1% aep) IA estimate </li><li>QIA_1000y 1000-yr (0.1% aep) IA estimate</li></ul><p><b>4. Annual data values at flow recorders used in the model development.\nLayer coming later.</b></p><p style='margin: 0cm 0cm 0pt;'><span style='color: rgb(76, 76, 76); font-family: &quot;Arial&quot;,sans-serif; font-size: 12pt;'></span></p><font color='#000000' size='3'>\n\n</font>_________________________________________________________________________________________________________________<br /><br /><font size='3'><b>Item Page Created:</b> 2018-07-08 23:41  <br /><b>Item Page Last Modified:</b> 2025-04-05 20:46<br />Owner: NIWA_OpenData</font><br />",
			"keyword": [
				"Henderson",
				"Henderson Collins",
				"Flood Estimation",
				"Catchment",
				"Flood",
				"NZ",
				"New Zealand",
				"River",
				"app",
				"application",
				"model",
				"freshwater",
				"climate",
				"autometadata",
				"Classification",
				"CC_Land_and_Water",
				"Proj_OPENDATA"
			],
			"issued": "2018-07-08T23:41:05.000Z",
			"modified": "2026-10-13T02:36:12.000Z",
			"publisher": {
				"name": "National Institute of Water and Atmospheric Research"
			},
			"contactPoint": {
				"@type": "vcard:Contact",
				"fn": "NIWA_OpenData",
				"hasEmail": "mailto:enquiries@niwa.co.nz"
			},
			"accessLevel": "public",
			"spatial": "166.0939,-47.6571,178.6504,-34.0089",
			"license": "https://creativecommons.org/licenses/by-nc/4.0",
			"distribution": [
				{
					"@type": "dcat:Distribution",
					"title": "ArcGIS Hub Dataset",
					"format": "Web Page",
					"mediaType": "text/html",
					"accessURL": "https://www.pacificgeoportal.com/apps/NIWA::new-zealand-river-flood-statistics-app"
				},
				{
					"@type": "dcat:Distribution",
					"title": "ArcGIS GeoService",
					"format": "ArcGIS GeoServices REST API",
					"mediaType": "application/json",
					"accessURL": "https://niwa.maps.arcgis.com/apps/instant/lookup/index.html?appid=dbcaedb2073b41b6993bd0155e5d8c53"
				}
			],
			"theme": [
				"geospatial"
			]
		},
		{
			"@type": "dcat:Dataset",
			"identifier": "https://www.arcgis.com/home/item.html?id=3a4b6cc2c1c74fbb8ddbe25df28e410c",
			"landingPage": "https://www.pacificgeoportal.com/maps/NIWA::river-environment-classification-rec2-new-zealand",
			"title": "River Environment Classification (REC2) New Zealand",
			"description": "<div><span style='font-weight:bold;'>REC2 (River Environment Classification, v2.<span>5</span><span>) - June 2019 [Hosted Feature Layer]<br /></span></span></div><div><span style='font-weight:bold;'>This service depicts rivers as lines and catchments as polygons</span><br /><span style='font-weight:bold;'><span></span></span></div><div><span style='font-weight:bold;'><span></span></span></div><div style='text-align:Left; font-size:12pt;'><div><p><span>    The River Environment Classification (REC) is a database of catchment spatial attributes, summarised for every segment in New Zealand's network of rivers. The attributes were compiled for the purposes of river classification, while the river network description has been used to underpin models.    Typically, models (e.g. CLUES and TopNet) would use the dendritic (branched) linkages of REC river segments to perform their calculations. Since its release and use over the last decade, some errors in the location and connectivity of these linkages have been identified. The current revision corrects those errors, and updates a number of spatial attributes with the latest data.    REC2 provides a re-cut framework of rivers for modelling and classification.</span></p><p><span> It is built on a newer version of the 30m digital elevation model, in which the original 20m contours were supplemented with, for example, more spot elevation data and a better coastline contour. Boundary errors were minimised by processing contiguous areas (such as the whole of the North Island) together, which wasn't possible when it was originally created.</span></p><p><span>Major updates include the revision of catchment land use information, by overlaying with the land cover database (LCDB3, current as at 2008), and the update of river and rainfall statistics with data from 1960-2006.    The river network and associated attributes have been assembled within an ArcGIS geodatabase. Topological connectivity has been established to allow upstream and downstream tracing within the network. <br /></span></p><p><span>REC2 can be downloaded or streamed and used directly in ArcMap.</span><a href='https://niwa.maps.arcgis.com/home/item.html?id=5a07a0b45d504e4db4f79753663430b6' target='_blank' rel='nofollow ugc noopener noreferrer'><span style='color:rgb(76, 76, 76);'> (</span>A file geodatabase version for ArcGIS of REC2 can be downloaded as a \nzip file and used directly for analyses in ArcMap from here</a>)</p><p><span></span></p><p>This layer is using Esri's ArcGIS Online Optimizations for fast rendering.<br /></p><p><br /><span><span style='font-weight:bold;'>This is REC2 (Version 5) , June 2019</span> - a publicly available dataset from NIWA Taihoro Nukurangi.</span></p><p><span>NIWA acknowledges funding from the MBIE SSIF towards the preparation of REC v2.</span><span>5</span></p><p><span><span style='font-weight:bold;'>Coordinate Reference System: NZTM (New Zealand Transverse Mercator, EPSG: 2193)</span><br /></span></p><p>Geometric Representation of Rivers: Lines</p><p><span style='font-weight:bold;'>Extent (Bounding Box): </span><br /><span>\n \n \n \n  <span style='font-style:italic;'>Top(Latitude)</span>\n  -33.9534<span style='font-style:italic;'>Bottom(Latitude)</span>\n  -47.4867\n \n \n  <span style='font-style:italic;'>Left (Longitude)</span>\n  166.2634\n \n \n  <span style='font-style:italic;'>Right (Longitude)</span>\n  178.9733\n \n</span></p><p><span><br /></span></p><p><span>\n \n \n \n \n  <span style='text-decoration:underline;'>Riverlines table</span>\n  Attributes\n  associated directly with network:\n \n \n  <br />\n  <br /></span><span>\n \n \n  <span style='font-weight:bold;'>Field\n  Type\n  Description </span></span><br /><span></span></p><p><span> \n \n  <span style='font-weight:bold;'>Catarea\n<span style='font-style:italic;'>  </span></span><span style='font-style:italic;'>Real\n  </span>Watershed area in m2 <br /></span></p><p><span><span style='font-weight:bold;'>CUM_Area<span> </span>\n<span style='font-style:italic;'>  </span></span><span style='font-style:italic;'>Real\n  </span>Area upstream of a reach (and\n  including this reach area) in m2. <br /></span></p><p><span><span style='font-weight:bold;'>Nzsegment\n<span style='font-style:italic;'>  </span></span><span style='font-style:italic;'>Integer\n  </span>Reach identifier to be used with\n  REC2 (supercedes nzreach in REC1).\n \n \n  <br /></span></p><p><span><span style='font-weight:bold;'>Lengthdown\n<span style='font-style:italic;'>  </span></span><span style='font-style:italic;'>Real\n  </span>The distance to coast from any\n  reach to its outlet reach, where the river drains (m). <br /></span></p><p><span><span style='font-weight:bold;'>Headwater\n<span style='font-style:italic;'>  </span></span><span style='font-style:italic;'>Integer\n  </span>Number (0) denoting whether a\n  stream is a “source” (headwater) stream. Non-zero for non-headwater streams. <br /></span></p><p><span> \n \n  <span style='font-weight:bold;'>Hydseq\n<span style='font-style:italic;'>  </span></span><span style='font-style:italic;'>Integer\n  </span>A unique number denoting the\n  hydrological processing order of a river segment relative to others in the\n  network.</span></p><p><span>\n \n \n  <span style='font-weight:bold;'>StreamOrder\n<span style='font-style:italic;'>  </span></span><span style='font-style:italic;'>Integer\n  </span>A number describing the Strahler\n  order a reach in a network of reaches. <br /></span></p><p><span> \n \n  <span style='font-weight:bold;'>euclid_dist\n<span style='font-style:italic;'>  </span></span><span style='font-style:italic;'>Real\n  </span>The straight line distance of a\n  reach from the reach “inlet” to its “outlet”. <br /></span></p><p><span><span style='font-weight:bold;'>upElev\n<span style='font-style:italic;'>  </span></span><span style='font-style:italic;'>Real\n  </span>Height (asl) of the upstream end\n  of a reach section in a watershed (m). <br /></span></p><p><span><span style='font-weight:bold;'>downElev\n<span style='font-style:italic;'>  </span></span><span style='font-style:italic;'>Real\n  </span>Height (asl) of the downstream\n  end of a reach section in a watershed (m). <br /></span></p><p><span> \n \n  <span style='font-weight:bold;'>upcoordX\n<span style='font-style:italic;'>  </span></span><span style='font-style:italic;'>Real\n  </span>Easting of the upstream end of a\n  river segment in m (NZTM2000). <br /></span></p><p><span><span style='font-weight:bold;'>upcoordY\n<span style='font-style:italic;'>  </span></span><span style='font-style:italic;'>Real\n  </span>Northing of the upstream end of\n  a river segment in m (NZTM2000). <br /></span></p><p><span><span style='font-weight:bold;'>downcoordX\n<span style='font-style:italic;'>  </span></span><span style='font-style:italic;'>Real\n  </span>Easting of the downstream end of\n  a river segment in m (NZTM2000). <br /></span></p><p><span> \n \n  <span style='font-weight:bold;'>downcoordY\n<span style='font-style:italic;'>  </span></span><span style='font-style:italic;'>Real\n  </span>Northing of the downstream end\n  of a river segment in m (NZTM2000). <br /></span></p><p><span><span style='font-weight:bold;'>sinuosity\n<span style='font-style:italic;'>  </span></span><span style='font-style:italic;'>Real\n  </span>Actual distance divided by the\n  straight line distance giving the degree of curvature of the stream <br /></span></p><p><span><span style='font-weight:bold;'>nzreach_re\n<span style='font-style:italic;'>  </span></span><span style='font-style:italic;'>Integer\n  </span>The REC1 identifiying number for\n  <font>the corresponding\\closest reach </font><font>from\n  REC1 (can be used to retrieve the REC management classes)</font> <br /></span></p><p><span><span style='font-weight:bold;'>headw_dist\n<span style='font-style:italic;'>  </span></span><span style='font-style:italic;'>Integer\n  </span>Distance of the furthermost\n  “source” or headwater reach from any reach (m). <br /></span></p><p><span><span style='font-weight:bold;'>Shape_leng\n<span style='font-style:italic;'>  </span></span><span style='font-style:italic;'>Real\n  </span>The length of the reach (vector)\n  as calculated by ArcGIS.</span></p><p><br /><span>\n  <span style='font-weight:bold;'>Segslpmean</span>\n  <span style='font-style:italic;'>Real</span>\n  Mean segment slope along length\n  of reach.\n   \n</span></p><p><span><span style='font-weight:bold;'>LID\n<span style='font-style:italic;'>  </span></span><span style='font-style:italic;'>Integer\n  </span>Lake Identifier number(LID) of\n  overlapping lake.\n \n \n   \n   \n    <br /></span></p><p><span><span style='font-weight:bold;'>Reachtype\n<span style='font-style:italic;'>  </span></span><span style='font-style:italic;'>Integer\n  </span>A value of 2 is assigned if the\n  segment is an outlet to the lake, otherwise 0 or null. <br /></span></p><p><span><span style='font-weight:bold;'>nextdownid\n<span style='font-style:italic;'>  </span></span><span style='font-style:italic;'>integer\n  </span>segment number of the most\n  downstream reach\n \n</span></p></div></div>_________________________________________________________________________________________________________________<br /><br /><font size='3'><b>Item Page Created:</b> 2019-06-13 00:29  <br /><b>Item Page Last Modified:</b> 2025-04-05 16:27<br />Owner: NIWA_OpenData</font><br /><br /><b><font size='5'>River Lines</font></b><br /><b>No data edit dates available</b><br /><b>Fields:</b> OBJECTID_1,HydroID,NextDownID,CATAREA,CUM_AREA,nzsegment,Enabled,LENGTHDOWN,Headwater,Hydseq,StreamOrde,euclid_dis,upElev,downElev,upcoordX,downcoordX,downcoordY,upcoordY,sinuosity,nzreach_re,headw_dist,segslpmean,LID,reachtype,FROM_NODE,TO_NODE,Shape_Leng,FLOWDIR<br /><br /><b><font size='5'>Watersheds</font></b><br /><b>No data edit dates available</b><br /><b>Fields:</b> OBJECTID_1,HydroID,nzsegment,nzreach_rec1,Area<br />",
			"keyword": [
				"REC",
				"REC2",
				"NIWA",
				"hydro",
				"model",
				"river",
				"watershed",
				"environment",
				"classification",
				"NZ",
				"New Zealand",
				"River",
				"freshwater",
				"autometadata",
				"CC_Land_and_Water",
				"Proj_OPENDATA"
			],
			"issued": "2019-06-13T00:29:53.000Z",
			"modified": "2026-10-13T02:31:00.000Z",
			"publisher": {
				"name": "NIWA"
			},
			"contactPoint": {
				"@type": "vcard:Contact",
				"fn": "NIWA_OpenData",
				"hasEmail": "mailto:enquiries@niwa.co.nz"
			},
			"accessLevel": "public",
			"spatial": "166.2634,-47.2188,178.3141,-34.2808",
			"license": "https://creativecommons.org/licenses/by-nc/4.0",
			"distribution": [
				{
					"@type": "dcat:Distribution",
					"title": "ArcGIS Hub Dataset",
					"format": "Web Page",
					"mediaType": "text/html",
					"accessURL": "https://www.pacificgeoportal.com/maps/NIWA::river-environment-classification-rec2-new-zealand"
				},
				{
					"@type": "dcat:Distribution",
					"title": "ArcGIS GeoService",
					"format": "ArcGIS GeoServices REST API",
					"mediaType": "application/json",
					"accessURL": "https://services3.arcgis.com/fp1tibNcN9mbExhG/arcgis/rest/services/REC2_Layers/FeatureServer"
				}
			],
			"theme": [
				"geospatial"
			]
		},
		{
			"@type": "dcat:Dataset",
			"identifier": "https://www.arcgis.com/home/item.html?id=3a4b6cc2c1c74fbb8ddbe25df28e410c&sublayer=0",
			"landingPage": "https://www.pacificgeoportal.com/datasets/NIWA::river-lines",
			"title": "River Lines",
			"description": "<div><span style='font-weight:bold;'>REC2 (River Environment Classification, v2.<span>5</span><span>) - June 2019 [Hosted Feature Layer]<br /></span></span></div><div><span style='font-weight:bold;'>This service depicts rivers as lines and catchments as polygons</span><br /><span style='font-weight:bold;'><span></span></span></div><div><span style='font-weight:bold;'><span></span></span></div><div style='text-align:Left; font-size:12pt;'><div><p><span>    The River Environment Classification (REC) is a database of catchment spatial attributes, summarised for every segment in New Zealand's network of rivers. The attributes were compiled for the purposes of river classification, while the river network description has been used to underpin models.    Typically, models (e.g. CLUES and TopNet) would use the dendritic (branched) linkages of REC river segments to perform their calculations. Since its release and use over the last decade, some errors in the location and connectivity of these linkages have been identified. The current revision corrects those errors, and updates a number of spatial attributes with the latest data.    REC2 provides a re-cut framework of rivers for modelling and classification.</span></p><p><span> It is built on a newer version of the 30m digital elevation model, in which the original 20m contours were supplemented with, for example, more spot elevation data and a better coastline contour. Boundary errors were minimised by processing contiguous areas (such as the whole of the North Island) together, which wasn't possible when it was originally created.</span></p><p><span>Major updates include the revision of catchment land use information, by overlaying with the land cover database (LCDB3, current as at 2008), and the update of river and rainfall statistics with data from 1960-2006.    The river network and associated attributes have been assembled within an ArcGIS geodatabase. Topological connectivity has been established to allow upstream and downstream tracing within the network. <br /></span></p><p><span>REC2 can be downloaded or streamed and used directly in ArcMap.</span><a href='https://niwa.maps.arcgis.com/home/item.html?id=5a07a0b45d504e4db4f79753663430b6' target='_blank' rel='nofollow ugc noopener noreferrer'><span style='color:rgb(76, 76, 76);'> (</span>A file geodatabase version for ArcGIS of REC2 can be downloaded as a \nzip file and used directly for analyses in ArcMap from here</a>)</p><p><span></span></p><p>This layer is using Esri's ArcGIS Online Optimizations for fast rendering.<br /></p><p><br /><span><span style='font-weight:bold;'>This is REC2 (Version 5) , June 2019</span> - a publicly available dataset from NIWA Taihoro Nukurangi.</span></p><p><span>NIWA acknowledges funding from the MBIE SSIF towards the preparation of REC v2.</span><span>5</span></p><p><span><span style='font-weight:bold;'>Coordinate Reference System: NZTM (New Zealand Transverse Mercator, EPSG: 2193)</span><br /></span></p><p>Geometric Representation of Rivers: Lines</p><p><span style='font-weight:bold;'>Extent (Bounding Box): </span><br /><span>\n \n \n \n  <span style='font-style:italic;'>Top(Latitude)</span>\n  -33.9534<span style='font-style:italic;'>Bottom(Latitude)</span>\n  -47.4867\n \n \n  <span style='font-style:italic;'>Left (Longitude)</span>\n  166.2634\n \n \n  <span style='font-style:italic;'>Right (Longitude)</span>\n  178.9733\n \n</span></p><p><span><br /></span></p><p><span>\n \n \n \n \n  <span style='text-decoration:underline;'>Riverlines table</span>\n  Attributes\n  associated directly with network:\n \n \n  <br />\n  <br /></span><span>\n \n \n  <span style='font-weight:bold;'>Field\n  Type\n  Description </span></span><br /><span></span></p><p><span> \n \n  <span style='font-weight:bold;'>Catarea\n<span style='font-style:italic;'>  </span></span><span style='font-style:italic;'>Real\n  </span>Watershed area in m2 <br /></span></p><p><span><span style='font-weight:bold;'>CUM_Area<span> </span>\n<span style='font-style:italic;'>  </span></span><span style='font-style:italic;'>Real\n  </span>Area upstream of a reach (and\n  including this reach area) in m2. <br /></span></p><p><span><span style='font-weight:bold;'>Nzsegment\n<span style='font-style:italic;'>  </span></span><span style='font-style:italic;'>Integer\n  </span>Reach identifier to be used with\n  REC2 (supercedes nzreach in REC1).\n \n \n  <br /></span></p><p><span><span style='font-weight:bold;'>Lengthdown\n<span style='font-style:italic;'>  </span></span><span style='font-style:italic;'>Real\n  </span>The distance to coast from any\n  reach to its outlet reach, where the river drains (m). <br /></span></p><p><span><span style='font-weight:bold;'>Headwater\n<span style='font-style:italic;'>  </span></span><span style='font-style:italic;'>Integer\n  </span>Number (0) denoting whether a\n  stream is a “source” (headwater) stream. Non-zero for non-headwater streams. <br /></span></p><p><span> \n \n  <span style='font-weight:bold;'>Hydseq\n<span style='font-style:italic;'>  </span></span><span style='font-style:italic;'>Integer\n  </span>A unique number denoting the\n  hydrological processing order of a river segment relative to others in the\n  network.</span></p><p><span>\n \n \n  <span style='font-weight:bold;'>StreamOrder\n<span style='font-style:italic;'>  </span></span><span style='font-style:italic;'>Integer\n  </span>A number describing the Strahler\n  order a reach in a network of reaches. <br /></span></p><p><span> \n \n  <span style='font-weight:bold;'>euclid_dist\n<span style='font-style:italic;'>  </span></span><span style='font-style:italic;'>Real\n  </span>The straight line distance of a\n  reach from the reach “inlet” to its “outlet”. <br /></span></p><p><span><span style='font-weight:bold;'>upElev\n<span style='font-style:italic;'>  </span></span><span style='font-style:italic;'>Real\n  </span>Height (asl) of the upstream end\n  of a reach section in a watershed (m). <br /></span></p><p><span><span style='font-weight:bold;'>downElev\n<span style='font-style:italic;'>  </span></span><span style='font-style:italic;'>Real\n  </span>Height (asl) of the downstream\n  end of a reach section in a watershed (m). <br /></span></p><p><span> \n \n  <span style='font-weight:bold;'>upcoordX\n<span style='font-style:italic;'>  </span></span><span style='font-style:italic;'>Real\n  </span>Easting of the upstream end of a\n  river segment in m (NZTM2000). <br /></span></p><p><span><span style='font-weight:bold;'>upcoordY\n<span style='font-style:italic;'>  </span></span><span style='font-style:italic;'>Real\n  </span>Northing of the upstream end of\n  a river segment in m (NZTM2000). <br /></span></p><p><span><span style='font-weight:bold;'>downcoordX\n<span style='font-style:italic;'>  </span></span><span style='font-style:italic;'>Real\n  </span>Easting of the downstream end of\n  a river segment in m (NZTM2000). <br /></span></p><p><span> \n \n  <span style='font-weight:bold;'>downcoordY\n<span style='font-style:italic;'>  </span></span><span style='font-style:italic;'>Real\n  </span>Northing of the downstream end\n  of a river segment in m (NZTM2000). <br /></span></p><p><span><span style='font-weight:bold;'>sinuosity\n<span style='font-style:italic;'>  </span></span><span style='font-style:italic;'>Real\n  </span>Actual distance divided by the\n  straight line distance giving the degree of curvature of the stream <br /></span></p><p><span><span style='font-weight:bold;'>nzreach_re\n<span style='font-style:italic;'>  </span></span><span style='font-style:italic;'>Integer\n  </span>The REC1 identifiying number for\n  <font>the corresponding\\closest reach </font><font>from\n  REC1 (can be used to retrieve the REC management classes)</font> <br /></span></p><p><span><span style='font-weight:bold;'>headw_dist\n<span style='font-style:italic;'>  </span></span><span style='font-style:italic;'>Integer\n  </span>Distance of the furthermost\n  “source” or headwater reach from any reach (m). <br /></span></p><p><span><span style='font-weight:bold;'>Shape_leng\n<span style='font-style:italic;'>  </span></span><span style='font-style:italic;'>Real\n  </span>The length of the reach (vector)\n  as calculated by ArcGIS.</span></p><p><br /><span>\n  <span style='font-weight:bold;'>Segslpmean</span>\n  <span style='font-style:italic;'>Real</span>\n  Mean segment slope along length\n  of reach.\n   \n</span></p><p><span><span style='font-weight:bold;'>LID\n<span style='font-style:italic;'>  </span></span><span style='font-style:italic;'>Integer\n  </span>Lake Identifier number(LID) of\n  overlapping lake.\n \n \n   \n   \n    <br /></span></p><p><span><span style='font-weight:bold;'>Reachtype\n<span style='font-style:italic;'>  </span></span><span style='font-style:italic;'>Integer\n  </span>A value of 2 is assigned if the\n  segment is an outlet to the lake, otherwise 0 or null. <br /></span></p><p><span><span style='font-weight:bold;'>nextdownid\n<span style='font-style:italic;'>  </span></span><span style='font-style:italic;'>integer\n  </span>segment number of the most\n  downstream reach\n \n</span></p></div></div>_________________________________________________________________________________________________________________<br /><br /><font size='3'><b>Item Page Created:</b> 2019-06-13 00:29  <br /><b>Item Page Last Modified:</b> 2025-04-05 16:27<br />Owner: NIWA_OpenData</font><br /><br /><b><font size='5'>River Lines</font></b><br /><b>No data edit dates available</b><br /><b>Fields:</b> OBJECTID_1,HydroID,NextDownID,CATAREA,CUM_AREA,nzsegment,Enabled,LENGTHDOWN,Headwater,Hydseq,StreamOrde,euclid_dis,upElev,downElev,upcoordX,downcoordX,downcoordY,upcoordY,sinuosity,nzreach_re,headw_dist,segslpmean,LID,reachtype,FROM_NODE,TO_NODE,Shape_Leng,FLOWDIR<br /><br /><b><font size='5'>Watersheds</font></b><br /><b>No data edit dates available</b><br /><b>Fields:</b> OBJECTID_1,HydroID,nzsegment,nzreach_rec1,Area<br />",
			"keyword": [
				"REC",
				"REC2",
				"NIWA",
				"hydro",
				"model",
				"river",
				"watershed",
				"environment",
				"classification",
				"NZ",
				"New Zealand",
				"River",
				"freshwater",
				"autometadata",
				"CC_Land_and_Water",
				"Proj_OPENDATA"
			],
			"issued": "2019-06-13T00:29:53.000Z",
			"modified": "2022-11-02T06:25:02.728Z",
			"publisher": {
				"name": "NIWA"
			},
			"contactPoint": {
				"@type": "vcard:Contact",
				"fn": "NIWA_OpenData",
				"hasEmail": "mailto:enquiries@niwa.co.nz"
			},
			"accessLevel": "public",
			"spatial": "166.2638,-47.2168,178.3115,-34.2856",
			"license": "https://creativecommons.org/licenses/by-nc/4.0",
			"distribution": [
				{
					"@type": "dcat:Distribution",
					"title": "ArcGIS Hub Dataset",
					"format": "Web Page",
					"mediaType": "text/html",
					"accessURL": "https://www.pacificgeoportal.com/datasets/NIWA::river-lines"
				},
				{
					"@type": "dcat:Distribution",
					"title": "ArcGIS GeoService",
					"format": "ArcGIS GeoServices REST API",
					"mediaType": "application/json",
					"accessURL": "https://services3.arcgis.com/fp1tibNcN9mbExhG/arcgis/rest/services/REC2_Layers/FeatureServer/0"
				},
				{
					"@type": "dcat:Distribution",
					"title": "CSV",
					"format": "CSV",
					"mediaType": "text/csv",
					"accessURL": "https://www.pacificgeoportal.com/api/download/v1/items/3a4b6cc2c1c74fbb8ddbe25df28e410c/csv?layers=0"
				},
				{
					"@type": "dcat:Distribution",
					"title": "Shapefile",
					"format": "ZIP",
					"mediaType": "application/zip",
					"accessURL": "https://www.pacificgeoportal.com/api/download/v1/items/3a4b6cc2c1c74fbb8ddbe25df28e410c/shapefile?layers=0"
				},
				{
					"@type": "dcat:Distribution",
					"title": "GeoJSON",
					"format": "GeoJSON",
					"mediaType": "application/vnd.geo+json",
					"accessURL": "https://www.pacificgeoportal.com/api/download/v1/items/3a4b6cc2c1c74fbb8ddbe25df28e410c/geojson?layers=0"
				},
				{
					"@type": "dcat:Distribution",
					"title": "KML",
					"format": "KML",
					"mediaType": "application/vnd.google-earth.kml+xml",
					"accessURL": "https://www.pacificgeoportal.com/api/download/v1/items/3a4b6cc2c1c74fbb8ddbe25df28e410c/kml?layers=0"
				},
				{
					"@type": "dcat:Distribution",
					"title": "File Geodatabase",
					"format": "ZIP",
					"mediaType": "application/zip",
					"accessURL": "https://www.pacificgeoportal.com/api/download/v1/items/3a4b6cc2c1c74fbb8ddbe25df28e410c/filegdb?layers=0"
				},
				{
					"@type": "dcat:Distribution",
					"title": "Feature Collection",
					"format": "TXT",
					"mediaType": "text/plain",
					"accessURL": "https://www.pacificgeoportal.com/api/download/v1/items/3a4b6cc2c1c74fbb8ddbe25df28e410c/featureCollection?layers=0"
				},
				{
					"@type": "dcat:Distribution",
					"title": "Excel",
					"format": "XLSX",
					"mediaType": "application/vnd.ms-excel",
					"accessURL": "https://www.pacificgeoportal.com/api/download/v1/items/3a4b6cc2c1c74fbb8ddbe25df28e410c/excel?layers=0"
				},
				{
					"@type": "dcat:Distribution",
					"title": "GeoPackage",
					"format": "GPKG",
					"mediaType": "application/geopackage+sqlite3",
					"accessURL": "https://www.pacificgeoportal.com/api/download/v1/items/3a4b6cc2c1c74fbb8ddbe25df28e410c/geoPackage?layers=0"
				},
				{
					"@type": "dcat:Distribution",
					"title": "SQLite Geodatabase",
					"format": "GDB",
					"mediaType": "application/geopackage+sqlite3",
					"accessURL": "https://www.pacificgeoportal.com/api/download/v1/items/3a4b6cc2c1c74fbb8ddbe25df28e410c/sqlite?layers=0"
				}
			],
			"theme": [
				"geospatial"
			]
		},
		{
			"@type": "dcat:Dataset",
			"identifier": "https://www.arcgis.com/home/item.html?id=ec4d1d1fe03a4e62997a7a9397cf644d",
			"landingPage": "https://www.pacificgeoportal.com/datasets/esri::land-cover-2050-regional",
			"title": "Land Cover 2050 - Regional",
			"description": "Use this regional model layer when performing analysis within a single continent. This layer displays a single global land cover map that is modeled by region for the year 2050 at a pixel resolution of 300m. ESA CCI land cover from the years 2010 and 2018 were used to create <span style='font-family:&quot;Avenir Next W01&quot;, &quot;Avenir Next W00&quot;, &quot;Avenir Next&quot;, Avenir, &quot;Helvetica Neue&quot;, sans-serif; font-size:16px;'>this prediction.</span><div><br /></div><div><b>Variable mapped:</b> Projected land cover in 2050.</div><div><b>Data Projection:</b> Cylindrical Equal Area</div><div><b>Mosaic Projection</b>: Cylindrical Equal Area</div><div><b>Extent:</b> Global </div><div><b>Cell Size: 300m</b></div><div><b>Source Type:</b> Thematic</div><div><b>Visible Scale:</b> 1:50,000 and smaller</div><div><b>Source: </b>Clark University</div><div><b>Publication date: </b>April 2021</div><div><br /></div><div><b>What you can do with this layer?</b></div><div><br /></div><div>This layer may be added to online maps and compared with the ESA CCI Land Cover from any year from 1992 to 2018. To do this, add Global Land Cover 1992-2018 to your map and choose the processing template (image display) from that layer called “Simplified Renderer.” </div><div><br /></div><div>This layer can also be used in analysis in ecological planning to find specific areas that may need to be set aside before they are converted to human use.</div><div><br /></div><div><b>Links to the six Clark University land cover 2050 layers in ArcGIS Living Atlas of the World:</b></div><div>There are three scales (country, regional, and world) for the land cover and vulnerability models. They’re all slightly different since the country model can be more fine-tuned to the drivers in that particular area. Regional (continental) and global have more spatially consistent model weights. Which should you use? If you’re analyzing one country or want to make accurate comparisons between countries, use the country level. If mapping larger patterns, use the global or regional extent (depending on your area of interest). </div><div><br /></div><div><div style='font-family:&quot;Avenir Next W01&quot;, &quot;Avenir Next W00&quot;, &quot;Avenir Next&quot;, Avenir, &quot;Helvetica Neue&quot;, sans-serif; font-size:16px;'><a href='https://arcgis.com/home/item.html?id=cee96e0ada6541d0bd3d67f3f8b5ce63' rel='nofollow ugc' style='color:rgb(0, 121, 193); text-decoration-line:none; font-family:inherit;' target='_blank'>Land Cover 2050  - Global</a><br /></div><div style='font-family:&quot;Avenir Next W01&quot;, &quot;Avenir Next W00&quot;, &quot;Avenir Next&quot;, Avenir, &quot;Helvetica Neue&quot;, sans-serif; font-size:16px;'><a href='https://arcgis.com/home/item.html?id=ec4d1d1fe03a4e62997a7a9397cf644d' rel='nofollow ugc' style='color:rgb(0, 121, 193); text-decoration-line:none; font-family:inherit;' target='_blank'>Land Cover 2050 - Regional</a><br /></div><div style='font-family:&quot;Avenir Next W01&quot;, &quot;Avenir Next W00&quot;, &quot;Avenir Next&quot;, Avenir, &quot;Helvetica Neue&quot;, sans-serif; font-size:16px;'><a href='https://arcgis.com/home/item.html?id=afeaa714dd8b4553bc92898002abf145' rel='nofollow ugc' style='color:rgb(0, 121, 193); text-decoration-line:none; font-family:inherit;' target='_blank'>Land Cover 2050 - Country</a><br /></div><div style='font-family:&quot;Avenir Next W01&quot;, &quot;Avenir Next W00&quot;, &quot;Avenir Next&quot;, Avenir, &quot;Helvetica Neue&quot;, sans-serif; font-size:16px;'><a href='https://arcgis.com/home/item.html?id=4040cafb922440f59d3ce52326402875' rel='nofollow ugc' style='color:rgb(0, 121, 193); text-decoration-line:none; font-family:inherit;' target='_blank'>Land Cover Vulnerability to Change 2050 Global</a><br /></div><div style='font-family:&quot;Avenir Next W01&quot;, &quot;Avenir Next W00&quot;, &quot;Avenir Next&quot;, Avenir, &quot;Helvetica Neue&quot;, sans-serif; font-size:16px;'><a href='https://arcgis.com/home/item.html?id=4f870e3f114f4ebc80477b9fcc4369bb' rel='nofollow ugc' style='color:rgb(0, 121, 193); text-decoration-line:none; font-family:inherit;' target='_blank'>Land Cover Vulnerability to Change 2050 Regional</a><br /></div><div style='font-family:&quot;Avenir Next W01&quot;, &quot;Avenir Next W00&quot;, &quot;Avenir Next&quot;, Avenir, &quot;Helvetica Neue&quot;, sans-serif; font-size:16px;'><a href='https://arcgis.com/home/item.html?id=20bfd812017e4bc1a241d2581c156bcd' rel='nofollow ugc' style='color:rgb(0, 121, 193); text-decoration-line:none; font-family:inherit;' target='_blank'>Land Cover Vulnerability to Change 2050 Country</a></div></div><div><br /></div><div><b>What these layers model (and what they don’t model)</b></div><div><br /></div><div>The model focuses on human-based land cover changes and projects the extent of these changes to the year 2050. It seeks to find where agricultural and urban land cover will cover the planet in that year, and what areas are most vulnerable to change due to the expansion of the human footprint. It does not predict changes to other land cover types such as forests or other natural vegetation during that time period unless it is replaced by agriculture or urban land cover. It also doesn’t predict sea level rise unless the model detected a pattern in changes in bodies of water between 2010 and 2018. A few 300m pixels might have changed due to sea level rise during that timeframe, but not many.</div><div><br /></div><div>The model predicts land cover changes based upon patterns it found in the period 2010-2018. But it cannot predict future land use. This is partly because current land use is not necessarily a model input. In this model, land set aside as a result of political decisions, for example military bases or nature reserves, may be found to be filled in with urban or agricultural areas in 2050. This is because the model is blind to the political decisions that affect land use.</div><div><br /></div><div><b>Quantitative Variables used to create Models</b></div><div><ul><li>Biomass</li><li>Crop Suitability</li><li>Distance to Airports</li><li>Distance to Cropland 2010</li><li>Distance to Primary Roads</li><li>Distance to Railroads</li><li>Distance to Secondary Roads</li><li>Distance to Settled Areas</li><li>Distance to Urban 2010</li><li>Elevation</li><li>GDP</li><li>Human Influence Index</li><li>Population Density</li><li>Precipitation</li><li>Regions </li><li>Slope</li><li>Temperature</li></ul></div><div><br /></div><div><b>Qualitative Variables used to create Models</b></div><div><ul><li>Biomes</li><li>Ecoregions</li><li>Irrigated Crops</li><li>Protected Areas</li><li>Provinces</li><li>Rainfed Crops</li><li>Soil Classification</li><li>Soil Depth</li><li>Soil Drainage</li><li>Soil pH</li><li>Soil Texture</li></ul></div><div><b>Were small countries modeled?</b></div><div><br /></div><div>Clark University modeled some small countries that had a few transitions. Only five countries were modeled with this procedure: Bhutan, North Macedonia, Palau, Singapore and Vanuatu.</div><div><br /></div><div>As a rule of thumb, the MLP neural network in the Land Change Modeler requires at least 100 pixels of change for model calibration. Several countries experienced less than 100 pixels of change between 2010 &amp; 2018 and therefore required an alternate modeling methodology. These countries are Bhutan, North Macedonia, Palau, Singapore and Vanuatu. To overcome the lack of samples, these select countries were resampled from 300 meters to 150 meters, effectively multiplying the number of pixels by four. As a result, we were able to empirically model countries which originally had as few as 25 pixels of change.</div><div><br /></div><div>Once a selected country was resampled to 150 meter resolution, three transition potential images were calibrated and averaged to produce one final transition potential image per transition. Clark Labs chose to create averaged transition potential images to limit artifacts of model overfitting. Though each model contained at least 100 samples of &quot;change&quot;, this is still relatively little for a neural network-based model and could lead to anomalous outcomes. The averaged transition potentials were used to extrapolate change and produce a final hard prediction and risk map of natural land cover conversion to Cropland and Artificial Surfaces in 2050.</div><div><br /></div><div><b>39 Small Countries Not Modeled</b></div><div><br /></div><div>There were 39 countries that were not modeled because the transitions, if any, from natural to anthropogenic were very small. In this case the land cover for 2050 for these countries are the same as the 2018 maps and their vulnerability was given a value of 0. Here were the countries not modeled:</div><div><ul><li>Andorra</li><li>Antigua and Barbuda</li><li>Barbados</li><li>Cape Verde</li><li>Comoros</li><li>Cook Islands</li><li>Djibouti</li><li>Dominica</li><li>Faroe Islands</li><li>French Guyana</li><li>French Polynesia</li><li>Gibraltar</li><li>Grenada</li><li>Guam</li><li>Guyana</li><li>Iceland</li><li>Jan Mayen</li><li>Kiribati</li><li>Liechtenstein</li><li>Luxembourg</li><li>Maldives</li><li>Malta</li><li>Marshall Islands</li><li>Micronesia, Federated States of</li><li>Moldova</li><li>Monaco</li><li>Nauru</li><li>Saint Kitts and Nevis</li><li>Saint Lucia</li><li>Saint Vincent and the Grenadines</li><li>Samoa</li><li>San Marino</li><li>Seychelles</li><li>Suriname</li><li>Svalbard</li><li>The Bahamas</li><li>Tonga</li><li>Tuvalu</li><li>Vatican City</li></ul></div><div><br /></div><div><b>Index to land cover values in this dataset:</b></div><div><br /></div><div>The Clark University Land Cover 2050 projections display a ten-class land cover generalized from ESA Climate Change Initiative Land Cover. </div><div><br /></div><div>1    Mostly Cropland</div><div>2    Grassland, Scrub, or Shrub</div><div>3    Mostly Deciduous Forest</div><div>4    Mostly Needleleaf/Evergreen Forest</div><div>5    Sparse Vegetation</div><div>6    Bare Area</div><div>7    Swampy or Often Flooded Vegetation</div><div>8    Artificial Surface or Urban Area</div><div>9    Surface Water</div><div>10    Permanent Snow and Ice</div>",
			"keyword": [
				"2050",
				"esri_environment",
				"env1",
				"environment",
				"Land Cover",
				"landcover",
				"conservation",
				"development",
				"ESA",
				"European Space Agency"
			],
			"issued": "2021-07-09T16:04:57.000Z",
			"modified": "2025-08-25T23:47:32.000Z",
			"publisher": {
				"name": "Esri"
			},
			"contactPoint": {
				"@type": "vcard:Contact",
				"fn": "esri_environment",
				"hasEmail": "{{orgContactEmail}}"
			},
			"accessLevel": "public",
			"spatial": "-180.0000,-58.0779,180.0000,83.8299",
			"license": "https://creativecommons.org/licenses/by/4.0",
			"distribution": [
				{
					"@type": "dcat:Distribution",
					"title": "ArcGIS Hub Dataset",
					"format": "Web Page",
					"mediaType": "text/html",
					"accessURL": "https://www.pacificgeoportal.com/datasets/esri::land-cover-2050-regional"
				},
				{
					"@type": "dcat:Distribution",
					"title": "ArcGIS GeoService",
					"format": "ArcGIS GeoServices REST API",
					"mediaType": "application/json",
					"accessURL": "https://env1.arcgis.com/arcgis/rest/services/Land_Cover_Projection_2050/ImageServer"
				}
			],
			"theme": [
				"geospatial"
			]
		},
		{
			"@type": "dcat:Dataset",
			"identifier": "https://www.arcgis.com/home/item.html?id=afeaa714dd8b4553bc92898002abf145",
			"landingPage": "https://www.pacificgeoportal.com/datasets/esri::land-cover-2050-country",
			"title": "Land Cover 2050 - Country",
			"description": "<div>Use this country model layer when performing analysis within a single country. This layer displays a single global land cover map that is modeled by country for the year 2050 at a pixel resolution of 300m. ESA CCI land cover from the years 2010 and 2018 were used to create <span style='font-family:&quot;Avenir Next W01&quot;, &quot;Avenir Next W00&quot;, &quot;Avenir Next&quot;, Avenir, &quot;Helvetica Neue&quot;, sans-serif; font-size:16px;'>this prediction.</span></div><div><br /></div><div><b>Variable mapped:</b> Projected land cover in 2050.</div><div><b>Data Projection:</b> Cylindrical Equal Area</div><div><b>Mosaic Projection</b>: Cylindrical Equal Area</div><div><b>Extent:</b> Global </div><div><b>Cell Size: 300m</b></div><div><b>Source Type:</b> Thematic</div><div><b>Visible Scale:</b> 1:50,000 and smaller</div><div><b>Source: </b>Clark University</div><div><b>Publication date: </b>April 2021</div><div><br /></div><div><b>What you can do with this layer?</b></div><div><br /></div><div>This layer may be added to online maps and compared with the ESA CCI Land Cover from any year from 1992 to 2018. To do this, add Global Land Cover 1992-2018 to your map and choose the processing template (image display) from that layer called “Simplified Renderer.” </div><div><br /></div><div>This layer can also be used in analysis in ecological planning to find specific areas that may need to be set aside before they are converted to human use.</div><div><br /></div><div><b>Links to the six Clark University land cover 2050 layers in ArcGIS Living Atlas of the World:</b></div><div>There are three scales (country, regional, and world) for the land cover and vulnerability models. They’re all slightly different since the country model can be more fine-tuned to the drivers in that particular area. Regional (continental) and global have more spatially consistent model weights. Which should you use? If you’re analyzing one country or want to make accurate comparisons between countries, use the country level. If mapping larger patterns, use the global or regional extent (depending on your area of interest). </div><div><br /></div><div><div style='font-family:&quot;Avenir Next W01&quot;, &quot;Avenir Next W00&quot;, &quot;Avenir Next&quot;, Avenir, &quot;Helvetica Neue&quot;, sans-serif; font-size:16px;'><a href='https://arcgis.com/home/item.html?id=cee96e0ada6541d0bd3d67f3f8b5ce63' rel='nofollow ugc' style='color:rgb(0, 121, 193); text-decoration-line:none; font-family:inherit;' target='_blank'>Land Cover 2050  - Global</a><br /></div><div style='font-family:&quot;Avenir Next W01&quot;, &quot;Avenir Next W00&quot;, &quot;Avenir Next&quot;, Avenir, &quot;Helvetica Neue&quot;, sans-serif; font-size:16px;'><a href='https://arcgis.com/home/item.html?id=ec4d1d1fe03a4e62997a7a9397cf644d' rel='nofollow ugc' style='color:rgb(0, 121, 193); text-decoration-line:none; font-family:inherit;' target='_blank'>Land Cover 2050 - Regional</a><br /></div><div style='font-family:&quot;Avenir Next W01&quot;, &quot;Avenir Next W00&quot;, &quot;Avenir Next&quot;, Avenir, &quot;Helvetica Neue&quot;, sans-serif; font-size:16px;'><a href='https://arcgis.com/home/item.html?id=afeaa714dd8b4553bc92898002abf145' rel='nofollow ugc' style='color:rgb(0, 121, 193); text-decoration-line:none; font-family:inherit;' target='_blank'>Land Cover 2050 - Country</a><br /></div><div style='font-family:&quot;Avenir Next W01&quot;, &quot;Avenir Next W00&quot;, &quot;Avenir Next&quot;, Avenir, &quot;Helvetica Neue&quot;, sans-serif; font-size:16px;'><a href='https://arcgis.com/home/item.html?id=4040cafb922440f59d3ce52326402875' rel='nofollow ugc' style='color:rgb(0, 121, 193); text-decoration-line:none; font-family:inherit;' target='_blank'>Land Cover Vulnerability to Change 2050 Global</a><br /></div><div style='font-family:&quot;Avenir Next W01&quot;, &quot;Avenir Next W00&quot;, &quot;Avenir Next&quot;, Avenir, &quot;Helvetica Neue&quot;, sans-serif; font-size:16px;'><a href='https://arcgis.com/home/item.html?id=4f870e3f114f4ebc80477b9fcc4369bb' rel='nofollow ugc' style='color:rgb(0, 121, 193); text-decoration-line:none; font-family:inherit;' target='_blank'>Land Cover Vulnerability to Change 2050 Regional</a><br /></div><div style='font-family:&quot;Avenir Next W01&quot;, &quot;Avenir Next W00&quot;, &quot;Avenir Next&quot;, Avenir, &quot;Helvetica Neue&quot;, sans-serif; font-size:16px;'><a href='https://arcgis.com/home/item.html?id=20bfd812017e4bc1a241d2581c156bcd' rel='nofollow ugc' style='color:rgb(0, 121, 193); text-decoration-line:none; font-family:inherit;' target='_blank'>Land Cover Vulnerability to Change 2050 Country</a></div></div><div><br /></div><div><b>What these layers model (and what they don’t model)</b></div><div><br /></div><div>The model focuses on human-based land cover changes and projects the extent of these changes to the year 2050. It seeks to find where agricultural and urban land cover will cover the planet in that year, and what areas are most vulnerable to change due to the expansion of the human footprint. It does not predict changes to other land cover types such as forests or other natural vegetation during that time period unless it is replaced by agriculture or urban land cover. It also doesn’t predict sea level rise unless the model detected a pattern in changes in bodies of water between 2010 and 2018. A few 300m pixels might have changed due to sea level rise during that timeframe, but not many.</div><div><br /></div><div>The model predicts land cover changes based upon patterns it found in the period 2010-2018. But it cannot predict future land use. This is partly because current land use is not necessarily a model input. In this model, land set aside as a result of political decisions, for example military bases or nature reserves, may be found to be filled in with urban or agricultural areas in 2050. This is because the model is blind to the political decisions that affect land use.</div><div><br /></div><div><b>Quantitative Variables used to create Models</b></div><div><ul><li>Biomass</li><li>Crop Suitability</li><li>Distance to Airports</li><li>Distance to Cropland 2010</li><li>Distance to Primary Roads</li><li>Distance to Railroads</li><li>Distance to Secondary Roads</li><li>Distance to Settled Areas</li><li>Distance to Urban 2010</li><li>Elevation</li><li>GDP</li><li>Human Influence Index</li><li>Population Density</li><li>Precipitation</li><li>Regions </li><li>Slope</li><li>Temperature</li></ul></div><div><br /></div><div><b>Qualitative Variables used to create Models</b></div><div><ul><li>Biomes</li><li>Ecoregions</li><li>Irrigated Crops</li><li>Protected Areas</li><li>Provinces</li><li>Rainfed Crops</li><li>Soil Classification</li><li>Soil Depth</li><li>Soil Drainage</li><li>Soil pH</li><li>Soil Texture</li></ul></div><div><b>Were small countries modeled?</b></div><div><br /></div><div>Clark University modeled some small countries that had a few transitions. Only five countries were modeled with this procedure: Bhutan, North Macedonia, Palau, Singapore and Vanuatu.</div><div><br /></div><div>As a rule of thumb, the MLP neural network in the Land Change Modeler requires at least 100 pixels of change for model calibration. Several countries experienced less than 100 pixels of change between 2010 &amp; 2018 and therefore required an alternate modeling methodology. These countries are Bhutan, North Macedonia, Palau, Singapore and Vanuatu. To overcome the lack of samples, these select countries were resampled from 300 meters to 150 meters, effectively multiplying the number of pixels by four. As a result, we were able to empirically model countries which originally had as few as 25 pixels of change.</div><div><br /></div><div>Once a selected country was resampled to 150 meter resolution, three transition potential images were calibrated and averaged to produce one final transition potential image per transition. Clark Labs chose to create averaged transition potential images to limit artifacts of model overfitting. Though each model contained at least 100 samples of &quot;change&quot;, this is still relatively little for a neural network-based model and could lead to anomalous outcomes. The averaged transition potentials were used to extrapolate change and produce a final hard prediction and risk map of natural land cover conversion to Cropland and Artificial Surfaces in 2050.</div><div><br /></div><div><b>39 Small Countries Not Modeled</b></div><div><br /></div><div>There were 39 countries that were not modeled because the transitions, if any, from natural to anthropogenic were very small. In this case the land cover for 2050 for these countries are the same as the 2018 maps and their vulnerability was given a value of 0. Here were the countries not modeled:</div><div><ul><li>Andorra</li><li>Antigua and Barbuda</li><li>Barbados</li><li>Cape Verde</li><li>Comoros</li><li>Cook Islands</li><li>Djibouti</li><li>Dominica</li><li>Faroe Islands</li><li>French Guyana</li><li>French Polynesia</li><li>Gibraltar</li><li>Grenada</li><li>Guam</li><li>Guyana</li><li>Iceland</li><li>Jan Mayen</li><li>Kiribati</li><li>Liechtenstein</li><li>Luxembourg</li><li>Maldives</li><li>Malta</li><li>Marshall Islands</li><li>Micronesia, Federated States of</li><li>Moldova</li><li>Monaco</li><li>Nauru</li><li>Saint Kitts and Nevis</li><li>Saint Lucia</li><li>Saint Vincent and the Grenadines</li><li>Samoa</li><li>San Marino</li><li>Seychelles</li><li>Suriname</li><li>Svalbard</li><li>The Bahamas</li><li>Tonga</li><li>Tuvalu</li><li>Vatican City</li></ul></div><div><br /></div><div><b>Index to land cover values in this dataset:</b></div><div><br /></div><div>The Clark University Land Cover 2050 projections display a ten-class land cover generalized from ESA Climate Change Initiative Land Cover. </div><div><br /></div><div>1    Mostly Cropland</div><div>2    Grassland, Scrub, or Shrub</div><div>3    Mostly Deciduous Forest</div><div>4    Mostly Needleleaf/Evergreen Forest</div><div>5    Sparse Vegetation</div><div>6    Bare Area</div><div>7    Swampy or Often Flooded Vegetation</div><div>8    Artificial Surface or Urban Area</div><div>9    Surface Water</div><div>10    Permanent Snow and Ice</div>",
			"keyword": [
				"2050",
				"env1",
				"esri_environment",
				"Land Cover",
				"landcover",
				"conservation",
				"development",
				"ESA",
				"European Space Agency"
			],
			"issued": "2021-07-09T16:03:08.000Z",
			"modified": "2025-08-25T23:43:30.000Z",
			"publisher": {
				"name": "Esri"
			},
			"contactPoint": {
				"@type": "vcard:Contact",
				"fn": "esri_environment",
				"hasEmail": "{{orgContactEmail}}"
			},
			"accessLevel": "public",
			"spatial": "-180.0000,-58.8137,180.0000,84.1250",
			"license": "https://creativecommons.org/licenses/by/4.0",
			"distribution": [
				{
					"@type": "dcat:Distribution",
					"title": "ArcGIS Hub Dataset",
					"format": "Web Page",
					"mediaType": "text/html",
					"accessURL": "https://www.pacificgeoportal.com/datasets/esri::land-cover-2050-country"
				},
				{
					"@type": "dcat:Distribution",
					"title": "ArcGIS GeoService",
					"format": "ArcGIS GeoServices REST API",
					"mediaType": "application/json",
					"accessURL": "https://env1.arcgis.com/arcgis/rest/services/Land_Cover_Projection_2050/ImageServer"
				}
			],
			"theme": [
				"geospatial"
			]
		},
		{
			"@type": "dcat:Dataset",
			"identifier": "https://www.arcgis.com/home/item.html?id=cee96e0ada6541d0bd3d67f3f8b5ce63",
			"landingPage": "https://www.pacificgeoportal.com/datasets/esri::land-cover-2050-global",
			"title": "Land Cover 2050 - Global",
			"description": "Use this global model layer when performing analysis across continents. This layer displays a global land cover map and model for the year 2050 at a pixel resolution of 300m. ESA CCI land cover from the years 2010 and 2018 were used to create this prediction.<div><br /></div><div><b>Variable mapped:</b> Projected land cover in 2050.</div><div><b>Data Projection:</b> Cylindrical Equal Area</div><div><b>Mosaic Projection</b>: Cylindrical Equal Area</div><div><b>Extent:</b> Global </div><div><b>Cell Size: 300m</b></div><div><b>Source Type:</b> Thematic</div><div><b>Visible Scale:</b> 1:50,000 and smaller</div><div><b>Source: </b>Clark University</div><div><b>Publication date: </b>April 2021</div><div><br /></div><div><b>What you can do with this layer?</b></div><div><br /></div><div>This layer may be added to online maps and compared with the ESA CCI Land Cover from any year from 1992 to 2018. To do this, add Global Land Cover 1992-2018 to your map and choose the processing template (image display) from that layer called “Simplified Renderer.” </div><div><br /></div><div>This layer can also be used in analysis in ecological planning to find specific areas that may need to be set aside before they are converted to human use.</div><div><br /></div><div><b>Links to the six Clark University land cover 2050 layers in ArcGIS Living Atlas of the World:</b></div><div>There are three scales (country, regional, and world) for the land cover and vulnerability models. They’re all slightly different since the country model can be more fine-tuned to the drivers in that particular area. Regional (continental) and global have more spatially consistent model weights. Which should you use? If you’re analyzing one country or want to make accurate comparisons between countries, use the country level. If mapping larger patterns, use the global or regional extent (depending on your area of interest). </div><div><br /></div><div><div style='font-family:&quot;Avenir Next W01&quot;, &quot;Avenir Next W00&quot;, &quot;Avenir Next&quot;, Avenir, &quot;Helvetica Neue&quot;, sans-serif; font-size:16px;'><a href='https://arcgis.com/home/item.html?id=cee96e0ada6541d0bd3d67f3f8b5ce63' rel='nofollow ugc' style='color:rgb(0, 121, 193); text-decoration-line:none; font-family:inherit;' target='_blank'>Land Cover 2050  - Global</a><br /></div><div style='font-family:&quot;Avenir Next W01&quot;, &quot;Avenir Next W00&quot;, &quot;Avenir Next&quot;, Avenir, &quot;Helvetica Neue&quot;, sans-serif; font-size:16px;'><a href='https://arcgis.com/home/item.html?id=ec4d1d1fe03a4e62997a7a9397cf644d' rel='nofollow ugc' style='color:rgb(0, 121, 193); text-decoration-line:none; font-family:inherit;' target='_blank'>Land Cover 2050 - Regional</a><br /></div><div style='font-family:&quot;Avenir Next W01&quot;, &quot;Avenir Next W00&quot;, &quot;Avenir Next&quot;, Avenir, &quot;Helvetica Neue&quot;, sans-serif; font-size:16px;'><a href='https://arcgis.com/home/item.html?id=afeaa714dd8b4553bc92898002abf145' rel='nofollow ugc' style='color:rgb(0, 121, 193); text-decoration-line:none; font-family:inherit;' target='_blank'>Land Cover 2050 - Country</a><br /></div><div style='font-family:&quot;Avenir Next W01&quot;, &quot;Avenir Next W00&quot;, &quot;Avenir Next&quot;, Avenir, &quot;Helvetica Neue&quot;, sans-serif; font-size:16px;'><a href='https://arcgis.com/home/item.html?id=4040cafb922440f59d3ce52326402875' rel='nofollow ugc' style='color:rgb(0, 121, 193); text-decoration-line:none; font-family:inherit;' target='_blank'>Land Cover Vulnerability to Change 2050 Global</a><br /></div><div style='font-family:&quot;Avenir Next W01&quot;, &quot;Avenir Next W00&quot;, &quot;Avenir Next&quot;, Avenir, &quot;Helvetica Neue&quot;, sans-serif; font-size:16px;'><a href='https://arcgis.com/home/item.html?id=4f870e3f114f4ebc80477b9fcc4369bb' rel='nofollow ugc' style='color:rgb(0, 121, 193); text-decoration-line:none; font-family:inherit;' target='_blank'>Land Cover Vulnerability to Change 2050 Regional</a><br /></div><div style='font-family:&quot;Avenir Next W01&quot;, &quot;Avenir Next W00&quot;, &quot;Avenir Next&quot;, Avenir, &quot;Helvetica Neue&quot;, sans-serif; font-size:16px;'><a href='https://arcgis.com/home/item.html?id=20bfd812017e4bc1a241d2581c156bcd' rel='nofollow ugc' style='color:rgb(0, 121, 193); text-decoration-line:none; font-family:inherit;' target='_blank'>Land Cover Vulnerability to Change 2050 Country</a></div></div><div><br /></div><div><b>What these layers model (and what they don’t model)</b></div><div><br /></div><div>The model focuses on human-based land cover changes and projects the extent of these changes to the year 2050. It seeks to find where agricultural and urban land cover will cover the planet in that year, and what areas are most vulnerable to change due to the expansion of the human footprint. It does not predict changes to other land cover types such as forests or other natural vegetation during that time period unless it is replaced by agriculture or urban land cover. It also doesn’t predict sea level rise unless the model detected a pattern in changes in bodies of water between 2010 and 2018. A few 300m pixels might have changed due to sea level rise during that timeframe, but not many.</div><div><br /></div><div>The model predicts land cover changes based upon patterns it found in the period 2010-2018. But it cannot predict future land use. This is partly because current land use is not necessarily a model input. In this model, land set aside as a result of political decisions, for example military bases or nature reserves, may be found to be filled in with urban or agricultural areas in 2050. This is because the model is blind to the political decisions that affect land use.</div><div><br /></div><div><b>Quantitative Variables used to create Models</b></div><div><ul><li>Biomass</li><li>Crop Suitability</li><li>Distance to Airports</li><li>Distance to Cropland 2010</li><li>Distance to Primary Roads</li><li>Distance to Railroads</li><li>Distance to Secondary Roads</li><li>Distance to Settled Areas</li><li>Distance to Urban 2010</li><li>Elevation</li><li>GDP</li><li>Human Influence Index</li><li>Population Density</li><li>Precipitation</li><li>Regions </li><li>Slope</li><li>Temperature</li></ul></div><div><br /></div><div><b>Qualitative Variables used to create Models</b></div><div><ul><li>Biomes</li><li>Ecoregions</li><li>Irrigated Crops</li><li>Protected Areas</li><li>Provinces</li><li>Rainfed Crops</li><li>Soil Classification</li><li>Soil Depth</li><li>Soil Drainage</li><li>Soil pH</li><li>Soil Texture</li></ul></div><div><b>Were small countries modeled?</b></div><div><br /></div><div>Clark University modeled some small countries that had a few transitions. Only five countries were modeled with this procedure: Bhutan, North Macedonia, Palau, Singapore and Vanuatu.</div><div><br /></div><div>As a rule of thumb, the MLP neural network in the Land Change Modeler requires at least 100 pixels of change for model calibration. Several countries experienced less than 100 pixels of change between 2010 &amp; 2018 and therefore required an alternate modeling methodology. These countries are Bhutan, North Macedonia, Palau, Singapore and Vanuatu. To overcome the lack of samples, these select countries were resampled from 300 meters to 150 meters, effectively multiplying the number of pixels by four. As a result, we were able to empirically model countries which originally had as few as 25 pixels of change.</div><div><br /></div><div>Once a selected country was resampled to 150 meter resolution, three transition potential images were calibrated and averaged to produce one final transition potential image per transition. Clark Labs chose to create averaged transition potential images to limit artifacts of model overfitting. Though each model contained at least 100 samples of &quot;change&quot;, this is still relatively little for a neural network-based model and could lead to anomalous outcomes. The averaged transition potentials were used to extrapolate change and produce a final hard prediction and risk map of natural land cover conversion to Cropland and Artificial Surfaces in 2050.</div><div><br /></div><div><b>39 Small Countries Not Modeled</b></div><div><br /></div><div>There were 39 countries that were not modeled because the transitions, if any, from natural to anthropogenic were very small. In this case the land cover for 2050 for these countries are the same as the 2018 maps and their vulnerability was given a value of 0. Here were the countries not modeled:</div><div><ul><li>Andorra</li><li>Antigua and Barbuda</li><li>Barbados</li><li>Cape Verde</li><li>Comoros</li><li>Cook Islands</li><li>Djibouti</li><li>Dominica</li><li>Faroe Islands</li><li>French Guyana</li><li>French Polynesia</li><li>Gibraltar</li><li>Grenada</li><li>Guam</li><li>Guyana</li><li>Iceland</li><li>Jan Mayen</li><li>Kiribati</li><li>Liechtenstein</li><li>Luxembourg</li><li>Maldives</li><li>Malta</li><li>Marshall Islands</li><li>Micronesia, Federated States of</li><li>Moldova</li><li>Monaco</li><li>Nauru</li><li>Saint Kitts and Nevis</li><li>Saint Lucia</li><li>Saint Vincent and the Grenadines</li><li>Samoa</li><li>San Marino</li><li>Seychelles</li><li>Suriname</li><li>Svalbard</li><li>The Bahamas</li><li>Tonga</li><li>Tuvalu</li><li>Vatican City</li></ul></div><div><br /></div><div><b>Index to land cover values in this dataset:</b></div><div><br /></div><div>The Clark University Land Cover 2050 projections display a ten-class land cover generalized from ESA Climate Change Initiative Land Cover. </div><div><br /></div><div>1    Mostly Cropland</div><div>2    Grassland, Scrub, or Shrub</div><div>3    Mostly Deciduous Forest</div><div>4    Mostly Needleleaf/Evergreen Forest</div><div>5    Sparse Vegetation</div><div>6    Bare Area</div><div>7    Swampy or Often Flooded Vegetation</div><div>8    Artificial Surface or Urban Area</div><div>9    Surface Water</div><div>10    Permanent Snow and Ice</div>",
			"keyword": [
				"2050",
				"env1",
				"esri_environment",
				"environment",
				"Land Cover",
				"landcover",
				"conservation",
				"development",
				"ESA",
				"European Space Agency"
			],
			"issued": "2021-07-09T16:05:59.000Z",
			"modified": "2025-07-02T18:12:06.000Z",
			"publisher": {
				"name": "Esri"
			},
			"contactPoint": {
				"@type": "vcard:Contact",
				"fn": "esri_environment",
				"hasEmail": "{{orgContactEmail}}"
			},
			"accessLevel": "public",
			"spatial": "-180.0000,-58.4477,180.0000,83.9793",
			"license": "https://creativecommons.org/licenses/by/4.0",
			"distribution": [
				{
					"@type": "dcat:Distribution",
					"title": "ArcGIS Hub Dataset",
					"format": "Web Page",
					"mediaType": "text/html",
					"accessURL": "https://www.pacificgeoportal.com/datasets/esri::land-cover-2050-global"
				},
				{
					"@type": "dcat:Distribution",
					"title": "ArcGIS GeoService",
					"format": "ArcGIS GeoServices REST API",
					"mediaType": "application/json",
					"accessURL": "https://env1.arcgis.com/arcgis/rest/services/Land_Cover_Projection_2050/ImageServer"
				}
			],
			"theme": [
				"geospatial"
			]
		},
		{
			"@type": "dcat:Dataset",
			"identifier": "https://www.arcgis.com/home/item.html?id=2a3dfb00c2c6425f85bd70da420d58eb",
			"landingPage": "https://www.pacificgeoportal.com/content/esri::global-canopy-height-2020",
			"title": "Global Canopy Height 2020",
			"description": "<div>Many maps provide details of land classification types such as grassland, scrub, or tree cover. However, the total amount of biomass in these areas can vary greatly. Better mapping of the canopy height is important for understanding potential biodiversity, ecosystem function, or loss of carbon biomass due to deforestation, development, or fires.  Scientists at ETH Zurich created a method to estimate canopy height using the best available LiDAR from space and airborne sensors, including the <a href='https://gedi.umd.edu/' target='_blank' rel='nofollow ugc noopener noreferrer'>Global Ecosystem Dynamics Investigation (GEDI)</a> on board the International Space Station. <br /></div><div><br /></div><div>These LiDAR observations were used as ground truth data to train a deep convolutional neural network to regress canopy height from Sentinel-​2 images at a 10-m spatial resolution. Units are in meters. The accuracy of the vegetation height is ± 5 m.<br /><br />This map was financed in a partnership with Barry Callebaut AG, the world's largest chocolate maker, to better allow companies to track deforestation in their supply chains. The intent is objective, highly automated tool to guide sustainable agribusiness. <br /></div><div><br /></div><div>More about this project may be read at ETH Zurich website <a href='https://prs.igp.ethz.ch/research/completed_projects/automated_large-scale_high_carbon_stock.html' target='_blank' rel='nofollow ugc noopener noreferrer'>here</a>.</div>",
			"keyword": [
				"Sentinel",
				"Forestry",
				"Height",
				"Vegetation",
				"Forest",
				"Canopy",
				"Deforestation",
				"global",
				"world",
				"carbon",
				"trees",
				"tree",
				"tree cover",
				"esri_environment",
				"environment"
			],
			"issued": "2022-06-09T20:32:42.000Z",
			"modified": "2025-06-19T14:39:50.000Z",
			"publisher": {
				"name": "Esri"
			},
			"contactPoint": {
				"@type": "vcard:Contact",
				"fn": "esri_environment",
				"hasEmail": "{{orgContactEmail}}"
			},
			"accessLevel": "public",
			"spatial": "-180.0000,-60.0000,180.0000,84.0000",
			"license": "https://creativecommons.org/licenses/by/4.0",
			"distribution": [
				{
					"@type": "dcat:Distribution",
					"title": "ArcGIS Hub Dataset",
					"format": "Web Page",
					"mediaType": "text/html",
					"accessURL": "https://www.pacificgeoportal.com/content/esri::global-canopy-height-2020"
				},
				{
					"@type": "dcat:Distribution",
					"title": "ArcGIS GeoService",
					"format": "ArcGIS GeoServices REST API",
					"mediaType": "application/json",
					"accessURL": "https://tiledimageservices.arcgis.com/P3ePLMYs2RVChkJx/arcgis/rest/services/10m_Tree_Canopy_Height/ImageServer"
				}
			],
			"theme": [
				"geospatial"
			]
		},
		{
			"@type": "dcat:Dataset",
			"identifier": "https://www.arcgis.com/home/item.html?id=ebf402a024db4738bb39f5aab33e8b53",
			"landingPage": "https://www.pacificgeoportal.com/pages/pacificcore::forum",
			"title": "forum",
			"description": "2026 Pacific Islands\nGeospatial Community Forum: Connecting the Pacific geospatial community for innovation and success",
			"keyword": [
				""
			],
			"issued": "2025-05-09T17:26:38.000Z",
			"modified": "2025-05-09T21:05:07.000Z",
			"publisher": {
				"name": "Pacific GeoPortal - Core Organization"
			},
			"contactPoint": {
				"@type": "vcard:Contact",
				"fn": "Pacific_Core_Admin",
				"hasEmail": "mailto:pacific_geoportal@esri.com"
			},
			"accessLevel": "public",
			"spatial": "",
			"license": "",
			"distribution": [
				{
					"@type": "dcat:Distribution",
					"title": "ArcGIS Hub Dataset",
					"format": "Web Page",
					"mediaType": "text/html",
					"accessURL": "https://www.pacificgeoportal.com/pages/pacificcore::forum"
				}
			],
			"theme": ""
		},
		{
			"@type": "dcat:Dataset",
			"identifier": "https://www.arcgis.com/home/item.html?id=369b7fb354874add9d394943ee67f0ff",
			"landingPage": "https://www.pacificgeoportal.com/content/pacificcore::pacific-geoportal-1",
			"title": "Pacific GeoPortal",
			"description": "We encourage you to join our community – where you can find data, solutions, share ideas and collaborate with us to help achieve our goals. We share one vision … a resilient, sustainable and more prosperous Pacific region. ",
			"keyword": [
				"Hub Site"
			],
			"issued": "2023-10-20T19:48:27.000Z",
			"modified": "2025-05-09T21:04:38.000Z",
			"publisher": {
				"name": "Pacific GeoPortal - Core Organization"
			},
			"contactPoint": {
				"@type": "vcard:Contact",
				"fn": "Pacific_Core_Admin",
				"hasEmail": "mailto:pacific_geoportal@esri.com"
			},
			"accessLevel": "public",
			"spatial": "93.4168,-56.8508,180.0000,17.1705",
			"license": "",
			"distribution": [
				{
					"@type": "dcat:Distribution",
					"title": "ArcGIS Hub Dataset",
					"format": "Web Page",
					"mediaType": "text/html",
					"accessURL": "https://www.pacificgeoportal.com/content/pacificcore::pacific-geoportal-1"
				},
				{
					"@type": "dcat:Distribution",
					"title": "ArcGIS GeoService",
					"format": "ArcGIS GeoServices REST API",
					"mediaType": "application/json",
					"accessURL": "https://geoportal-pacificcore.hub.arcgis.com"
				}
			],
			"theme": [
				"geospatial"
			]
		},
		{
			"@type": "dcat:Dataset",
			"identifier": "https://www.arcgis.com/home/item.html?id=9c707fa7131b4462a08b8bf2e06bf4ad",
			"landingPage": "https://www.pacificgeoportal.com/maps/9c707fa7131b4462a08b8bf2e06bf4ad",
			"title": "{{name}}",
			"description": "{{description}}",
			"keyword": [
				"esri_oceans",
				"esri_marine",
				"landscape",
				"oceans",
				"energy",
				"esri_landscape",
				"oceans1",
				"boundaries"
			],
			"issued": "2015-03-31T16:51:18.000Z",
			"modified": "{{modified:toISO}}",
			"publisher": {
				"name": "{{source}}"
			},
			"contactPoint": {
				"@type": "vcard:Contact",
				"fn": "esri_oceans",
				"hasEmail": "{{orgContactEmail}}"
			},
			"accessLevel": "public",
			"spatial": "",
			"license": "<img alt='' src='https://downloads.esri.com/blogs/arcgisonline/esrilogo_new.png' />This work is licensed under the Esri Master License Agreement. <br /><div><a href='https://goto.arcgis.com/termsofuse/viewsummary' target='_blank' rel='nofollow ugc noopener noreferrer'><b>View Summary</b></a> | <a href='https://goto.arcgis.com/termsofuse/viewtermsofuse' target='_blank' rel='nofollow ugc noopener noreferrer'><b>View Terms of Use</b></a> </div><div><span style='line-height: 16.05px;'><br /></span></div><div><font color='#b22222'>Important Note:</font> This item requires an ArcGIS Online organizational subscription or an ArcGIS Developer account and does not consume credits. To access this item, you'll need to do one of the following: </div><div><ul><li>Sign in with an account that is a member of an organizational subscription </li><li>Sign in with a developer account </li><li><a href='https://goto.arcgis.com/termsofuse/registeranapplication' target='_blank' rel='nofollow ugc noopener noreferrer'>Register an application</a> and use your application's credentials.</li></ul>If you don't have an account, you can sign up for a <a href='https://goto.arcgis.com/features/trial' target='_blank' rel='nofollow ugc noopener noreferrer'>free trial of ArcGIS</a> or a <a href='https://goto.arcgis.com/developers/signup' target='_blank' rel='nofollow ugc noopener noreferrer'>free ArcGIS Developer account</a>.</div>",
			"distribution": [
				{
					"@type": "dcat:Distribution",
					"title": "ArcGIS Hub Dataset",
					"format": "Web Page",
					"mediaType": "text/html",
					"accessURL": "https://www.pacificgeoportal.com/maps/9c707fa7131b4462a08b8bf2e06bf4ad"
				}
			],
			"theme": ""
		},
		{
			"@type": "dcat:Dataset",
			"identifier": "https://www.arcgis.com/home/item.html?id=4ca13f0e4e29403fa68c46d188c4be73",
			"landingPage": "https://www.pacificgeoportal.com/datasets/esri::landsat-8-9-views",
			"title": "Landsat 8-9 Views",
			"description": "<p>This layer includes Landsat 8 and 9 imagery for use in visualization and analysis. This layer is time enabled and includes a number of band combinations and indices rendered on demand. The imagery includes eight multispectral bands from the Operational Land Imager (OLI) and two bands from the Thermal Infrared Sensor (TIRS).  It is updated daily with new imagery directly sourced from the <a href='https://registry.opendata.aws/usgs-landsat/' target='_blank' rel='nofollow ugc noopener noreferrer'>USGS Landsat</a> collection on AWS.<br /></p><p>Geographic Coverage<br /></p><p style='text-align:justify;'></p><ul><li>Global Land Surface.</li><li>Polar regions are available in polar-projected Imagery Layers:  <a href='https://www.arcgis.com/home/item.html?id=6334dd0f09f04a3583a37233540d73c0' target='_blank' rel='nofollow ugc noopener noreferrer'>Landsat Arctic Views</a> and <a href='https://www.arcgis.com/home/item.html?id=c391d600102e48a6bbd82ffe28941bf5' target='_blank' rel='nofollow ugc noopener noreferrer'>Landsat Antarctic Views</a>.</li></ul><p></p><p>Temporal Coverage</p><p></p><ul><li>This layer is updated daily with new imagery.<br /></li><li><span style='text-indent:-0.25in;'>Working in tandem, Landsat 8 and 9 revisit each point on Earth's land surface every 8 days.</span></li><li>Most images collected from January 2015 to present are included.<br /></li><li>Approximately 5 images for each path/row from 2013 and 2014 are also included.</li></ul><p></p><p>Product Level</p><p></p><p></p><ul><li>The Landsat 8 and 9 imagery in this layer is comprised of Collection 2 Level-1 data.<br /></li><li>The imagery has Top of Atmosphere (TOA) correction applied.</li><li>TOA is applied using the radiometric rescaling coefficients provided the USGS.<br /></li><li>The <span style='text-indent:-0.25in;'>TOA </span><span style='text-indent:-0.25in;'>reflectance values (ranging 0 – 1 by default) are scaled using a range of 0 – 10,000.</span></li></ul><p>Image Selection/Filtering</p><ul><li>A number of fields are available for filtering, including Acquisition Date, Estimated Cloud Cover, and Product ID.</li><li>To isolate and work with specific images, either use the ‘Image Filter’ to create custom layers or add a ‘Query Filter’ to restrict the default layer display to a specified image or group of images.</li></ul><p>Visual Rendering</p><p></p><ul><li>The default rendering on this layer is Agriculture (bands 6,5,2) with Dynamic Range Adjustment (DRA).  Brighter green indicates more vigorous vegetation.<br /></li><li>The DRA version of each layer enables visualization of the full dynamic range of the images.<br /></li><li>Rendering (or display) of band combinations and calculated indices is done on-the-fly from the source images via Raster Functions.<br /></li><li>Various pre-defined Raster Functions can be selected or custom functions can be created.<br /></li><li>15 meter Landsat Imagery Layers are also available:  <a href='https://www.arcgis.com/home/item.html?id=4468be6eb4804de6bbdf65bd8826389a' target='_blank' rel='nofollow ugc noopener noreferrer'>Panchromatic</a> and <a href='https://www.arcgis.com/home/item.html?id=c34fd380d16f40a7bb7995ac4d7ab8de' target='_blank' rel='nofollow ugc noopener noreferrer'>Pansharpened</a>.<br /></li></ul><p></p><p>Multispectral Bands</p><table border='0' cellpadding='0' cellspacing='0' style='width:512.65pt; margin-left:13.3pt; border-collapse:collapse;' width='684'>\n <tbody><tr style='height:15.0pt;'>\n  <td style='width:33.65pt; border:solid windowtext 1.0pt; padding:0cm 5.4pt 0cm 5.4pt; height:15.0pt;' valign='bottom' width='45'>\n  <p style='margin-bottom:0cm; margin-bottom:.0001pt;'>Band</p>\n  </td>\n  <td style='width:187.0pt; border:solid windowtext 1.0pt; border-left:none; padding:0cm 5.4pt 0cm 5.4pt; height:15.0pt;' valign='bottom' width='249'>\n  <p style='margin-bottom:0cm; margin-bottom:.0001pt;'>Description</p>\n  </td>\n  <td style='width:129.0pt; border:solid windowtext 1.0pt; border-left:none; padding:0cm 5.4pt 0cm 5.4pt; height:15.0pt;' valign='bottom' width='172'>\n  <p style='margin-bottom:0cm; margin-bottom:.0001pt;'>Wavelength\n  (µm)</p>\n  </td>\n  <td style='width:163.0pt; border:solid windowtext 1.0pt; border-left:none; padding:0cm 5.4pt 0cm 5.4pt; height:15.0pt;' valign='bottom' width='217'>\n  <p style='margin-bottom:0cm; margin-bottom:.0001pt;'>Spatial\n  Resolution (m)</p>\n  </td>\n </tr>\n <tr style='height:15.0pt;'>\n  <td style='width:33.65pt; border:solid windowtext 1.0pt; border-top:none; padding:0cm 5.4pt 0cm 5.4pt; height:15.0pt;' valign='bottom' width='45'>\n  <p style='margin-bottom:0cm; margin-bottom:.0001pt; text-align:right;'>1</p>\n  </td>\n  <td style='width:187.0pt; border-top:none; border-left:none; border-bottom:solid windowtext 1.0pt; border-right:solid windowtext 1.0pt; padding:0cm 5.4pt 0cm 5.4pt; height:15.0pt;' valign='bottom' width='249'>\n  <p style='margin-bottom:0cm; margin-bottom:.0001pt;'>Coastal\n  aerosol</p>\n  </td>\n  <td style='width:129.0pt; border-top:none; border-left:none; border-bottom:solid windowtext 1.0pt; border-right:solid windowtext 1.0pt; padding:0cm 5.4pt 0cm 5.4pt; height:15.0pt;' valign='bottom' width='172'>\n  <p style='margin-bottom:0cm; margin-bottom:.0001pt;'>0.43 - 0.45</p>\n  </td>\n  <td style='width:163.0pt; border-top:none; border-left:none; border-bottom:solid windowtext 1.0pt; border-right:solid windowtext 1.0pt; padding:0cm 5.4pt 0cm 5.4pt; height:15.0pt;' valign='bottom' width='217'>\n  <p style='margin-bottom:0cm; margin-bottom:.0001pt; text-align:right;'>30</p>\n  </td>\n </tr>\n <tr style='height:15.0pt;'>\n  <td style='width:33.65pt; border:solid windowtext 1.0pt; border-top:none; padding:0cm 5.4pt 0cm 5.4pt; height:15.0pt;' valign='bottom' width='45'>\n  <p style='margin-bottom:0cm; margin-bottom:.0001pt; text-align:right;'>2</p>\n  </td>\n  <td style='width:187.0pt; border-top:none; border-left:none; border-bottom:solid windowtext 1.0pt; border-right:solid windowtext 1.0pt; padding:0cm 5.4pt 0cm 5.4pt; height:15.0pt;' valign='bottom' width='249'>\n  <p style='margin-bottom:0cm; margin-bottom:.0001pt;'>Blue</p>\n  </td>\n  <td style='width:129.0pt; border-top:none; border-left:none; border-bottom:solid windowtext 1.0pt; border-right:solid windowtext 1.0pt; padding:0cm 5.4pt 0cm 5.4pt; height:15.0pt;' valign='bottom' width='172'>\n  <p style='margin-bottom:0cm; margin-bottom:.0001pt;'>0.45 - 0.51</p>\n  </td>\n  <td style='width:163.0pt; border-top:none; border-left:none; border-bottom:solid windowtext 1.0pt; border-right:solid windowtext 1.0pt; padding:0cm 5.4pt 0cm 5.4pt; height:15.0pt;' valign='bottom' width='217'>\n  <p style='margin-bottom:0cm; margin-bottom:.0001pt; text-align:right;'>30</p>\n  </td>\n </tr>\n <tr style='height:15.0pt;'>\n  <td style='width:33.65pt; border:solid windowtext 1.0pt; border-top:none; padding:0cm 5.4pt 0cm 5.4pt; height:15.0pt;' valign='bottom' width='45'>\n  <p style='margin-bottom:0cm; margin-bottom:.0001pt; text-align:right;'>3</p>\n  </td>\n  <td style='width:187.0pt; border-top:none; border-left:none; border-bottom:solid windowtext 1.0pt; border-right:solid windowtext 1.0pt; padding:0cm 5.4pt 0cm 5.4pt; height:15.0pt;' valign='bottom' width='249'>\n  <p style='margin-bottom:0cm; margin-bottom:.0001pt;'>Green</p>\n  </td>\n  <td style='width:129.0pt; border-top:none; border-left:none; border-bottom:solid windowtext 1.0pt; border-right:solid windowtext 1.0pt; padding:0cm 5.4pt 0cm 5.4pt; height:15.0pt;' valign='bottom' width='172'>\n  <p style='margin-bottom:0cm; margin-bottom:.0001pt;'>0.53 - 0.59</p>\n  </td>\n  <td style='width:163.0pt; border-top:none; border-left:none; border-bottom:solid windowtext 1.0pt; border-right:solid windowtext 1.0pt; padding:0cm 5.4pt 0cm 5.4pt; height:15.0pt;' valign='bottom' width='217'>\n  <p style='margin-bottom:0cm; margin-bottom:.0001pt; text-align:right;'>30</p>\n  </td>\n </tr>\n <tr style='height:15.0pt;'>\n  <td style='width:33.65pt; border:solid windowtext 1.0pt; border-top:none; padding:0cm 5.4pt 0cm 5.4pt; height:15.0pt;' valign='bottom' width='45'>\n  <p style='margin-bottom:0cm; margin-bottom:.0001pt; text-align:right;'>4</p>\n  </td>\n  <td style='width:187.0pt; border-top:none; border-left:none; border-bottom:solid windowtext 1.0pt; border-right:solid windowtext 1.0pt; padding:0cm 5.4pt 0cm 5.4pt; height:15.0pt;' valign='bottom' width='249'>\n  <p style='margin-bottom:0cm; margin-bottom:.0001pt;'>Red</p>\n  </td>\n  <td style='width:129.0pt; border-top:none; border-left:none; border-bottom:solid windowtext 1.0pt; border-right:solid windowtext 1.0pt; padding:0cm 5.4pt 0cm 5.4pt; height:15.0pt;' valign='bottom' width='172'>\n  <p style='margin-bottom:0cm; margin-bottom:.0001pt;'>0.64 - 0.67</p>\n  </td>\n  <td style='width:163.0pt; border-top:none; border-left:none; border-bottom:solid windowtext 1.0pt; border-right:solid windowtext 1.0pt; padding:0cm 5.4pt 0cm 5.4pt; height:15.0pt;' valign='bottom' width='217'>\n  <p style='margin-bottom:0cm; margin-bottom:.0001pt; text-align:right;'>30</p>\n  </td>\n </tr>\n <tr style='height:15.0pt;'>\n  <td style='width:33.65pt; border:solid windowtext 1.0pt; border-top:none; padding:0cm 5.4pt 0cm 5.4pt; height:15.0pt;' valign='bottom' width='45'>\n  <p style='margin-bottom:0cm; margin-bottom:.0001pt; text-align:right;'>5</p>\n  </td>\n  <td style='width:187.0pt; border-top:none; border-left:none; border-bottom:solid windowtext 1.0pt; border-right:solid windowtext 1.0pt; padding:0cm 5.4pt 0cm 5.4pt; height:15.0pt;' valign='bottom' width='249'>\n  <p style='margin-bottom:0cm; margin-bottom:.0001pt;'>Near Infrared\n  (NIR)</p>\n  </td>\n  <td style='width:129.0pt; border-top:none; border-left:none; border-bottom:solid windowtext 1.0pt; border-right:solid windowtext 1.0pt; padding:0cm 5.4pt 0cm 5.4pt; height:15.0pt;' valign='bottom' width='172'>\n  <p style='margin-bottom:0cm; margin-bottom:.0001pt;'>0.85 - 0.88</p>\n  </td>\n  <td style='width:163.0pt; border-top:none; border-left:none; border-bottom:solid windowtext 1.0pt; border-right:solid windowtext 1.0pt; padding:0cm 5.4pt 0cm 5.4pt; height:15.0pt;' valign='bottom' width='217'>\n  <p style='margin-bottom:0cm; margin-bottom:.0001pt; text-align:right;'>30</p>\n  </td>\n </tr>\n <tr style='height:15.0pt;'>\n  <td style='width:33.65pt; border:solid windowtext 1.0pt; border-top:none; padding:0cm 5.4pt 0cm 5.4pt; height:15.0pt;' valign='bottom' width='45'>\n  <p style='margin-bottom:0cm; margin-bottom:.0001pt; text-align:right;'>6</p>\n  </td>\n  <td style='width:187.0pt; border-top:none; border-left:none; border-bottom:solid windowtext 1.0pt; border-right:solid windowtext 1.0pt; padding:0cm 5.4pt 0cm 5.4pt; height:15.0pt;' valign='bottom' width='249'>\n  <p style='margin-bottom:0cm; margin-bottom:.0001pt;'>SWIR 1</p>\n  </td>\n  <td style='width:129.0pt; border-top:none; border-left:none; border-bottom:solid windowtext 1.0pt; border-right:solid windowtext 1.0pt; padding:0cm 5.4pt 0cm 5.4pt; height:15.0pt;' valign='bottom' width='172'>\n  <p style='margin-bottom:0cm; margin-bottom:.0001pt;'>1.57 - 1.65</p>\n  </td>\n  <td style='width:163.0pt; border-top:none; border-left:none; border-bottom:solid windowtext 1.0pt; border-right:solid windowtext 1.0pt; padding:0cm 5.4pt 0cm 5.4pt; height:15.0pt;' valign='bottom' width='217'>\n  <p style='margin-bottom:0cm; margin-bottom:.0001pt; text-align:right;'>30</p>\n  </td>\n </tr>\n <tr style='height:15.0pt;'>\n  <td style='width:33.65pt; border:solid windowtext 1.0pt; border-top:none; padding:0cm 5.4pt 0cm 5.4pt; height:15.0pt;' valign='bottom' width='45'>\n  <p style='margin-bottom:0cm; margin-bottom:.0001pt; text-align:right;'>7</p>\n  </td>\n  <td style='width:187.0pt; border-top:none; border-left:none; border-bottom:solid windowtext 1.0pt; border-right:solid windowtext 1.0pt; padding:0cm 5.4pt 0cm 5.4pt; height:15.0pt;' valign='bottom' width='249'>\n  <p style='margin-bottom:0cm; margin-bottom:.0001pt;'>SWIR 2</p>\n  </td>\n  <td style='width:129.0pt; border-top:none; border-left:none; border-bottom:solid windowtext 1.0pt; border-right:solid windowtext 1.0pt; padding:0cm 5.4pt 0cm 5.4pt; height:15.0pt;' valign='bottom' width='172'>\n  <p style='margin-bottom:0cm; margin-bottom:.0001pt;'>2.11 - 2.29</p>\n  </td>\n  <td style='width:163.0pt; border-top:none; border-left:none; border-bottom:solid windowtext 1.0pt; border-right:solid windowtext 1.0pt; padding:0cm 5.4pt 0cm 5.4pt; height:15.0pt;' valign='bottom' width='217'>\n  <p style='margin-bottom:0cm; margin-bottom:.0001pt; text-align:right;'>30</p>\n  </td>\n </tr>\n <tr style='height:15.0pt;'>\n  <td style='width:33.65pt; border:solid windowtext 1.0pt; border-top:none; padding:0cm 5.4pt 0cm 5.4pt; height:15.0pt;' valign='bottom' width='45'>\n  <p style='margin-bottom:0cm; margin-bottom:.0001pt; text-align:right;'>8</p>\n  </td>\n  <td style='width:187.0pt; border-top:none; border-left:none; border-bottom:solid windowtext 1.0pt; border-right:solid windowtext 1.0pt; padding:0cm 5.4pt 0cm 5.4pt; height:15.0pt;' valign='bottom' width='249'>\n  <p style='margin-bottom:0cm; margin-bottom:.0001pt;'>Cirrus (in\n  OLI this is band 9)</p>\n  </td>\n  <td style='width:129.0pt; border-top:none; border-left:none; border-bottom:solid windowtext 1.0pt; border-right:solid windowtext 1.0pt; padding:0cm 5.4pt 0cm 5.4pt; height:15.0pt;' valign='bottom' width='172'>\n  <p style='margin-bottom:0cm; margin-bottom:.0001pt;'>1.36 - 1.38</p>\n  </td>\n  <td style='width:163.0pt; border-top:none; border-left:none; border-bottom:solid windowtext 1.0pt; border-right:solid windowtext 1.0pt; padding:0cm 5.4pt 0cm 5.4pt; height:15.0pt;' valign='bottom' width='217'>\n  <p style='margin-bottom:0cm; margin-bottom:.0001pt; text-align:right;'>30</p>\n  </td>\n </tr>\n <tr style='height:15.0pt;'>\n  <td style='width:33.65pt; border:solid windowtext 1.0pt; border-top:none; padding:0cm 5.4pt 0cm 5.4pt; height:15.0pt;' valign='bottom' width='45'>\n  <p style='margin-bottom:0cm; margin-bottom:.0001pt; text-align:right;'>9</p>\n  </td>\n  <td style='width:187.0pt; border-top:none; border-left:none; border-bottom:solid windowtext 1.0pt; border-right:solid windowtext 1.0pt; padding:0cm 5.4pt 0cm 5.4pt; height:15.0pt;' valign='bottom' width='249'>\n  <p style='margin-bottom:0cm; margin-bottom:.0001pt;'>QA Band\n  (available with Collection 1)*</p>\n  </td>\n  <td style='width:129.0pt; border-top:none; border-left:none; border-bottom:solid windowtext 1.0pt; border-right:solid windowtext 1.0pt; padding:0cm 5.4pt 0cm 5.4pt; height:15.0pt;' valign='bottom' width='172'>\n  <p style='margin-bottom:0cm; margin-bottom:.0001pt;'>NA</p>\n  </td>\n  <td style='width:163.0pt; border-top:none; border-left:none; border-bottom:solid windowtext 1.0pt; border-right:solid windowtext 1.0pt; padding:0cm 5.4pt 0cm 5.4pt; height:15.0pt;' valign='bottom' width='217'>\n  <p style='margin-bottom:0cm; margin-bottom:.0001pt; text-align:right;'>30</p>\n  </td>\n </tr>\n</tbody></table><p>*More about the <a href='https://www.usgs.gov/land-resources/nli/landsat/landsat-collection-1-level-1-quality-assessment-band?qt-science_support_page_related_con=0#qt-science_support_page_related_con' target='_blank' rel='nofollow ugc noopener noreferrer'>Quality Assessment Band</a></p><p style='margin:12pt 0in; background-image:initial; background-position:initial; background-size:initial; background-repeat:initial; background-attachment:initial; background-origin:initial; background-clip:initial;'>TIRS Bands</p><table border='0' cellpadding='0' cellspacing='0' style='width:512.65pt; margin-left:13.3pt; border-collapse:collapse;' width='684'>\n <tbody><tr style='height:15.0pt;'>\n  <td style='width:33.65pt; border:solid windowtext 1.0pt; padding:0cm 5.4pt 0cm 5.4pt; height:15.0pt;' valign='bottom' width='45'>\n  <p style='margin-bottom:0cm; margin-bottom:.0001pt;'>Band</p>\n  </td>\n  <td style='width:187.0pt; border:solid windowtext 1.0pt; border-left:none; padding:0cm 5.4pt 0cm 5.4pt; height:15.0pt;' valign='bottom' width='249'>\n  <p style='margin-bottom:0cm; margin-bottom:.0001pt;'>Description</p>\n  </td>\n  <td style='width:129.0pt; border:solid windowtext 1.0pt; border-left:none; padding:0cm 5.4pt 0cm 5.4pt; height:15.0pt;' valign='bottom' width='172'>\n  <p style='margin-bottom:0cm; margin-bottom:.0001pt;'>Wavelength\n  (µm)</p>\n  </td>\n  <td style='width:163.0pt; border:solid windowtext 1.0pt; border-left:none; padding:0cm 5.4pt 0cm 5.4pt; height:15.0pt;' valign='bottom' width='217'>\n  <p style='margin-bottom:0cm; margin-bottom:.0001pt;'>Spatial\n  Resolution (m)</p>\n  </td>\n </tr>\n <tr style='height:15.0pt;'>\n  <td style='width:33.65pt; border:solid windowtext 1.0pt; border-top:none; padding:0cm 5.4pt 0cm 5.4pt; height:15.0pt;' valign='bottom' width='45'>\n  <p style='margin-bottom:0cm; margin-bottom:.0001pt; text-align:right;'>10</p>\n  </td>\n  <td style='width:187.0pt; border-top:none; border-left:none; border-bottom:solid windowtext 1.0pt; border-right:solid windowtext 1.0pt; padding:0cm 5.4pt 0cm 5.4pt; height:15.0pt;' valign='bottom' width='249'>\n  <p style='margin-bottom:0cm; margin-bottom:.0001pt;'>TIRS1</p>\n  </td>\n  <td style='width:129.0pt; border-top:none; border-left:none; border-bottom:solid windowtext 1.0pt; border-right:solid windowtext 1.0pt; padding:0cm 5.4pt 0cm 5.4pt; height:15.0pt;' valign='bottom' width='172'>\n  <p style='margin-bottom:0cm; margin-bottom:.0001pt;'>10.60 - 11.19</p>\n  </td>\n  <td style='width:163.0pt; border-top:none; border-left:none; border-bottom:solid windowtext 1.0pt; border-right:solid windowtext 1.0pt; padding:0cm 5.4pt 0cm 5.4pt; height:15.0pt;' valign='bottom' width='217'>\n  <p style='margin-bottom:0cm; margin-bottom:.0001pt; text-align:right;'>100 * (30)<br /></p>\n  </td>\n </tr>\n <tr style='height:15.0pt;'>\n  <td style='width:33.65pt; border:solid windowtext 1.0pt; border-top:none; padding:0cm 5.4pt 0cm 5.4pt; height:15.0pt;' valign='bottom' width='45'>\n  <p style='margin-bottom:0cm; margin-bottom:.0001pt; text-align:right;'>11</p>\n  </td>\n  <td style='width:187.0pt; border-top:none; border-left:none; border-bottom:solid windowtext 1.0pt; border-right:solid windowtext 1.0pt; padding:0cm 5.4pt 0cm 5.4pt; height:15.0pt;' valign='bottom' width='249'>\n  <p style='margin-bottom:0cm; margin-bottom:.0001pt;'>TIRS2</p>\n  </td>\n  <td style='width:129.0pt; border-top:none; border-left:none; border-bottom:solid windowtext 1.0pt; border-right:solid windowtext 1.0pt; padding:0cm 5.4pt 0cm 5.4pt; height:15.0pt;' valign='bottom' width='172'>\n  <p style='margin-bottom:0cm; margin-bottom:.0001pt;'>11.50 - 12.51</p>\n  </td>\n  <td style='width:163.0pt; border-top:none; border-left:none; border-bottom:solid windowtext 1.0pt; border-right:solid windowtext 1.0pt; padding:0cm 5.4pt 0cm 5.4pt; height:15.0pt;' valign='bottom' width='217'>\n  <p style='margin-bottom:0cm; margin-bottom:.0001pt; text-align:right;'>100 * (30)<br /></p>\n  </td>\n </tr>\n</tbody></table><p style='margin:12pt 0in; background-image:initial; background-position:initial; background-size:initial; background-repeat:initial; background-attachment:initial; background-origin:initial; background-clip:initial;'>*TIRS bands are acquired at 100 meter resolution, but are resampled to 30 meter in delivered data product.<br /></p><p>Additional Usage Notes</p><ul><li>Image exports are limited to 4,000 columns x 4,000 rows per request.</li><li>This dynamic imagery layer can be used in Web Maps and ArcGIS Pro as well as web and mobile applications using the ArcGIS REST APIs.</li><li>WCS and WMS compatibility means this imagery layer can be consumed as WCS or WMS services.</li><li>The <a href='https://www.arcgis.com/home/item.html?id=5670f96c2d0d4ad8ac549e092d6c2bd4' target='_blank' rel='nofollow ugc noopener noreferrer'>Landsat Explorer App</a> is another way to access and explore the imagery.</li><li>This layer is part of a larger collection of <a href='https://www.arcgis.com/home/group.html?id=a74dff13f1be4b2ba7264c3315c57077#overview' target='_blank' rel='nofollow ugc noopener noreferrer'>Landsat Imagery Layers</a>.</li></ul><div><br /></div><p></p><p>Data Source</p><p>Landsat imagery is sourced from the U.S. Geological Survey (USGS) and the National Aeronautics and Space Administration (NASA). Data is hosted by the Amazon Web Services as part of their <a href='https://aws.amazon.com/public-data-sets/' target='_blank' rel='nofollow ugc noopener noreferrer'>Public Data Sets program</a>.</p><p>For information, see <a href='https://www.usgs.gov/landsat-missions/landsat-8' target='_blank' rel='nofollow ugc noopener noreferrer'>Landsat 8</a> and <a href='https://www.usgs.gov/landsat-missions/landsat-9' target='_blank' rel='nofollow ugc noopener noreferrer'>Landsat 9</a>.<br /></p>",
			"keyword": [
				"imagery",
				"multispectral",
				"temporal",
				"landsat 8",
				"landsat",
				"landsat on aws",
				"amazon",
				"MS",
				"landsat 9"
			],
			"issued": "2013-12-07T02:19:55.000Z",
			"modified": "2025-04-11T16:52:35.000Z",
			"publisher": {
				"name": "Esri"
			},
			"contactPoint": {
				"@type": "vcard:Contact",
				"fn": "esri_imagery",
				"hasEmail": "{{orgContactEmail}}"
			},
			"accessLevel": "public",
			"spatial": "-180.0000,-68.6273,180.0000,82.6557",
			"license": "<img src='https://downloads.esri.com/blogs/arcgisonline/esrilogo_new.png' /> This work is licensed under the Esri Master License Agreement.<br /><div><a href='https://goto.arcgis.com/termsofuse/viewsummary' rel='nofollow ugc' target='_blank'><b>View Summary</b></a> | <b><a href='https://goto.arcgis.com/termsofuse/viewtermsofuse' rel='nofollow ugc' target='_blank'>View Terms of Use</a></b></div><div><br /></div>",
			"distribution": [
				{
					"@type": "dcat:Distribution",
					"title": "ArcGIS Hub Dataset",
					"format": "Web Page",
					"mediaType": "text/html",
					"accessURL": "https://www.pacificgeoportal.com/datasets/esri::landsat-8-9-views"
				},
				{
					"@type": "dcat:Distribution",
					"title": "ArcGIS GeoService",
					"format": "ArcGIS GeoServices REST API",
					"mediaType": "application/json",
					"accessURL": "https://landsat2.arcgis.com/arcgis/rest/services/Landsat8_Views/ImageServer"
				}
			],
			"theme": [
				"geospatial"
			]
		},
		{
			"@type": "dcat:Dataset",
			"identifier": "https://www.arcgis.com/home/item.html?id=aa1c10c58c894467a1ade5a43ed70c19",
			"landingPage": "https://www.pacificgeoportal.com/content/esri::seafloor-crustal-age",
			"title": "Seafloor Crustal Age",
			"description": "<div>Scientists use the magnetic polarity of the sea floor to determine the age. Very little of the sea floor is older than 150 million years. This is because the oldest sea floor is subducted under other plates and replaces by new surfaces. The tectonic plates are constantly in motion and new crust is always being created. This continual motion is evidenced by the occurrence of earthquakes and volcanoes.<br /></div><div><br /></div><div><br /></div><div><br /></div><div><br /></div><img alt='Age of Oceanic Lithosphere' src='https://www.ngdc.noaa.gov/mgg/ocean_age/data/2008/image/age_oceanic_lith.jpg' /><div><br /></div><div>Data accessed from here: <a href='https://www.ngdc.noaa.gov/mgg/ocean_age/ocean_age_2008.html' target='_blank' rel='nofollow ugc noopener noreferrer'>https://www.ngdc.noaa.gov/mgg/ocean_age/ocean_age_2008.html</a></div>",
			"keyword": [
				"Seafloor",
				"Age",
				"Ocean",
				"esri_environment",
				"esri_oceans",
				"environment",
				"oceans",
				"hosted"
			],
			"issued": "2021-08-25T19:43:27.000Z",
			"modified": "2025-04-03T18:08:18.000Z",
			"publisher": {
				"name": "Esri"
			},
			"contactPoint": {
				"@type": "vcard:Contact",
				"fn": "esri_oceans",
				"hasEmail": "{{orgContactEmail}}"
			},
			"accessLevel": "public",
			"spatial": "-180.0000,-89.0026,-179.8996,89.0000",
			"license": "<img src='https://downloads.esri.com/blogs/arcgisonline/esrilogo_new.png' /> This work is licensed under the Esri Master License Agreement.<br /><div><a href='https://goto.arcgis.com/termsofuse/viewsummary' target='_blank' rel='nofollow ugc noopener noreferrer'><b>View Summary</b></a> | <a href='https://goto.arcgis.com/termsofuse/viewtermsofuse' target='_blank' rel='nofollow ugc noopener noreferrer'><b>View Terms of Use</b></a></div>",
			"distribution": [
				{
					"@type": "dcat:Distribution",
					"title": "ArcGIS Hub Dataset",
					"format": "Web Page",
					"mediaType": "text/html",
					"accessURL": "https://www.pacificgeoportal.com/content/esri::seafloor-crustal-age"
				},
				{
					"@type": "dcat:Distribution",
					"title": "ArcGIS GeoService",
					"format": "ArcGIS GeoServices REST API",
					"mediaType": "application/json",
					"accessURL": "https://tiledimageservices.arcgis.com/P3ePLMYs2RVChkJx/arcgis/rest/services/Seafloor_Age_02_WM/ImageServer"
				}
			],
			"theme": [
				"geospatial"
			]
		},
		{
			"@type": "dcat:Dataset",
			"identifier": "https://www.arcgis.com/home/item.html?id=5702f3dbd326484198db9413bed88173&sublayer=0",
			"landingPage": "https://www.pacificgeoportal.com/datasets/esri::seabed-lithology",
			"title": "Seabed Lithology",
			"description": "<div style='text-align:Left; font-size:12pt;'><p><span>Knowing the patterns of distribution of sediments in the global ocean is critical for understanding biogeochemical cycles and how deep-sea deposits respond to environmental change at the sea surface. We present the first digital map of seafloor lithologies based on descriptions of nearly 14,500 samples from original cruise reports, interpolated using a support vector machine algorithm. We show that sediment distribution is more complex, with significant deviations from earlier hand-drawn maps, and that major lithologies occur in drastically different proportions globally.</span></p><p><span>By coupling our digital map to oceanographic data sets, we find that the global occurrence of biogenic oozes is strongly linked to specific ranges in sea surface parameters. In particular, by using recent computations of diatom distributions from pigment-calibrated chlorophyll-a satellite data, we show that, contrary to a widely held view, diatom oozes are not a reliable proxy for surface productivity. Their global accumulation is instead strongly dependent on low surface temperature (0.9-5.7 °C) and salinity (33.8-34.0 PSS) and high concentrations of nutrients. Under these conditions, diatom oozes will accumulate on the seafloor regardless of surface productivity as long as there is limited competition from biogenous and detrital components, and diatom frustules are not significantly dissolved prior to preservation. </span></p><p><span>Quantifying the link between the seafloor and the sea surface through the use of large digital data sets will ultimately lead to more robust reconstructions and predictions of climate change and its impact on the ocean environment.</span></p><p><span></span></p><p><span>The digital data can be downloaded in netcdf format </span><a href='https://#ftp.earthbyte.org/papers/Dutkiewicz_etal_seafloor_lithology' target='_blank' rel='nofollow ugc noopener noreferrer'>here</a><span>.</span></p><p><span></span></p><p><span>Data accessed from here: </span><a href='https://portal.gplates.org/portal/seafloor/' style='text-decoration:underline;' rel='nofollow ugc'><span>https://portal.gplates.org/portal/seafloor/</span></a></p></div>",
			"keyword": [
				"Seabed",
				"Seafloor",
				"Ocean",
				"Lithology",
				"esri_environment",
				"esri_oceans",
				"oceans",
				"environment",
				"hosted"
			],
			"issued": "2021-09-21T20:48:29.000Z",
			"modified": "2022-01-18T00:07:33.141Z",
			"publisher": {
				"name": "Esri"
			},
			"contactPoint": {
				"@type": "vcard:Contact",
				"fn": "esri_oceans",
				"hasEmail": "{{orgContactEmail}}"
			},
			"accessLevel": "public",
			"spatial": "",
			"license": "<img src='https://downloads.esri.com/blogs/arcgisonline/esrilogo_new.png' /> This work is licensed under the Esri Master License Agreement.<br /><div><a href='https://goto.arcgis.com/termsofuse/viewsummary' target='_blank' rel='nofollow ugc noopener noreferrer'><b>View Summary</b></a> | <a href='https://goto.arcgis.com/termsofuse/viewtermsofuse' target='_blank' rel='nofollow ugc noopener noreferrer'><b>View Terms of Use</b></a></div>",
			"distribution": [
				{
					"@type": "dcat:Distribution",
					"title": "ArcGIS Hub Dataset",
					"format": "Web Page",
					"mediaType": "text/html",
					"accessURL": "https://www.pacificgeoportal.com/datasets/esri::seabed-lithology"
				},
				{
					"@type": "dcat:Distribution",
					"title": "ArcGIS GeoService",
					"format": "ArcGIS GeoServices REST API",
					"mediaType": "application/json",
					"accessURL": "https://services.arcgis.com/P3ePLMYs2RVChkJx/arcgis/rest/services/Seabed_Lithology/FeatureServer/0"
				},
				{
					"@type": "dcat:Distribution",
					"title": "CSV",
					"format": "CSV",
					"mediaType": "text/csv",
					"accessURL": "https://www.pacificgeoportal.com/api/download/v1/items/5702f3dbd326484198db9413bed88173/csv?layers=0"
				},
				{
					"@type": "dcat:Distribution",
					"title": "Shapefile",
					"format": "ZIP",
					"mediaType": "application/zip",
					"accessURL": "https://www.pacificgeoportal.com/api/download/v1/items/5702f3dbd326484198db9413bed88173/shapefile?layers=0"
				},
				{
					"@type": "dcat:Distribution",
					"title": "GeoJSON",
					"format": "GeoJSON",
					"mediaType": "application/vnd.geo+json",
					"accessURL": "https://www.pacificgeoportal.com/api/download/v1/items/5702f3dbd326484198db9413bed88173/geojson?layers=0"
				},
				{
					"@type": "dcat:Distribution",
					"title": "KML",
					"format": "KML",
					"mediaType": "application/vnd.google-earth.kml+xml",
					"accessURL": "https://www.pacificgeoportal.com/api/download/v1/items/5702f3dbd326484198db9413bed88173/kml?layers=0"
				}
			],
			"theme": ""
		},
		{
			"@type": "dcat:Dataset",
			"identifier": "https://www.arcgis.com/home/item.html?id=83f1dfd1a4f54a148ad4419df4277d76",
			"landingPage": "https://www.pacificgeoportal.com/maps/esri::world-boundaries-and-places-1",
			"title": "World Boundaries and Places",
			"description": "<span style='color: rgb(77, 77, 77); font-family: '>This map features boundaries and places for the World, including countries, 1st order administrative areas, and cities.  The map layers are delivered as features, which you can click on for attribute information or re-symbolize as you choose.</span>",
			"keyword": [
				"boundaries",
				"world",
				"countries",
				"administrative",
				"cities"
			],
			"issued": "2014-11-13T22:57:06.000Z",
			"modified": "2025-04-03T16:11:47.000Z",
			"publisher": {
				"name": "Esri"
			},
			"contactPoint": {
				"@type": "vcard:Contact",
				"fn": "esri_atlas",
				"hasEmail": "{{orgContactEmail}}"
			},
			"accessLevel": "public",
			"spatial": "-90.5111,-26.4880,104.8698,65.0454",
			"license": "<img src='https://downloads.esri.com/blogs/arcgisonline/esrilogo_new.png' /> This work is licensed under the Esri Master License Agreement.<br /><div><a href='https://goto.arcgis.com/termsofuse/viewsummary' rel='nofollow ugc' target='_blank'><b>View Summary</b></a> | <a href='https://goto.arcgis.com/termsofuse/viewtermsofuse' rel='nofollow ugc' target='_blank'><b>View Terms of Use</b></a></div>",
			"distribution": [
				{
					"@type": "dcat:Distribution",
					"title": "ArcGIS Hub Dataset",
					"format": "Web Page",
					"mediaType": "text/html",
					"accessURL": "https://www.pacificgeoportal.com/maps/esri::world-boundaries-and-places-1"
				}
			],
			"theme": [
				"geospatial"
			]
		},
		{
			"@type": "dcat:Dataset",
			"identifier": "https://www.arcgis.com/home/item.html?id=42d96649a5a5499580ababbbecd0a7c0",
			"landingPage": "https://www.pacificgeoportal.com/pages/pacificcore::content",
			"title": "Content",
			"description": "{{description}}",
			"keyword": [
				""
			],
			"issued": "2023-10-20T19:48:19.000Z",
			"modified": "2025-03-29T02:34:29.000Z",
			"publisher": {
				"name": "Pacific GeoPortal - Core Organization"
			},
			"contactPoint": {
				"@type": "vcard:Contact",
				"fn": "Pacific_Core_Admin",
				"hasEmail": "mailto:pacific_geoportal@esri.com"
			},
			"accessLevel": "public",
			"spatial": "-134.7473,23.5610,-55.6955,50.3092",
			"license": "",
			"distribution": [
				{
					"@type": "dcat:Distribution",
					"title": "ArcGIS Hub Dataset",
					"format": "Web Page",
					"mediaType": "text/html",
					"accessURL": "https://www.pacificgeoportal.com/pages/pacificcore::content"
				}
			],
			"theme": [
				"geospatial"
			]
		},
		{
			"@type": "dcat:Dataset",
			"identifier": "https://www.arcgis.com/home/item.html?id=6ee62a063ce74133af0c7476363ed03e&sublayer=0",
			"landingPage": "https://www.pacificgeoportal.com/datasets/eaglegis::nz-regional-councils-archive",
			"title": "NZ Regional Councils - Archive",
			"description": "<div><font size='3'>Topicality: 01-01-</font><font size='3' style='font-family:&quot;Avenir Next W01&quot;, &quot;Avenir Next W00&quot;, &quot;Avenir Next&quot;, Avenir, &quot;Helvetica Neue&quot;, Helvetica, Arial, sans-serif !important;'>2025</font></div><div><font size='3'>Projection: New Zealand Transverse Mercator (NZTM)</font></div><div><font size='3'><br /></font></div><div><div><font size='3'>This layer contains the archive of regional council boundaries as defined by regional councils and/or Local Government Commission, and maintained by Stats NZ (the custodian).</font><font size='3'><br /></font></div><div><font size='3'><br /></font></div><div><font size='3'>The regional council is the top tier of local government in New \nZealand. Regional councils are defined under schedule 2, part 1 of the \nLocal Government Act 2002. They were established in November 1989 after \nthe abolition of the 22 local government regions. Regional council \nboundaries must coincide with meshblock boundaries under schedule 3, \nclause 17 of the Local Government Act 2002.</font><font size='3'><br /></font></div><div><font size='3'><br /></font></div><div><font size='3'>Regional council boundaries are based largely on water catchments, \nsuch as rivers, lakes, and harbours. The seaward boundary of the regions\n is the 12 mile (19.3km) New Zealand territorial limit. In determining \nregions, consideration was also given to regional communities of \ninterest, natural resource management, land use planning, and \nenvironmental matters. </font></div><font face='Avenir Next W01, Avenir Next W00, Avenir Next, Avenir, Helvetica Neue, Helvetica, Arial, sans-serif' size='3'>This layer get updated yearly with the latest boundary data.<font style='font-family:&quot;Avenir Next W01&quot;, &quot;Avenir Next W00&quot;, &quot;Avenir Next&quot;, Avenir, &quot;Helvetica Neue&quot;, Helvetica, Arial, sans-serif;'>\n You can use this layer when you need any year of boundary data in your \nmap. By setting a filter on the dataset year you can filter on specific \nyear of the dataset.</font><div><font style='font-family:&quot;Avenir Next W01&quot;, &quot;Avenir Next W00&quot;, &quot;Avenir Next&quot;, Avenir, &quot;Helvetica Neue&quot;, Helvetica, Arial, sans-serif;'><br /></font></div><div>For information about the fields in this dataset go to the Data tab.</div><div><br /></div><div>The layer is further generalised by Eagle Technology for improved performance on the web, <span style='font-family:&quot;Avenir Next W01&quot;, &quot;Avenir Next W00&quot;, &quot;Avenir Next&quot;, Avenir, &quot;Helvetica Neue&quot;, sans-serif;'>therefore it doesn't fully represent the official boundaries.</span></div><div><font style='font-family:&quot;Avenir Next W01&quot;, &quot;Avenir Next W00&quot;, &quot;Avenir Next&quot;, Avenir, &quot;Helvetica Neue&quot;, Helvetica, Arial, sans-serif;'><br /></font></div><div><font style='font-family:&quot;Avenir Next W01&quot;, &quot;Avenir Next W00&quot;, &quot;Avenir Next&quot;, Avenir, &quot;Helvetica Neue&quot;, Helvetica, Arial, sans-serif;'>If\n you only need the latest boundary data in your map you can use the </font><a href='https://www.arcgis.com/home/item.html?id=7759fbaecd4649dea39c4ac2b07fc4ab' target='_blank' rel='nofollow ugc noopener noreferrer'>current version</a><font style='font-family:&quot;Avenir Next W01&quot;, &quot;Avenir Next W00&quot;, &quot;Avenir Next&quot;, Avenir, &quot;Helvetica Neue&quot;, Helvetica, Arial, sans-serif;'> of this dataset. All the current versions of Stats NZ \nBoundary layers can be found <a href='https://www.arcgis.com/home/group.html?id=b22e4f0012a8426dac21cd3d02f25c67' target='_blank' rel='nofollow ugc noopener noreferrer'>here</a>.</font></div><div><font style='font-family:&quot;Avenir Next W01&quot;, &quot;Avenir Next W00&quot;, &quot;Avenir Next&quot;, Avenir, &quot;Helvetica Neue&quot;, Helvetica, Arial, sans-serif;'><br /></font></div><div><font style='font-family:&quot;Avenir Next W01&quot;, &quot;Avenir Next W00&quot;, &quot;Avenir Next&quot;, Avenir, &quot;Helvetica Neue&quot;, Helvetica, Arial, sans-serif;'>The official dataset can be found on<font face='Avenir Next W01, Avenir Next W00, Avenir Next, Avenir, Helvetica Neue, Helvetica, Arial, sans-serif'> </font></font><a href='https://datafinder.stats.govt.nz/data/category/annual-boundaries/2022/' target='_blank' rel='nofollow ugc noopener noreferrer'>https://datafinder.stats.govt.nz.</a></div></font><div><font size='3'><br /></font></div><div><div style='font-family:&quot;Avenir Next W01&quot;, &quot;Avenir Next W00&quot;, &quot;Avenir Next&quot;, Avenir, &quot;Helvetica Neue&quot;, Helvetica, Arial, sans-serif;'><font color='#2f4f4f' size='3'>This layer is offered by Eagle Technology (Official Esri Distributor). Eagle Technology offers services that can be used in the ArcGIS platform. The Content team at Eagle Technology updates the layers on a regular basis and regularly adds new content to the Living Atlas. By using this content and combining it with other data you can create new information products quickly and easily.</font></div><div style='font-family:&quot;Avenir Next W01&quot;, &quot;Avenir Next W00&quot;, &quot;Avenir Next&quot;, Avenir, &quot;Helvetica Neue&quot;, Helvetica, Arial, sans-serif;'><font color='#2f4f4f' size='3'><br /></font></div><div style='font-family:&quot;Avenir Next W01&quot;, &quot;Avenir Next W00&quot;, &quot;Avenir Next&quot;, Avenir, &quot;Helvetica Neue&quot;, Helvetica, Arial, sans-serif;'><font color='#2f4f4f' size='3'>If you have any questions or comments about the content, please let us now  at </font><font size='3'><a href='mailto:livingatlas@eagle.co.nz' style='color:rgb(0, 121, 193); text-decoration-line:none;' target='_blank' rel='nofollow ugc noopener noreferrer'>livingatlas@eagle.co.nz</a></font></div></div></div>",
			"keyword": [
				"Boundary",
				"Boundaries",
				"New zealand",
				"Statistics New Zealand",
				"StatsNZ",
				"Eagle technology",
				"Nz",
				"Content",
				"Kiwi",
				"eaglegis"
			],
			"issued": "2023-01-18T00:44:25.000Z",
			"modified": "2025-12-19T00:26:04.662Z",
			"publisher": {
				"name": "Eagle Technology Group Ltd"
			},
			"contactPoint": {
				"@type": "vcard:Contact",
				"fn": "eaglegis",
				"hasEmail": "mailto:ts@eaglegis.co.nz"
			},
			"accessLevel": "public",
			"spatial": "166.2620,-47.2230,-177.6374,-33.6045",
			"license": "https://creativecommons.org/licenses/by/4.0",
			"distribution": [
				{
					"@type": "dcat:Distribution",
					"title": "ArcGIS Hub Dataset",
					"format": "Web Page",
					"mediaType": "text/html",
					"accessURL": "https://www.pacificgeoportal.com/datasets/eaglegis::nz-regional-councils-archive"
				},
				{
					"@type": "dcat:Distribution",
					"title": "ArcGIS GeoService",
					"format": "ArcGIS GeoServices REST API",
					"mediaType": "application/json",
					"accessURL": "https://services.arcgis.com/XTtANUDT8Va4DLwI/arcgis/rest/services/nz_regional_councils_archive/FeatureServer/0"
				},
				{
					"@type": "dcat:Distribution",
					"title": "CSV",
					"format": "CSV",
					"mediaType": "text/csv",
					"accessURL": "https://www.pacificgeoportal.com/api/download/v1/items/6ee62a063ce74133af0c7476363ed03e/csv?layers=0"
				},
				{
					"@type": "dcat:Distribution",
					"title": "Shapefile",
					"format": "ZIP",
					"mediaType": "application/zip",
					"accessURL": "https://www.pacificgeoportal.com/api/download/v1/items/6ee62a063ce74133af0c7476363ed03e/shapefile?layers=0"
				},
				{
					"@type": "dcat:Distribution",
					"title": "GeoJSON",
					"format": "GeoJSON",
					"mediaType": "application/vnd.geo+json",
					"accessURL": "https://www.pacificgeoportal.com/api/download/v1/items/6ee62a063ce74133af0c7476363ed03e/geojson?layers=0"
				},
				{
					"@type": "dcat:Distribution",
					"title": "KML",
					"format": "KML",
					"mediaType": "application/vnd.google-earth.kml+xml",
					"accessURL": "https://www.pacificgeoportal.com/api/download/v1/items/6ee62a063ce74133af0c7476363ed03e/kml?layers=0"
				},
				{
					"@type": "dcat:Distribution",
					"title": "File Geodatabase",
					"format": "ZIP",
					"mediaType": "application/zip",
					"accessURL": "https://www.pacificgeoportal.com/api/download/v1/items/6ee62a063ce74133af0c7476363ed03e/filegdb?layers=0"
				},
				{
					"@type": "dcat:Distribution",
					"title": "Feature Collection",
					"format": "TXT",
					"mediaType": "text/plain",
					"accessURL": "https://www.pacificgeoportal.com/api/download/v1/items/6ee62a063ce74133af0c7476363ed03e/featureCollection?layers=0"
				},
				{
					"@type": "dcat:Distribution",
					"title": "Excel",
					"format": "XLSX",
					"mediaType": "application/vnd.ms-excel",
					"accessURL": "https://www.pacificgeoportal.com/api/download/v1/items/6ee62a063ce74133af0c7476363ed03e/excel?layers=0"
				},
				{
					"@type": "dcat:Distribution",
					"title": "GeoPackage",
					"format": "GPKG",
					"mediaType": "application/geopackage+sqlite3",
					"accessURL": "https://www.pacificgeoportal.com/api/download/v1/items/6ee62a063ce74133af0c7476363ed03e/geoPackage?layers=0"
				},
				{
					"@type": "dcat:Distribution",
					"title": "SQLite Geodatabase",
					"format": "GDB",
					"mediaType": "application/geopackage+sqlite3",
					"accessURL": "https://www.pacificgeoportal.com/api/download/v1/items/6ee62a063ce74133af0c7476363ed03e/sqlite?layers=0"
				}
			],
			"theme": [
				"geospatial"
			]
		},
		{
			"@type": "dcat:Dataset",
			"identifier": "https://www.arcgis.com/home/item.html?id=a855671b0d884afb91be42331f469138&sublayer=0",
			"landingPage": "https://www.pacificgeoportal.com/datasets/eaglegis::nz-community-boards-archive",
			"title": "NZ Community Boards - Archive",
			"description": "<font size='3' style='font-family:&quot;Avenir Next W01&quot;, &quot;Avenir Next W00&quot;, &quot;Avenir Next&quot;, Avenir, &quot;Helvetica Neue&quot;, Helvetica, Arial, sans-serif !important;'>Topicality: 01-01-2025</font><div><div style='font-size:17px; font-family:&quot;Avenir Next W01&quot;, &quot;Avenir Next W00&quot;, &quot;Avenir Next&quot;, Avenir, &quot;Helvetica Neue&quot;, Helvetica, Arial, sans-serif !important;'><font size='3'><span style='font-size:medium;'>Projection: New Zealand Transverse Mercator (NZTM)</span><br /></font></div><div style='font-family:&quot;Avenir Next W01&quot;, &quot;Avenir Next W00&quot;, &quot;Avenir Next&quot;, Avenir, &quot;Helvetica Neue&quot;, Helvetica, Arial, sans-serif !important;'><font size='3'><br /></font></div><div><div><font face='Avenir Next W01, Avenir Next W00, Avenir Next, Avenir, Helvetica Neue, Helvetica, Arial, sans-serif' size='3'>This layer contains the archive of </font><font size='3'>Community Board boundaries as defined by the territorial authorities and Local Government \nCommission but maintained by Stats NZ. This classification includes \ncommunity boards and local boards. </font></div><div><font face='Avenir Next W01, Avenir Next W00, Avenir Next, Avenir, Helvetica Neue, Helvetica, Arial, sans-serif' size='3'><br /></font></div><div><font size='3'>Community boards and local boards provide voting representation at a community level. They are defined under the <a href='https://www.legislation.govt.nz/act/public/2002/0084/167.0/DLM170873.html' rel='nofollow ugc'>Local Government Act 2002</a> and<a href='https://www.legislation.govt.nz/act/public/2001/0035/48.0/whole.html' rel='nofollow ugc'> Local Electoral Act 2001</a>.\n Local boards were introduced as part of the new local government \narrangements for Auckland in 2010. Community boards and local boards are\n defined at meshblock level and do not coincide with the statistical \narea 1 (SA1) or statistical area 2 (SA2) geographies. </font></div><div><font face='Avenir Next W01, Avenir Next W00, Avenir Next, Avenir, Helvetica Neue, Helvetica, Arial, sans-serif' size='3'><br /></font></div><font face='Avenir Next W01, Avenir Next W00, Avenir Next, Avenir, Helvetica Neue, Helvetica, Arial, sans-serif' size='3'>This layer get updated yearly with the latest boundary data.<font style='font-family:&quot;Avenir Next W01&quot;, &quot;Avenir Next W00&quot;, &quot;Avenir Next&quot;, Avenir, &quot;Helvetica Neue&quot;, Helvetica, Arial, sans-serif;'>\n You can use this layer when you need any year of boundary data in your \nmap. By setting a filter on the dataset year you can filter on specific \nyear of the dataset.</font><div><font style='font-family:&quot;Avenir Next W01&quot;, &quot;Avenir Next W00&quot;, &quot;Avenir Next&quot;, Avenir, &quot;Helvetica Neue&quot;, Helvetica, Arial, sans-serif;'><br /></font></div><div>For information about the fields in this dataset go to the Data tab.</div><div><br /></div><div>The layer is further generalised by Eagle Technology for improved performance on the web, <span style='font-family:&quot;Avenir Next W01&quot;, &quot;Avenir Next W00&quot;, &quot;Avenir Next&quot;, Avenir, &quot;Helvetica Neue&quot;, sans-serif;'>therefore it doesn't fully represent the official boundaries.</span></div><div><font style='font-family:&quot;Avenir Next W01&quot;, &quot;Avenir Next W00&quot;, &quot;Avenir Next&quot;, Avenir, &quot;Helvetica Neue&quot;, Helvetica, Arial, sans-serif;'><br /></font></div><div><font style='font-family:&quot;Avenir Next W01&quot;, &quot;Avenir Next W00&quot;, &quot;Avenir Next&quot;, Avenir, &quot;Helvetica Neue&quot;, Helvetica, Arial, sans-serif;'>If\n you only need the latest boundary data in your map you can use the </font><a href='https://www.arcgis.com/home/item.html?id=f67d663afaab470982b63d0f37db0f30' target='_blank' rel='nofollow ugc noopener noreferrer'>current version</a><font style='font-family:&quot;Avenir Next W01&quot;, &quot;Avenir Next W00&quot;, &quot;Avenir Next&quot;, Avenir, &quot;Helvetica Neue&quot;, Helvetica, Arial, sans-serif;'> of this dataset. All the current versions of Stats NZ \nBoundary layers can be found <a href='https://www.arcgis.com/home/group.html?id=b22e4f0012a8426dac21cd3d02f25c67' target='_blank' rel='nofollow ugc noopener noreferrer'>here</a>.</font></div><div><font style='font-family:&quot;Avenir Next W01&quot;, &quot;Avenir Next W00&quot;, &quot;Avenir Next&quot;, Avenir, &quot;Helvetica Neue&quot;, Helvetica, Arial, sans-serif;'><br /></font></div><div><font style='font-family:&quot;Avenir Next W01&quot;, &quot;Avenir Next W00&quot;, &quot;Avenir Next&quot;, Avenir, &quot;Helvetica Neue&quot;, Helvetica, Arial, sans-serif;'>The official dataset can be found on<font face='Avenir Next W01, Avenir Next W00, Avenir Next, Avenir, Helvetica Neue, Helvetica, Arial, sans-serif'> </font></font><a href='https://datafinder.stats.govt.nz/data/category/annual-boundaries/2022/' target='_blank' rel='nofollow ugc noopener noreferrer'>https://datafinder.stats.govt.nz.</a></div></font><div style='font-family:&quot;Avenir Next W01&quot;, &quot;Avenir Next W00&quot;, &quot;Avenir Next&quot;, Avenir, &quot;Helvetica Neue&quot;, Helvetica, Arial, sans-serif !important;'><font size='3'><br /></font></div><div><div style='font-family:&quot;Avenir Next W01&quot;, &quot;Avenir Next W00&quot;, &quot;Avenir Next&quot;, Avenir, &quot;Helvetica Neue&quot;, Helvetica, Arial, sans-serif !important;'><font color='#2f4f4f' size='3'>This layer is offered by Eagle Technology (Official Esri Distributor). Eagle Technology offers services that can be used in the ArcGIS platform. The Content team at Eagle Technology updates the layers on a regular basis and regularly adds new content to the Living Atlas. By using this content and combining it with other data you can create new information products quickly and easily.</font></div><div style='font-family:&quot;Avenir Next W01&quot;, &quot;Avenir Next W00&quot;, &quot;Avenir Next&quot;, Avenir, &quot;Helvetica Neue&quot;, Helvetica, Arial, sans-serif !important;'><font color='#2f4f4f' size='3'><br /></font></div><div style='font-family:&quot;Avenir Next W01&quot;, &quot;Avenir Next W00&quot;, &quot;Avenir Next&quot;, Avenir, &quot;Helvetica Neue&quot;, Helvetica, Arial, sans-serif !important;'><font color='#2f4f4f' size='3'>If you have any questions or comments about the content, please let us now  at </font><font size='3'><a href='mailto:livingatlas@eagle.co.nz' style='color:rgb(0, 121, 193); text-decoration-line:none;' target='_blank' rel='nofollow ugc noopener noreferrer'>livingatlas@eagle.co.nz</a></font></div></div></div></div>",
			"keyword": [
				"Boundary",
				"Boundaries",
				"New zealand",
				"Statistics New Zealand",
				"StatsNZ",
				"Eagle technology",
				"Nz",
				"Content",
				"Kiwi",
				"eaglegis"
			],
			"issued": "2023-01-18T00:32:41.000Z",
			"modified": "2025-12-19T00:25:48.774Z",
			"publisher": {
				"name": "Eagle Technology Group Ltd"
			},
			"contactPoint": {
				"@type": "vcard:Contact",
				"fn": "eaglegis",
				"hasEmail": "mailto:ts@eaglegis.co.nz"
			},
			"accessLevel": "public",
			"spatial": "166.2620,-47.2230,-177.6374,-33.6045",
			"license": "https://creativecommons.org/licenses/by/4.0",
			"distribution": [
				{
					"@type": "dcat:Distribution",
					"title": "ArcGIS Hub Dataset",
					"format": "Web Page",
					"mediaType": "text/html",
					"accessURL": "https://www.pacificgeoportal.com/datasets/eaglegis::nz-community-boards-archive"
				},
				{
					"@type": "dcat:Distribution",
					"title": "ArcGIS GeoService",
					"format": "ArcGIS GeoServices REST API",
					"mediaType": "application/json",
					"accessURL": "https://services.arcgis.com/XTtANUDT8Va4DLwI/arcgis/rest/services/nz_community_boards_archive/FeatureServer/0"
				},
				{
					"@type": "dcat:Distribution",
					"title": "CSV",
					"format": "CSV",
					"mediaType": "text/csv",
					"accessURL": "https://www.pacificgeoportal.com/api/download/v1/items/a855671b0d884afb91be42331f469138/csv?layers=0"
				},
				{
					"@type": "dcat:Distribution",
					"title": "Shapefile",
					"format": "ZIP",
					"mediaType": "application/zip",
					"accessURL": "https://www.pacificgeoportal.com/api/download/v1/items/a855671b0d884afb91be42331f469138/shapefile?layers=0"
				},
				{
					"@type": "dcat:Distribution",
					"title": "GeoJSON",
					"format": "GeoJSON",
					"mediaType": "application/vnd.geo+json",
					"accessURL": "https://www.pacificgeoportal.com/api/download/v1/items/a855671b0d884afb91be42331f469138/geojson?layers=0"
				},
				{
					"@type": "dcat:Distribution",
					"title": "KML",
					"format": "KML",
					"mediaType": "application/vnd.google-earth.kml+xml",
					"accessURL": "https://www.pacificgeoportal.com/api/download/v1/items/a855671b0d884afb91be42331f469138/kml?layers=0"
				},
				{
					"@type": "dcat:Distribution",
					"title": "File Geodatabase",
					"format": "ZIP",
					"mediaType": "application/zip",
					"accessURL": "https://www.pacificgeoportal.com/api/download/v1/items/a855671b0d884afb91be42331f469138/filegdb?layers=0"
				},
				{
					"@type": "dcat:Distribution",
					"title": "Feature Collection",
					"format": "TXT",
					"mediaType": "text/plain",
					"accessURL": "https://www.pacificgeoportal.com/api/download/v1/items/a855671b0d884afb91be42331f469138/featureCollection?layers=0"
				},
				{
					"@type": "dcat:Distribution",
					"title": "Excel",
					"format": "XLSX",
					"mediaType": "application/vnd.ms-excel",
					"accessURL": "https://www.pacificgeoportal.com/api/download/v1/items/a855671b0d884afb91be42331f469138/excel?layers=0"
				},
				{
					"@type": "dcat:Distribution",
					"title": "GeoPackage",
					"format": "GPKG",
					"mediaType": "application/geopackage+sqlite3",
					"accessURL": "https://www.pacificgeoportal.com/api/download/v1/items/a855671b0d884afb91be42331f469138/geoPackage?layers=0"
				},
				{
					"@type": "dcat:Distribution",
					"title": "SQLite Geodatabase",
					"format": "GDB",
					"mediaType": "application/geopackage+sqlite3",
					"accessURL": "https://www.pacificgeoportal.com/api/download/v1/items/a855671b0d884afb91be42331f469138/sqlite?layers=0"
				}
			],
			"theme": [
				"geospatial"
			]
		},
		{
			"@type": "dcat:Dataset",
			"identifier": "https://www.arcgis.com/home/item.html?id=68ea2f1f5a2d41a58d1d36ec489196b8",
			"landingPage": "https://www.pacificgeoportal.com/pages/pacificcore::gce-partner-page",
			"title": "GCE PARTNER PAGE",
			"description": "At the heart of the Pacific, the Republic of Fiji's diverse landscapes and vibrant communities are now more accessible than ever. Dive into detailed maps, gain invaluable insights, and transform your research and policy-making processes.",
			"keyword": [
				""
			],
			"issued": "2025-01-08T18:52:47.000Z",
			"modified": "2025-01-08T18:54:31.000Z",
			"publisher": {
				"name": "Pacific GeoPortal - Core Organization"
			},
			"contactPoint": {
				"@type": "vcard:Contact",
				"fn": "Pacific_Core_Admin",
				"hasEmail": "mailto:pacific_geoportal@esri.com"
			},
			"accessLevel": "public",
			"spatial": "112.9197,-55.1168,159.2562,-9.1406",
			"license": "",
			"distribution": [
				{
					"@type": "dcat:Distribution",
					"title": "ArcGIS Hub Dataset",
					"format": "Web Page",
					"mediaType": "text/html",
					"accessURL": "https://www.pacificgeoportal.com/pages/pacificcore::gce-partner-page"
				}
			],
			"theme": [
				"geospatial"
			]
		},
		{
			"@type": "dcat:Dataset",
			"identifier": "https://www.arcgis.com/home/item.html?id=9e20956f766744aea5e9bf85abf5fde6",
			"landingPage": "https://www.pacificgeoportal.com/apps/pacificcore::cyclone-winston-mangrove-damage",
			"title": "Cyclone Winston Mangrove Damage",
			"description": "",
			"keyword": [
				"dep",
				"mangroves",
				"fiji",
				"cyclone",
				"winston",
				"damage",
				"dep",
				"mangroves",
				"fiji",
				"cyclone",
				"winston",
				"damage",
				"pgp"
			],
			"issued": "2023-10-13T08:24:49.000Z",
			"modified": "2024-10-15T02:57:15.000Z",
			"publisher": {
				"name": "Pacific GeoPortal - Core Organization"
			},
			"contactPoint": {
				"@type": "vcard:Contact",
				"fn": "klevy_pacificcore",
				"hasEmail": "mailto:pacific_geoportal@esri.com"
			},
			"accessLevel": "public",
			"spatial": "",
			"license": "",
			"distribution": [
				{
					"@type": "dcat:Distribution",
					"title": "ArcGIS Hub Dataset",
					"format": "Web Page",
					"mediaType": "text/html",
					"accessURL": "https://www.pacificgeoportal.com/apps/pacificcore::cyclone-winston-mangrove-damage"
				},
				{
					"@type": "dcat:Distribution",
					"title": "ArcGIS GeoService",
					"format": "ArcGIS GeoServices REST API",
					"mediaType": "application/json",
					"accessURL": "https://pacificcore.maps.arcgis.com/apps/instant/slider/index.html?appid=9e20956f766744aea5e9bf85abf5fde6"
				}
			],
			"theme": ""
		},
		{
			"@type": "dcat:Dataset",
			"identifier": "https://www.arcgis.com/home/item.html?id=0481dffe1b1d4d5d9cf04bfb321110a4",
			"landingPage": "https://www.pacificgeoportal.com/maps/pacificcore::cyclone-winston-and-ana-mangrove-damage",
			"title": "Cyclone Winston and Ana Mangrove Damage",
			"description": "",
			"keyword": [
				"dep",
				"mangroves",
				"fiji",
				"cyclone",
				"winston",
				"damage"
			],
			"issued": "2023-10-13T08:24:00.000Z",
			"modified": "2024-10-15T02:54:40.000Z",
			"publisher": {
				"name": "Pacific GeoPortal - Core Organization"
			},
			"contactPoint": {
				"@type": "vcard:Contact",
				"fn": "klevy_pacificcore",
				"hasEmail": "mailto:pacific_geoportal@esri.com"
			},
			"accessLevel": "public",
			"spatial": "178.0038,-17.6249,178.4574,-17.3371",
			"license": "",
			"distribution": [
				{
					"@type": "dcat:Distribution",
					"title": "ArcGIS Hub Dataset",
					"format": "Web Page",
					"mediaType": "text/html",
					"accessURL": "https://www.pacificgeoportal.com/maps/pacificcore::cyclone-winston-and-ana-mangrove-damage"
				}
			],
			"theme": [
				"geospatial"
			]
		},
		{
			"@type": "dcat:Dataset",
			"identifier": "https://www.arcgis.com/home/item.html?id=d23e91332aa8463390cf2f8600c51f22",
			"landingPage": "https://www.pacificgeoportal.com/apps/pacificcore::remote-sensing-shows-the-impact-of-drought-in-png",
			"title": "Remote Sensing Shows the Impact of Drought in PNG",
			"description": "<p>From 2015 to 2016 the Southwest Pacific nation of Papua New Guinea experienced a severe El-Niño event which brought devastating drought conditions and damaging frost to many parts of the country.</p><p>Provinces with high areas of agricultural land were hard hit by below average rainfall, as primary water sources dried up and frost destroyed large numbers of food crops.</p><p>The maps below provide a visual representation of the water scarcity in one of the hardest hit areas, the Middle Fly district.</p>",
			"keyword": [
				"pgp"
			],
			"issued": "2023-10-17T01:29:52.000Z",
			"modified": "2024-10-15T02:43:49.000Z",
			"publisher": {
				"name": "Pacific GeoPortal - Core Organization"
			},
			"contactPoint": {
				"@type": "vcard:Contact",
				"fn": "klevy_pacificcore",
				"hasEmail": "mailto:pacific_geoportal@esri.com"
			},
			"accessLevel": "public",
			"spatial": "",
			"license": "",
			"distribution": [
				{
					"@type": "dcat:Distribution",
					"title": "ArcGIS Hub Dataset",
					"format": "Web Page",
					"mediaType": "text/html",
					"accessURL": "https://www.pacificgeoportal.com/apps/pacificcore::remote-sensing-shows-the-impact-of-drought-in-png"
				},
				{
					"@type": "dcat:Distribution",
					"title": "ArcGIS GeoService",
					"format": "ArcGIS GeoServices REST API",
					"mediaType": "application/json",
					"accessURL": "https://storymaps.arcgis.com/stories/d23e91332aa8463390cf2f8600c51f22"
				}
			],
			"theme": ""
		},
		{
			"@type": "dcat:Dataset",
			"identifier": "https://www.arcgis.com/home/item.html?id=887d9787fc794774a35e57914f98bce3",
			"landingPage": "https://www.pacificgeoportal.com/apps/pacificcore::open-street-maps-for-pacific-region",
			"title": "Open Street Maps for Pacific Region",
			"description": "<p><a href='https://www.openstreetmap.org/' target='_blank' rel='nofollow ugc noopener noreferrer'> OpenStreetMap </a> (OSM) is an <strong>open, editable map of the world</strong> built by a community of mappers that contribute and maintain geospatial data about our world. OSM Pacific Region is a network of OpenStreetMap communities from all over Australia and Ocenea working together to grow OSM collection. </p>",
			"keyword": [
				"OSM",
				"PaficiRegion",
				"OpenStreetMap"
			],
			"issued": "2023-10-16T00:47:35.000Z",
			"modified": "2024-09-05T17:12:25.000Z",
			"publisher": {
				"name": "Pacific GeoPortal - Core Organization"
			},
			"contactPoint": {
				"@type": "vcard:Contact",
				"fn": "dkaragulle_pacificcore",
				"hasEmail": "mailto:pacific_geoportal@esri.com"
			},
			"accessLevel": "public",
			"spatial": "",
			"license": "https://opendatacommons.org/licenses/odbl/summary",
			"distribution": [
				{
					"@type": "dcat:Distribution",
					"title": "ArcGIS Hub Dataset",
					"format": "Web Page",
					"mediaType": "text/html",
					"accessURL": "https://www.pacificgeoportal.com/apps/pacificcore::open-street-maps-for-pacific-region"
				},
				{
					"@type": "dcat:Distribution",
					"title": "ArcGIS GeoService",
					"format": "ArcGIS GeoServices REST API",
					"mediaType": "application/json",
					"accessURL": "https://storymaps.arcgis.com/stories/887d9787fc794774a35e57914f98bce3"
				}
			],
			"theme": ""
		},
		{
			"@type": "dcat:Dataset",
			"identifier": "https://www.arcgis.com/home/item.html?id=235d4b2ba3a4418191a3b408275fabfd",
			"landingPage": "https://www.pacificgeoportal.com/pages/pacificcore::community",
			"title": "Community",
			"description": "{{description}}",
			"keyword": [
				""
			],
			"issued": "2023-10-20T19:48:19.000Z",
			"modified": "2024-09-05T15:59:49.000Z",
			"publisher": {
				"name": "Pacific GeoPortal - Core Organization"
			},
			"contactPoint": {
				"@type": "vcard:Contact",
				"fn": "Pacific_Core_Admin",
				"hasEmail": "mailto:pacific_geoportal@esri.com"
			},
			"accessLevel": "public",
			"spatial": "-134.7473,23.5610,-55.6955,50.3092",
			"license": "",
			"distribution": [
				{
					"@type": "dcat:Distribution",
					"title": "ArcGIS Hub Dataset",
					"format": "Web Page",
					"mediaType": "text/html",
					"accessURL": "https://www.pacificgeoportal.com/pages/pacificcore::community"
				}
			],
			"theme": [
				"geospatial"
			]
		},
		{
			"@type": "dcat:Dataset",
			"identifier": "https://www.arcgis.com/home/item.html?id=dc7f1712f5bc4b86a955d8a2f21d5f21",
			"landingPage": "https://www.pacificgeoportal.com/apps/pacificcore::openstreetmap-collection-for-pacific-region",
			"title": "OpenStreetMap Collection for Pacific Region",
			"description": "This app displays open street maps web maps for the Pacific Region. ",
			"keyword": [
				""
			],
			"issued": "2023-10-16T00:10:47.000Z",
			"modified": "2024-09-04T23:02:34.000Z",
			"publisher": {
				"name": "Pacific GeoPortal - Core Organization"
			},
			"contactPoint": {
				"@type": "vcard:Contact",
				"fn": "dkaragulle_pacificcore",
				"hasEmail": "mailto:pacific_geoportal@esri.com"
			},
			"accessLevel": "public",
			"spatial": "",
			"license": "",
			"distribution": [
				{
					"@type": "dcat:Distribution",
					"title": "ArcGIS Hub Dataset",
					"format": "Web Page",
					"mediaType": "text/html",
					"accessURL": "https://www.pacificgeoportal.com/apps/pacificcore::openstreetmap-collection-for-pacific-region"
				},
				{
					"@type": "dcat:Distribution",
					"title": "ArcGIS GeoService",
					"format": "ArcGIS GeoServices REST API",
					"mediaType": "application/json",
					"accessURL": "https://pacificcore.maps.arcgis.com/apps/instant/filtergallery/index.html?appid=dc7f1712f5bc4b86a955d8a2f21d5f21"
				}
			],
			"theme": ""
		},
		{
			"@type": "dcat:Dataset",
			"identifier": "https://www.arcgis.com/home/item.html?id=10e3fb0fa12842e889b5aa2d1f6ba779",
			"landingPage": "https://www.pacificgeoportal.com/apps/10e3fb0fa12842e889b5aa2d1f6ba779",
			"title": "State of the Climate in the Southwest Pacific in 2023",
			"description": "<p>The global climate system is complex. In order to help understand such complexity, the WMO State of the Climate reports use climate indicators to describe how the climate has changed—providing a broad view of the climate at a global and regional scale. These indicators are representative of quantities most relevant to monitoring climate change, including the surface temperature, heat content of the ocean, greenhouse gas concentrations and other factors, as well as the responses of land, oceans and ice. The following site aims to provide an overview of the State of the Climate in the South-West Pacific in 2023. </p>",
			"keyword": [
				""
			],
			"issued": "2024-08-12T10:11:14.000Z",
			"modified": "2024-08-20T01:15:08.000Z",
			"publisher": {
				"name": "{{source}}"
			},
			"contactPoint": {
				"@type": "vcard:Contact",
				"fn": "cransom@wmo.int_WMO",
				"hasEmail": "{{orgContactEmail}}"
			},
			"accessLevel": "public",
			"spatial": "",
			"license": "",
			"distribution": [
				{
					"@type": "dcat:Distribution",
					"title": "ArcGIS Hub Dataset",
					"format": "Web Page",
					"mediaType": "text/html",
					"accessURL": "https://www.pacificgeoportal.com/apps/10e3fb0fa12842e889b5aa2d1f6ba779"
				},
				{
					"@type": "dcat:Distribution",
					"title": "ArcGIS GeoService",
					"format": "ArcGIS GeoServices REST API",
					"mediaType": "application/json",
					"accessURL": "https://storymaps.arcgis.com/stories/10e3fb0fa12842e889b5aa2d1f6ba779"
				}
			],
			"theme": ""
		},
		{
			"@type": "dcat:Dataset",
			"identifier": "https://www.arcgis.com/home/item.html?id=919be41ae8194e65b49c70e2891d9d08&sublayer=0",
			"landingPage": "https://www.pacificgeoportal.com/datasets/919be41ae8194e65b49c70e2891d9d08_0",
			"title": "OpenStreetMap Highways for Australia and Oceania",
			"description": "<span style='font-family:&quot;Avenir Next W01&quot;, &quot;Avenir Next W00&quot;, &quot;Avenir Next&quot;, Avenir, &quot;Helvetica Neue&quot;, sans-serif; font-size:17px;'>This feature layer provides access to OpenStreetMap (OSM) </span><span style='font-family:&quot;Avenir Next W01&quot;, &quot;Avenir Next W00&quot;, &quot;Avenir Next&quot;, Avenir, &quot;Helvetica Neue&quot;, sans-serif; font-size:17px;'>highways </span><span style='font-family:&quot;Avenir Next W01&quot;, &quot;Avenir Next W00&quot;, &quot;Avenir Next&quot;, Avenir, &quot;Helvetica Neue&quot;, sans-serif; font-size:17px;'>data for Australia and Oceania, which is <b>updated every 5 minutes</b> with the latest edits. This </span><a href='https://doc.arcgis.com/en/arcgis-online/share-maps/about-sharing-feature-layer-data-as-copies.htm' rel='nofollow ugc' style='color:rgb(0, 121, 193); font-family:&quot;Avenir Next W01&quot;, &quot;Avenir Next W00&quot;, &quot;Avenir Next&quot;, Avenir, &quot;Helvetica Neue&quot;, sans-serif; font-size:16px; text-decoration-line:none;' target='_blank'>hosted feature layer view</a><span style='font-family:&quot;Avenir Next W01&quot;, &quot;Avenir Next W00&quot;, &quot;Avenir Next&quot;, Avenir, &quot;Helvetica Neue&quot;, sans-serif; font-size:17px;'> is referencing a hosted feature layer of OSM line (way) data in ArcGIS Online that is updated with minutely diffs from the OSM planet file.  This feature </span><span style='font-family:&quot;Avenir Next W01&quot;, &quot;Avenir Next W00&quot;, &quot;Avenir Next&quot;, Avenir, &quot;Helvetica Neue&quot;, sans-serif; font-size:17px;'>layer view</span><span style='font-family:&quot;Avenir Next W01&quot;, &quot;Avenir Next W00&quot;, &quot;Avenir Next&quot;, Avenir, &quot;Helvetica Neue&quot;, sans-serif; font-size:17px;'> includes </span><span style='font-family:&quot;Avenir Next W01&quot;, &quot;Avenir Next W00&quot;, &quot;Avenir Next&quot;, Avenir, &quot;Helvetica Neue&quot;, sans-serif; font-size:17px;'>highway </span><span style='font-family:&quot;Avenir Next W01&quot;, &quot;Avenir Next W00&quot;, &quot;Avenir Next&quot;, Avenir, &quot;Helvetica Neue&quot;, sans-serif; font-size:17px;'>features defined as a query against the hosted feature layer (i.e. </span><span style='font-family:&quot;Avenir Next W01&quot;, &quot;Avenir Next W00&quot;, &quot;Avenir Next&quot;, Avenir, &quot;Helvetica Neue&quot;, sans-serif; font-size:17px;'>highway </span><span style='font-family:&quot;Avenir Next W01&quot;, &quot;Avenir Next W00&quot;, &quot;Avenir Next&quot;, Avenir, &quot;Helvetica Neue&quot;, sans-serif; font-size:17px;'>is not blank).</span><div style='font-family:&quot;Avenir Next W01&quot;, &quot;Avenir Next W00&quot;, &quot;Avenir Next&quot;, Avenir, &quot;Helvetica Neue&quot;, sans-serif; font-size:16px;'><font style='font-family:inherit;'><span style='font-family:inherit; font-size:17px;'><br /></span></font></div><div style='font-family:&quot;Avenir Next W01&quot;, &quot;Avenir Next W00&quot;, &quot;Avenir Next&quot;, Avenir, &quot;Helvetica Neue&quot;, sans-serif; font-size:16px;'><font style='font-family:inherit;'><span style='font-family:inherit; font-size:17px;'>In OSM, a </span></font><font style='font-family:inherit;'><font style='font-family:inherit;'><font style='font-family:inherit;'><b><span style='font-family:inherit; font-size:17px;'>highway </span><span style='font-family:inherit; font-size:17px;'>describes </span></b></font><font style='font-family:inherit;'><font style='font-family:inherit;'><span style='font-family:inherit; font-size:17px;'><b>any kind of motorway, road, street or path</b></span></font><font style='font-family:inherit;'><span style='font-family:inherit; font-size:17px;'>.  These features are identified with a </span></font></font></font></font><font style='font-family:inherit;'><a href='https://wiki.openstreetmap.org/wiki/Key:highway' rel='nofollow ugc' style='color:rgb(0, 121, 193); font-family:inherit; text-decoration-line:none;' target='_blank'>highway tag</a><span style='font-family:inherit; font-size:17px;'>.  There are hundreds of different tag values for highway used in the OSM database.  In this feature layer, unique symbols are used for several of the most popular </span><span style='font-family:inherit; font-size:17px;'>highway </span><span style='font-family:inherit; font-size:17px;'>types, while lesser used types are grouped in an &quot;other&quot; category.<br /></span></font><div style='font-family:inherit;'><span style='font-family:&quot;Avenir Next W01&quot;, &quot;Avenir Next W00&quot;, &quot;Avenir Next&quot;, Avenir, &quot;Helvetica Neue&quot;, Helvetica, Arial, sans-serif; font-size:17px;'><br /></span></div><div style='font-family:inherit;'><span style='font-family:&quot;Avenir Next W01&quot;, &quot;Avenir Next W00&quot;, &quot;Avenir Next&quot;, Avenir, &quot;Helvetica Neue&quot;, Helvetica, Arial, sans-serif; font-size:17px;'>Zoom in to large scales (e.g. Streets level or 1:20k scale) to see the </span><span style='font-family:&quot;Avenir Next&quot;, Avenir, &quot;Helvetica Neue&quot;, Helvetica, Arial, sans-serif; font-size:17px;'>highway </span><span style='font-family:&quot;Avenir Next W01&quot;, &quot;Avenir Next W00&quot;, &quot;Avenir Next&quot;, Avenir, &quot;Helvetica Neue&quot;, Helvetica, Arial, sans-serif; font-size:17px;'>features display.  </span><span style='font-family:&quot;Avenir Next W01&quot;, &quot;Avenir Next W00&quot;, &quot;Avenir Next&quot;, Avenir, &quot;Helvetica Neue&quot;, Helvetica, Arial, sans-serif; font-size:17px;'>You can click on </span><span style='font-family:&quot;Avenir Next W01&quot;, &quot;Avenir Next W00&quot;, &quot;Avenir Next&quot;, Avenir, &quot;Helvetica Neue&quot;, Helvetica, Arial, sans-serif; font-size:17px;'>a </span><span style='font-family:&quot;Avenir Next W01&quot;, &quot;Avenir Next W00&quot;, &quot;Avenir Next&quot;, Avenir, &quot;Helvetica Neue&quot;, Helvetica, Arial, sans-serif; font-size:17px;'>feature to get the name of the </span><span style='font-family:&quot;Avenir Next&quot;, Avenir, &quot;Helvetica Neue&quot;, Helvetica, Arial, sans-serif; font-size:17px;'>highway </span><span style='font-family:&quot;Avenir Next W01&quot;, &quot;Avenir Next W00&quot;, &quot;Avenir Next&quot;, Avenir, &quot;Helvetica Neue&quot;, Helvetica, Arial, sans-serif; font-size:17px;'>(if available).  The name of the </span><span style='font-family:&quot;Avenir Next&quot;, Avenir, &quot;Helvetica Neue&quot;, Helvetica, Arial, sans-serif; font-size:17px;'>highway </span><span style='font-family:&quot;Avenir Next W01&quot;, &quot;Avenir Next W00&quot;, &quot;Avenir Next&quot;, Avenir, &quot;Helvetica Neue&quot;, Helvetica, Arial, sans-serif; font-size:17px;'>will display by default at large scales (e.g. Street level of 1:5k scale).  Labels can be turned off in your map if you prefer.</span></div></div><div style='font-family:&quot;Avenir Next W01&quot;, &quot;Avenir Next W00&quot;, &quot;Avenir Next&quot;, Avenir, &quot;Helvetica Neue&quot;, sans-serif; font-size:16px;'><span style='font-family:&quot;Avenir Next W01&quot;, &quot;Avenir Next W00&quot;, &quot;Avenir Next&quot;, Avenir, &quot;Helvetica Neue&quot;, Helvetica, Arial, sans-serif; font-size:17px;'><br /></span></div><div style='font-family:&quot;Avenir Next W01&quot;, &quot;Avenir Next W00&quot;, &quot;Avenir Next&quot;, Avenir, &quot;Helvetica Neue&quot;, sans-serif; font-size:16px;'><span style='font-family:&quot;Avenir Next W01&quot;, &quot;Avenir Next W00&quot;, &quot;Avenir Next&quot;, Avenir, &quot;Helvetica Neue&quot;, Helvetica, Arial, sans-serif; font-size:17px;'><b>Create New Layer</b></span></div><div style='font-family:&quot;Avenir Next W01&quot;, &quot;Avenir Next W00&quot;, &quot;Avenir Next&quot;, Avenir, &quot;Helvetica Neue&quot;, sans-serif; font-size:16px;'><span style='font-family:&quot;Avenir Next W01&quot;, &quot;Avenir Next W00&quot;, &quot;Avenir Next&quot;, Avenir, &quot;Helvetica Neue&quot;, Helvetica, Arial, sans-serif; font-size:17px;'>If you would like to create a more focused version of this </span><span style='font-family:&quot;Avenir Next&quot;, Avenir, &quot;Helvetica Neue&quot;, Helvetica, Arial, sans-serif; font-size:17px;'>highway </span><span style='font-family:&quot;Avenir Next W01&quot;, &quot;Avenir Next W00&quot;, &quot;Avenir Next&quot;, Avenir, &quot;Helvetica Neue&quot;, Helvetica, Arial, sans-serif; font-size:17px;'>layer displaying just one or two </span><span style='font-family:&quot;Avenir Next&quot;, Avenir, &quot;Helvetica Neue&quot;, Helvetica, Arial, sans-serif; font-size:17px;'>highway </span><span style='font-family:&quot;Avenir Next W01&quot;, &quot;Avenir Next W00&quot;, &quot;Avenir Next&quot;, Avenir, &quot;Helvetica Neue&quot;, Helvetica, Arial, sans-serif; font-size:17px;'>types, you can do that easily!  Just add the layer to a map, copy the layer in the content window, add a filter to the new layer (e.g. </span><span style='font-family:&quot;Avenir Next&quot;, Avenir, &quot;Helvetica Neue&quot;, Helvetica, Arial, sans-serif; font-size:17px;'>highway </span><span style='font-family:&quot;Avenir Next W01&quot;, &quot;Avenir Next W00&quot;, &quot;Avenir Next&quot;, Avenir, &quot;Helvetica Neue&quot;, Helvetica, Arial, sans-serif; font-size:17px;'>is path), rename the layer as appropriate, and save layer.  You can also change the layer symbols or popup if you like.  Esri may publish a few such layers (e.g. cycleway and pedestrian) that are ready to use, but not for every type of </span><span style='font-family:&quot;Avenir Next&quot;, Avenir, &quot;Helvetica Neue&quot;, Helvetica, Arial, sans-serif; font-size:17px;'>highway</span><span style='font-family:&quot;Avenir Next W01&quot;, &quot;Avenir Next W00&quot;, &quot;Avenir Next&quot;, Avenir, &quot;Helvetica Neue&quot;, Helvetica, Arial, sans-serif; font-size:17px;'>.</span></div><div style='font-family:&quot;Avenir Next W01&quot;, &quot;Avenir Next W00&quot;, &quot;Avenir Next&quot;, Avenir, &quot;Helvetica Neue&quot;, sans-serif; font-size:16px;'><span style='font-family:&quot;Avenir Next W01&quot;, &quot;Avenir Next W00&quot;, &quot;Avenir Next&quot;, Avenir, &quot;Helvetica Neue&quot;, Helvetica, Arial, sans-serif; font-size:17px;'><br /></span></div><div style='font-family:&quot;Avenir Next W01&quot;, &quot;Avenir Next W00&quot;, &quot;Avenir Next&quot;, Avenir, &quot;Helvetica Neue&quot;, sans-serif; font-size:16px;'><span style='font-family:&quot;Avenir Next W01&quot;, &quot;Avenir Next W00&quot;, &quot;Avenir Next&quot;, Avenir, &quot;Helvetica Neue&quot;, Helvetica, Arial, sans-serif; font-size:17px;'><b><i>Important Note</i></b>: if you do create a new layer, it should be provided under the same Terms of Use and include the same Credits as this layer.  You can copy and paste the Terms of Use and Credits info below in the new Item page as needed.</span></div>",
			"keyword": [
				"osm",
				"highway",
				"Australia",
				"Oceania",
				"New Zealand",
				"road",
				"path",
				"American Samoa",
				"Cook Islands",
				"Fed States of Micronesia",
				"Fiji",
				"French Polynesia",
				"Guam",
				"Kiribati",
				"Marshall Islands",
				"Nauru",
				"New Caledonia",
				"Niue",
				"North Mariana Islands",
				"Palau",
				"Papua New Guinea",
				"Pitcairn Islands",
				"Samoa",
				"Solomon Islands",
				"Tokelau",
				"Tonga",
				"Tuvalu",
				"Vanuatu",
				"Wallis and Futuna"
			],
			"issued": "2021-04-29T16:02:44.000Z",
			"modified": "2026-11-11T13:31:10.110Z",
			"publisher": {
				"name": "{{source}}"
			},
			"contactPoint": {
				"@type": "vcard:Contact",
				"fn": "smoore3_osm",
				"hasEmail": "{{orgContactEmail}}"
			},
			"accessLevel": "public",
			"spatial": "180.0000,-78.1668,-180.0000,80.9902",
			"license": "https://opendatacommons.org/licenses/odbl/summary",
			"distribution": [
				{
					"@type": "dcat:Distribution",
					"title": "ArcGIS Hub Dataset",
					"format": "Web Page",
					"mediaType": "text/html",
					"accessURL": "https://www.pacificgeoportal.com/datasets/919be41ae8194e65b49c70e2891d9d08_0"
				},
				{
					"@type": "dcat:Distribution",
					"title": "ArcGIS GeoService",
					"format": "ArcGIS GeoServices REST API",
					"mediaType": "application/json",
					"accessURL": "https://services-ap1.arcgis.com/iA7fZQOnjY9D67Zx/arcgis/rest/services/OSM_AU_Highways/FeatureServer/0"
				},
				{
					"@type": "dcat:Distribution",
					"title": "CSV",
					"format": "CSV",
					"mediaType": "text/csv",
					"accessURL": "https://www.pacificgeoportal.com/api/download/v1/items/919be41ae8194e65b49c70e2891d9d08/csv?layers=0"
				},
				{
					"@type": "dcat:Distribution",
					"title": "Shapefile",
					"format": "ZIP",
					"mediaType": "application/zip",
					"accessURL": "https://www.pacificgeoportal.com/api/download/v1/items/919be41ae8194e65b49c70e2891d9d08/shapefile?layers=0"
				},
				{
					"@type": "dcat:Distribution",
					"title": "GeoJSON",
					"format": "GeoJSON",
					"mediaType": "application/vnd.geo+json",
					"accessURL": "https://www.pacificgeoportal.com/api/download/v1/items/919be41ae8194e65b49c70e2891d9d08/geojson?layers=0"
				},
				{
					"@type": "dcat:Distribution",
					"title": "KML",
					"format": "KML",
					"mediaType": "application/vnd.google-earth.kml+xml",
					"accessURL": "https://www.pacificgeoportal.com/api/download/v1/items/919be41ae8194e65b49c70e2891d9d08/kml?layers=0"
				}
			],
			"theme": [
				"geospatial"
			]
		},
		{
			"@type": "dcat:Dataset",
			"identifier": "https://www.arcgis.com/home/item.html?id=76659f9ea5bf4761b263ffe55f976d1a&sublayer=0",
			"landingPage": "https://www.pacificgeoportal.com/datasets/76659f9ea5bf4761b263ffe55f976d1a_0",
			"title": "OpenStreetMap Waterways for Australia and Oceania",
			"description": "<span style='font-family:&quot;Avenir Next W01&quot;, &quot;Avenir Next W00&quot;, &quot;Avenir Next&quot;, Avenir, &quot;Helvetica Neue&quot;, sans-serif; font-size:17px;'>This feature layer provides access to OpenStreetMap (OSM) </span><span style='font-family:&quot;Avenir Next W01&quot;, &quot;Avenir Next W00&quot;, &quot;Avenir Next&quot;, Avenir, &quot;Helvetica Neue&quot;, sans-serif; font-size:17px;'>waterways </span><font style='font-family:&quot;Avenir Next W01&quot;, &quot;Avenir Next W00&quot;, &quot;Avenir Next&quot;, Avenir, &quot;Helvetica Neue&quot;, sans-serif; font-size:16px;'><span style='font-family:inherit; font-size:17px;'>data for Australia and Oceania, which is </span></font><b>updated every 15 minutes</b><font style='font-family:&quot;Avenir Next W01&quot;, &quot;Avenir Next W00&quot;, &quot;Avenir Next&quot;, Avenir, &quot;Helvetica Neue&quot;, sans-serif; font-size:16px;'><span style='font-family:inherit; font-size:17px;'> with the latest edits. This </span></font><a href='https://doc.arcgis.com/en/arcgis-online/share-maps/about-sharing-feature-layer-data-as-copies.htm' rel='nofollow ugc' style='color:rgb(0, 121, 193); font-family:&quot;Avenir Next W01&quot;, &quot;Avenir Next W00&quot;, &quot;Avenir Next&quot;, Avenir, &quot;Helvetica Neue&quot;, sans-serif; font-size:16px; text-decoration-line:none;' target='_blank'>hosted feature layer view</a><span style='font-family:&quot;Avenir Next W01&quot;, &quot;Avenir Next W00&quot;, &quot;Avenir Next&quot;, Avenir, &quot;Helvetica Neue&quot;, sans-serif; font-size:17px;'> is referencing a hosted feature layer of OSM line (way) data in ArcGIS Online that is updated with minutely diffs from the OSM planet file.  This feature </span><span style='font-family:&quot;Avenir Next W01&quot;, &quot;Avenir Next W00&quot;, &quot;Avenir Next&quot;, Avenir, &quot;Helvetica Neue&quot;, sans-serif; font-size:17px;'>layer view</span><span style='font-family:&quot;Avenir Next W01&quot;, &quot;Avenir Next W00&quot;, &quot;Avenir Next&quot;, Avenir, &quot;Helvetica Neue&quot;, sans-serif; font-size:17px;'> includes waterway </span><span style='font-family:&quot;Avenir Next W01&quot;, &quot;Avenir Next W00&quot;, &quot;Avenir Next&quot;, Avenir, &quot;Helvetica Neue&quot;, sans-serif; font-size:17px;'>features defined as a query against the hosted feature layer (i.e. waterway is not blank).</span><div style='font-family:&quot;Avenir Next W01&quot;, &quot;Avenir Next W00&quot;, &quot;Avenir Next&quot;, Avenir, &quot;Helvetica Neue&quot;, sans-serif; font-size:16px;'><font style='font-family:inherit;'><span style='font-family:inherit; font-size:17px;'><br /></span></font></div><div style='font-family:&quot;Avenir Next W01&quot;, &quot;Avenir Next W00&quot;, &quot;Avenir Next&quot;, Avenir, &quot;Helvetica Neue&quot;, sans-serif; font-size:16px;'><font style='font-family:inherit;'><span style='font-family:inherit; font-size:17px;'>In OSM, a waterway </span></font><font style='font-family:inherit;'><font style='font-family:inherit;'><font style='font-family:inherit;'><span style='font-family:inherit; font-size:17px;'>describes rivers, streams and ditches with a flow of water from one place to another</span></font><font style='font-family:inherit;'><span style='font-family:inherit; font-size:17px;'>.  These features are identified with a </span></font></font></font><font style='font-family:inherit;'><a href='https://wiki.openstreetmap.org/wiki/Key:waterway' rel='nofollow ugc' style='color:rgb(0, 121, 193); font-family:inherit; text-decoration-line:none;' target='_blank'>waterway tag</a><span style='font-family:inherit; font-size:17px;'>.  There are hundreds of different tag values for waterway used in the OSM database.  In this feature layer, unique symbols are used for several of the most popular waterway types, while lesser used types are grouped in an &quot;other&quot; category.<br /></span></font><div style='font-family:inherit;'><span style='font-family:&quot;Avenir Next W01&quot;, &quot;Avenir Next W00&quot;, &quot;Avenir Next&quot;, Avenir, &quot;Helvetica Neue&quot;, Helvetica, Arial, sans-serif; font-size:17px;'><br /></span></div><div style='font-family:inherit;'><span style='font-family:&quot;Avenir Next W01&quot;, &quot;Avenir Next W00&quot;, &quot;Avenir Next&quot;, Avenir, &quot;Helvetica Neue&quot;, Helvetica, Arial, sans-serif; font-size:17px;'>Zoom in to large scales (e.g. </span><span style='font-family:&quot;Avenir Next W01&quot;, &quot;Avenir Next W00&quot;, &quot;Avenir Next&quot;, Avenir, &quot;Helvetica Neue&quot;, Helvetica, Arial, sans-serif; font-size:17px;'>City level or 1:80k scale</span><span style='font-family:&quot;Avenir Next W01&quot;, &quot;Avenir Next W00&quot;, &quot;Avenir Next&quot;, Avenir, &quot;Helvetica Neue&quot;, Helvetica, Arial, sans-serif; font-size:17px;'>) to see the waterway features display.  </span><span style='font-family:&quot;Avenir Next W01&quot;, &quot;Avenir Next W00&quot;, &quot;Avenir Next&quot;, Avenir, &quot;Helvetica Neue&quot;, Helvetica, Arial, sans-serif; font-size:17px;'>You can click on </span><span style='font-family:&quot;Avenir Next W01&quot;, &quot;Avenir Next W00&quot;, &quot;Avenir Next&quot;, Avenir, &quot;Helvetica Neue&quot;, Helvetica, Arial, sans-serif; font-size:17px;'>a </span><span style='font-family:&quot;Avenir Next W01&quot;, &quot;Avenir Next W00&quot;, &quot;Avenir Next&quot;, Avenir, &quot;Helvetica Neue&quot;, Helvetica, Arial, sans-serif; font-size:17px;'>feature to get the name of the waterway (if available).  The name of the waterway will display by default at large scales (e.g. Street level of 1:5k scale).  Labels can be turned off in your map if you prefer.</span></div></div><div style='font-family:&quot;Avenir Next W01&quot;, &quot;Avenir Next W00&quot;, &quot;Avenir Next&quot;, Avenir, &quot;Helvetica Neue&quot;, sans-serif; font-size:16px;'><span style='font-family:&quot;Avenir Next W01&quot;, &quot;Avenir Next W00&quot;, &quot;Avenir Next&quot;, Avenir, &quot;Helvetica Neue&quot;, Helvetica, Arial, sans-serif; font-size:17px;'><br /></span></div><div style='font-family:&quot;Avenir Next W01&quot;, &quot;Avenir Next W00&quot;, &quot;Avenir Next&quot;, Avenir, &quot;Helvetica Neue&quot;, sans-serif; font-size:16px;'><span style='font-family:&quot;Avenir Next W01&quot;, &quot;Avenir Next W00&quot;, &quot;Avenir Next&quot;, Avenir, &quot;Helvetica Neue&quot;, Helvetica, Arial, sans-serif; font-size:17px;'><b>Create New Layer</b></span></div><div style='font-family:&quot;Avenir Next W01&quot;, &quot;Avenir Next W00&quot;, &quot;Avenir Next&quot;, Avenir, &quot;Helvetica Neue&quot;, sans-serif; font-size:16px;'><span style='font-family:&quot;Avenir Next W01&quot;, &quot;Avenir Next W00&quot;, &quot;Avenir Next&quot;, Avenir, &quot;Helvetica Neue&quot;, Helvetica, Arial, sans-serif; font-size:17px;'>If you would like to create a more focused version of this waterway layer displaying just one or two </span><span style='font-family:&quot;Avenir Next W01&quot;, &quot;Avenir Next W00&quot;, &quot;Avenir Next&quot;, Avenir, &quot;Helvetica Neue&quot;, Helvetica, Arial, sans-serif; font-size:17px;'>waterway </span><span style='font-family:&quot;Avenir Next W01&quot;, &quot;Avenir Next W00&quot;, &quot;Avenir Next&quot;, Avenir, &quot;Helvetica Neue&quot;, Helvetica, Arial, sans-serif; font-size:17px;'>types, you can do that easily!  Just add the layer to a map, copy the layer in the content window, add a filter to the new layer (e.g. </span><span style='font-family:&quot;Avenir Next W01&quot;, &quot;Avenir Next W00&quot;, &quot;Avenir Next&quot;, Avenir, &quot;Helvetica Neue&quot;, Helvetica, Arial, sans-serif; font-size:17px;'>waterway </span><span style='font-family:&quot;Avenir Next W01&quot;, &quot;Avenir Next W00&quot;, &quot;Avenir Next&quot;, Avenir, &quot;Helvetica Neue&quot;, Helvetica, Arial, sans-serif; font-size:17px;'>is dam), rename the layer as appropriate, and save layer.  You can also change the layer symbols or popup if you like.  Esri may publish a few such layers (e.g. streams and rivers) that are ready to use, but not for every type of waterway.</span></div><div style='font-family:&quot;Avenir Next W01&quot;, &quot;Avenir Next W00&quot;, &quot;Avenir Next&quot;, Avenir, &quot;Helvetica Neue&quot;, sans-serif; font-size:16px;'><span style='font-family:&quot;Avenir Next W01&quot;, &quot;Avenir Next W00&quot;, &quot;Avenir Next&quot;, Avenir, &quot;Helvetica Neue&quot;, Helvetica, Arial, sans-serif; font-size:17px;'><br /></span></div><div style='font-family:&quot;Avenir Next W01&quot;, &quot;Avenir Next W00&quot;, &quot;Avenir Next&quot;, Avenir, &quot;Helvetica Neue&quot;, sans-serif; font-size:16px;'><span style='font-family:&quot;Avenir Next W01&quot;, &quot;Avenir Next W00&quot;, &quot;Avenir Next&quot;, Avenir, &quot;Helvetica Neue&quot;, Helvetica, Arial, sans-serif; font-size:17px;'><b><i>Important Note</i></b>: if you do create a new layer, it should be provided under the same Terms of Use and include the same Credits as this layer.  You can copy and paste the Terms of Use and Credits info below in the new Item page as needed.</span></div>",
			"keyword": [
				"osm",
				"OpenStreetMap",
				"waterway",
				"Australia",
				"Oceania",
				"New Zealand",
				"water",
				"river",
				"stream",
				"American Samoa",
				"Cook Islands",
				"Fed States of Micronesia",
				"Fiji",
				"French Polynesia",
				"Guam",
				"Kiribati",
				"Marshall Islands",
				"Nauru",
				"New Caledonia",
				"Niue",
				"North Mariana Islands",
				"Palau",
				"Papua New Guinea",
				"Pitcairn Islands",
				"Samoa",
				"Solomon Islands",
				"Tokelau",
				"Tonga",
				"Tuvalu",
				"Vanuatu",
				"Wallis and Futuna"
			],
			"issued": "2021-04-30T22:17:13.000Z",
			"modified": "2026-11-11T14:41:14.480Z",
			"publisher": {
				"name": "{{source}}"
			},
			"contactPoint": {
				"@type": "vcard:Contact",
				"fn": "smoore3_osm",
				"hasEmail": "{{orgContactEmail}}"
			},
			"accessLevel": "public",
			"spatial": "180.0000,-78.1668,-180.0000,80.9902",
			"license": "https://opendatacommons.org/licenses/odbl/summary",
			"distribution": [
				{
					"@type": "dcat:Distribution",
					"title": "ArcGIS Hub Dataset",
					"format": "Web Page",
					"mediaType": "text/html",
					"accessURL": "https://www.pacificgeoportal.com/datasets/76659f9ea5bf4761b263ffe55f976d1a_0"
				},
				{
					"@type": "dcat:Distribution",
					"title": "ArcGIS GeoService",
					"format": "ArcGIS GeoServices REST API",
					"mediaType": "application/json",
					"accessURL": "https://services-ap1.arcgis.com/iA7fZQOnjY9D67Zx/arcgis/rest/services/OSM_AU_Waterways/FeatureServer/0"
				},
				{
					"@type": "dcat:Distribution",
					"title": "CSV",
					"format": "CSV",
					"mediaType": "text/csv",
					"accessURL": "https://www.pacificgeoportal.com/api/download/v1/items/76659f9ea5bf4761b263ffe55f976d1a/csv?layers=0"
				},
				{
					"@type": "dcat:Distribution",
					"title": "Shapefile",
					"format": "ZIP",
					"mediaType": "application/zip",
					"accessURL": "https://www.pacificgeoportal.com/api/download/v1/items/76659f9ea5bf4761b263ffe55f976d1a/shapefile?layers=0"
				},
				{
					"@type": "dcat:Distribution",
					"title": "GeoJSON",
					"format": "GeoJSON",
					"mediaType": "application/vnd.geo+json",
					"accessURL": "https://www.pacificgeoportal.com/api/download/v1/items/76659f9ea5bf4761b263ffe55f976d1a/geojson?layers=0"
				},
				{
					"@type": "dcat:Distribution",
					"title": "KML",
					"format": "KML",
					"mediaType": "application/vnd.google-earth.kml+xml",
					"accessURL": "https://www.pacificgeoportal.com/api/download/v1/items/76659f9ea5bf4761b263ffe55f976d1a/kml?layers=0"
				}
			],
			"theme": [
				"geospatial"
			]
		},
		{
			"@type": "dcat:Dataset",
			"identifier": "https://www.arcgis.com/home/item.html?id=673845b787364a059cdeaa733882505d&sublayer=0",
			"landingPage": "https://www.pacificgeoportal.com/datasets/673845b787364a059cdeaa733882505d_0",
			"title": "OpenStreetMap Landuse Areas for Australia and Oceania",
			"description": "<span style='font-family:&quot;Avenir Next W01&quot;, &quot;Avenir Next W00&quot;, &quot;Avenir Next&quot;, Avenir, &quot;Helvetica Neue&quot;, sans-serif; font-size:17px;'>This feature layer provides access to OpenStreetMap (OSM) </span><span style='font-family:&quot;Avenir Next W01&quot;, &quot;Avenir Next W00&quot;, &quot;Avenir Next&quot;, Avenir, &quot;Helvetica Neue&quot;, sans-serif; font-size:16px;'>landuse </span><span style='font-family:&quot;Avenir Next W01&quot;, &quot;Avenir Next W00&quot;, &quot;Avenir Next&quot;, Avenir, &quot;Helvetica Neue&quot;, sans-serif; font-size:17px;'>areas </span><font style='font-family:&quot;Avenir Next W01&quot;, &quot;Avenir Next W00&quot;, &quot;Avenir Next&quot;, Avenir, &quot;Helvetica Neue&quot;, sans-serif; font-size:16px;'><span style='font-family:inherit; font-size:17px;'>data for Australia and Oceania, which is </span></font><b>updated every 15 minutes</b><font style='font-family:&quot;Avenir Next W01&quot;, &quot;Avenir Next W00&quot;, &quot;Avenir Next&quot;, Avenir, &quot;Helvetica Neue&quot;, sans-serif; font-size:16px;'><span style='font-family:inherit; font-size:17px;'> with the latest edits. This </span></font><a href='https://doc.arcgis.com/en/arcgis-online/share-maps/about-sharing-feature-layer-data-as-copies.htm' rel='nofollow ugc' style='color:rgb(0, 121, 193); font-family:&quot;Avenir Next W01&quot;, &quot;Avenir Next W00&quot;, &quot;Avenir Next&quot;, Avenir, &quot;Helvetica Neue&quot;, sans-serif; font-size:16px; text-decoration-line:none;' target='_blank'>hosted feature layer view</a><span style='font-family:&quot;Avenir Next W01&quot;, &quot;Avenir Next W00&quot;, &quot;Avenir Next&quot;, Avenir, &quot;Helvetica Neue&quot;, sans-serif; font-size:17px;'> is referencing a hosted feature layer of OSM polygon (closed way) data in ArcGIS Online that is updated with minutely diffs from the OSM planet file.  This feature </span><span style='font-family:&quot;Avenir Next W01&quot;, &quot;Avenir Next W00&quot;, &quot;Avenir Next&quot;, Avenir, &quot;Helvetica Neue&quot;, sans-serif; font-size:17px;'>layer view</span><span style='font-family:&quot;Avenir Next W01&quot;, &quot;Avenir Next W00&quot;, &quot;Avenir Next&quot;, Avenir, &quot;Helvetica Neue&quot;, sans-serif; font-size:17px;'> includes </span><span style='font-family:&quot;Avenir Next W01&quot;, &quot;Avenir Next W00&quot;, &quot;Avenir Next&quot;, Avenir, &quot;Helvetica Neue&quot;, sans-serif; font-size:16px;'>landuse </span><span style='font-family:&quot;Avenir Next W01&quot;, &quot;Avenir Next W00&quot;, &quot;Avenir Next&quot;, Avenir, &quot;Helvetica Neue&quot;, sans-serif; font-size:17px;'>features defined as a query against the hosted feature layer (i.e. </span><span style='font-family:&quot;Avenir Next W01&quot;, &quot;Avenir Next W00&quot;, &quot;Avenir Next&quot;, Avenir, &quot;Helvetica Neue&quot;, sans-serif; font-size:16px;'>landuse </span><span style='font-family:&quot;Avenir Next W01&quot;, &quot;Avenir Next W00&quot;, &quot;Avenir Next&quot;, Avenir, &quot;Helvetica Neue&quot;, sans-serif; font-size:17px;'>is not blank).</span><div style='font-family:&quot;Avenir Next W01&quot;, &quot;Avenir Next W00&quot;, &quot;Avenir Next&quot;, Avenir, &quot;Helvetica Neue&quot;, sans-serif; font-size:16px;'><font style='font-family:inherit;'><span style='font-family:inherit; font-size:17px;'><br /></span></font></div><div style='font-family:&quot;Avenir Next W01&quot;, &quot;Avenir Next W00&quot;, &quot;Avenir Next&quot;, Avenir, &quot;Helvetica Neue&quot;, sans-serif; font-size:16px;'><font style='font-family:inherit;'><span style='font-family:inherit; font-size:17px;'>In OSM, </span></font><font style='font-family:inherit;'><font style='font-family:inherit;'><font style='font-family:inherit;'>landuse </font><font style='font-family:inherit;'><font style='font-family:inherit;'><font style='font-family:inherit;'><span style='font-family:inherit; font-size:17px;'>describes the primary use of land by humans</span></font><font style='font-family:inherit;'><span style='font-family:inherit; font-size:17px;'>.  These features are identified with a </span></font></font></font></font></font><font style='font-family:inherit;'><font style='font-family:inherit;'><a href='https://wiki.openstreetmap.org/wiki/Key:landuse' rel='nofollow ugc' style='color:rgb(0, 121, 193); font-family:inherit; text-decoration-line:none;' target='_blank'>landuse tag</a><span style='font-family:inherit; font-size:17px;'>.  There are thousands of different tag values for </span></font><font style='font-family:inherit;'>landuse <span style='font-family:inherit; font-size:17px;'>used in the OSM database.  In this feature layer, unique symbols are used for several of the most popular </span></font><font style='font-family:inherit;'>landuse <span style='font-family:inherit; font-size:17px;'>types, while lesser used types are grouped in an &quot;other&quot; category.</span></font><br /></font><div style='font-family:inherit;'><span style='font-family:&quot;Avenir Next W01&quot;, &quot;Avenir Next W00&quot;, &quot;Avenir Next&quot;, Avenir, &quot;Helvetica Neue&quot;, Helvetica, Arial, sans-serif; font-size:17px;'><br /></span></div><div style='font-family:inherit;'><span style='font-family:&quot;Avenir Next W01&quot;, &quot;Avenir Next W00&quot;, &quot;Avenir Next&quot;, Avenir, &quot;Helvetica Neue&quot;, Helvetica, Arial, sans-serif; font-size:17px;'>Zoom in to large scales (e.g. City level or 1:80k scale) to see the </span><span style='font-family:&quot;Avenir Next&quot;, Avenir, &quot;Helvetica Neue&quot;, Helvetica, Arial, sans-serif;'>landuse</span><span style='font-family:&quot;Avenir Next&quot;, Avenir, &quot;Helvetica Neue&quot;, Helvetica, Arial, sans-serif;'> </span><span style='font-family:&quot;Avenir Next&quot;, Avenir, &quot;Helvetica Neue&quot;, Helvetica, Arial, sans-serif; font-size:17px;'>area </span><span style='font-family:&quot;Avenir Next W01&quot;, &quot;Avenir Next W00&quot;, &quot;Avenir Next&quot;, Avenir, &quot;Helvetica Neue&quot;, Helvetica, Arial, sans-serif; font-size:17px;'>features display.  </span><span style='font-family:&quot;Avenir Next W01&quot;, &quot;Avenir Next W00&quot;, &quot;Avenir Next&quot;, Avenir, &quot;Helvetica Neue&quot;, Helvetica, Arial, sans-serif; font-size:17px;'>You can click on </span><span style='font-family:&quot;Avenir Next W01&quot;, &quot;Avenir Next W00&quot;, &quot;Avenir Next&quot;, Avenir, &quot;Helvetica Neue&quot;, Helvetica, Arial, sans-serif; font-size:17px;'>a </span><span style='font-family:&quot;Avenir Next W01&quot;, &quot;Avenir Next W00&quot;, &quot;Avenir Next&quot;, Avenir, &quot;Helvetica Neue&quot;, Helvetica, Arial, sans-serif; font-size:17px;'>feature to get the name of the </span><span style='font-family:&quot;Avenir Next&quot;, Avenir, &quot;Helvetica Neue&quot;, Helvetica, Arial, sans-serif;'>landuse</span><span style='font-family:&quot;Avenir Next&quot;, Avenir, &quot;Helvetica Neue&quot;, Helvetica, Arial, sans-serif;'> </span><span style='font-family:&quot;Avenir Next&quot;, Avenir, &quot;Helvetica Neue&quot;, Helvetica, Arial, sans-serif; font-size:17px;'>area </span><span style='font-family:&quot;Avenir Next W01&quot;, &quot;Avenir Next W00&quot;, &quot;Avenir Next&quot;, Avenir, &quot;Helvetica Neue&quot;, Helvetica, Arial, sans-serif; font-size:17px;'>(if available).  The name of the </span><span style='font-family:&quot;Avenir Next&quot;, Avenir, &quot;Helvetica Neue&quot;, Helvetica, Arial, sans-serif;'>landuse</span><span style='font-family:&quot;Avenir Next&quot;, Avenir, &quot;Helvetica Neue&quot;, Helvetica, Arial, sans-serif;'> </span><span style='font-family:&quot;Avenir Next&quot;, Avenir, &quot;Helvetica Neue&quot;, Helvetica, Arial, sans-serif; font-size:17px;'>area </span><span style='font-family:&quot;Avenir Next W01&quot;, &quot;Avenir Next W00&quot;, &quot;Avenir Next&quot;, Avenir, &quot;Helvetica Neue&quot;, Helvetica, Arial, sans-serif; font-size:17px;'>will display by default at large scales (e.g. Street level of 1:5k scale).  Labels can be turned off in your map if you prefer.</span></div></div><div style='font-family:&quot;Avenir Next W01&quot;, &quot;Avenir Next W00&quot;, &quot;Avenir Next&quot;, Avenir, &quot;Helvetica Neue&quot;, sans-serif; font-size:16px;'><span style='font-family:&quot;Avenir Next W01&quot;, &quot;Avenir Next W00&quot;, &quot;Avenir Next&quot;, Avenir, &quot;Helvetica Neue&quot;, Helvetica, Arial, sans-serif; font-size:17px;'><br /></span></div><div style='font-family:&quot;Avenir Next W01&quot;, &quot;Avenir Next W00&quot;, &quot;Avenir Next&quot;, Avenir, &quot;Helvetica Neue&quot;, sans-serif; font-size:16px;'><span style='font-family:&quot;Avenir Next W01&quot;, &quot;Avenir Next W00&quot;, &quot;Avenir Next&quot;, Avenir, &quot;Helvetica Neue&quot;, Helvetica, Arial, sans-serif; font-size:17px;'><b>Create New Layer</b></span></div><div style='font-family:&quot;Avenir Next W01&quot;, &quot;Avenir Next W00&quot;, &quot;Avenir Next&quot;, Avenir, &quot;Helvetica Neue&quot;, sans-serif; font-size:16px;'><span style='font-family:&quot;Avenir Next W01&quot;, &quot;Avenir Next W00&quot;, &quot;Avenir Next&quot;, Avenir, &quot;Helvetica Neue&quot;, Helvetica, Arial, sans-serif; font-size:17px;'>If you would like to create a more focused version of this </span><span style='font-family:&quot;Avenir Next&quot;, Avenir, &quot;Helvetica Neue&quot;, Helvetica, Arial, sans-serif;'>landuse</span><span style='font-family:&quot;Avenir Next&quot;, Avenir, &quot;Helvetica Neue&quot;, Helvetica, Arial, sans-serif;'> </span><span style='font-family:&quot;Avenir Next&quot;, Avenir, &quot;Helvetica Neue&quot;, Helvetica, Arial, sans-serif; font-size:17px;'>areas </span><span style='font-family:&quot;Avenir Next W01&quot;, &quot;Avenir Next W00&quot;, &quot;Avenir Next&quot;, Avenir, &quot;Helvetica Neue&quot;, Helvetica, Arial, sans-serif; font-size:17px;'>layer displaying just one or two </span><span style='font-family:&quot;Avenir Next&quot;, Avenir, &quot;Helvetica Neue&quot;, Helvetica, Arial, sans-serif;'>landuse</span><span style='font-family:&quot;Avenir Next&quot;, Avenir, &quot;Helvetica Neue&quot;, Helvetica, Arial, sans-serif;'> </span><span style='font-family:&quot;Avenir Next W01&quot;, &quot;Avenir Next W00&quot;, &quot;Avenir Next&quot;, Avenir, &quot;Helvetica Neue&quot;, Helvetica, Arial, sans-serif; font-size:17px;'>types, you can do that easily!  Just add the layer to a map, copy the layer in the content window, add a filter to the new layer (e.g. </span><span style='font-family:&quot;Avenir Next&quot;, Avenir, &quot;Helvetica Neue&quot;, Helvetica, Arial, sans-serif;'>landuse</span><span style='font-family:&quot;Avenir Next&quot;, Avenir, &quot;Helvetica Neue&quot;, Helvetica, Arial, sans-serif;'> </span><span style='font-family:&quot;Avenir Next W01&quot;, &quot;Avenir Next W00&quot;, &quot;Avenir Next&quot;, Avenir, &quot;Helvetica Neue&quot;, Helvetica, Arial, sans-serif; font-size:17px;'>is commercial), rename the layer as appropriate, and save layer.  You can also change the layer symbols or popup if you like.  Esri may publish a few such layers (e.g. residential, forest) that are ready to use, but not for every type of </span><span style='font-family:&quot;Avenir Next&quot;, Avenir, &quot;Helvetica Neue&quot;, Helvetica, Arial, sans-serif;'>landuse</span><span style='font-family:&quot;Avenir Next&quot;, Avenir, &quot;Helvetica Neue&quot;, Helvetica, Arial, sans-serif;'> </span><span style='font-family:&quot;Avenir Next&quot;, Avenir, &quot;Helvetica Neue&quot;, Helvetica, Arial, sans-serif; font-size:17px;'>area</span><span style='font-family:&quot;Avenir Next W01&quot;, &quot;Avenir Next W00&quot;, &quot;Avenir Next&quot;, Avenir, &quot;Helvetica Neue&quot;, Helvetica, Arial, sans-serif; font-size:17px;'>.</span></div><div style='font-family:&quot;Avenir Next W01&quot;, &quot;Avenir Next W00&quot;, &quot;Avenir Next&quot;, Avenir, &quot;Helvetica Neue&quot;, sans-serif; font-size:16px;'><span style='font-family:&quot;Avenir Next W01&quot;, &quot;Avenir Next W00&quot;, &quot;Avenir Next&quot;, Avenir, &quot;Helvetica Neue&quot;, Helvetica, Arial, sans-serif; font-size:17px;'><br /></span></div><div style='font-family:&quot;Avenir Next W01&quot;, &quot;Avenir Next W00&quot;, &quot;Avenir Next&quot;, Avenir, &quot;Helvetica Neue&quot;, sans-serif; font-size:16px;'><span style='font-family:&quot;Avenir Next W01&quot;, &quot;Avenir Next W00&quot;, &quot;Avenir Next&quot;, Avenir, &quot;Helvetica Neue&quot;, Helvetica, Arial, sans-serif; font-size:17px;'><b><i>Important Note</i></b>: if you do create a new layer, it should be provided under the same Terms of Use and include the same Credits as this layer.  You can copy and paste the Terms of Use and Credits info below in the new Item page as needed.</span></div>",
			"keyword": [
				"osm",
				"landuse",
				"Australia",
				"Oceania",
				"OpenStreetMap",
				"New Zealand",
				"American Samoa",
				"Cook Islands",
				"Fed States of Micronesia",
				"Fiji",
				"French Polynesia",
				"Guam",
				"Kiribati",
				"Marshall Islands",
				"Nauru",
				"New Caledonia",
				"Niue",
				"North Mariana Islands",
				"Palau",
				"Papua New Guinea",
				"Pitcairn Islands",
				"Samoa",
				"Solomon Islands",
				"Tokelau",
				"Tonga",
				"Tuvalu",
				"Vanuatu",
				"Wallis and Futuna"
			],
			"issued": "2021-04-29T16:01:35.000Z",
			"modified": "2026-11-11T13:31:10.002Z",
			"publisher": {
				"name": "{{source}}"
			},
			"contactPoint": {
				"@type": "vcard:Contact",
				"fn": "smoore3_osm",
				"hasEmail": "{{orgContactEmail}}"
			},
			"accessLevel": "public",
			"spatial": "180.0000,-58.4495,-180.0000,53.9599",
			"license": "https://opendatacommons.org/licenses/odbl/summary",
			"distribution": [
				{
					"@type": "dcat:Distribution",
					"title": "ArcGIS Hub Dataset",
					"format": "Web Page",
					"mediaType": "text/html",
					"accessURL": "https://www.pacificgeoportal.com/datasets/673845b787364a059cdeaa733882505d_0"
				},
				{
					"@type": "dcat:Distribution",
					"title": "ArcGIS GeoService",
					"format": "ArcGIS GeoServices REST API",
					"mediaType": "application/json",
					"accessURL": "https://services-ap1.arcgis.com/iA7fZQOnjY9D67Zx/arcgis/rest/services/OSM_AU_Landuse/FeatureServer/0"
				},
				{
					"@type": "dcat:Distribution",
					"title": "CSV",
					"format": "CSV",
					"mediaType": "text/csv",
					"accessURL": "https://www.pacificgeoportal.com/api/download/v1/items/673845b787364a059cdeaa733882505d/csv?layers=0"
				},
				{
					"@type": "dcat:Distribution",
					"title": "Shapefile",
					"format": "ZIP",
					"mediaType": "application/zip",
					"accessURL": "https://www.pacificgeoportal.com/api/download/v1/items/673845b787364a059cdeaa733882505d/shapefile?layers=0"
				},
				{
					"@type": "dcat:Distribution",
					"title": "GeoJSON",
					"format": "GeoJSON",
					"mediaType": "application/vnd.geo+json",
					"accessURL": "https://www.pacificgeoportal.com/api/download/v1/items/673845b787364a059cdeaa733882505d/geojson?layers=0"
				},
				{
					"@type": "dcat:Distribution",
					"title": "KML",
					"format": "KML",
					"mediaType": "application/vnd.google-earth.kml+xml",
					"accessURL": "https://www.pacificgeoportal.com/api/download/v1/items/673845b787364a059cdeaa733882505d/kml?layers=0"
				}
			],
			"theme": [
				"geospatial"
			]
		},
		{
			"@type": "dcat:Dataset",
			"identifier": "https://www.arcgis.com/home/item.html?id=b0ee523c77d446f293c5e6964b23e6f5&sublayer=0",
			"landingPage": "https://www.pacificgeoportal.com/datasets/b0ee523c77d446f293c5e6964b23e6f5_0",
			"title": "OpenStreetMap Leisure Areas for Australia and Oceania",
			"description": "<span style='font-family:&quot;Avenir Next W01&quot;, &quot;Avenir Next W00&quot;, &quot;Avenir Next&quot;, Avenir, &quot;Helvetica Neue&quot;, sans-serif; font-size:17px;'>This feature layer provides access to OpenStreetMap (OSM) </span><span style='font-family:&quot;Avenir Next W01&quot;, &quot;Avenir Next W00&quot;, &quot;Avenir Next&quot;, Avenir, &quot;Helvetica Neue&quot;, sans-serif; font-size:17px;'>leisure areas </span><font style='font-family:&quot;Avenir Next W01&quot;, &quot;Avenir Next W00&quot;, &quot;Avenir Next&quot;, Avenir, &quot;Helvetica Neue&quot;, sans-serif; font-size:16px;'><span style='font-family:inherit; font-size:17px;'>data for Australia and Oceania, which is </span></font><b>updated every 15 minutes</b><font style='font-family:&quot;Avenir Next W01&quot;, &quot;Avenir Next W00&quot;, &quot;Avenir Next&quot;, Avenir, &quot;Helvetica Neue&quot;, sans-serif; font-size:16px;'><span style='font-family:inherit; font-size:17px;'> with the latest edits. This </span></font><a href='https://doc.arcgis.com/en/arcgis-online/share-maps/about-sharing-feature-layer-data-as-copies.htm' rel='nofollow ugc' style='color:rgb(0, 121, 193); font-family:&quot;Avenir Next W01&quot;, &quot;Avenir Next W00&quot;, &quot;Avenir Next&quot;, Avenir, &quot;Helvetica Neue&quot;, sans-serif; font-size:16px; text-decoration-line:none;' target='_blank'>hosted feature layer view</a><span style='font-family:&quot;Avenir Next W01&quot;, &quot;Avenir Next W00&quot;, &quot;Avenir Next&quot;, Avenir, &quot;Helvetica Neue&quot;, sans-serif; font-size:17px;'> is referencing a hosted feature layer of OSM polygon (closed way) data in ArcGIS Online that is updated with minutely diffs from the OSM planet file.  This feature </span><span style='font-family:&quot;Avenir Next W01&quot;, &quot;Avenir Next W00&quot;, &quot;Avenir Next&quot;, Avenir, &quot;Helvetica Neue&quot;, sans-serif; font-size:17px;'>layer view</span><span style='font-family:&quot;Avenir Next W01&quot;, &quot;Avenir Next W00&quot;, &quot;Avenir Next&quot;, Avenir, &quot;Helvetica Neue&quot;, sans-serif; font-size:17px;'> includes leisure </span><span style='font-family:&quot;Avenir Next W01&quot;, &quot;Avenir Next W00&quot;, &quot;Avenir Next&quot;, Avenir, &quot;Helvetica Neue&quot;, sans-serif; font-size:17px;'>features defined as a query against the hosted feature layer (i.e. </span><span style='font-family:&quot;Avenir Next W01&quot;, &quot;Avenir Next W00&quot;, &quot;Avenir Next&quot;, Avenir, &quot;Helvetica Neue&quot;, sans-serif; font-size:17px;'>leisure </span><span style='font-family:&quot;Avenir Next W01&quot;, &quot;Avenir Next W00&quot;, &quot;Avenir Next&quot;, Avenir, &quot;Helvetica Neue&quot;, sans-serif; font-size:17px;'>is not blank).</span><div style='font-family:&quot;Avenir Next W01&quot;, &quot;Avenir Next W00&quot;, &quot;Avenir Next&quot;, Avenir, &quot;Helvetica Neue&quot;, sans-serif; font-size:16px;'><font style='font-family:inherit;'><span style='font-family:inherit; font-size:17px;'><br /></span></font></div><div style='font-family:&quot;Avenir Next W01&quot;, &quot;Avenir Next W00&quot;, &quot;Avenir Next&quot;, Avenir, &quot;Helvetica Neue&quot;, sans-serif; font-size:16px;'><font style='font-family:inherit;'><span style='font-family:inherit; font-size:17px;'>In OSM, a </span></font><font style='font-family:inherit;'><font style='font-family:inherit;'><font style='font-family:inherit;'><span style='font-family:inherit; font-size:17px;'>leisure area </span><span style='font-family:inherit; font-size:17px;'>is a </span></font><font style='font-family:inherit;'><font style='font-family:inherit;'><span style='font-family:inherit; font-size:17px;'>place where people go in their spare time</span></font><font style='font-family:inherit;'><span style='font-family:inherit; font-size:17px;'>.  These features are identified with a </span></font></font></font></font><font style='font-family:inherit;'><a href='https://wiki.openstreetmap.org/wiki/Key:leisure' rel='nofollow ugc' style='color:rgb(0, 121, 193); font-family:inherit; text-decoration-line:none;' target='_blank'>leisure tag</a><font style='font-family:inherit;'><span style='font-family:inherit; font-size:17px;'>.  There are thousands of different tag values for </span></font><span style='font-family:inherit; font-size:17px;'>leisure </span><font style='font-family:inherit;'><span style='font-family:inherit; font-size:17px;'>used in the OSM database.  In this feature layer, unique symbols are used for several of the most popular </span></font><span style='font-family:inherit; font-size:17px;'>leisure </span><font style='font-family:inherit;'><span style='font-family:inherit; font-size:17px;'>types, while lesser used types are grouped in an &quot;other&quot; category.</span></font><br /></font><div style='font-family:inherit;'><span style='font-family:&quot;Avenir Next W01&quot;, &quot;Avenir Next W00&quot;, &quot;Avenir Next&quot;, Avenir, &quot;Helvetica Neue&quot;, Helvetica, Arial, sans-serif; font-size:17px;'><br /></span></div><div style='font-family:inherit;'><span style='font-family:&quot;Avenir Next W01&quot;, &quot;Avenir Next W00&quot;, &quot;Avenir Next&quot;, Avenir, &quot;Helvetica Neue&quot;, Helvetica, Arial, sans-serif; font-size:17px;'>Zoom in to large scales (e.g. </span><span style='font-family:&quot;Avenir Next W01&quot;, &quot;Avenir Next W00&quot;, &quot;Avenir Next&quot;, Avenir, &quot;Helvetica Neue&quot;, Helvetica, Arial, sans-serif; font-size:17px;'>City level or 1:80k scale</span><span style='font-family:&quot;Avenir Next W01&quot;, &quot;Avenir Next W00&quot;, &quot;Avenir Next&quot;, Avenir, &quot;Helvetica Neue&quot;, Helvetica, Arial, sans-serif; font-size:17px;'>) to see the </span><span style='font-family:&quot;Avenir Next&quot;, Avenir, &quot;Helvetica Neue&quot;, Helvetica, Arial, sans-serif; font-size:17px;'>leisure area </span><span style='font-family:&quot;Avenir Next W01&quot;, &quot;Avenir Next W00&quot;, &quot;Avenir Next&quot;, Avenir, &quot;Helvetica Neue&quot;, Helvetica, Arial, sans-serif; font-size:17px;'>features display.  </span><span style='font-family:&quot;Avenir Next W01&quot;, &quot;Avenir Next W00&quot;, &quot;Avenir Next&quot;, Avenir, &quot;Helvetica Neue&quot;, Helvetica, Arial, sans-serif; font-size:17px;'>You can click on a feature to get the name of the </span><span style='font-family:&quot;Avenir Next&quot;, Avenir, &quot;Helvetica Neue&quot;, Helvetica, Arial, sans-serif; font-size:17px;'>leisure area </span><span style='font-family:&quot;Avenir Next W01&quot;, &quot;Avenir Next W00&quot;, &quot;Avenir Next&quot;, Avenir, &quot;Helvetica Neue&quot;, Helvetica, Arial, sans-serif; font-size:17px;'>(if available).  The name of the </span><span style='font-family:&quot;Avenir Next&quot;, Avenir, &quot;Helvetica Neue&quot;, Helvetica, Arial, sans-serif; font-size:17px;'>leisure area </span><span style='font-family:&quot;Avenir Next W01&quot;, &quot;Avenir Next W00&quot;, &quot;Avenir Next&quot;, Avenir, &quot;Helvetica Neue&quot;, Helvetica, Arial, sans-serif; font-size:17px;'>will display by default at large scales (e.g. Street level of 1:5k scale).  Labels can be turned off in your map if you prefer.</span></div></div><div style='font-family:&quot;Avenir Next W01&quot;, &quot;Avenir Next W00&quot;, &quot;Avenir Next&quot;, Avenir, &quot;Helvetica Neue&quot;, sans-serif; font-size:16px;'><span style='font-family:&quot;Avenir Next W01&quot;, &quot;Avenir Next W00&quot;, &quot;Avenir Next&quot;, Avenir, &quot;Helvetica Neue&quot;, Helvetica, Arial, sans-serif; font-size:17px;'><br /></span></div><div style='font-family:&quot;Avenir Next W01&quot;, &quot;Avenir Next W00&quot;, &quot;Avenir Next&quot;, Avenir, &quot;Helvetica Neue&quot;, sans-serif; font-size:16px;'><span style='font-family:&quot;Avenir Next W01&quot;, &quot;Avenir Next W00&quot;, &quot;Avenir Next&quot;, Avenir, &quot;Helvetica Neue&quot;, Helvetica, Arial, sans-serif; font-size:17px;'><b>Create New Layer</b></span></div><div style='font-family:&quot;Avenir Next W01&quot;, &quot;Avenir Next W00&quot;, &quot;Avenir Next&quot;, Avenir, &quot;Helvetica Neue&quot;, sans-serif; font-size:16px;'><span style='font-family:&quot;Avenir Next W01&quot;, &quot;Avenir Next W00&quot;, &quot;Avenir Next&quot;, Avenir, &quot;Helvetica Neue&quot;, Helvetica, Arial, sans-serif; font-size:17px;'>If you would like to create a more focused version of this </span><span style='font-family:&quot;Avenir Next&quot;, Avenir, &quot;Helvetica Neue&quot;, Helvetica, Arial, sans-serif; font-size:17px;'>leisure areas </span><span style='font-family:&quot;Avenir Next W01&quot;, &quot;Avenir Next W00&quot;, &quot;Avenir Next&quot;, Avenir, &quot;Helvetica Neue&quot;, Helvetica, Arial, sans-serif; font-size:17px;'>layer displaying just one or two </span><span style='font-family:&quot;Avenir Next&quot;, Avenir, &quot;Helvetica Neue&quot;, Helvetica, Arial, sans-serif; font-size:17px;'>leisure </span><span style='font-family:&quot;Avenir Next W01&quot;, &quot;Avenir Next W00&quot;, &quot;Avenir Next&quot;, Avenir, &quot;Helvetica Neue&quot;, Helvetica, Arial, sans-serif; font-size:17px;'>types, you can do that easily!  Just add the layer to a map, copy the layer in the content window, add a filter to the new layer (e.g. </span><span style='font-family:&quot;Avenir Next&quot;, Avenir, &quot;Helvetica Neue&quot;, Helvetica, Arial, sans-serif; font-size:17px;'>leisure </span><span style='font-family:&quot;Avenir Next W01&quot;, &quot;Avenir Next W00&quot;, &quot;Avenir Next&quot;, Avenir, &quot;Helvetica Neue&quot;, Helvetica, Arial, sans-serif; font-size:17px;'>is stadium), rename the layer as appropriate, and save layer.  You can also change the layer symbols or popup if you like.  Esri may publish a few such layers (e.g. parks) that are ready to use, but not for every type of </span><span style='font-family:&quot;Avenir Next&quot;, Avenir, &quot;Helvetica Neue&quot;, Helvetica, Arial, sans-serif; font-size:17px;'>leisure area</span><span style='font-family:&quot;Avenir Next W01&quot;, &quot;Avenir Next W00&quot;, &quot;Avenir Next&quot;, Avenir, &quot;Helvetica Neue&quot;, Helvetica, Arial, sans-serif; font-size:17px;'>.</span></div><div style='font-family:&quot;Avenir Next W01&quot;, &quot;Avenir Next W00&quot;, &quot;Avenir Next&quot;, Avenir, &quot;Helvetica Neue&quot;, sans-serif; font-size:16px;'><span style='font-family:&quot;Avenir Next W01&quot;, &quot;Avenir Next W00&quot;, &quot;Avenir Next&quot;, Avenir, &quot;Helvetica Neue&quot;, Helvetica, Arial, sans-serif; font-size:17px;'><br /></span></div><div style='font-family:&quot;Avenir Next W01&quot;, &quot;Avenir Next W00&quot;, &quot;Avenir Next&quot;, Avenir, &quot;Helvetica Neue&quot;, sans-serif; font-size:16px;'><span style='font-family:&quot;Avenir Next W01&quot;, &quot;Avenir Next W00&quot;, &quot;Avenir Next&quot;, Avenir, &quot;Helvetica Neue&quot;, Helvetica, Arial, sans-serif; font-size:17px;'><b><i>Important Note</i></b>: if you do create a new layer, it should be provided under the same Terms of Use and include the same Credits as this layer.  You can copy and paste the Terms of Use and Credits info below in the new Item page as needed.</span></div>",
			"keyword": [
				"osm",
				"OpenStreetMap",
				"leisure",
				"Australia",
				"Oceania",
				"park",
				"pitch",
				"garden",
				"pool",
				"stadium",
				"New Zealand",
				"American Samoa",
				"Cook Islands",
				"Fed States of Micronesia",
				"Fiji",
				"French Polynesia",
				"Guam",
				"Kiribati",
				"Marshall Islands",
				"Nauru",
				"New Caledonia",
				"Niue",
				"North Mariana Islands",
				"Palau",
				"Papua New Guinea",
				"Pitcairn Islands",
				"Samoa",
				"Solomon Islands",
				"Tokelau",
				"Tonga",
				"Tuvalu",
				"Vanuatu",
				"Wallis and Futuna"
			],
			"issued": "2021-04-30T22:14:22.000Z",
			"modified": "2026-11-11T10:01:19.458Z",
			"publisher": {
				"name": "{{source}}"
			},
			"contactPoint": {
				"@type": "vcard:Contact",
				"fn": "smoore3_osm",
				"hasEmail": "{{orgContactEmail}}"
			},
			"accessLevel": "public",
			"spatial": "180.0000,-58.4495,-180.0000,53.9599",
			"license": "https://opendatacommons.org/licenses/odbl/summary",
			"distribution": [
				{
					"@type": "dcat:Distribution",
					"title": "ArcGIS Hub Dataset",
					"format": "Web Page",
					"mediaType": "text/html",
					"accessURL": "https://www.pacificgeoportal.com/datasets/b0ee523c77d446f293c5e6964b23e6f5_0"
				},
				{
					"@type": "dcat:Distribution",
					"title": "ArcGIS GeoService",
					"format": "ArcGIS GeoServices REST API",
					"mediaType": "application/json",
					"accessURL": "https://services-ap1.arcgis.com/iA7fZQOnjY9D67Zx/arcgis/rest/services/OSM_AU_Leisure/FeatureServer/0"
				},
				{
					"@type": "dcat:Distribution",
					"title": "CSV",
					"format": "CSV",
					"mediaType": "text/csv",
					"accessURL": "https://www.pacificgeoportal.com/api/download/v1/items/b0ee523c77d446f293c5e6964b23e6f5/csv?layers=0"
				},
				{
					"@type": "dcat:Distribution",
					"title": "Shapefile",
					"format": "ZIP",
					"mediaType": "application/zip",
					"accessURL": "https://www.pacificgeoportal.com/api/download/v1/items/b0ee523c77d446f293c5e6964b23e6f5/shapefile?layers=0"
				},
				{
					"@type": "dcat:Distribution",
					"title": "GeoJSON",
					"format": "GeoJSON",
					"mediaType": "application/vnd.geo+json",
					"accessURL": "https://www.pacificgeoportal.com/api/download/v1/items/b0ee523c77d446f293c5e6964b23e6f5/geojson?layers=0"
				},
				{
					"@type": "dcat:Distribution",
					"title": "KML",
					"format": "KML",
					"mediaType": "application/vnd.google-earth.kml+xml",
					"accessURL": "https://www.pacificgeoportal.com/api/download/v1/items/b0ee523c77d446f293c5e6964b23e6f5/kml?layers=0"
				}
			],
			"theme": [
				"geospatial"
			]
		},
		{
			"@type": "dcat:Dataset",
			"identifier": "https://www.arcgis.com/home/item.html?id=651512cac36c48ba95c88c380ff8fac5&sublayer=0",
			"landingPage": "https://www.pacificgeoportal.com/datasets/651512cac36c48ba95c88c380ff8fac5_0",
			"title": "OpenStreetMap Buildings for Australia and Oceania",
			"description": "<span style='font-family:&quot;Avenir Next W01&quot;, &quot;Avenir Next W00&quot;, &quot;Avenir Next&quot;, Avenir, &quot;Helvetica Neue&quot;, sans-serif; font-size:17px;'>This feature layer provides access to OpenStreetMap (OSM) </span><span style='font-family:&quot;Avenir Next W01&quot;, &quot;Avenir Next W00&quot;, &quot;Avenir Next&quot;, Avenir, &quot;Helvetica Neue&quot;, sans-serif; font-size:16px;'>building</span><span style='font-family:&quot;Avenir Next W01&quot;, &quot;Avenir Next W00&quot;, &quot;Avenir Next&quot;, Avenir, &quot;Helvetica Neue&quot;, sans-serif; font-size:17px;'>s </span><font style='font-family:&quot;Avenir Next W01&quot;, &quot;Avenir Next W00&quot;, &quot;Avenir Next&quot;, Avenir, &quot;Helvetica Neue&quot;, sans-serif; font-size:16px;'><span style='font-family:inherit; font-size:17px;'>data for Australia and Oceania, which is </span></font><b>updated every 1 minute</b><font style='font-family:&quot;Avenir Next W01&quot;, &quot;Avenir Next W00&quot;, &quot;Avenir Next&quot;, Avenir, &quot;Helvetica Neue&quot;, sans-serif; font-size:16px;'><span style='font-family:inherit; font-size:17px;'> with the latest edits. This </span></font><a href='https://doc.arcgis.com/en/arcgis-online/share-maps/about-sharing-feature-layer-data-as-copies.htm' rel='nofollow ugc' style='color:rgb(0, 121, 193); font-family:&quot;Avenir Next W01&quot;, &quot;Avenir Next W00&quot;, &quot;Avenir Next&quot;, Avenir, &quot;Helvetica Neue&quot;, sans-serif; font-size:16px; text-decoration-line:none;' target='_blank'>hosted feature layer view</a><span style='font-family:&quot;Avenir Next W01&quot;, &quot;Avenir Next W00&quot;, &quot;Avenir Next&quot;, Avenir, &quot;Helvetica Neue&quot;, sans-serif; font-size:17px;'> is referencing a hosted feature layer of OSM polygon (closed way) data in ArcGIS Online that is updated with minutely diffs from the OSM planet file.  This feature </span><span style='font-family:&quot;Avenir Next W01&quot;, &quot;Avenir Next W00&quot;, &quot;Avenir Next&quot;, Avenir, &quot;Helvetica Neue&quot;, sans-serif; font-size:17px;'>layer view</span><span style='font-family:&quot;Avenir Next W01&quot;, &quot;Avenir Next W00&quot;, &quot;Avenir Next&quot;, Avenir, &quot;Helvetica Neue&quot;, sans-serif; font-size:17px;'> includes </span><span style='font-family:&quot;Avenir Next W01&quot;, &quot;Avenir Next W00&quot;, &quot;Avenir Next&quot;, Avenir, &quot;Helvetica Neue&quot;, sans-serif; font-size:16px;'>building </span><span style='font-family:&quot;Avenir Next W01&quot;, &quot;Avenir Next W00&quot;, &quot;Avenir Next&quot;, Avenir, &quot;Helvetica Neue&quot;, sans-serif; font-size:17px;'>features defined as a query against the hosted feature layer (i.e. </span><span style='font-family:&quot;Avenir Next W01&quot;, &quot;Avenir Next W00&quot;, &quot;Avenir Next&quot;, Avenir, &quot;Helvetica Neue&quot;, sans-serif; font-size:16px;'>building </span><span style='font-family:&quot;Avenir Next W01&quot;, &quot;Avenir Next W00&quot;, &quot;Avenir Next&quot;, Avenir, &quot;Helvetica Neue&quot;, sans-serif; font-size:17px;'>is not blank).</span><div style='font-family:&quot;Avenir Next W01&quot;, &quot;Avenir Next W00&quot;, &quot;Avenir Next&quot;, Avenir, &quot;Helvetica Neue&quot;, sans-serif; font-size:16px;'><font style='font-family:inherit;'><span style='font-family:inherit; font-size:17px;'><br /></span></font></div><div style='font-family:&quot;Avenir Next W01&quot;, &quot;Avenir Next W00&quot;, &quot;Avenir Next&quot;, Avenir, &quot;Helvetica Neue&quot;, sans-serif; font-size:16px;'><font style='font-family:inherit;'><span style='font-family:inherit; font-size:17px;'>In OSM, </span></font><font style='font-family:inherit;'><font style='font-family:inherit;'><font style='font-family:inherit;'><font style='font-family:inherit;'><font style='font-family:inherit;'><span style='font-family:inherit; font-size:17px;'>a building is a man-made structure with a roof, standing more or less permanently in one place</span></font><font style='font-family:inherit;'><span style='font-family:inherit; font-size:17px;'>.  These features are identified with a </span></font></font></font></font></font><font style='font-family:inherit;'><font style='font-family:inherit;'><a href='https://wiki.openstreetmap.org/wiki/Key:building' rel='nofollow ugc' style='color:rgb(0, 121, 193); font-family:inherit; text-decoration-line:none;' target='_blank'>building tag</a><span style='font-family:inherit; font-size:17px;'>.  There are thousands of different tag values for </span></font><font style='font-family:inherit;'><span style='font-family:inherit; font-size:17px;'>building </span><span style='font-family:inherit; font-size:17px;'>used in the OSM database.  In this feature layer, unique symbols are used for several of the most popular </span></font><font style='font-family:inherit;'><span style='font-family:inherit; font-size:17px;'>building </span><span style='font-family:inherit; font-size:17px;'>types, while lesser used types are grouped in an &quot;other&quot; category.</span></font><br /></font><div style='font-family:inherit;'><span style='font-family:&quot;Avenir Next W01&quot;, &quot;Avenir Next W00&quot;, &quot;Avenir Next&quot;, Avenir, &quot;Helvetica Neue&quot;, Helvetica, Arial, sans-serif; font-size:17px;'><br /></span></div><div style='font-family:inherit;'><span style='font-family:&quot;Avenir Next W01&quot;, &quot;Avenir Next W00&quot;, &quot;Avenir Next&quot;, Avenir, &quot;Helvetica Neue&quot;, Helvetica, Arial, sans-serif; font-size:17px;'>Zoom in to large scales (e.g. </span><span style='font-family:&quot;Avenir Next W01&quot;, &quot;Avenir Next W00&quot;, &quot;Avenir Next&quot;, Avenir, &quot;Helvetica Neue&quot;, Helvetica, Arial, sans-serif; font-size:17px;'>Streets level or 1:10k scale</span><span style='font-family:&quot;Avenir Next W01&quot;, &quot;Avenir Next W00&quot;, &quot;Avenir Next&quot;, Avenir, &quot;Helvetica Neue&quot;, Helvetica, Arial, sans-serif; font-size:17px;'>) to see the </span><span style='font-family:&quot;Avenir Next&quot;, Avenir, &quot;Helvetica Neue&quot;, Helvetica, Arial, sans-serif; font-size:17px;'>building </span><span style='font-family:&quot;Avenir Next W01&quot;, &quot;Avenir Next W00&quot;, &quot;Avenir Next&quot;, Avenir, &quot;Helvetica Neue&quot;, Helvetica, Arial, sans-serif; font-size:17px;'>features display.  </span><span style='font-family:&quot;Avenir Next W01&quot;, &quot;Avenir Next W00&quot;, &quot;Avenir Next&quot;, Avenir, &quot;Helvetica Neue&quot;, Helvetica, Arial, sans-serif; font-size:17px;'>You can click on </span><span style='font-family:&quot;Avenir Next W01&quot;, &quot;Avenir Next W00&quot;, &quot;Avenir Next&quot;, Avenir, &quot;Helvetica Neue&quot;, Helvetica, Arial, sans-serif; font-size:17px;'>a </span><span style='font-family:&quot;Avenir Next W01&quot;, &quot;Avenir Next W00&quot;, &quot;Avenir Next&quot;, Avenir, &quot;Helvetica Neue&quot;, Helvetica, Arial, sans-serif; font-size:17px;'>feature to get the name of the </span><span style='font-family:&quot;Avenir Next&quot;, Avenir, &quot;Helvetica Neue&quot;, Helvetica, Arial, sans-serif; font-size:17px;'>building</span><span style='font-family:&quot;Avenir Next&quot;, Avenir, &quot;Helvetica Neue&quot;, Helvetica, Arial, sans-serif; font-size:17px;'> </span><span style='font-family:&quot;Avenir Next W01&quot;, &quot;Avenir Next W00&quot;, &quot;Avenir Next&quot;, Avenir, &quot;Helvetica Neue&quot;, Helvetica, Arial, sans-serif; font-size:17px;'>(if available).  The name of the </span><span style='font-family:&quot;Avenir Next&quot;, Avenir, &quot;Helvetica Neue&quot;, Helvetica, Arial, sans-serif; font-size:17px;'>building</span><span style='font-family:&quot;Avenir Next&quot;, Avenir, &quot;Helvetica Neue&quot;, Helvetica, Arial, sans-serif; font-size:17px;'> </span><span style='font-family:&quot;Avenir Next W01&quot;, &quot;Avenir Next W00&quot;, &quot;Avenir Next&quot;, Avenir, &quot;Helvetica Neue&quot;, Helvetica, Arial, sans-serif; font-size:17px;'>will display by default at large scales (e.g. Street level of 1:5k scale).  Labels can be turned off in your map if you prefer.</span></div></div><div style='font-family:&quot;Avenir Next W01&quot;, &quot;Avenir Next W00&quot;, &quot;Avenir Next&quot;, Avenir, &quot;Helvetica Neue&quot;, sans-serif; font-size:16px;'><span style='font-family:&quot;Avenir Next W01&quot;, &quot;Avenir Next W00&quot;, &quot;Avenir Next&quot;, Avenir, &quot;Helvetica Neue&quot;, Helvetica, Arial, sans-serif; font-size:17px;'><br /></span></div><div style='font-family:&quot;Avenir Next W01&quot;, &quot;Avenir Next W00&quot;, &quot;Avenir Next&quot;, Avenir, &quot;Helvetica Neue&quot;, sans-serif; font-size:16px;'><span style='font-family:&quot;Avenir Next W01&quot;, &quot;Avenir Next W00&quot;, &quot;Avenir Next&quot;, Avenir, &quot;Helvetica Neue&quot;, Helvetica, Arial, sans-serif; font-size:17px;'><b>Create New Layer</b></span></div><div style='font-family:&quot;Avenir Next W01&quot;, &quot;Avenir Next W00&quot;, &quot;Avenir Next&quot;, Avenir, &quot;Helvetica Neue&quot;, sans-serif; font-size:16px;'><span style='font-family:&quot;Avenir Next W01&quot;, &quot;Avenir Next W00&quot;, &quot;Avenir Next&quot;, Avenir, &quot;Helvetica Neue&quot;, Helvetica, Arial, sans-serif; font-size:17px;'>If you would like to create a more focused version of this </span><span style='font-family:&quot;Avenir Next&quot;, Avenir, &quot;Helvetica Neue&quot;, Helvetica, Arial, sans-serif; font-size:17px;'>buildings</span><span style='font-family:&quot;Avenir Next&quot;, Avenir, &quot;Helvetica Neue&quot;, Helvetica, Arial, sans-serif; font-size:17px;'> </span><span style='font-family:&quot;Avenir Next W01&quot;, &quot;Avenir Next W00&quot;, &quot;Avenir Next&quot;, Avenir, &quot;Helvetica Neue&quot;, Helvetica, Arial, sans-serif; font-size:17px;'>layer displaying just one or two </span><span style='font-family:&quot;Avenir Next&quot;, Avenir, &quot;Helvetica Neue&quot;, Helvetica, Arial, sans-serif; font-size:17px;'>building </span><span style='font-family:&quot;Avenir Next W01&quot;, &quot;Avenir Next W00&quot;, &quot;Avenir Next&quot;, Avenir, &quot;Helvetica Neue&quot;, Helvetica, Arial, sans-serif; font-size:17px;'>types, you can do that easily!  Just add the layer to a map, copy the layer in the content window, add a filter to the new layer (e.g. </span><span style='font-family:inherit; font-size:17px;'>building is apartments</span><span style='font-family:&quot;Avenir Next W01&quot;, &quot;Avenir Next W00&quot;, &quot;Avenir Next&quot;, Avenir, &quot;Helvetica Neue&quot;, Helvetica, Arial, sans-serif; font-size:17px;'>), rename the layer as appropriate, and save layer.  You can also change the layer symbols or popup if you like.  Esri may publish a few such layers (e.g. parks) that are ready to use, but not for every type of </span><span style='font-family:&quot;Avenir Next&quot;, Avenir, &quot;Helvetica Neue&quot;, Helvetica, Arial, sans-serif; font-size:17px;'>building</span><span style='font-family:&quot;Avenir Next W01&quot;, &quot;Avenir Next W00&quot;, &quot;Avenir Next&quot;, Avenir, &quot;Helvetica Neue&quot;, Helvetica, Arial, sans-serif; font-size:17px;'>.</span></div><div style='font-family:&quot;Avenir Next W01&quot;, &quot;Avenir Next W00&quot;, &quot;Avenir Next&quot;, Avenir, &quot;Helvetica Neue&quot;, sans-serif; font-size:16px;'><span style='font-family:&quot;Avenir Next W01&quot;, &quot;Avenir Next W00&quot;, &quot;Avenir Next&quot;, Avenir, &quot;Helvetica Neue&quot;, Helvetica, Arial, sans-serif; font-size:17px;'><br /></span></div><div style='font-family:&quot;Avenir Next W01&quot;, &quot;Avenir Next W00&quot;, &quot;Avenir Next&quot;, Avenir, &quot;Helvetica Neue&quot;, sans-serif; font-size:16px;'><span style='font-family:&quot;Avenir Next W01&quot;, &quot;Avenir Next W00&quot;, &quot;Avenir Next&quot;, Avenir, &quot;Helvetica Neue&quot;, Helvetica, Arial, sans-serif; font-size:17px;'><b><i>Important Note</i></b>: if you do create a new layer, it should be provided under the same Terms of Use and include the same Credits as this layer.  You can copy and paste the Terms of Use and Credits info below in the new Item page as needed.</span></div>",
			"keyword": [
				"osm",
				"building",
				"Australia",
				"Oceania",
				"New Zealand",
				"American Samoa",
				"Cook Islands",
				"Fed States of Micronesia",
				"Fiji",
				"French Polynesia",
				"Guam",
				"Kiribati",
				"Marshall Islands",
				"Nauru",
				"New Caledonia",
				"Niue",
				"North Mariana Islands",
				"Palau",
				"Papua New Guinea",
				"Pitcairn Islands",
				"Samoa",
				"Solomon Islands",
				"Tokelau",
				"Tonga",
				"Tuvalu",
				"Vanuatu",
				"Wallis and Futuna"
			],
			"issued": "2021-04-29T15:59:57.000Z",
			"modified": "2026-11-11T11:11:15.597Z",
			"publisher": {
				"name": "{{source}}"
			},
			"contactPoint": {
				"@type": "vcard:Contact",
				"fn": "smoore3_osm",
				"hasEmail": "{{orgContactEmail}}"
			},
			"accessLevel": "public",
			"spatial": "180.0000,-58.4495,-180.0000,53.9599",
			"license": "https://opendatacommons.org/licenses/odbl/summary",
			"distribution": [
				{
					"@type": "dcat:Distribution",
					"title": "ArcGIS Hub Dataset",
					"format": "Web Page",
					"mediaType": "text/html",
					"accessURL": "https://www.pacificgeoportal.com/datasets/651512cac36c48ba95c88c380ff8fac5_0"
				},
				{
					"@type": "dcat:Distribution",
					"title": "ArcGIS GeoService",
					"format": "ArcGIS GeoServices REST API",
					"mediaType": "application/json",
					"accessURL": "https://services-ap1.arcgis.com/iA7fZQOnjY9D67Zx/arcgis/rest/services/OSM_AU_Buildings/FeatureServer/0"
				},
				{
					"@type": "dcat:Distribution",
					"title": "CSV",
					"format": "CSV",
					"mediaType": "text/csv",
					"accessURL": "https://www.pacificgeoportal.com/api/download/v1/items/651512cac36c48ba95c88c380ff8fac5/csv?layers=0"
				},
				{
					"@type": "dcat:Distribution",
					"title": "Shapefile",
					"format": "ZIP",
					"mediaType": "application/zip",
					"accessURL": "https://www.pacificgeoportal.com/api/download/v1/items/651512cac36c48ba95c88c380ff8fac5/shapefile?layers=0"
				},
				{
					"@type": "dcat:Distribution",
					"title": "GeoJSON",
					"format": "GeoJSON",
					"mediaType": "application/vnd.geo+json",
					"accessURL": "https://www.pacificgeoportal.com/api/download/v1/items/651512cac36c48ba95c88c380ff8fac5/geojson?layers=0"
				},
				{
					"@type": "dcat:Distribution",
					"title": "KML",
					"format": "KML",
					"mediaType": "application/vnd.google-earth.kml+xml",
					"accessURL": "https://www.pacificgeoportal.com/api/download/v1/items/651512cac36c48ba95c88c380ff8fac5/kml?layers=0"
				}
			],
			"theme": [
				"geospatial"
			]
		},
		{
			"@type": "dcat:Dataset",
			"identifier": "https://www.arcgis.com/home/item.html?id=1240c2db6c4041a4878df1548ee122e9",
			"landingPage": "https://www.pacificgeoportal.com/pages/pacificcore::fiji",
			"title": "Fiji",
			"description": "At the heart of the Pacific, the Republic of Fiji's diverse landscapes and vibrant communities are now more accessible than ever. Dive into detailed maps, gain invaluable insights, and transform your research and policy-making processes.",
			"keyword": [
				""
			],
			"issued": "2024-06-25T14:52:41.000Z",
			"modified": "2024-06-27T17:37:45.000Z",
			"publisher": {
				"name": "Pacific GeoPortal - Core Organization"
			},
			"contactPoint": {
				"@type": "vcard:Contact",
				"fn": "Pacific_Core_Admin",
				"hasEmail": "mailto:pacific_geoportal@esri.com"
			},
			"accessLevel": "public",
			"spatial": "",
			"license": "",
			"distribution": [
				{
					"@type": "dcat:Distribution",
					"title": "ArcGIS Hub Dataset",
					"format": "Web Page",
					"mediaType": "text/html",
					"accessURL": "https://www.pacificgeoportal.com/pages/pacificcore::fiji"
				}
			],
			"theme": ""
		},
		{
			"@type": "dcat:Dataset",
			"identifier": "https://www.arcgis.com/home/item.html?id=13c4ed3f10344f2589a004d2779cd6a0",
			"landingPage": "https://www.pacificgeoportal.com/pages/pacificcore::digital-earth-pacific-1",
			"title": "Digital Earth Pacific",
			"description": "",
			"keyword": [
				""
			],
			"issued": "2024-06-27T15:16:46.000Z",
			"modified": "2024-06-27T16:53:16.000Z",
			"publisher": {
				"name": "Pacific GeoPortal - Core Organization"
			},
			"contactPoint": {
				"@type": "vcard:Contact",
				"fn": "Pacific_Core_Admin",
				"hasEmail": "mailto:pacific_geoportal@esri.com"
			},
			"accessLevel": "public",
			"spatial": "112.9197,-55.1168,159.2562,-9.1406",
			"license": "",
			"distribution": [
				{
					"@type": "dcat:Distribution",
					"title": "ArcGIS Hub Dataset",
					"format": "Web Page",
					"mediaType": "text/html",
					"accessURL": "https://www.pacificgeoportal.com/pages/pacificcore::digital-earth-pacific-1"
				}
			],
			"theme": [
				"geospatial"
			]
		},
		{
			"@type": "dcat:Dataset",
			"identifier": "https://www.arcgis.com/home/item.html?id=b7dc2caba8b14d09a0307001dedb1678",
			"landingPage": "https://www.pacificgeoportal.com/pages/pacificcore::training",
			"title": "Training",
			"description": "{{description}}",
			"keyword": [
				""
			],
			"issued": "2023-10-20T19:48:19.000Z",
			"modified": "2024-06-27T15:15:59.000Z",
			"publisher": {
				"name": "Pacific GeoPortal - Core Organization"
			},
			"contactPoint": {
				"@type": "vcard:Contact",
				"fn": "Pacific_Core_Admin",
				"hasEmail": "mailto:pacific_geoportal@esri.com"
			},
			"accessLevel": "public",
			"spatial": "-134.7473,23.5610,-55.6955,50.3092",
			"license": "",
			"distribution": [
				{
					"@type": "dcat:Distribution",
					"title": "ArcGIS Hub Dataset",
					"format": "Web Page",
					"mediaType": "text/html",
					"accessURL": "https://www.pacificgeoportal.com/pages/pacificcore::training"
				}
			],
			"theme": [
				"geospatial"
			]
		},
		{
			"@type": "dcat:Dataset",
			"identifier": "https://www.arcgis.com/home/item.html?id=9cca1e335f1a4ef2b0e91c1c6d1fe502",
			"landingPage": "https://www.pacificgeoportal.com/pages/pacificcore::decision-maker",
			"title": "Decision Maker",
			"description": "{{description}}",
			"keyword": [
				""
			],
			"issued": "2023-10-20T19:48:19.000Z",
			"modified": "2024-06-27T15:08:54.000Z",
			"publisher": {
				"name": "Pacific GeoPortal - Core Organization"
			},
			"contactPoint": {
				"@type": "vcard:Contact",
				"fn": "Pacific_Core_Admin",
				"hasEmail": "mailto:pacific_geoportal@esri.com"
			},
			"accessLevel": "public",
			"spatial": "-134.7473,23.5610,-55.6955,50.3092",
			"license": "",
			"distribution": [
				{
					"@type": "dcat:Distribution",
					"title": "ArcGIS Hub Dataset",
					"format": "Web Page",
					"mediaType": "text/html",
					"accessURL": "https://www.pacificgeoportal.com/pages/pacificcore::decision-maker"
				}
			],
			"theme": [
				"geospatial"
			]
		},
		{
			"@type": "dcat:Dataset",
			"identifier": "https://www.arcgis.com/home/item.html?id=b4334b299d6e4abb846eba9f5cd3822a",
			"landingPage": "https://www.pacificgeoportal.com/pages/pacificcore::new-to-gis",
			"title": "New to GIS",
			"description": "{{description}}",
			"keyword": [
				""
			],
			"issued": "2023-10-20T19:48:19.000Z",
			"modified": "2024-06-27T15:07:16.000Z",
			"publisher": {
				"name": "Pacific GeoPortal - Core Organization"
			},
			"contactPoint": {
				"@type": "vcard:Contact",
				"fn": "Pacific_Core_Admin",
				"hasEmail": "mailto:pacific_geoportal@esri.com"
			},
			"accessLevel": "public",
			"spatial": "-134.7473,23.5610,-55.6955,50.3092",
			"license": "",
			"distribution": [
				{
					"@type": "dcat:Distribution",
					"title": "ArcGIS Hub Dataset",
					"format": "Web Page",
					"mediaType": "text/html",
					"accessURL": "https://www.pacificgeoportal.com/pages/pacificcore::new-to-gis"
				}
			],
			"theme": [
				"geospatial"
			]
		},
		{
			"@type": "dcat:Dataset",
			"identifier": "https://www.arcgis.com/home/item.html?id=3c7fab55ca52405bb8853755b572fb0d",
			"landingPage": "https://www.pacificgeoportal.com/pages/pacificcore::gis-professional",
			"title": "GIS Professional",
			"description": "{{description}}",
			"keyword": [
				""
			],
			"issued": "2023-10-20T19:48:19.000Z",
			"modified": "2024-06-27T15:03:22.000Z",
			"publisher": {
				"name": "Pacific GeoPortal - Core Organization"
			},
			"contactPoint": {
				"@type": "vcard:Contact",
				"fn": "Pacific_Core_Admin",
				"hasEmail": "mailto:pacific_geoportal@esri.com"
			},
			"accessLevel": "public",
			"spatial": "-134.7473,23.5610,-55.6955,50.3092",
			"license": "",
			"distribution": [
				{
					"@type": "dcat:Distribution",
					"title": "ArcGIS Hub Dataset",
					"format": "Web Page",
					"mediaType": "text/html",
					"accessURL": "https://www.pacificgeoportal.com/pages/pacificcore::gis-professional"
				}
			],
			"theme": [
				"geospatial"
			]
		},
		{
			"@type": "dcat:Dataset",
			"identifier": "https://www.arcgis.com/home/item.html?id=e2ee8f70e5184ab2a4452699c7d10d3a",
			"landingPage": "https://www.pacificgeoportal.com/maps/pacificcore::pacific-region-active-hurricanes-cyclones-and-typhoons",
			"title": "Pacific Region Active Hurricanes, Cyclones and Typhoons",
			"description": "<div style='font-family:&quot;Avenir Next W01&quot;, &quot;Avenir Next W00&quot;, &quot;Avenir Next&quot;, Avenir, &quot;Helvetica Neue&quot;, sans-serif; font-size:16px;'>This layer is a subset of Active Hurricanes, Cyclones and Typhoons Global Map. You can access the global coverage from <a href='https://www.arcgis.com/home/item.html?id=248e7b5827a34b248647afb012c58787' target='_blank' rel='nofollow ugc noopener noreferrer'>here.</a></div><div style='font-family:&quot;Avenir Next W01&quot;, &quot;Avenir Next W00&quot;, &quot;Avenir Next&quot;, Avenir, &quot;Helvetica Neue&quot;, sans-serif; font-size:16px;'><br /></div><div style='font-family:&quot;Avenir Next W01&quot;, &quot;Avenir Next W00&quot;, &quot;Avenir Next&quot;, Avenir, &quot;Helvetica Neue&quot;, sans-serif; font-size:16px;'>Hurricane tracks and positions provide information on where the storm has been, where it is currently located, and where it is predicted to go. Each storm location is depicted by the sustained wind speed, according to the <a href='https://www.nhc.noaa.gov/aboutsshws.php' style='color:rgb(0, 97, 155); text-decoration-line:none; font-family:inherit;' target='_blank' rel='nofollow ugc noopener noreferrer'>Saffir-Simpson Scale</a>. It should be noted that the Saffir-Simpson Scale only applies to hurricanes in the Atlantic and Eastern Pacific basins, however all storms are still symbolized using that classification for consistency.</div><div style='font-family:&quot;Avenir Next W01&quot;, &quot;Avenir Next W00&quot;, &quot;Avenir Next&quot;, Avenir, &quot;Helvetica Neue&quot;, sans-serif; font-size:16px;'><br /></div><div style='font-family:&quot;Avenir Next W01&quot;, &quot;Avenir Next W00&quot;, &quot;Avenir Next&quot;, Avenir, &quot;Helvetica Neue&quot;, sans-serif; font-size:16px;'><span style='font-family:inherit; font-weight:bold;'>Data Source</span></div><div style='font-family:&quot;Avenir Next W01&quot;, &quot;Avenir Next W00&quot;, &quot;Avenir Next&quot;, Avenir, &quot;Helvetica Neue&quot;, sans-serif; font-size:16px;'><ul><li>This data is provided by <a href='https://www.nhc.noaa.gov/' style='color:rgb(0, 97, 155); text-decoration-line:none; font-family:inherit;' target='_blank' rel='nofollow ugc noopener noreferrer'>NOAA National Hurricane Center</a> (NHC) for the Central+East Pacific and Atlantic, and the <a href='https://www.metoc.navy.mil/jtwc/jtwc.html' style='color:rgb(0, 97, 155); text-decoration-line:none; font-family:inherit;' target='_blank' rel='nofollow ugc noopener noreferrer'>Joint Typhoon Warning Center</a> for the West+Central Pacific and Indian basins. For more disaster-related live feeds visit the <a href='https://www.arcgis.com/home/group.html?id=d55ba7a328924596b9fa9d5d1876a970#overview' style='color:rgb(0, 97, 155); text-decoration-line:none; font-family:inherit;' target='_blank' rel='nofollow ugc noopener noreferrer'>Disaster Web Maps &amp; Feeds ArcGIS Online Group</a>.</li></ul></div><div style='font-family:&quot;Avenir Next W01&quot;, &quot;Avenir Next W00&quot;, &quot;Avenir Next&quot;, Avenir, &quot;Helvetica Neue&quot;, sans-serif; font-size:16px;'><span style='font-family:inherit; font-weight:bold;'>Sample Data</span></div><div style='font-family:&quot;Avenir Next W01&quot;, &quot;Avenir Next W00&quot;, &quot;Avenir Next&quot;, Avenir, &quot;Helvetica Neue&quot;, sans-serif; font-size:16px;'><ul><li>See <a href='https://www.arcgis.com/home/item.html?id=0546442443e848a9ae7758fdb98d73f0' style='color:rgb(0, 97, 155); text-decoration-line:none; font-family:inherit;' target='_blank' rel='nofollow ugc noopener noreferrer'>Sample Layer Item</a> for sample data during inactive Hurricane Season!<br /></li></ul></div><div style='font-family:&quot;Avenir Next W01&quot;, &quot;Avenir Next W00&quot;, &quot;Avenir Next&quot;, Avenir, &quot;Helvetica Neue&quot;, sans-serif; font-size:16px;'><span style='font-family:inherit; font-weight:bold;'>Update Frequency</span></div><div style='font-family:&quot;Avenir Next W01&quot;, &quot;Avenir Next W00&quot;, &quot;Avenir Next&quot;, Avenir, &quot;Helvetica Neue&quot;, sans-serif; font-size:16px;'><ul><li><a href='https://www.esriurl.com/LiveFeed' style='color:rgb(0, 97, 155); text-decoration-line:none; font-family:inherit;' target='_blank' rel='nofollow ugc noopener noreferrer'>The Aggregated Live Feeds methodology</a> checks the Source for updates every 15 minutes. Tropical cyclones are normally issued every six hours at 5:00 AM EDT, 11:00 AM EDT, 5:00 PM EDT, and 11:00 PM EDT (or 4:00 AM EST, 10:00 AM EST, 4:00 PM EST, and 10:00 PM EST).</li><li>Public advisories for Eastern Pacific tropical cyclones are normally issued every six hours at 2:00 AM PDT, 8:00 AM PDT, 2:00 PM PDT, and 8:00 PM PDT (or 1:00 AM PST, 7:00 AM PST, 1:00 PM PST, and 7:00 PM PST).</li><li>Intermediate public advisories may be issued every 3 hours when coastal watches or warnings are in effect, and every 2 hours when coastal watches or warnings are in effect and land-based radars have identified a reliable storm center. Additionally, special public advisories may be issued at any time due to significant changes in warnings or in a cyclone. For the NHC data source you can subscribe to <a href='https://www.nhc.noaa.gov/gis-at.xml' style='color:rgb(0, 97, 155); text-decoration-line:none; font-family:inherit;' target='_blank' rel='nofollow ugc noopener noreferrer'>RSS Feeds</a>.</li><li>North Pacific and North Indian Ocean tropical cyclone warnings are updated every 6 hours, and South Indian and South Pacific Ocean tropical cyclone warnings are routinely updated every 12 hours. Times are set to Zulu/UTC.</li></ul></div><div style='font-family:&quot;Avenir Next W01&quot;, &quot;Avenir Next W00&quot;, &quot;Avenir Next&quot;, Avenir, &quot;Helvetica Neue&quot;, sans-serif; font-size:16px;'><span style='font-family:inherit; font-weight:bold;'>Scale/Resolution</span></div><div style='font-family:&quot;Avenir Next W01&quot;, &quot;Avenir Next W00&quot;, &quot;Avenir Next&quot;, Avenir, &quot;Helvetica Neue&quot;, sans-serif; font-size:16px;'><ul><li>The horizontal accuracy of these datasets is not stated but it is important to remember that tropical cyclone track forecasts are subject to error, and that the effects of a tropical cyclone can span many hundreds of miles from the center.</li></ul></div><div style='font-family:&quot;Avenir Next W01&quot;, &quot;Avenir Next W00&quot;, &quot;Avenir Next&quot;, Avenir, &quot;Helvetica Neue&quot;, sans-serif; font-size:16px;'><span style='font-family:inherit; font-weight:bold;'>Area Covered</span></div><div style='font-family:&quot;Avenir Next W01&quot;, &quot;Avenir Next W00&quot;, &quot;Avenir Next&quot;, Avenir, &quot;Helvetica Neue&quot;, sans-serif; font-size:16px;'><ul><li>World</li></ul></div><div style='font-family:&quot;Avenir Next W01&quot;, &quot;Avenir Next W00&quot;, &quot;Avenir Next&quot;, Avenir, &quot;Helvetica Neue&quot;, sans-serif; font-size:16px;'><span style='font-family:inherit; font-weight:bold;'>Glossary</span></div><div style='font-family:&quot;Avenir Next W01&quot;, &quot;Avenir Next W00&quot;, &quot;Avenir Next&quot;, Avenir, &quot;Helvetica Neue&quot;, sans-serif; font-size:16px;'><ul><li><span style='font-family:inherit; font-weight:bold;'><span style='font-family:inherit; font-style:italic;'>Forecast location</span></span>: Represents the official NHC forecast locations for the center of a tropical cyclone. Forecast center positions are given for projections valid 12, 24, 36, 48, 72, 96, and 120 hours after the forecast's nominal initial time. <a href='https://www.nhc.noaa.gov/gis/metadata_ex_point_at.xml' style='color:rgb(0, 97, 155); text-decoration-line:none; font-family:inherit;' target='_blank' rel='nofollow ugc noopener noreferrer'>Click here for more information</a>. Forecast points from the JTWC are valid 12, 24, 36, 48 and 72 hours after the forecast’s initial time.</li><li><span style='font-family:inherit; font-style:italic;'><span style='font-family:inherit; font-weight:bold;'>Forecast track:</span></span> This product aids in the visualization of an NHC official track forecast, the forecast points are connected by a red line. The track lines are not a forecast product, as such, the lines should not be interpreted as representing a specific forecast for the location of a tropical cyclone in between official forecast points. It is also important to remember that tropical cyclone track forecasts are subject to error, and that the effects of a tropical cyclone can span many hundreds of miles from the center. <a href='https://www.nhc.noaa.gov/gis/metadata_ex_lines_at.xml' style='color:rgb(0, 97, 155); text-decoration-line:none; font-family:inherit;' target='_blank' rel='nofollow ugc noopener noreferrer'>Click here for more information</a>.</li><li><span style='font-family:inherit; font-style:italic;'><span style='font-family:inherit; font-weight:bold;'>The Cone of Uncertainty:</span></span> Cyclone paths are hard to predict with absolute certainty, especially days in advance. The cone represents the probable track of the center of a tropical cyclone and is formed by enclosing the area swept out by a set of circles along the forecast track (at 12, 24, 36 hours, etc). The size of each circle is scaled so that two-thirds of the historical official forecast errors over a 5-year sample fall within the circle. Based on forecasts over the previous 5 years, the entire track of a tropical cyclone can be expected to remain within the cone roughly 60-70% of the time. It is important to note that the area affected by a tropical cyclone can extend well beyond the confines of the cone enclosing the most likely track area of the center. <a href='https://www.nhc.noaa.gov/gis/metadata_ex_cone_at.xml' style='color:rgb(0, 97, 155); text-decoration-line:none; font-family:inherit;' target='_blank' rel='nofollow ugc noopener noreferrer'>Click here for more information</a>.</li><li><span style='font-family:inherit; font-style:italic;'><span style='font-family:inherit; font-weight:bold;'>Coastal Watch/Warning:</span></span> Coastal areas are placed under watches and warnings depending on the proximity and intensity of the approaching storm.</li><ul><li><span style='font-family:inherit; font-style:italic;'>Tropical Storm Watch</span> is issued when a tropical cyclone containing winds of 34 to 63 knots (39 to 73 mph) or higher poses a possible threat, generally within 48 hours. These winds may be accompanied by storm surge, coastal flooding, and/or river flooding. The watch does not mean that tropical storm conditions will occur. It only means that these conditions are possible.</li><li><span style='font-family:inherit; font-style:italic;'>Tropical Storm Warning</span> is issued when sustained winds of 34 to 63 knots (39 to 73 mph) or higher associated with a tropical cyclone are expected in 36 hours or less. These winds may be accompanied by storm surge, coastal flooding, and/or river flooding.</li><li><span style='font-family:inherit; font-style:italic;'>Hurricane Watch</span> is issued when a tropical cyclone containing winds of 64 knots (74 mph) or higher poses a possible threat, generally within 48 hours. These winds may be accompanied by storm surge, coastal flooding, and/or river flooding. The watch does not mean that hurricane conditions will occur. It only means that these conditions are possible.</li><li><span style='font-family:inherit; font-style:italic;'>Hurricane Warning</span> is issued when sustained winds of 64 knots (74 mph) or higher associated with a tropical cyclone are expected in 36 hours or less. These winds may be accompanied by storm surge, coastal flooding, and/or river flooding. A hurricane warning can remain in effect when dangerously high water or a combination of dangerously high water and exceptionally high waves continue, even though winds may be less than hurricane force.</li></ul></ul></div><div style='font-family:&quot;Avenir Next W01&quot;, &quot;Avenir Next W00&quot;, &quot;Avenir Next&quot;, Avenir, &quot;Helvetica Neue&quot;, sans-serif; font-size:16px;'><font size='5' style='font-family:inherit;'>Revisions</font><br /></div><div style='font-family:&quot;Avenir Next W01&quot;, &quot;Avenir Next W00&quot;, &quot;Avenir Next&quot;, Avenir, &quot;Helvetica Neue&quot;, sans-serif; font-size:16px;'><ul><li>Mar 27, 2022: Added UID, Max_SS, Max_Wind, Max_Gust, and Max_Label fields to ForecastErrorCone layer.<br /></li></ul></div><div style='font-family:&quot;Avenir Next W01&quot;, &quot;Avenir Next W00&quot;, &quot;Avenir Next&quot;, Avenir, &quot;Helvetica Neue&quot;, sans-serif; font-size:16px;'><span style='font-family:inherit; color:rgb(128, 128, 128);'>This map is provided for informational purposes and is not monitored 24/7 for accuracy and currency. Always refer to <a href='https://www.nhc.noaa.gov/contact.shtml' style='color:rgb(0, 97, 155); text-decoration-line:none; font-family:inherit;' target='_blank' rel='nofollow ugc noopener noreferrer'>NOAA</a> or JTWC sources for official guidance.</span><div style='font-family:inherit;'><br /></div>If you would like to be alerted to potential issues or simply see when this Service will update next, please visit our <a href='https://livingatlas.arcgis.com/livefeeds-status/' style='color:rgb(0, 97, 155); text-decoration-line:none; font-family:inherit;' target='_blank' rel='nofollow ugc noopener noreferrer'>Live Feed Status</a> Page!</div>",
			"keyword": [
				"Esri",
				"NOAA",
				"NHC",
				"CPHC",
				"JTWC",
				"USNO",
				"Hurricane",
				"Typhoon",
				"Cyclone",
				"Weather",
				"Tropical",
				"Forecast",
				"Storm",
				"risk",
				"earth observations",
				"climate",
				"hosted",
				"esri_environment",
				"Active_Hurricanes",
				"Live Feeds",
				"livefeeds",
				"Arlene",
				"Bret",
				"Cindy",
				"Don",
				"Emily",
				"Franklin",
				"Gert",
				"Harold",
				"Idalia",
				"Jose",
				"Katia",
				"Lee",
				"Margot",
				"Nigel",
				"Ophelia",
				"Philippe",
				"Rina",
				"Sean",
				"Tammy",
				"Vince",
				"Whitney",
				"Adrian",
				"Beatriz",
				"Calvin",
				"Dora",
				"Eugene",
				"Fernanda",
				"Greg",
				"Hilary",
				"Irwin",
				"Jova",
				"Kenneth",
				"Lidia",
				"Max",
				"Norma",
				"Otis",
				"Pilar",
				"Ramon",
				"Selma",
				"Todd",
				"Veronica",
				"Wiley",
				"Xina",
				"York",
				"Zelda"
			],
			"issued": "2023-09-22T18:36:25.000Z",
			"modified": "2024-06-27T13:44:13.000Z",
			"publisher": {
				"name": "Pacific GeoPortal - Core Organization"
			},
			"contactPoint": {
				"@type": "vcard:Contact",
				"fn": "dkaragulle_pacificcore",
				"hasEmail": "mailto:pacific_geoportal@esri.com"
			},
			"accessLevel": "public",
			"spatial": "14.7656,-64.6014,180.0000,52.8344",
			"license": "<span style='font-family:&quot;Avenir Next W01&quot;, &quot;Avenir Next W00&quot;, &quot;Avenir Next&quot;, Avenir, &quot;Helvetica Neue&quot;, sans-serif; font-size:16px;'>This work is licensed under the Esri Master License Agreement.</span><br /><div style='font-family:&quot;Avenir Next W01&quot;, &quot;Avenir Next W00&quot;, &quot;Avenir Next&quot;, Avenir, &quot;Helvetica Neue&quot;, sans-serif; font-size:16px;'><a href='https://goto.arcgis.com/termsofuse/viewsummary' style='color:rgb(0, 97, 155); text-decoration-line:none;' target='_blank' rel='nofollow ugc noopener noreferrer'><b>View Summary</b></a> | <a href='https://goto.arcgis.com/termsofuse/viewtermsofuse' style='color:rgb(0, 97, 155); text-decoration-line:none;' target='_blank' rel='nofollow ugc noopener noreferrer'><b>View Terms of Use</b></a></div>",
			"distribution": [
				{
					"@type": "dcat:Distribution",
					"title": "ArcGIS Hub Dataset",
					"format": "Web Page",
					"mediaType": "text/html",
					"accessURL": "https://www.pacificgeoportal.com/maps/pacificcore::pacific-region-active-hurricanes-cyclones-and-typhoons"
				}
			],
			"theme": [
				"geospatial"
			]
		},
		{
			"@type": "dcat:Dataset",
			"identifier": "https://www.arcgis.com/home/item.html?id=3af72c223d1a4c729d4fd115022fc793",
			"landingPage": "https://www.pacificgeoportal.com/maps/pacificcore::fiji-land-cover-2050",
			"title": "Fiji Land Cover 2050",
			"description": "<span style='font-family:&quot;Avenir Next W01&quot;, &quot;Avenir Next W00&quot;, &quot;Avenir Next&quot;, Avenir, &quot;Helvetica Neue&quot;, sans-serif; font-size:16px;'>This layer is a subset of </span><a href='https://www.arcgis.com/home/item.html?id=afeaa714dd8b4553bc92898002abf145' style='color:rgb(0, 97, 155); text-decoration-line:none; font-family:&quot;Avenir Next W01&quot;, &quot;Avenir Next W00&quot;, &quot;Avenir Next&quot;, Avenir, &quot;Helvetica Neue&quot;, sans-serif; font-size:16px;' target='_blank' rel='nofollow ugc noopener noreferrer'>Landcover 2050 Country</a>  focused on Fiji<span style='font-family:&quot;Avenir Next W01&quot;, &quot;Avenir Next W00&quot;, &quot;Avenir Next&quot;, Avenir, &quot;Helvetica Neue&quot;, sans-serif; font-size:16px;'>. Use this global model layer when performing analysis across continents. This layer displays a  land cover map and model for the year 2050 at a pixel resolution of 300m for the Pacific Region. This is a subset of a Global Landcover 2050 dataset. You can access the global coverage from: </span><a href='https://www.arcgis.com/home/item.html?id=cee96e0ada6541d0bd3d67f3f8b5ce63' style='color:rgb(0, 97, 155); text-decoration-line:none; font-family:&quot;Avenir Next W01&quot;, &quot;Avenir Next W00&quot;, &quot;Avenir Next&quot;, Avenir, &quot;Helvetica Neue&quot;, sans-serif; font-size:16px;' target='_blank' rel='nofollow ugc noopener noreferrer'>Land Cover 2050 - Global</a><span style='font-family:&quot;Avenir Next W01&quot;, &quot;Avenir Next W00&quot;, &quot;Avenir Next&quot;, Avenir, &quot;Helvetica Neue&quot;, sans-serif; font-size:16px;'> ESA CCI land cover from the years 2010 and 2018 were used to create this prediction.</span><div style='font-family:&quot;Avenir Next W01&quot;, &quot;Avenir Next W00&quot;, &quot;Avenir Next&quot;, Avenir, &quot;Helvetica Neue&quot;, sans-serif; font-size:16px;'><br /></div><div style='font-family:&quot;Avenir Next W01&quot;, &quot;Avenir Next W00&quot;, &quot;Avenir Next&quot;, Avenir, &quot;Helvetica Neue&quot;, sans-serif; font-size:16px;'><b>Variable mapped:</b> Projected land cover in 2050.</div><div style='font-family:&quot;Avenir Next W01&quot;, &quot;Avenir Next W00&quot;, &quot;Avenir Next&quot;, Avenir, &quot;Helvetica Neue&quot;, sans-serif; font-size:16px;'><b>Data Projection:</b> Cylindrical Equal Area</div><div style='font-family:&quot;Avenir Next W01&quot;, &quot;Avenir Next W00&quot;, &quot;Avenir Next&quot;, Avenir, &quot;Helvetica Neue&quot;, sans-serif; font-size:16px;'><b>Mosaic Projection</b>: Cylindrical Equal Area</div><div style='font-family:&quot;Avenir Next W01&quot;, &quot;Avenir Next W00&quot;, &quot;Avenir Next&quot;, Avenir, &quot;Helvetica Neue&quot;, sans-serif; font-size:16px;'><b>Extent:</b> Global </div><div style='font-family:&quot;Avenir Next W01&quot;, &quot;Avenir Next W00&quot;, &quot;Avenir Next&quot;, Avenir, &quot;Helvetica Neue&quot;, sans-serif; font-size:16px;'><b>Cell Size: 300m</b></div><div style='font-family:&quot;Avenir Next W01&quot;, &quot;Avenir Next W00&quot;, &quot;Avenir Next&quot;, Avenir, &quot;Helvetica Neue&quot;, sans-serif; font-size:16px;'><b>Source Type:</b> Thematic</div><div style='font-family:&quot;Avenir Next W01&quot;, &quot;Avenir Next W00&quot;, &quot;Avenir Next&quot;, Avenir, &quot;Helvetica Neue&quot;, sans-serif; font-size:16px;'><b>Visible Scale:</b> 1:50,000 and smaller</div><div style='font-family:&quot;Avenir Next W01&quot;, &quot;Avenir Next W00&quot;, &quot;Avenir Next&quot;, Avenir, &quot;Helvetica Neue&quot;, sans-serif; font-size:16px;'><b>Source: </b>Clark University</div><div style='font-family:&quot;Avenir Next W01&quot;, &quot;Avenir Next W00&quot;, &quot;Avenir Next&quot;, Avenir, &quot;Helvetica Neue&quot;, sans-serif; font-size:16px;'><b>Publication date: </b>April 2021</div><div style='font-family:&quot;Avenir Next W01&quot;, &quot;Avenir Next W00&quot;, &quot;Avenir Next&quot;, Avenir, &quot;Helvetica Neue&quot;, sans-serif; font-size:16px;'><br /></div><div style='font-family:&quot;Avenir Next W01&quot;, &quot;Avenir Next W00&quot;, &quot;Avenir Next&quot;, Avenir, &quot;Helvetica Neue&quot;, sans-serif; font-size:16px;'><b>What you can do with this layer?</b></div><div style='font-family:&quot;Avenir Next W01&quot;, &quot;Avenir Next W00&quot;, &quot;Avenir Next&quot;, Avenir, &quot;Helvetica Neue&quot;, sans-serif; font-size:16px;'><br /></div><div style='font-family:&quot;Avenir Next W01&quot;, &quot;Avenir Next W00&quot;, &quot;Avenir Next&quot;, Avenir, &quot;Helvetica Neue&quot;, sans-serif; font-size:16px;'>This layer may be added to online maps and compared with the ESA CCI Land Cover from any year from 1992 to 2018. To do this, add Global Land Cover 1992-2018 to your map and choose the processing template (image display) from that layer called “Simplified Renderer.” </div><div style='font-family:&quot;Avenir Next W01&quot;, &quot;Avenir Next W00&quot;, &quot;Avenir Next&quot;, Avenir, &quot;Helvetica Neue&quot;, sans-serif; font-size:16px;'><br /></div><div style='font-family:&quot;Avenir Next W01&quot;, &quot;Avenir Next W00&quot;, &quot;Avenir Next&quot;, Avenir, &quot;Helvetica Neue&quot;, sans-serif; font-size:16px;'>This layer can also be used in analysis in ecological planning to find specific areas that may need to be set aside before they are converted to human use.</div><div style='font-family:&quot;Avenir Next W01&quot;, &quot;Avenir Next W00&quot;, &quot;Avenir Next&quot;, Avenir, &quot;Helvetica Neue&quot;, sans-serif; font-size:16px;'><br /></div><div style='font-family:&quot;Avenir Next W01&quot;, &quot;Avenir Next W00&quot;, &quot;Avenir Next&quot;, Avenir, &quot;Helvetica Neue&quot;, sans-serif; font-size:16px;'><b>Links to the six Clark University land cover 2050 layers in ArcGIS Living Atlas of the World:</b></div><div style='font-family:&quot;Avenir Next W01&quot;, &quot;Avenir Next W00&quot;, &quot;Avenir Next&quot;, Avenir, &quot;Helvetica Neue&quot;, sans-serif; font-size:16px;'>There are three scales (country, regional, and world) for the land cover and vulnerability models. They’re all slightly different since the country model can be more fine-tuned to the drivers in that particular area. Regional (continental) and global have more spatially consistent model weights. Which should you use? If you’re analyzing one country or want to make accurate comparisons between countries, use the country level. If mapping larger patterns, use the global or regional extent (depending on your area of interest). </div><div style='font-family:&quot;Avenir Next W01&quot;, &quot;Avenir Next W00&quot;, &quot;Avenir Next&quot;, Avenir, &quot;Helvetica Neue&quot;, sans-serif; font-size:16px;'><br /></div><div style='font-family:&quot;Avenir Next W01&quot;, &quot;Avenir Next W00&quot;, &quot;Avenir Next&quot;, Avenir, &quot;Helvetica Neue&quot;, sans-serif; font-size:16px;'><div style='font-family:inherit;'><a href='https://arcgis.com/home/item.html?id=cee96e0ada6541d0bd3d67f3f8b5ce63' style='color:rgb(0, 121, 193); text-decoration-line:none; font-family:inherit;' target='_blank' rel='nofollow ugc noopener noreferrer'>Land Cover 2050  - Global</a><br /></div><div style='font-family:inherit;'><a href='https://arcgis.com/home/item.html?id=ec4d1d1fe03a4e62997a7a9397cf644d' style='color:rgb(0, 121, 193); text-decoration-line:none; font-family:inherit;' target='_blank' rel='nofollow ugc noopener noreferrer'>Land Cover 2050 - Regional</a><br /></div><div style='font-family:inherit;'><a href='https://arcgis.com/home/item.html?id=afeaa714dd8b4553bc92898002abf145' style='color:rgb(0, 121, 193); text-decoration-line:none; font-family:inherit;' target='_blank' rel='nofollow ugc noopener noreferrer'>Land Cover 2050 - Country</a><br /></div><div style='font-family:inherit;'><a href='https://arcgis.com/home/item.html?id=4040cafb922440f59d3ce52326402875' style='color:rgb(0, 121, 193); text-decoration-line:none; font-family:inherit;' target='_blank' rel='nofollow ugc noopener noreferrer'>Land Cover Vulnerability to Change 2050 Global</a><br /></div><div style='font-family:inherit;'><a href='https://arcgis.com/home/item.html?id=4f870e3f114f4ebc80477b9fcc4369bb' style='color:rgb(0, 121, 193); text-decoration-line:none; font-family:inherit;' target='_blank' rel='nofollow ugc noopener noreferrer'>Land Cover Vulnerability to Change 2050 Regional</a><br /></div><div style='font-family:inherit;'><a href='https://arcgis.com/home/item.html?id=20bfd812017e4bc1a241d2581c156bcd' style='color:rgb(0, 121, 193); text-decoration-line:none; font-family:inherit;' target='_blank' rel='nofollow ugc noopener noreferrer'>Land Cover Vulnerability to Change 2050 Country</a></div></div><div style='font-family:&quot;Avenir Next W01&quot;, &quot;Avenir Next W00&quot;, &quot;Avenir Next&quot;, Avenir, &quot;Helvetica Neue&quot;, sans-serif; font-size:16px;'><br /></div><div style='font-family:&quot;Avenir Next W01&quot;, &quot;Avenir Next W00&quot;, &quot;Avenir Next&quot;, Avenir, &quot;Helvetica Neue&quot;, sans-serif; font-size:16px;'><b>What these layers model (and what they don’t model)</b></div><div style='font-family:&quot;Avenir Next W01&quot;, &quot;Avenir Next W00&quot;, &quot;Avenir Next&quot;, Avenir, &quot;Helvetica Neue&quot;, sans-serif; font-size:16px;'><br /></div><div style='font-family:&quot;Avenir Next W01&quot;, &quot;Avenir Next W00&quot;, &quot;Avenir Next&quot;, Avenir, &quot;Helvetica Neue&quot;, sans-serif; font-size:16px;'>The model focuses on human-based land cover changes and projects the extent of these changes to the year 2050. It seeks to find where agricultural and urban land cover will cover the planet in that year, and what areas are most vulnerable to change due to the expansion of the human footprint. It does not predict changes to other land cover types such as forests or other natural vegetation during that time period unless it is replaced by agriculture or urban land cover. It also doesn’t predict sea level rise unless the model detected a pattern in changes in bodies of water between 2010 and 2018. A few 300m pixels might have changed due to sea level rise during that timeframe, but not many.</div><div style='font-family:&quot;Avenir Next W01&quot;, &quot;Avenir Next W00&quot;, &quot;Avenir Next&quot;, Avenir, &quot;Helvetica Neue&quot;, sans-serif; font-size:16px;'><br /></div><div style='font-family:&quot;Avenir Next W01&quot;, &quot;Avenir Next W00&quot;, &quot;Avenir Next&quot;, Avenir, &quot;Helvetica Neue&quot;, sans-serif; font-size:16px;'>The model predicts land cover changes based upon patterns it found in the period 2010-2018. But it cannot predict future land use. This is partly because current land use is not necessarily a model input. In this model, land set aside as a result of political decisions, for example military bases or nature reserves, may be found to be filled in with urban or agricultural areas in 2050. This is because the model is blind to the political decisions that affect land use.</div><div style='font-family:&quot;Avenir Next W01&quot;, &quot;Avenir Next W00&quot;, &quot;Avenir Next&quot;, Avenir, &quot;Helvetica Neue&quot;, sans-serif; font-size:16px;'><br /></div><div style='font-family:&quot;Avenir Next W01&quot;, &quot;Avenir Next W00&quot;, &quot;Avenir Next&quot;, Avenir, &quot;Helvetica Neue&quot;, sans-serif; font-size:16px;'><b>Quantitative Variables used to create Models</b></div><div style='font-family:&quot;Avenir Next W01&quot;, &quot;Avenir Next W00&quot;, &quot;Avenir Next&quot;, Avenir, &quot;Helvetica Neue&quot;, sans-serif; font-size:16px;'><ul><li>Biomass</li><li>Crop Suitability</li><li>Distance to Airports</li><li>Distance to Cropland 2010</li><li>Distance to Primary Roads</li><li>Distance to Railroads</li><li>Distance to Secondary Roads</li><li>Distance to Settled Areas</li><li>Distance to Urban 2010</li><li>Elevation</li><li>GDP</li><li>Human Influence Index</li><li>Population Density</li><li>Precipitation</li><li>Regions </li><li>Slope</li><li>Temperature</li></ul></div><div style='font-family:&quot;Avenir Next W01&quot;, &quot;Avenir Next W00&quot;, &quot;Avenir Next&quot;, Avenir, &quot;Helvetica Neue&quot;, sans-serif; font-size:16px;'><br /></div><div style='font-family:&quot;Avenir Next W01&quot;, &quot;Avenir Next W00&quot;, &quot;Avenir Next&quot;, Avenir, &quot;Helvetica Neue&quot;, sans-serif; font-size:16px;'><b>Qualitative Variables used to create Models</b></div><div style='font-family:&quot;Avenir Next W01&quot;, &quot;Avenir Next W00&quot;, &quot;Avenir Next&quot;, Avenir, &quot;Helvetica Neue&quot;, sans-serif; font-size:16px;'><ul><li>Biomes</li><li>Ecoregions</li><li>Irrigated Crops</li><li>Protected Areas</li><li>Provinces</li><li>Rainfed Crops</li><li>Soil Classification</li><li>Soil Depth</li><li>Soil Drainage</li><li>Soil pH</li><li>Soil Texture</li></ul></div><div style='font-family:&quot;Avenir Next W01&quot;, &quot;Avenir Next W00&quot;, &quot;Avenir Next&quot;, Avenir, &quot;Helvetica Neue&quot;, sans-serif; font-size:16px;'><b>Were small countries modeled?</b></div><div style='font-family:&quot;Avenir Next W01&quot;, &quot;Avenir Next W00&quot;, &quot;Avenir Next&quot;, Avenir, &quot;Helvetica Neue&quot;, sans-serif; font-size:16px;'><br /></div><div style='font-family:&quot;Avenir Next W01&quot;, &quot;Avenir Next W00&quot;, &quot;Avenir Next&quot;, Avenir, &quot;Helvetica Neue&quot;, sans-serif; font-size:16px;'>Clark University modeled some small countries that had a few transitions. Only five countries were modeled with this procedure: Bhutan, North Macedonia, Palau, Singapore and Vanuatu.</div><div style='font-family:&quot;Avenir Next W01&quot;, &quot;Avenir Next W00&quot;, &quot;Avenir Next&quot;, Avenir, &quot;Helvetica Neue&quot;, sans-serif; font-size:16px;'><br /></div><div style='font-family:&quot;Avenir Next W01&quot;, &quot;Avenir Next W00&quot;, &quot;Avenir Next&quot;, Avenir, &quot;Helvetica Neue&quot;, sans-serif; font-size:16px;'>As a rule of thumb, the MLP neural network in the Land Change Modeler requires at least 100 pixels of change for model calibration. Several countries experienced less than 100 pixels of change between 2010 &amp; 2018 and therefore required an alternate modeling methodology. These countries are Bhutan, North Macedonia, Palau, Singapore and Vanuatu. To overcome the lack of samples, these select countries were resampled from 300 meters to 150 meters, effectively multiplying the number of pixels by four. As a result, we were able to empirically model countries which originally had as few as 25 pixels of change.</div><div style='font-family:&quot;Avenir Next W01&quot;, &quot;Avenir Next W00&quot;, &quot;Avenir Next&quot;, Avenir, &quot;Helvetica Neue&quot;, sans-serif; font-size:16px;'><br /></div><div style='font-family:&quot;Avenir Next W01&quot;, &quot;Avenir Next W00&quot;, &quot;Avenir Next&quot;, Avenir, &quot;Helvetica Neue&quot;, sans-serif; font-size:16px;'>Once a selected country was resampled to 150 meter resolution, three transition potential images were calibrated and averaged to produce one final transition potential image per transition. Clark Labs chose to create averaged transition potential images to limit artifacts of model overfitting. Though each model contained at least 100 samples of &quot;change&quot;, this is still relatively little for a neural network-based model and could lead to anomalous outcomes. The averaged transition potentials were used to extrapolate change and produce a final hard prediction and risk map of natural land cover conversion to Cropland and Artificial Surfaces in 2050.</div><div style='font-family:&quot;Avenir Next W01&quot;, &quot;Avenir Next W00&quot;, &quot;Avenir Next&quot;, Avenir, &quot;Helvetica Neue&quot;, sans-serif; font-size:16px;'><br /></div><div style='font-family:&quot;Avenir Next W01&quot;, &quot;Avenir Next W00&quot;, &quot;Avenir Next&quot;, Avenir, &quot;Helvetica Neue&quot;, sans-serif; font-size:16px;'><b>39 Small Countries Not Modeled</b></div><div style='font-family:&quot;Avenir Next W01&quot;, &quot;Avenir Next W00&quot;, &quot;Avenir Next&quot;, Avenir, &quot;Helvetica Neue&quot;, sans-serif; font-size:16px;'><br /></div><div style='font-family:&quot;Avenir Next W01&quot;, &quot;Avenir Next W00&quot;, &quot;Avenir Next&quot;, Avenir, &quot;Helvetica Neue&quot;, sans-serif; font-size:16px;'>There were 39 countries that were not modeled because the transitions, if any, from natural to anthropogenic were very small. In this case the land cover for 2050 for these countries are the same as the 2018 maps and their vulnerability was given a value of 0. Here were the countries not modeled:</div><div style='font-family:&quot;Avenir Next W01&quot;, &quot;Avenir Next W00&quot;, &quot;Avenir Next&quot;, Avenir, &quot;Helvetica Neue&quot;, sans-serif; font-size:16px;'><ul><li>Andorra</li><li>Antigua and Barbuda</li><li>Barbados</li><li>Cape Verde</li><li>Comoros</li><li>Cook Islands</li><li>Djibouti</li><li>Dominica</li><li>Faroe Islands</li><li>French Guyana</li><li>French Polynesia</li><li>Gibraltar</li><li>Grenada</li><li>Guam</li><li>Guyana</li><li>Iceland</li><li>Jan Mayen</li><li>Kiribati</li><li>Liechtenstein</li><li>Luxembourg</li><li>Maldives</li><li>Malta</li><li>Marshall Islands</li><li>Micronesia, Federated States of</li><li>Moldova</li><li>Monaco</li><li>Nauru</li><li>Saint Kitts and Nevis</li><li>Saint Lucia</li><li>Saint Vincent and the Grenadines</li><li>Samoa</li><li>San Marino</li><li>Seychelles</li><li>Suriname</li><li>Svalbard</li><li>The Bahamas</li><li>Tonga</li><li>Tuvalu</li><li>Vatican City</li></ul></div><div style='font-family:&quot;Avenir Next W01&quot;, &quot;Avenir Next W00&quot;, &quot;Avenir Next&quot;, Avenir, &quot;Helvetica Neue&quot;, sans-serif; font-size:16px;'><br /></div><div style='font-family:&quot;Avenir Next W01&quot;, &quot;Avenir Next W00&quot;, &quot;Avenir Next&quot;, Avenir, &quot;Helvetica Neue&quot;, sans-serif; font-size:16px;'><b>Index to land cover values in this dataset:</b></div><div style='font-family:&quot;Avenir Next W01&quot;, &quot;Avenir Next W00&quot;, &quot;Avenir Next&quot;, Avenir, &quot;Helvetica Neue&quot;, sans-serif; font-size:16px;'><br /></div><div style='font-family:&quot;Avenir Next W01&quot;, &quot;Avenir Next W00&quot;, &quot;Avenir Next&quot;, Avenir, &quot;Helvetica Neue&quot;, sans-serif; font-size:16px;'>The Clark University Land Cover 2050 projections display a ten-class land cover generalized from ESA Climate Change Initiative Land Cover. </div><div style='font-family:&quot;Avenir Next W01&quot;, &quot;Avenir Next W00&quot;, &quot;Avenir Next&quot;, Avenir, &quot;Helvetica Neue&quot;, sans-serif; font-size:16px;'><br /></div><div style='font-family:&quot;Avenir Next W01&quot;, &quot;Avenir Next W00&quot;, &quot;Avenir Next&quot;, Avenir, &quot;Helvetica Neue&quot;, sans-serif; font-size:16px;'>1    Mostly Cropland</div><div style='font-family:&quot;Avenir Next W01&quot;, &quot;Avenir Next W00&quot;, &quot;Avenir Next&quot;, Avenir, &quot;Helvetica Neue&quot;, sans-serif; font-size:16px;'>2    Grassland, Scrub, or Shrub</div><div style='font-family:&quot;Avenir Next W01&quot;, &quot;Avenir Next W00&quot;, &quot;Avenir Next&quot;, Avenir, &quot;Helvetica Neue&quot;, sans-serif; font-size:16px;'>3    Mostly Deciduous Forest</div><div style='font-family:&quot;Avenir Next W01&quot;, &quot;Avenir Next W00&quot;, &quot;Avenir Next&quot;, Avenir, &quot;Helvetica Neue&quot;, sans-serif; font-size:16px;'>4    Mostly Needleleaf/Evergreen Forest</div><div style='font-family:&quot;Avenir Next W01&quot;, &quot;Avenir Next W00&quot;, &quot;Avenir Next&quot;, Avenir, &quot;Helvetica Neue&quot;, sans-serif; font-size:16px;'>5    Sparse Vegetation</div><div style='font-family:&quot;Avenir Next W01&quot;, &quot;Avenir Next W00&quot;, &quot;Avenir Next&quot;, Avenir, &quot;Helvetica Neue&quot;, sans-serif; font-size:16px;'>6    Bare Area</div><div style='font-family:&quot;Avenir Next W01&quot;, &quot;Avenir Next W00&quot;, &quot;Avenir Next&quot;, Avenir, &quot;Helvetica Neue&quot;, sans-serif; font-size:16px;'>7    Swampy or Often Flooded Vegetation</div><div style='font-family:&quot;Avenir Next W01&quot;, &quot;Avenir Next W00&quot;, &quot;Avenir Next&quot;, Avenir, &quot;Helvetica Neue&quot;, sans-serif; font-size:16px;'>8    Artificial Surface or Urban Area</div><div style='font-family:&quot;Avenir Next W01&quot;, &quot;Avenir Next W00&quot;, &quot;Avenir Next&quot;, Avenir, &quot;Helvetica Neue&quot;, sans-serif; font-size:16px;'>9    Surface Water</div><div style='font-family:&quot;Avenir Next W01&quot;, &quot;Avenir Next W00&quot;, &quot;Avenir Next&quot;, Avenir, &quot;Helvetica Neue&quot;, sans-serif; font-size:16px;'>10    Permanent Snow and Ice</div>",
			"keyword": [
				"2050",
				"env1",
				"esri_environment",
				"environment",
				"Land Cover",
				"beta",
				"landcover",
				"conservation",
				"development",
				"ESA",
				"European Space Agency",
				"fiji",
				"landcover2050"
			],
			"issued": "2024-06-26T18:47:22.000Z",
			"modified": "2024-06-26T20:22:20.000Z",
			"publisher": {
				"name": "Pacific GeoPortal - Core Organization"
			},
			"contactPoint": {
				"@type": "vcard:Contact",
				"fn": "dkaragulle_pacificcore",
				"hasEmail": "mailto:pacific_geoportal@esri.com"
			},
			"accessLevel": "public",
			"spatial": "177.1831,-19.0663,179.4463,-17.0557",
			"license": "https://creativecommons.org/licenses/by/4.0",
			"distribution": [
				{
					"@type": "dcat:Distribution",
					"title": "ArcGIS Hub Dataset",
					"format": "Web Page",
					"mediaType": "text/html",
					"accessURL": "https://www.pacificgeoportal.com/maps/pacificcore::fiji-land-cover-2050"
				}
			],
			"theme": [
				"geospatial"
			]
		},
		{
			"@type": "dcat:Dataset",
			"identifier": "https://www.arcgis.com/home/item.html?id=ecfacd0653e74b6aa3cb07f6ecbc6930",
			"landingPage": "https://www.pacificgeoportal.com/maps/pacificcore::pacific-region-land-cover-2050-",
			"title": "Pacific Region Land Cover 2050 ",
			"description": "<span style='font-family:&quot;Avenir Next W01&quot;, &quot;Avenir Next W00&quot;, &quot;Avenir Next&quot;, Avenir, &quot;Helvetica Neue&quot;, sans-serif; font-size:16px;'>This layer is a subset of </span><a href='https://www.arcgis.com/home/item.html?id=afeaa714dd8b4553bc92898002abf145' target='_blank' rel='nofollow ugc noopener noreferrer'>Landcover 2050 Country</a><span style='font-family:&quot;Avenir Next W01&quot;, &quot;Avenir Next W00&quot;, &quot;Avenir Next&quot;, Avenir, &quot;Helvetica Neue&quot;, sans-serif; font-size:16px;'>. Use this global model layer when performing analysis across continents. This layer displays a  land cover map and model for the year 2050 at a pixel resolution of 300m for the Pacific Region. This is a subset of a Global Landcover 2050 dataset. You can access the global coverage from: </span><a href='https://www.arcgis.com/home/item.html?id=cee96e0ada6541d0bd3d67f3f8b5ce63' target='_blank' rel='nofollow ugc noopener noreferrer'>Land Cover 2050 - Global</a><span style='font-family:&quot;Avenir Next W01&quot;, &quot;Avenir Next W00&quot;, &quot;Avenir Next&quot;, Avenir, &quot;Helvetica Neue&quot;, sans-serif; font-size:16px;'> ESA CCI land cover from the years 2010 and 2018 were used to create this prediction.</span><div style='font-family:&quot;Avenir Next W01&quot;, &quot;Avenir Next W00&quot;, &quot;Avenir Next&quot;, Avenir, &quot;Helvetica Neue&quot;, sans-serif; font-size:16px;'><br /></div><div style='font-family:&quot;Avenir Next W01&quot;, &quot;Avenir Next W00&quot;, &quot;Avenir Next&quot;, Avenir, &quot;Helvetica Neue&quot;, sans-serif; font-size:16px;'><b>Variable mapped:</b> Projected land cover in 2050.</div><div style='font-family:&quot;Avenir Next W01&quot;, &quot;Avenir Next W00&quot;, &quot;Avenir Next&quot;, Avenir, &quot;Helvetica Neue&quot;, sans-serif; font-size:16px;'><b>Data Projection:</b> Cylindrical Equal Area</div><div style='font-family:&quot;Avenir Next W01&quot;, &quot;Avenir Next W00&quot;, &quot;Avenir Next&quot;, Avenir, &quot;Helvetica Neue&quot;, sans-serif; font-size:16px;'><b>Mosaic Projection</b>: Cylindrical Equal Area</div><div style='font-family:&quot;Avenir Next W01&quot;, &quot;Avenir Next W00&quot;, &quot;Avenir Next&quot;, Avenir, &quot;Helvetica Neue&quot;, sans-serif; font-size:16px;'><b>Extent:</b> Global </div><div style='font-family:&quot;Avenir Next W01&quot;, &quot;Avenir Next W00&quot;, &quot;Avenir Next&quot;, Avenir, &quot;Helvetica Neue&quot;, sans-serif; font-size:16px;'><b>Cell Size: 300m</b></div><div style='font-family:&quot;Avenir Next W01&quot;, &quot;Avenir Next W00&quot;, &quot;Avenir Next&quot;, Avenir, &quot;Helvetica Neue&quot;, sans-serif; font-size:16px;'><b>Source Type:</b> Thematic</div><div style='font-family:&quot;Avenir Next W01&quot;, &quot;Avenir Next W00&quot;, &quot;Avenir Next&quot;, Avenir, &quot;Helvetica Neue&quot;, sans-serif; font-size:16px;'><b>Visible Scale:</b> 1:50,000 and smaller</div><div style='font-family:&quot;Avenir Next W01&quot;, &quot;Avenir Next W00&quot;, &quot;Avenir Next&quot;, Avenir, &quot;Helvetica Neue&quot;, sans-serif; font-size:16px;'><b>Source: </b>Clark University</div><div style='font-family:&quot;Avenir Next W01&quot;, &quot;Avenir Next W00&quot;, &quot;Avenir Next&quot;, Avenir, &quot;Helvetica Neue&quot;, sans-serif; font-size:16px;'><b>Publication date: </b>April 2021</div><div style='font-family:&quot;Avenir Next W01&quot;, &quot;Avenir Next W00&quot;, &quot;Avenir Next&quot;, Avenir, &quot;Helvetica Neue&quot;, sans-serif; font-size:16px;'><br /></div><div style='font-family:&quot;Avenir Next W01&quot;, &quot;Avenir Next W00&quot;, &quot;Avenir Next&quot;, Avenir, &quot;Helvetica Neue&quot;, sans-serif; font-size:16px;'><b>What you can do with this layer?</b></div><div style='font-family:&quot;Avenir Next W01&quot;, &quot;Avenir Next W00&quot;, &quot;Avenir Next&quot;, Avenir, &quot;Helvetica Neue&quot;, sans-serif; font-size:16px;'><br /></div><div style='font-family:&quot;Avenir Next W01&quot;, &quot;Avenir Next W00&quot;, &quot;Avenir Next&quot;, Avenir, &quot;Helvetica Neue&quot;, sans-serif; font-size:16px;'>This layer may be added to online maps and compared with the ESA CCI Land Cover from any year from 1992 to 2018. To do this, add Global Land Cover 1992-2018 to your map and choose the processing template (image display) from that layer called “Simplified Renderer.” </div><div style='font-family:&quot;Avenir Next W01&quot;, &quot;Avenir Next W00&quot;, &quot;Avenir Next&quot;, Avenir, &quot;Helvetica Neue&quot;, sans-serif; font-size:16px;'><br /></div><div style='font-family:&quot;Avenir Next W01&quot;, &quot;Avenir Next W00&quot;, &quot;Avenir Next&quot;, Avenir, &quot;Helvetica Neue&quot;, sans-serif; font-size:16px;'>This layer can also be used in analysis in ecological planning to find specific areas that may need to be set aside before they are converted to human use.</div><div style='font-family:&quot;Avenir Next W01&quot;, &quot;Avenir Next W00&quot;, &quot;Avenir Next&quot;, Avenir, &quot;Helvetica Neue&quot;, sans-serif; font-size:16px;'><br /></div><div style='font-family:&quot;Avenir Next W01&quot;, &quot;Avenir Next W00&quot;, &quot;Avenir Next&quot;, Avenir, &quot;Helvetica Neue&quot;, sans-serif; font-size:16px;'><b>Links to the six Clark University land cover 2050 layers in ArcGIS Living Atlas of the World:</b></div><div style='font-family:&quot;Avenir Next W01&quot;, &quot;Avenir Next W00&quot;, &quot;Avenir Next&quot;, Avenir, &quot;Helvetica Neue&quot;, sans-serif; font-size:16px;'>There are three scales (country, regional, and world) for the land cover and vulnerability models. They’re all slightly different since the country model can be more fine-tuned to the drivers in that particular area. Regional (continental) and global have more spatially consistent model weights. Which should you use? If you’re analyzing one country or want to make accurate comparisons between countries, use the country level. If mapping larger patterns, use the global or regional extent (depending on your area of interest). </div><div style='font-family:&quot;Avenir Next W01&quot;, &quot;Avenir Next W00&quot;, &quot;Avenir Next&quot;, Avenir, &quot;Helvetica Neue&quot;, sans-serif; font-size:16px;'><br /></div><div style='font-family:&quot;Avenir Next W01&quot;, &quot;Avenir Next W00&quot;, &quot;Avenir Next&quot;, Avenir, &quot;Helvetica Neue&quot;, sans-serif; font-size:16px;'><div><a href='https://arcgis.com/home/item.html?id=cee96e0ada6541d0bd3d67f3f8b5ce63' style='color:rgb(0, 121, 193); text-decoration-line:none; font-family:inherit;' target='_blank' rel='nofollow ugc noopener noreferrer'>Land Cover 2050  - Global</a><br /></div><div><a href='https://arcgis.com/home/item.html?id=ec4d1d1fe03a4e62997a7a9397cf644d' style='color:rgb(0, 121, 193); text-decoration-line:none; font-family:inherit;' target='_blank' rel='nofollow ugc noopener noreferrer'>Land Cover 2050 - Regional</a><br /></div><div><a href='https://arcgis.com/home/item.html?id=afeaa714dd8b4553bc92898002abf145' style='color:rgb(0, 121, 193); text-decoration-line:none; font-family:inherit;' target='_blank' rel='nofollow ugc noopener noreferrer'>Land Cover 2050 - Country</a><br /></div><div><a href='https://arcgis.com/home/item.html?id=4040cafb922440f59d3ce52326402875' style='color:rgb(0, 121, 193); text-decoration-line:none; font-family:inherit;' target='_blank' rel='nofollow ugc noopener noreferrer'>Land Cover Vulnerability to Change 2050 Global</a><br /></div><div><a href='https://arcgis.com/home/item.html?id=4f870e3f114f4ebc80477b9fcc4369bb' style='color:rgb(0, 121, 193); text-decoration-line:none; font-family:inherit;' target='_blank' rel='nofollow ugc noopener noreferrer'>Land Cover Vulnerability to Change 2050 Regional</a><br /></div><div><a href='https://arcgis.com/home/item.html?id=20bfd812017e4bc1a241d2581c156bcd' style='color:rgb(0, 121, 193); text-decoration-line:none; font-family:inherit;' target='_blank' rel='nofollow ugc noopener noreferrer'>Land Cover Vulnerability to Change 2050 Country</a></div></div><div style='font-family:&quot;Avenir Next W01&quot;, &quot;Avenir Next W00&quot;, &quot;Avenir Next&quot;, Avenir, &quot;Helvetica Neue&quot;, sans-serif; font-size:16px;'><br /></div><div style='font-family:&quot;Avenir Next W01&quot;, &quot;Avenir Next W00&quot;, &quot;Avenir Next&quot;, Avenir, &quot;Helvetica Neue&quot;, sans-serif; font-size:16px;'><b>What these layers model (and what they don’t model)</b></div><div style='font-family:&quot;Avenir Next W01&quot;, &quot;Avenir Next W00&quot;, &quot;Avenir Next&quot;, Avenir, &quot;Helvetica Neue&quot;, sans-serif; font-size:16px;'><br /></div><div style='font-family:&quot;Avenir Next W01&quot;, &quot;Avenir Next W00&quot;, &quot;Avenir Next&quot;, Avenir, &quot;Helvetica Neue&quot;, sans-serif; font-size:16px;'>The model focuses on human-based land cover changes and projects the extent of these changes to the year 2050. It seeks to find where agricultural and urban land cover will cover the planet in that year, and what areas are most vulnerable to change due to the expansion of the human footprint. It does not predict changes to other land cover types such as forests or other natural vegetation during that time period unless it is replaced by agriculture or urban land cover. It also doesn’t predict sea level rise unless the model detected a pattern in changes in bodies of water between 2010 and 2018. A few 300m pixels might have changed due to sea level rise during that timeframe, but not many.</div><div style='font-family:&quot;Avenir Next W01&quot;, &quot;Avenir Next W00&quot;, &quot;Avenir Next&quot;, Avenir, &quot;Helvetica Neue&quot;, sans-serif; font-size:16px;'><br /></div><div style='font-family:&quot;Avenir Next W01&quot;, &quot;Avenir Next W00&quot;, &quot;Avenir Next&quot;, Avenir, &quot;Helvetica Neue&quot;, sans-serif; font-size:16px;'>The model predicts land cover changes based upon patterns it found in the period 2010-2018. But it cannot predict future land use. This is partly because current land use is not necessarily a model input. In this model, land set aside as a result of political decisions, for example military bases or nature reserves, may be found to be filled in with urban or agricultural areas in 2050. This is because the model is blind to the political decisions that affect land use.</div><div style='font-family:&quot;Avenir Next W01&quot;, &quot;Avenir Next W00&quot;, &quot;Avenir Next&quot;, Avenir, &quot;Helvetica Neue&quot;, sans-serif; font-size:16px;'><br /></div><div style='font-family:&quot;Avenir Next W01&quot;, &quot;Avenir Next W00&quot;, &quot;Avenir Next&quot;, Avenir, &quot;Helvetica Neue&quot;, sans-serif; font-size:16px;'><b>Quantitative Variables used to create Models</b></div><div style='font-family:&quot;Avenir Next W01&quot;, &quot;Avenir Next W00&quot;, &quot;Avenir Next&quot;, Avenir, &quot;Helvetica Neue&quot;, sans-serif; font-size:16px;'><ul><li>Biomass</li><li>Crop Suitability</li><li>Distance to Airports</li><li>Distance to Cropland 2010</li><li>Distance to Primary Roads</li><li>Distance to Railroads</li><li>Distance to Secondary Roads</li><li>Distance to Settled Areas</li><li>Distance to Urban 2010</li><li>Elevation</li><li>GDP</li><li>Human Influence Index</li><li>Population Density</li><li>Precipitation</li><li>Regions </li><li>Slope</li><li>Temperature</li></ul></div><div style='font-family:&quot;Avenir Next W01&quot;, &quot;Avenir Next W00&quot;, &quot;Avenir Next&quot;, Avenir, &quot;Helvetica Neue&quot;, sans-serif; font-size:16px;'><br /></div><div style='font-family:&quot;Avenir Next W01&quot;, &quot;Avenir Next W00&quot;, &quot;Avenir Next&quot;, Avenir, &quot;Helvetica Neue&quot;, sans-serif; font-size:16px;'><b>Qualitative Variables used to create Models</b></div><div style='font-family:&quot;Avenir Next W01&quot;, &quot;Avenir Next W00&quot;, &quot;Avenir Next&quot;, Avenir, &quot;Helvetica Neue&quot;, sans-serif; font-size:16px;'><ul><li>Biomes</li><li>Ecoregions</li><li>Irrigated Crops</li><li>Protected Areas</li><li>Provinces</li><li>Rainfed Crops</li><li>Soil Classification</li><li>Soil Depth</li><li>Soil Drainage</li><li>Soil pH</li><li>Soil Texture</li></ul></div><div style='font-family:&quot;Avenir Next W01&quot;, &quot;Avenir Next W00&quot;, &quot;Avenir Next&quot;, Avenir, &quot;Helvetica Neue&quot;, sans-serif; font-size:16px;'><b>Were small countries modeled?</b></div><div style='font-family:&quot;Avenir Next W01&quot;, &quot;Avenir Next W00&quot;, &quot;Avenir Next&quot;, Avenir, &quot;Helvetica Neue&quot;, sans-serif; font-size:16px;'><br /></div><div style='font-family:&quot;Avenir Next W01&quot;, &quot;Avenir Next W00&quot;, &quot;Avenir Next&quot;, Avenir, &quot;Helvetica Neue&quot;, sans-serif; font-size:16px;'>Clark University modeled some small countries that had a few transitions. Only five countries were modeled with this procedure: Bhutan, North Macedonia, Palau, Singapore and Vanuatu.</div><div style='font-family:&quot;Avenir Next W01&quot;, &quot;Avenir Next W00&quot;, &quot;Avenir Next&quot;, Avenir, &quot;Helvetica Neue&quot;, sans-serif; font-size:16px;'><br /></div><div style='font-family:&quot;Avenir Next W01&quot;, &quot;Avenir Next W00&quot;, &quot;Avenir Next&quot;, Avenir, &quot;Helvetica Neue&quot;, sans-serif; font-size:16px;'>As a rule of thumb, the MLP neural network in the Land Change Modeler requires at least 100 pixels of change for model calibration. Several countries experienced less than 100 pixels of change between 2010 &amp; 2018 and therefore required an alternate modeling methodology. These countries are Bhutan, North Macedonia, Palau, Singapore and Vanuatu. To overcome the lack of samples, these select countries were resampled from 300 meters to 150 meters, effectively multiplying the number of pixels by four. As a result, we were able to empirically model countries which originally had as few as 25 pixels of change.</div><div style='font-family:&quot;Avenir Next W01&quot;, &quot;Avenir Next W00&quot;, &quot;Avenir Next&quot;, Avenir, &quot;Helvetica Neue&quot;, sans-serif; font-size:16px;'><br /></div><div style='font-family:&quot;Avenir Next W01&quot;, &quot;Avenir Next W00&quot;, &quot;Avenir Next&quot;, Avenir, &quot;Helvetica Neue&quot;, sans-serif; font-size:16px;'>Once a selected country was resampled to 150 meter resolution, three transition potential images were calibrated and averaged to produce one final transition potential image per transition. Clark Labs chose to create averaged transition potential images to limit artifacts of model overfitting. Though each model contained at least 100 samples of &quot;change&quot;, this is still relatively little for a neural network-based model and could lead to anomalous outcomes. The averaged transition potentials were used to extrapolate change and produce a final hard prediction and risk map of natural land cover conversion to Cropland and Artificial Surfaces in 2050.</div><div style='font-family:&quot;Avenir Next W01&quot;, &quot;Avenir Next W00&quot;, &quot;Avenir Next&quot;, Avenir, &quot;Helvetica Neue&quot;, sans-serif; font-size:16px;'><br /></div><div style='font-family:&quot;Avenir Next W01&quot;, &quot;Avenir Next W00&quot;, &quot;Avenir Next&quot;, Avenir, &quot;Helvetica Neue&quot;, sans-serif; font-size:16px;'><b>39 Small Countries Not Modeled</b></div><div style='font-family:&quot;Avenir Next W01&quot;, &quot;Avenir Next W00&quot;, &quot;Avenir Next&quot;, Avenir, &quot;Helvetica Neue&quot;, sans-serif; font-size:16px;'><br /></div><div style='font-family:&quot;Avenir Next W01&quot;, &quot;Avenir Next W00&quot;, &quot;Avenir Next&quot;, Avenir, &quot;Helvetica Neue&quot;, sans-serif; font-size:16px;'>There were 39 countries that were not modeled because the transitions, if any, from natural to anthropogenic were very small. In this case the land cover for 2050 for these countries are the same as the 2018 maps and their vulnerability was given a value of 0. Here were the countries not modeled:</div><div style='font-family:&quot;Avenir Next W01&quot;, &quot;Avenir Next W00&quot;, &quot;Avenir Next&quot;, Avenir, &quot;Helvetica Neue&quot;, sans-serif; font-size:16px;'><ul><li>Andorra</li><li>Antigua and Barbuda</li><li>Barbados</li><li>Cape Verde</li><li>Comoros</li><li>Cook Islands</li><li>Djibouti</li><li>Dominica</li><li>Faroe Islands</li><li>French Guyana</li><li>French Polynesia</li><li>Gibraltar</li><li>Grenada</li><li>Guam</li><li>Guyana</li><li>Iceland</li><li>Jan Mayen</li><li>Kiribati</li><li>Liechtenstein</li><li>Luxembourg</li><li>Maldives</li><li>Malta</li><li>Marshall Islands</li><li>Micronesia, Federated States of</li><li>Moldova</li><li>Monaco</li><li>Nauru</li><li>Saint Kitts and Nevis</li><li>Saint Lucia</li><li>Saint Vincent and the Grenadines</li><li>Samoa</li><li>San Marino</li><li>Seychelles</li><li>Suriname</li><li>Svalbard</li><li>The Bahamas</li><li>Tonga</li><li>Tuvalu</li><li>Vatican City</li></ul></div><div style='font-family:&quot;Avenir Next W01&quot;, &quot;Avenir Next W00&quot;, &quot;Avenir Next&quot;, Avenir, &quot;Helvetica Neue&quot;, sans-serif; font-size:16px;'><br /></div><div style='font-family:&quot;Avenir Next W01&quot;, &quot;Avenir Next W00&quot;, &quot;Avenir Next&quot;, Avenir, &quot;Helvetica Neue&quot;, sans-serif; font-size:16px;'><b>Index to land cover values in this dataset:</b></div><div style='font-family:&quot;Avenir Next W01&quot;, &quot;Avenir Next W00&quot;, &quot;Avenir Next&quot;, Avenir, &quot;Helvetica Neue&quot;, sans-serif; font-size:16px;'><br /></div><div style='font-family:&quot;Avenir Next W01&quot;, &quot;Avenir Next W00&quot;, &quot;Avenir Next&quot;, Avenir, &quot;Helvetica Neue&quot;, sans-serif; font-size:16px;'>The Clark University Land Cover 2050 projections display a ten-class land cover generalized from ESA Climate Change Initiative Land Cover. </div><div style='font-family:&quot;Avenir Next W01&quot;, &quot;Avenir Next W00&quot;, &quot;Avenir Next&quot;, Avenir, &quot;Helvetica Neue&quot;, sans-serif; font-size:16px;'><br /></div><div style='font-family:&quot;Avenir Next W01&quot;, &quot;Avenir Next W00&quot;, &quot;Avenir Next&quot;, Avenir, &quot;Helvetica Neue&quot;, sans-serif; font-size:16px;'>1    Mostly Cropland</div><div style='font-family:&quot;Avenir Next W01&quot;, &quot;Avenir Next W00&quot;, &quot;Avenir Next&quot;, Avenir, &quot;Helvetica Neue&quot;, sans-serif; font-size:16px;'>2    Grassland, Scrub, or Shrub</div><div style='font-family:&quot;Avenir Next W01&quot;, &quot;Avenir Next W00&quot;, &quot;Avenir Next&quot;, Avenir, &quot;Helvetica Neue&quot;, sans-serif; font-size:16px;'>3    Mostly Deciduous Forest</div><div style='font-family:&quot;Avenir Next W01&quot;, &quot;Avenir Next W00&quot;, &quot;Avenir Next&quot;, Avenir, &quot;Helvetica Neue&quot;, sans-serif; font-size:16px;'>4    Mostly Needleleaf/Evergreen Forest</div><div style='font-family:&quot;Avenir Next W01&quot;, &quot;Avenir Next W00&quot;, &quot;Avenir Next&quot;, Avenir, &quot;Helvetica Neue&quot;, sans-serif; font-size:16px;'>5    Sparse Vegetation</div><div style='font-family:&quot;Avenir Next W01&quot;, &quot;Avenir Next W00&quot;, &quot;Avenir Next&quot;, Avenir, &quot;Helvetica Neue&quot;, sans-serif; font-size:16px;'>6    Bare Area</div><div style='font-family:&quot;Avenir Next W01&quot;, &quot;Avenir Next W00&quot;, &quot;Avenir Next&quot;, Avenir, &quot;Helvetica Neue&quot;, sans-serif; font-size:16px;'>7    Swampy or Often Flooded Vegetation</div><div style='font-family:&quot;Avenir Next W01&quot;, &quot;Avenir Next W00&quot;, &quot;Avenir Next&quot;, Avenir, &quot;Helvetica Neue&quot;, sans-serif; font-size:16px;'>8    Artificial Surface or Urban Area</div><div style='font-family:&quot;Avenir Next W01&quot;, &quot;Avenir Next W00&quot;, &quot;Avenir Next&quot;, Avenir, &quot;Helvetica Neue&quot;, sans-serif; font-size:16px;'>9    Surface Water</div><div style='font-family:&quot;Avenir Next W01&quot;, &quot;Avenir Next W00&quot;, &quot;Avenir Next&quot;, Avenir, &quot;Helvetica Neue&quot;, sans-serif; font-size:16px;'>10    Permanent Snow and Ice</div>",
			"keyword": [
				"2050",
				"env1",
				"esri_environment",
				"environment",
				"Land Cover",
				"beta",
				"landcover",
				"conservation",
				"development",
				"ESA",
				"European Space Agency"
			],
			"issued": "2023-09-20T18:20:04.000Z",
			"modified": "2024-06-26T20:22:14.000Z",
			"publisher": {
				"name": "Pacific GeoPortal - Core Organization"
			},
			"contactPoint": {
				"@type": "vcard:Contact",
				"fn": "dkaragulle_pacificcore",
				"hasEmail": "mailto:pacific_geoportal@esri.com"
			},
			"accessLevel": "public",
			"spatial": "144.3604,-18.9998,167.5195,0.5713",
			"license": "https://creativecommons.org/licenses/by/4.0",
			"distribution": [
				{
					"@type": "dcat:Distribution",
					"title": "ArcGIS Hub Dataset",
					"format": "Web Page",
					"mediaType": "text/html",
					"accessURL": "https://www.pacificgeoportal.com/maps/pacificcore::pacific-region-land-cover-2050-"
				}
			],
			"theme": [
				"geospatial"
			]
		},
		{
			"@type": "dcat:Dataset",
			"identifier": "https://www.arcgis.com/home/item.html?id=2a7a04c681de43eb987194289b67a506",
			"landingPage": "https://www.pacificgeoportal.com/maps/pacificcore::fiji-land-cover-1992-2020",
			"title": "Fiji Land Cover 1992-2020",
			"description": "<div style='font-family:&quot;Avenir Next W01&quot;, &quot;Avenir Next W00&quot;, &quot;Avenir Next&quot;, Avenir, &quot;Helvetica Neue&quot;, sans-serif; font-size:16px;'>This layer is a subset of <a href='https://www.arcgis.com/home/item.html?id=1453082255024699af55c960bc3dc1fe' style='color:rgb(0, 97, 155); text-decoration-line:none; font-family:inherit;' target='_blank' rel='nofollow ugc noopener noreferrer'>Global Landcover 1992- 2020 Layer</a> focused on Fiji. This layer is a time series of the annual ESA CCI (Climate Change Initiative) land cover maps of the world. ESA has produced land cover maps for the years 1992-2020. These are available at the <a href='https://climate.esa.int/en/' style='color:rgb(0, 97, 155); text-decoration-line:none; font-family:inherit;' target='_blank' rel='nofollow ugc noopener noreferrer'>European Space Agency Climate Change Initiative website</a>.</div><div style='font-family:&quot;Avenir Next W01&quot;, &quot;Avenir Next W00&quot;, &quot;Avenir Next&quot;, Avenir, &quot;Helvetica Neue&quot;, sans-serif; font-size:16px;'><br /></div><div style='font-family:&quot;Avenir Next W01&quot;, &quot;Avenir Next W00&quot;, &quot;Avenir Next&quot;, Avenir, &quot;Helvetica Neue&quot;, sans-serif; font-size:16px;'><span style='font-family:inherit; font-weight:bold;'>Time Extent: </span>1992-2020<br /><span style='font-family:inherit; font-weight:bold;'>Cell Size: </span>300 meter<br /><span style='font-family:inherit; font-weight:bold;'>Source Type:</span> Thematic<br /><span style='font-family:inherit; font-weight:bold;'>Pixel Type:</span> 8 Bit Unsigned<br /><span style='font-family:inherit; font-weight:bold;'>Data Projection: </span>GCS WGS84<br /><span style='font-family:inherit; font-weight:bold;'>Mosaic Projection:</span> Web Mercator Auxiliary Sphere<br /><span style='font-family:inherit; font-weight:bold;'>Extent: </span>Global<br /><span style='font-family:inherit; font-weight:bold;'>Source:</span> ESA Climate Change Initiative<br /><span style='font-family:inherit; font-weight:bold;'>Update Cycle:</span> Annual until 2020, no updates thereafter<br /></div><div style='font-family:&quot;Avenir Next W01&quot;, &quot;Avenir Next W00&quot;, &quot;Avenir Next&quot;, Avenir, &quot;Helvetica Neue&quot;, sans-serif; font-size:16px;'><br /></div><div style='font-family:&quot;Avenir Next W01&quot;, &quot;Avenir Next W00&quot;, &quot;Avenir Next&quot;, Avenir, &quot;Helvetica Neue&quot;, sans-serif; font-size:16px;'><font size='4' style='font-family:inherit;'><b>What can you do with this layer?</b></font><br /><br />This layer may be added to ArcGIS Online maps and applications and shown in a time series to watch a &quot;time lapse&quot; view of land cover change since 1992 for any part of the world. The same behavior exists when the layer is added to ArcGIS Pro.<br /><br />In addition to displaying all layers in a series, this layer may be queried so that only one year is displayed in a map. <br /><br />This layer can be used in analysis. For example, the layer may be added to ArcGIS Pro with a query set to display just one year. Then, an area count of land cover types may be produced for a feature dataset using the zonal statistics tool. Statistics may be compared with the statistics from other years to show a trend.<br /><br />To sum up area by land cover using this service, or any other analysis, be sure to use an equal area projection, such as Albers or <a href='https://desktop.arcgis.com/en/arcmap/latest/map/projections/equal-earth.htm' style='color:rgb(0, 97, 155); text-decoration-line:none; font-family:inherit;' target='_blank' rel='nofollow ugc noopener noreferrer'>Equal Earth</a>.<br /></div><div style='font-family:&quot;Avenir Next W01&quot;, &quot;Avenir Next W00&quot;, &quot;Avenir Next&quot;, Avenir, &quot;Helvetica Neue&quot;, sans-serif; font-size:16px;'><br /></div><div style='font-family:&quot;Avenir Next W01&quot;, &quot;Avenir Next W00&quot;, &quot;Avenir Next&quot;, Avenir, &quot;Helvetica Neue&quot;, sans-serif; font-size:16px;'><span style='font-family:inherit; font-weight:bold;'><font size='4' style='font-family:inherit;'>Different Classifications Available to Map</font><br /></span></div><div style='font-family:&quot;Avenir Next W01&quot;, &quot;Avenir Next W00&quot;, &quot;Avenir Next&quot;, Avenir, &quot;Helvetica Neue&quot;, sans-serif; font-size:16px;'><br /></div><div style='font-family:&quot;Avenir Next W01&quot;, &quot;Avenir Next W00&quot;, &quot;Avenir Next&quot;, Avenir, &quot;Helvetica Neue&quot;, sans-serif; font-size:16px;'>Five processing templates are included in this layer. The processing templates may be used to display a smaller set of land cover classes.<br /><i><br />Cartographic Renderer (Default Template)</i><br />Displays all ESA CCI land cover classes.*<br /><br /><i>Forested lands Template</i><br />The forested lands template shows only forested lands (classes 50-90).<br /><br /><i>Urban Lands Template</i><br />The urban lands template shows only urban areas (class 190).<br /><br /><i>Converted Lands Template</i><br />The converted lands template shows only urban lands and lands converted to agriculture (classes 10-40 and 190).</div><div style='font-family:&quot;Avenir Next W01&quot;, &quot;Avenir Next W00&quot;, &quot;Avenir Next&quot;, Avenir, &quot;Helvetica Neue&quot;, sans-serif; font-size:16px;'><br /></div><div style='font-family:&quot;Avenir Next W01&quot;, &quot;Avenir Next W00&quot;, &quot;Avenir Next&quot;, Avenir, &quot;Helvetica Neue&quot;, sans-serif; font-size:16px;'><i>Simplified Renderer</i><br />Displays the map in ten simple classes which match the ten simplified classes used in 2050 Land Cover projections from Clark University.<br /></div><div style='font-family:&quot;Avenir Next W01&quot;, &quot;Avenir Next W00&quot;, &quot;Avenir Next&quot;, Avenir, &quot;Helvetica Neue&quot;, sans-serif; font-size:16px;'><br /></div><div style='font-family:&quot;Avenir Next W01&quot;, &quot;Avenir Next W00&quot;, &quot;Avenir Next&quot;, Avenir, &quot;Helvetica Neue&quot;, sans-serif; font-size:16px;'>Any of these variables can be displayed or analyzed by selecting their processing template. In ArcGIS Online, select the Image Display Options on the layer. Then pull down the list of variables from the Renderer options. Click Apply and Close. In ArcGIS Pro, go into the Layer Properties. Select Processing Templates from the left hand menu. From the Processing Template pull down menu, select the variable to display.<br /></div><div style='font-family:&quot;Avenir Next W01&quot;, &quot;Avenir Next W00&quot;, &quot;Avenir Next&quot;, Avenir, &quot;Helvetica Neue&quot;, sans-serif; font-size:16px;'><br /></div><div style='font-family:&quot;Avenir Next W01&quot;, &quot;Avenir Next W00&quot;, &quot;Avenir Next&quot;, Avenir, &quot;Helvetica Neue&quot;, sans-serif; font-size:16px;'><span style='font-family:inherit; font-weight:bold;'>Using Time</span><br />By default, the map will display as a time series animation, one year per frame. A time slider will appear when you add this layer to your map. To see the most current data, move the time slider until you see the most current year.<br /></div><div style='font-family:&quot;Avenir Next W01&quot;, &quot;Avenir Next W00&quot;, &quot;Avenir Next&quot;, Avenir, &quot;Helvetica Neue&quot;, sans-serif; font-size:16px;'><br /></div><div style='font-family:&quot;Avenir Next W01&quot;, &quot;Avenir Next W00&quot;, &quot;Avenir Next&quot;, Avenir, &quot;Helvetica Neue&quot;, sans-serif; font-size:16px;'>In addition to displaying the past quarter century of land cover maps as an animation, this time series can also display just one year of data by use of a definition query. For a step by step example using ArcGIS Pro on how to display just one year of this layer, as well as to compare one year to another, see the blog called <a href='https://www.esri.com/arcgis-blog/products/arcgis-pro/water/changing-hydrology-calculating-impervious-surface-change-with-arcgis-pro/' style='color:rgb(0, 97, 155); text-decoration-line:none; font-family:inherit;' target='_blank' rel='nofollow ugc noopener noreferrer'>Calculating Impervious Surface Change</a>.<br /><br /><span style='font-family:inherit; font-weight:bold;'>Hierarchical Classification</span><br />Land cover types are defined using the land cover classification (LCCS) developed by the United Nations, FAO. It is designed to be as compatible as possible with other products, namely GLCC2000, GlobCover 2005 and 2009.<br /></div><div style='font-family:&quot;Avenir Next W01&quot;, &quot;Avenir Next W00&quot;, &quot;Avenir Next&quot;, Avenir, &quot;Helvetica Neue&quot;, sans-serif; font-size:16px;'><br /></div><div style='font-family:&quot;Avenir Next W01&quot;, &quot;Avenir Next W00&quot;, &quot;Avenir Next&quot;, Avenir, &quot;Helvetica Neue&quot;, sans-serif; font-size:16px;'>This is a heirarchical classification system. For example, class 60 means &quot;closed to open&quot; canopy broadleaved deciduous tree cover. But in some places a more specific type of broadleaved deciduous tree cover may be available. In that case, a more specific code 61 or 62 may be used which specifies &quot;open&quot; (61) or &quot;closed&quot; (62) cover.<br /></div><div style='font-family:&quot;Avenir Next W01&quot;, &quot;Avenir Next W00&quot;, &quot;Avenir Next&quot;, Avenir, &quot;Helvetica Neue&quot;, sans-serif; font-size:16px;'><br /></div><div style='font-family:&quot;Avenir Next W01&quot;, &quot;Avenir Next W00&quot;, &quot;Avenir Next&quot;, Avenir, &quot;Helvetica Neue&quot;, sans-serif; font-size:16px;'><span style='font-family:inherit; font-weight:bold;'>Land Cover Processing</span></div><div style='font-family:&quot;Avenir Next W01&quot;, &quot;Avenir Next W00&quot;, &quot;Avenir Next&quot;, Avenir, &quot;Helvetica Neue&quot;, sans-serif; font-size:16px;'>To provide consistency over time, these maps are produced from baseline land cover maps, and are revised for changes each year depending on the best available satellite data from each period in time. These revisions were made from AVHRR 1km time series from 1992 to 1999, SPOT-VGT time series between 1999 and 2013, and PROBA-V data for years 2013, 2014 and 2015. When MERIS FR or PROBA-V time series are available, changes detected at 1 km are re-mapped at 300 m. The last step consists in back- and up-dating the 10-year baseline LC map to produce the 24 annual LC maps from 1992 to 2015.<br /><br /><span style='font-family:inherit; font-weight:bold;'>Source data</span><br />The datasets behind this layer were extracted from NetCDF files and TIFF files produced by ESA. Years 1992-2015 were acquired from ESA CCI LC version 2.0.7 in TIFF format, and years 2016-2018 were acquired from version 2.1.1 in NetCDF format. These are downloadable from ESA with an account, after agreeing to their terms of use. https://maps.elie.ucl.ac.be/CCI/viewer/download.php<br /></div><div style='font-family:&quot;Avenir Next W01&quot;, &quot;Avenir Next W00&quot;, &quot;Avenir Next&quot;, Avenir, &quot;Helvetica Neue&quot;, sans-serif; font-size:16px;'><br /></div><div style='font-family:&quot;Avenir Next W01&quot;, &quot;Avenir Next W00&quot;, &quot;Avenir Next&quot;, Avenir, &quot;Helvetica Neue&quot;, sans-serif; font-size:16px;'><b>Citation</b></div><div style='font-family:&quot;Avenir Next W01&quot;, &quot;Avenir Next W00&quot;, &quot;Avenir Next&quot;, Avenir, &quot;Helvetica Neue&quot;, sans-serif; font-size:16px;'>ESA. Land Cover CCI Product User Guide Version 2. Tech. Rep. (2017). Available at: <a href='https://maps.elie.ucl.ac.be/CCI/viewer/download/ESACCI-LC-Ph2-PUGv2_2.0.pdf' style='color:rgb(0, 97, 155); text-decoration-line:none; font-family:inherit;' target='_blank' rel='nofollow ugc noopener noreferrer'>maps.elie.ucl.ac.be/CCI/viewer/download/ESACCI-LC-Ph2-PUGv2_2.0.pdf</a><br /></div><div style='font-family:&quot;Avenir Next W01&quot;, &quot;Avenir Next W00&quot;, &quot;Avenir Next&quot;, Avenir, &quot;Helvetica Neue&quot;, sans-serif; font-size:16px;'><div style='font-family:inherit;'><br /></div><div style='font-family:inherit;'><span style='font-family:inherit; font-weight:bold;'>More technical documentation on the source datasets is available here:</span></div><div style='font-family:inherit;'><a href='https://cds.climate.copernicus.eu/cdsapp#!/dataset/satellite-land-cover?tab=doc' style='color:rgb(0, 97, 155); text-decoration-line:none; font-family:inherit;' target='_blank' rel='nofollow ugc noopener noreferrer'>https://cds.climate.copernicus.eu/cdsapp#!/dataset/satellite-land-cover?tab=doc</a></div></div><div style='font-family:&quot;Avenir Next W01&quot;, &quot;Avenir Next W00&quot;, &quot;Avenir Next&quot;, Avenir, &quot;Helvetica Neue&quot;, sans-serif; font-size:16px;'><br /></div><div style='font-family:&quot;Avenir Next W01&quot;, &quot;Avenir Next W00&quot;, &quot;Avenir Next&quot;, Avenir, &quot;Helvetica Neue&quot;, sans-serif; font-size:16px;'><span style='font-family:inherit; font-weight:bold;'>*Index of all classes in this layer:</span><br /><br />10    Cropland, rainfed<br />11    Herbaceous cover<br />12    Tree or shrub cover<br />20    Cropland, irrigated or post-flooding<br />30    Mosaic cropland (&gt;50%) / natural vegetation (tree, shrub, herbaceous cover) (&lt;50%)<br />40    Mosaic natural vegetation (tree, shrub, herbaceous cover) (&gt;50%) / cropland (&lt;50%)<br />50    Tree cover, broadleaved, evergreen, closed to open (&gt;15%)<br />60    Tree cover, broadleaved, deciduous, closed to open (&gt;15%)<br />61    Tree cover, broadleaved, deciduous, closed (&gt;40%)<br />62    Tree cover, broadleaved, deciduous, open (15-40%)<br />70    Tree cover, needleleaved, evergreen, closed to open (&gt;15%)<br />71    Tree cover, needleleaved, evergreen, closed (&gt;40%)<br />72    Tree cover, needleleaved, evergreen, open (15-40%)<br />80    Tree cover, needleleaved, deciduous, closed to open (&gt;15%)<br />81    Tree cover, needleleaved, deciduous, closed (&gt;40%)<br />82    Tree cover, needleleaved, deciduous, open (15-40%)<br />90    Tree cover, mixed leaf type (broadleaved and needleleaved)<br />100    Mosaic tree and shrub (&gt;50%) / herbaceous cover (&lt;50%)<br />110    Mosaic herbaceous cover (&gt;50%) / tree and shrub (&lt;50%)<br />120    Shrubland<br />121    Shrubland evergreen<br />122    Shrubland deciduous<br />130    Grassland<br />140    Lichens and mosses<br />150    Sparse vegetation (tree, shrub, herbaceous cover) (&lt;15%)<br />151    Sparse tree (&lt;15%)<br />152    Sparse shrub (&lt;15%)<br />153    Sparse herbaceous cover (&lt;15%)<br />160    Tree cover, flooded, fresh or brakish water<br />170    Tree cover, flooded, saline water<br />180    Shrub or herbaceous cover, flooded, fresh/saline/brakish water<br />190    Urban areas<br />200    Bare areas<br />201    Consolidated bare areas<br />202    Unconsolidated bare areas<br />210    Water bodies</div>",
			"keyword": [
				"esri_environment",
				"environment",
				"earthobs3",
				"esa",
				"cci",
				"time series",
				"time-series",
				"animation",
				"agriculture",
				"forest",
				"forests",
				"grassland",
				"grasslands",
				"urban",
				"land cover",
				"landcover",
				"climate change",
				"climate change initiative",
				"forested",
				"converted",
				"cropland",
				"herbaceous",
				"european space agency",
				"shrubland",
				"fiji"
			],
			"issued": "2024-06-26T18:34:53.000Z",
			"modified": "2024-06-26T20:18:23.000Z",
			"publisher": {
				"name": "Pacific GeoPortal - Core Organization"
			},
			"contactPoint": {
				"@type": "vcard:Contact",
				"fn": "dkaragulle_pacificcore",
				"hasEmail": "mailto:pacific_geoportal@esri.com"
			},
			"accessLevel": "public",
			"spatial": "176.8098,-19.0341,179.9162,-17.0232",
			"license": "<img src='https://downloads.esri.com/blogs/arcgisonline/esrilogo_new.png' style='max-width:100%; height:auto; font-family:&quot;Avenir Next W01&quot;, &quot;Avenir Next W00&quot;, &quot;Avenir Next&quot;, Avenir, &quot;Helvetica Neue&quot;, sans-serif; font-size:16px;' /><span style='font-family:&quot;Avenir Next W01&quot;, &quot;Avenir Next W00&quot;, &quot;Avenir Next&quot;, Avenir, &quot;Helvetica Neue&quot;, sans-serif; font-size:16px;'>This work is licensed under the Esri Master License Agreement.</span><br /><div style='font-family:&quot;Avenir Next W01&quot;, &quot;Avenir Next W00&quot;, &quot;Avenir Next&quot;, Avenir, &quot;Helvetica Neue&quot;, sans-serif; font-size:16px;'><a href='https://goto.arcgis.com/termsofuse/viewsummary' style='color:rgb(0, 97, 155); text-decoration-line:none;' target='_blank' rel='nofollow ugc noopener noreferrer'><b>View Summary</b></a> | <a href='https://goto.arcgis.com/termsofuse/viewtermsofuse' style='color:rgb(0, 97, 155); text-decoration-line:none;' target='_blank' rel='nofollow ugc noopener noreferrer'><b>View Terms of Use</b></a></div><div style='font-family:&quot;Avenir Next W01&quot;, &quot;Avenir Next W00&quot;, &quot;Avenir Next&quot;, Avenir, &quot;Helvetica Neue&quot;, sans-serif; font-size:16px;'><br /></div><div style='font-family:&quot;Avenir Next W01&quot;, &quot;Avenir Next W00&quot;, &quot;Avenir Next&quot;, Avenir, &quot;Helvetica Neue&quot;, sans-serif; font-size:16px;'><font color='#b22222'>Important Note:</font> This item requires an ArcGIS Online organizational subscription or an ArcGIS Developer account and does not consume credits. To access this item, you'll need to do one of the following:</div><div style='font-family:&quot;Avenir Next W01&quot;, &quot;Avenir Next W00&quot;, &quot;Avenir Next&quot;, Avenir, &quot;Helvetica Neue&quot;, sans-serif; font-size:16px;'><ul><li>Sign in with an account that is a member of an organizational subscription</li><li>Sign in with a developer account</li><li><a href='https://goto.arcgis.com/termsofuse/registeranapplication' style='color:rgb(0, 97, 155); text-decoration-line:none;' target='_blank' rel='nofollow ugc noopener noreferrer'>Register an application</a> and use your application's credentials.</li></ul>If you don't have an account, you can sign up for a <a href='https://goto.arcgis.com/features/trial' style='color:rgb(0, 97, 155); text-decoration-line:none;' target='_blank' rel='nofollow ugc noopener noreferrer'>free trial of ArcGIS</a> or a <a href='https://goto.arcgis.com/developers/signup' style='color:rgb(0, 97, 155); text-decoration-line:none;' target='_blank' rel='nofollow ugc noopener noreferrer'>free ArcGIS Developer account</a>.</div>",
			"distribution": [
				{
					"@type": "dcat:Distribution",
					"title": "ArcGIS Hub Dataset",
					"format": "Web Page",
					"mediaType": "text/html",
					"accessURL": "https://www.pacificgeoportal.com/maps/pacificcore::fiji-land-cover-1992-2020"
				}
			],
			"theme": [
				"geospatial"
			]
		},
		{
			"@type": "dcat:Dataset",
			"identifier": "https://www.arcgis.com/home/item.html?id=e47019138ce648aab65d425af876dc55",
			"landingPage": "https://www.pacificgeoportal.com/maps/pacificcore::pacific-region-land-cover-1992-2020",
			"title": "Pacific Region Land Cover 1992-2020",
			"description": "<div style='font-family:&quot;Avenir Next W01&quot;, &quot;Avenir Next W00&quot;, &quot;Avenir Next&quot;, Avenir, &quot;Helvetica Neue&quot;, sans-serif; font-size:16px;'>This layer is a subset of <a href='https://www.arcgis.com/home/item.html?id=1453082255024699af55c960bc3dc1fe' target='_blank' rel='nofollow ugc noopener noreferrer'>Global Landcover 1992- 2020 Layer</a>. This layer is a time series of the annual ESA CCI (Climate Change Initiative) land cover maps of the world. ESA has produced land cover maps for the years 1992-2020. These are available at the <a href='https://climate.esa.int/en/' style='color:rgb(0, 97, 155); text-decoration-line:none; font-family:inherit;' target='_blank' rel='nofollow ugc noopener noreferrer'>European Space Agency Climate Change Initiative website</a>.</div><div style='font-family:&quot;Avenir Next W01&quot;, &quot;Avenir Next W00&quot;, &quot;Avenir Next&quot;, Avenir, &quot;Helvetica Neue&quot;, sans-serif; font-size:16px;'><br /></div><div style='font-family:&quot;Avenir Next W01&quot;, &quot;Avenir Next W00&quot;, &quot;Avenir Next&quot;, Avenir, &quot;Helvetica Neue&quot;, sans-serif; font-size:16px;'><span style='font-family:inherit; font-weight:bold;'>Time Extent: </span>1992-2020<br /><span style='font-family:inherit; font-weight:bold;'>Cell Size: </span>300 meter<br /><span style='font-family:inherit; font-weight:bold;'>Source Type:</span> Thematic<br /><span style='font-family:inherit; font-weight:bold;'>Pixel Type:</span> 8 Bit Unsigned<br /><span style='font-family:inherit; font-weight:bold;'>Data Projection: </span>GCS WGS84<br /><span style='font-family:inherit; font-weight:bold;'>Mosaic Projection:</span> Web Mercator Auxiliary Sphere<br /><span style='font-family:inherit; font-weight:bold;'>Extent: </span>Global<br /><span style='font-family:inherit; font-weight:bold;'>Source:</span> ESA Climate Change Initiative<br /><span style='font-family:inherit; font-weight:bold;'>Update Cycle:</span> Annual until 2020, no updates thereafter<br /></div><div style='font-family:&quot;Avenir Next W01&quot;, &quot;Avenir Next W00&quot;, &quot;Avenir Next&quot;, Avenir, &quot;Helvetica Neue&quot;, sans-serif; font-size:16px;'><br /></div><div style='font-family:&quot;Avenir Next W01&quot;, &quot;Avenir Next W00&quot;, &quot;Avenir Next&quot;, Avenir, &quot;Helvetica Neue&quot;, sans-serif; font-size:16px;'><font size='4' style='font-family:inherit;'><b>What can you do with this layer?</b></font><br /><br />This layer may be added to ArcGIS Online maps and applications and shown in a time series to watch a &quot;time lapse&quot; view of land cover change since 1992 for any part of the world. The same behavior exists when the layer is added to ArcGIS Pro.<br /><br />In addition to displaying all layers in a series, this layer may be queried so that only one year is displayed in a map. <br /><br />This layer can be used in analysis. For example, the layer may be added to ArcGIS Pro with a query set to display just one year. Then, an area count of land cover types may be produced for a feature dataset using the zonal statistics tool. Statistics may be compared with the statistics from other years to show a trend.<br /><br />To sum up area by land cover using this service, or any other analysis, be sure to use an equal area projection, such as Albers or <a href='https://desktop.arcgis.com/en/arcmap/latest/map/projections/equal-earth.htm' style='color:rgb(0, 97, 155); text-decoration-line:none; font-family:inherit;' target='_blank' rel='nofollow ugc noopener noreferrer'>Equal Earth</a>.<br /></div><div style='font-family:&quot;Avenir Next W01&quot;, &quot;Avenir Next W00&quot;, &quot;Avenir Next&quot;, Avenir, &quot;Helvetica Neue&quot;, sans-serif; font-size:16px;'><br /></div><div style='font-family:&quot;Avenir Next W01&quot;, &quot;Avenir Next W00&quot;, &quot;Avenir Next&quot;, Avenir, &quot;Helvetica Neue&quot;, sans-serif; font-size:16px;'><span style='font-family:inherit; font-weight:bold;'><font size='4' style='font-family:inherit;'>Different Classifications Available to Map</font><br /></span></div><div style='font-family:&quot;Avenir Next W01&quot;, &quot;Avenir Next W00&quot;, &quot;Avenir Next&quot;, Avenir, &quot;Helvetica Neue&quot;, sans-serif; font-size:16px;'><br /></div><div style='font-family:&quot;Avenir Next W01&quot;, &quot;Avenir Next W00&quot;, &quot;Avenir Next&quot;, Avenir, &quot;Helvetica Neue&quot;, sans-serif; font-size:16px;'>Five processing templates are included in this layer. The processing templates may be used to display a smaller set of land cover classes.<br /><i><br />Cartographic Renderer (Default Template)</i><br />Displays all ESA CCI land cover classes.*<br /><br /><i>Forested lands Template</i><br />The forested lands template shows only forested lands (classes 50-90).<br /><br /><i>Urban Lands Template</i><br />The urban lands template shows only urban areas (class 190).<br /><br /><i>Converted Lands Template</i><br />The converted lands template shows only urban lands and lands converted to agriculture (classes 10-40 and 190).</div><div style='font-family:&quot;Avenir Next W01&quot;, &quot;Avenir Next W00&quot;, &quot;Avenir Next&quot;, Avenir, &quot;Helvetica Neue&quot;, sans-serif; font-size:16px;'><br /></div><div style='font-family:&quot;Avenir Next W01&quot;, &quot;Avenir Next W00&quot;, &quot;Avenir Next&quot;, Avenir, &quot;Helvetica Neue&quot;, sans-serif; font-size:16px;'><i>Simplified Renderer</i><br />Displays the map in ten simple classes which match the ten simplified classes used in 2050 Land Cover projections from Clark University.<br /></div><div style='font-family:&quot;Avenir Next W01&quot;, &quot;Avenir Next W00&quot;, &quot;Avenir Next&quot;, Avenir, &quot;Helvetica Neue&quot;, sans-serif; font-size:16px;'><br /></div><div style='font-family:&quot;Avenir Next W01&quot;, &quot;Avenir Next W00&quot;, &quot;Avenir Next&quot;, Avenir, &quot;Helvetica Neue&quot;, sans-serif; font-size:16px;'>Any of these variables can be displayed or analyzed by selecting their processing template. In ArcGIS Online, select the Image Display Options on the layer. Then pull down the list of variables from the Renderer options. Click Apply and Close. In ArcGIS Pro, go into the Layer Properties. Select Processing Templates from the left hand menu. From the Processing Template pull down menu, select the variable to display.<br /></div><div style='font-family:&quot;Avenir Next W01&quot;, &quot;Avenir Next W00&quot;, &quot;Avenir Next&quot;, Avenir, &quot;Helvetica Neue&quot;, sans-serif; font-size:16px;'><br /></div><div style='font-family:&quot;Avenir Next W01&quot;, &quot;Avenir Next W00&quot;, &quot;Avenir Next&quot;, Avenir, &quot;Helvetica Neue&quot;, sans-serif; font-size:16px;'><span style='font-family:inherit; font-weight:bold;'>Using Time</span><br />By default, the map will display as a time series animation, one year per frame. A time slider will appear when you add this layer to your map. To see the most current data, move the time slider until you see the most current year.<br /></div><div style='font-family:&quot;Avenir Next W01&quot;, &quot;Avenir Next W00&quot;, &quot;Avenir Next&quot;, Avenir, &quot;Helvetica Neue&quot;, sans-serif; font-size:16px;'><br /></div><div style='font-family:&quot;Avenir Next W01&quot;, &quot;Avenir Next W00&quot;, &quot;Avenir Next&quot;, Avenir, &quot;Helvetica Neue&quot;, sans-serif; font-size:16px;'>In addition to displaying the past quarter century of land cover maps as an animation, this time series can also display just one year of data by use of a definition query. For a step by step example using ArcGIS Pro on how to display just one year of this layer, as well as to compare one year to another, see the blog called <a href='https://www.esri.com/arcgis-blog/products/arcgis-pro/water/changing-hydrology-calculating-impervious-surface-change-with-arcgis-pro/' style='color:rgb(0, 97, 155); text-decoration-line:none; font-family:inherit;' target='_blank' rel='nofollow ugc noopener noreferrer'>Calculating Impervious Surface Change</a>.<br /><br /><span style='font-family:inherit; font-weight:bold;'>Hierarchical Classification</span><br />Land cover types are defined using the land cover classification (LCCS) developed by the United Nations, FAO. It is designed to be as compatible as possible with other products, namely GLCC2000, GlobCover 2005 and 2009.<br /></div><div style='font-family:&quot;Avenir Next W01&quot;, &quot;Avenir Next W00&quot;, &quot;Avenir Next&quot;, Avenir, &quot;Helvetica Neue&quot;, sans-serif; font-size:16px;'><br /></div><div style='font-family:&quot;Avenir Next W01&quot;, &quot;Avenir Next W00&quot;, &quot;Avenir Next&quot;, Avenir, &quot;Helvetica Neue&quot;, sans-serif; font-size:16px;'>This is a heirarchical classification system. For example, class 60 means &quot;closed to open&quot; canopy broadleaved deciduous tree cover. But in some places a more specific type of broadleaved deciduous tree cover may be available. In that case, a more specific code 61 or 62 may be used which specifies &quot;open&quot; (61) or &quot;closed&quot; (62) cover.<br /></div><div style='font-family:&quot;Avenir Next W01&quot;, &quot;Avenir Next W00&quot;, &quot;Avenir Next&quot;, Avenir, &quot;Helvetica Neue&quot;, sans-serif; font-size:16px;'><br /></div><div style='font-family:&quot;Avenir Next W01&quot;, &quot;Avenir Next W00&quot;, &quot;Avenir Next&quot;, Avenir, &quot;Helvetica Neue&quot;, sans-serif; font-size:16px;'><span style='font-family:inherit; font-weight:bold;'>Land Cover Processing</span></div><div style='font-family:&quot;Avenir Next W01&quot;, &quot;Avenir Next W00&quot;, &quot;Avenir Next&quot;, Avenir, &quot;Helvetica Neue&quot;, sans-serif; font-size:16px;'>To provide consistency over time, these maps are produced from baseline land cover maps, and are revised for changes each year depending on the best available satellite data from each period in time. These revisions were made from AVHRR 1km time series from 1992 to 1999, SPOT-VGT time series between 1999 and 2013, and PROBA-V data for years 2013, 2014 and 2015. When MERIS FR or PROBA-V time series are available, changes detected at 1 km are re-mapped at 300 m. The last step consists in back- and up-dating the 10-year baseline LC map to produce the 24 annual LC maps from 1992 to 2015.<br /><br /><span style='font-family:inherit; font-weight:bold;'>Source data</span><br />The datasets behind this layer were extracted from NetCDF files and TIFF files produced by ESA. Years 1992-2015 were acquired from ESA CCI LC version 2.0.7 in TIFF format, and years 2016-2018 were acquired from version 2.1.1 in NetCDF format. These are downloadable from ESA with an account, after agreeing to their terms of use. https://maps.elie.ucl.ac.be/CCI/viewer/download.php<br /></div><div style='font-family:&quot;Avenir Next W01&quot;, &quot;Avenir Next W00&quot;, &quot;Avenir Next&quot;, Avenir, &quot;Helvetica Neue&quot;, sans-serif; font-size:16px;'><br /></div><div style='font-family:&quot;Avenir Next W01&quot;, &quot;Avenir Next W00&quot;, &quot;Avenir Next&quot;, Avenir, &quot;Helvetica Neue&quot;, sans-serif; font-size:16px;'><b>Citation</b></div><div style='font-family:&quot;Avenir Next W01&quot;, &quot;Avenir Next W00&quot;, &quot;Avenir Next&quot;, Avenir, &quot;Helvetica Neue&quot;, sans-serif; font-size:16px;'>ESA. Land Cover CCI Product User Guide Version 2. Tech. Rep. (2017). Available at: <a href='https://maps.elie.ucl.ac.be/CCI/viewer/download/ESACCI-LC-Ph2-PUGv2_2.0.pdf' style='color:rgb(0, 97, 155); text-decoration-line:none; font-family:inherit;' target='_blank' rel='nofollow ugc noopener noreferrer'>maps.elie.ucl.ac.be/CCI/viewer/download/ESACCI-LC-Ph2-PUGv2_2.0.pdf</a><br /></div><div style='font-family:&quot;Avenir Next W01&quot;, &quot;Avenir Next W00&quot;, &quot;Avenir Next&quot;, Avenir, &quot;Helvetica Neue&quot;, sans-serif; font-size:16px;'><div style='font-family:inherit;'><br /></div><div style='font-family:inherit;'><span style='font-family:inherit; font-weight:bold;'>More technical documentation on the source datasets is available here:</span></div><div style='font-family:inherit;'><a href='https://cds.climate.copernicus.eu/cdsapp#!/dataset/satellite-land-cover?tab=doc' style='color:rgb(0, 97, 155); text-decoration-line:none; font-family:inherit;' target='_blank' rel='nofollow ugc noopener noreferrer'>https://cds.climate.copernicus.eu/cdsapp#!/dataset/satellite-land-cover?tab=doc</a></div></div><div style='font-family:&quot;Avenir Next W01&quot;, &quot;Avenir Next W00&quot;, &quot;Avenir Next&quot;, Avenir, &quot;Helvetica Neue&quot;, sans-serif; font-size:16px;'><br /></div><div style='font-family:&quot;Avenir Next W01&quot;, &quot;Avenir Next W00&quot;, &quot;Avenir Next&quot;, Avenir, &quot;Helvetica Neue&quot;, sans-serif; font-size:16px;'><span style='font-family:inherit; font-weight:bold;'>*Index of all classes in this layer:</span><br /><br />10    Cropland, rainfed<br />11    Herbaceous cover<br />12    Tree or shrub cover<br />20    Cropland, irrigated or post-flooding<br />30    Mosaic cropland (&gt;50%) / natural vegetation (tree, shrub, herbaceous cover) (&lt;50%)<br />40    Mosaic natural vegetation (tree, shrub, herbaceous cover) (&gt;50%) / cropland (&lt;50%)<br />50    Tree cover, broadleaved, evergreen, closed to open (&gt;15%)<br />60    Tree cover, broadleaved, deciduous, closed to open (&gt;15%)<br />61    Tree cover, broadleaved, deciduous, closed (&gt;40%)<br />62    Tree cover, broadleaved, deciduous, open (15-40%)<br />70    Tree cover, needleleaved, evergreen, closed to open (&gt;15%)<br />71    Tree cover, needleleaved, evergreen, closed (&gt;40%)<br />72    Tree cover, needleleaved, evergreen, open (15-40%)<br />80    Tree cover, needleleaved, deciduous, closed to open (&gt;15%)<br />81    Tree cover, needleleaved, deciduous, closed (&gt;40%)<br />82    Tree cover, needleleaved, deciduous, open (15-40%)<br />90    Tree cover, mixed leaf type (broadleaved and needleleaved)<br />100    Mosaic tree and shrub (&gt;50%) / herbaceous cover (&lt;50%)<br />110    Mosaic herbaceous cover (&gt;50%) / tree and shrub (&lt;50%)<br />120    Shrubland<br />121    Shrubland evergreen<br />122    Shrubland deciduous<br />130    Grassland<br />140    Lichens and mosses<br />150    Sparse vegetation (tree, shrub, herbaceous cover) (&lt;15%)<br />151    Sparse tree (&lt;15%)<br />152    Sparse shrub (&lt;15%)<br />153    Sparse herbaceous cover (&lt;15%)<br />160    Tree cover, flooded, fresh or brakish water<br />170    Tree cover, flooded, saline water<br />180    Shrub or herbaceous cover, flooded, fresh/saline/brakish water<br />190    Urban areas<br />200    Bare areas<br />201    Consolidated bare areas<br />202    Unconsolidated bare areas<br />210    Water bodies</div>",
			"keyword": [
				"esri_environment",
				"environment",
				"earthobs3",
				"esa",
				"cci",
				"time series",
				"time-series",
				"animation",
				"agriculture",
				"forest",
				"forests",
				"grassland",
				"grasslands",
				"urban",
				"land cover",
				"landcover",
				"climate change",
				"climate change initiative",
				"forested",
				"converted",
				"cropland",
				"herbaceous",
				"european space agency",
				"shrubland"
			],
			"issued": "2023-09-19T23:57:42.000Z",
			"modified": "2024-06-26T20:18:15.000Z",
			"publisher": {
				"name": "Pacific GeoPortal - Core Organization"
			},
			"contactPoint": {
				"@type": "vcard:Contact",
				"fn": "dkaragulle_pacificcore",
				"hasEmail": "mailto:pacific_geoportal@esri.com"
			},
			"accessLevel": "public",
			"spatial": "137.5049,-33.2134,180.0000,4.6066",
			"license": "<img src='https://downloads.esri.com/blogs/arcgisonline/esrilogo_new.png' style='max-width:100%; height:auto; font-family:&quot;Avenir Next W01&quot;, &quot;Avenir Next W00&quot;, &quot;Avenir Next&quot;, Avenir, &quot;Helvetica Neue&quot;, sans-serif; font-size:16px;' /><span style='font-family:&quot;Avenir Next W01&quot;, &quot;Avenir Next W00&quot;, &quot;Avenir Next&quot;, Avenir, &quot;Helvetica Neue&quot;, sans-serif; font-size:16px;'>This work is licensed under the Esri Master License Agreement.</span><br /><div style='font-family:&quot;Avenir Next W01&quot;, &quot;Avenir Next W00&quot;, &quot;Avenir Next&quot;, Avenir, &quot;Helvetica Neue&quot;, sans-serif; font-size:16px;'><a href='https://goto.arcgis.com/termsofuse/viewsummary' style='color:rgb(0, 97, 155); text-decoration-line:none;' target='_blank' rel='nofollow ugc noopener noreferrer'><b>View Summary</b></a> | <a href='https://goto.arcgis.com/termsofuse/viewtermsofuse' style='color:rgb(0, 97, 155); text-decoration-line:none;' target='_blank' rel='nofollow ugc noopener noreferrer'><b>View Terms of Use</b></a></div><div style='font-family:&quot;Avenir Next W01&quot;, &quot;Avenir Next W00&quot;, &quot;Avenir Next&quot;, Avenir, &quot;Helvetica Neue&quot;, sans-serif; font-size:16px;'><br /></div><div style='font-family:&quot;Avenir Next W01&quot;, &quot;Avenir Next W00&quot;, &quot;Avenir Next&quot;, Avenir, &quot;Helvetica Neue&quot;, sans-serif; font-size:16px;'><font color='#b22222'>Important Note:</font> This item requires an ArcGIS Online organizational subscription or an ArcGIS Developer account and does not consume credits. To access this item, you'll need to do one of the following:</div><div style='font-family:&quot;Avenir Next W01&quot;, &quot;Avenir Next W00&quot;, &quot;Avenir Next&quot;, Avenir, &quot;Helvetica Neue&quot;, sans-serif; font-size:16px;'><ul><li>Sign in with an account that is a member of an organizational subscription</li><li>Sign in with a developer account</li><li><a href='https://goto.arcgis.com/termsofuse/registeranapplication' style='color:rgb(0, 97, 155); text-decoration-line:none;' target='_blank' rel='nofollow ugc noopener noreferrer'>Register an application</a> and use your application's credentials.</li></ul>If you don't have an account, you can sign up for a <a href='https://goto.arcgis.com/features/trial' style='color:rgb(0, 97, 155); text-decoration-line:none;' target='_blank' rel='nofollow ugc noopener noreferrer'>free trial of ArcGIS</a> or a <a href='https://goto.arcgis.com/developers/signup' style='color:rgb(0, 97, 155); text-decoration-line:none;' target='_blank' rel='nofollow ugc noopener noreferrer'>free ArcGIS Developer account</a>.</div>",
			"distribution": [
				{
					"@type": "dcat:Distribution",
					"title": "ArcGIS Hub Dataset",
					"format": "Web Page",
					"mediaType": "text/html",
					"accessURL": "https://www.pacificgeoportal.com/maps/pacificcore::pacific-region-land-cover-1992-2020"
				}
			],
			"theme": [
				"geospatial"
			]
		},
		{
			"@type": "dcat:Dataset",
			"identifier": "https://www.arcgis.com/home/item.html?id=0389ad844d96442f9d54e0ad8b7b784d",
			"landingPage": "https://www.pacificgeoportal.com/maps/pacificcore::fiji-bioclimate",
			"title": "Fiji Bioclimate",
			"description": "<span style='font-family:&quot;Avenir Next W01&quot;, &quot;Avenir Next W00&quot;, &quot;Avenir Next&quot;, Avenir, &quot;Helvetica Neue&quot;, sans-serif; font-size:16px;'>This web map a subset of </span><a href='https://www.arcgis.com/home/item.html?id=5826b14592ab4ebc99574919165bd860' style='color:rgb(0, 97, 155); text-decoration-line:none; font-family:&quot;Avenir Next W01&quot;, &quot;Avenir Next W00&quot;, &quot;Avenir Next&quot;, Avenir, &quot;Helvetica Neue&quot;, sans-serif; font-size:16px;' target='_blank' rel='nofollow ugc noopener noreferrer'>World Bioclimate</a><span style='font-family:&quot;Avenir Next W01&quot;, &quot;Avenir Next W00&quot;, &quot;Avenir Next&quot;, Avenir, &quot;Helvetica Neue&quot;, sans-serif; font-size:16px;'> Feature Service to highlight Fiji. </span><div><font face='Avenir Next W01, Avenir Next W00, Avenir Next, Avenir, Helvetica Neue, sans-serif'><span style='font-size:16px;'><br /></span></font><div style='font-family:&quot;Avenir Next W01&quot;, &quot;Avenir Next W00&quot;, &quot;Avenir Next&quot;, Avenir, &quot;Helvetica Neue&quot;, sans-serif; font-size:16px;'><div>Climate plays a major role in determining the distribution of plants and animals. <a href='https://en.wikipedia.org/wiki/Bioclimatology' style='color:rgb(0, 97, 155); text-decoration-line:none; font-family:inherit;' target='_blank' rel='nofollow ugc noopener noreferrer'>Bioclimatology</a>, the study of climate as it affects and is affected by living organisms, is key to understanding the patterns of forests and deserts on the landscape, where productive agricultural lands may be found, and how changes in the climate will affect rare species. </div><div><br /></div><div>This layer is part of the Ecophysiographic Project and is one of the four input layers used to create the <a href='https://www.arcgis.com/home/item.html?id=e55c8b1919854715a0d0ca5762c4dec9' style='color:rgb(0, 97, 155); text-decoration-line:none; font-family:inherit;' target='_blank' rel='nofollow ugc noopener noreferrer'>World Ecological Land Units Map</a>.<br /></div><div><br /></div><div><font size='4' style='font-family:inherit;'>Dataset Summary </font></div><div><br /></div><div>This layer provides access to a 250m cell-sized raster with a bioclimatic stratification. The source dataset was a 30-arcsecond resolution raster (equivalent to 0.86 km2 at the equator or about a 920m pixel size). </div><div><br /></div><div>The layer has the following attributes: </div><div><br /></div><div><i><font color='#8b0000' style='font-family:inherit;'><b>Temperature Description </b></font></i>- Seven classes based on the number of growing degree days (the monthly mean temperature multiplied by number of days in the month summed for all months). The 1950 to 2000 monthly average temperature was used to calculate growing degree days. Values in this field and associated number of growing degree days are:</div><div><span style='font-family:inherit; font-size:12.7273px;'><br /></span></div><div><table border='1' cellpadding='0' cellspacing='0' style='margin-bottom:1.5rem; width:1004px; border-collapse:collapse; border-spacing:0px; border:none; font-size:0.875rem;'><tbody><tr style='border-bottom:1px solid rgb(204, 204, 204);'><td style='border-width:1pt 1pt 1.5pt; border-style:solid; border-color:rgb(153, 153, 153) rgb(153, 153, 153) rgb(102, 102, 102); padding:0in 5.4pt; width:148.25pt;' valign='top' width='198'><p style='margin-top:0px; margin-bottom:1.5rem; text-align:center;'><b><font size='2' style='font-family:inherit;'>Temperature Description</font></b></p></td><td style='border-width:1pt 1pt 1.5pt 1px; border-style:solid solid solid none; border-color:rgb(153, 153, 153) rgb(153, 153, 153) rgb(102, 102, 102) rgb(204, 204, 204); padding:0in 5.4pt; width:130.5pt;' valign='top' width='174'><p style='margin-top:0px; margin-bottom:1.5rem; text-align:center;'><b><font size='2' style='font-family:inherit;'>Growing Degree Days</font></b></p></td></tr><tr style='border-bottom:1px solid rgb(204, 204, 204);'><td style='border-left:1pt solid rgb(153, 153, 153); border-right:1pt solid rgb(153, 153, 153); padding:0in 5.4pt; width:148.25pt; border-top-style:none; border-bottom:1pt solid rgb(153, 153, 153);' valign='top' width='198'><p style='margin-top:0px; margin-bottom:1.5rem;'><b><font size='2' style='font-family:inherit;'>Very Hot</font></b></p></td><td style='border-left:1px none rgb(204, 204, 204); border-right:1pt solid rgb(153, 153, 153); padding:0in 5.4pt; width:130.5pt; border-top-style:none; border-bottom:1pt solid rgb(153, 153, 153);' valign='top' width='174'><p style='margin-top:0px; margin-bottom:1.5rem; text-align:center;'><span style='font-family:inherit; color:rgb(38, 38, 38);'><font size='2' style='font-family:inherit;'>9,000 – 13,500</font></span></p></td></tr><tr style='border-bottom:1px solid rgb(204, 204, 204);'><td style='border-left:1pt solid rgb(153, 153, 153); border-right:1pt solid rgb(153, 153, 153); padding:0in 5.4pt; width:148.25pt; border-top-style:none; border-bottom:1pt solid rgb(153, 153, 153);' valign='top' width='198'><p style='margin-top:0px; margin-bottom:1.5rem;'><b><font size='2' style='font-family:inherit;'>Hot</font></b></p></td><td style='border-left:1px none rgb(204, 204, 204); border-right:1pt solid rgb(153, 153, 153); padding:0in 5.4pt; width:130.5pt; border-top-style:none; border-bottom:1pt solid rgb(153, 153, 153);' valign='top' width='174'><p style='margin-top:0px; margin-bottom:1.5rem; text-align:center;'><span style='font-family:inherit; color:rgb(38, 38, 38);'><font size='2' style='font-family:inherit;'>7,000 – 9,000</font></span></p></td></tr><tr style='border-bottom:1px solid rgb(204, 204, 204);'><td style='border-left:1pt solid rgb(153, 153, 153); border-right:1pt solid rgb(153, 153, 153); padding:0in 5.4pt; width:148.25pt; border-top-style:none; border-bottom:1pt solid rgb(153, 153, 153);' valign='top' width='198'><p style='margin-top:0px; margin-bottom:1.5rem;'><b><font size='2' style='font-family:inherit;'>Warm</font></b></p></td><td style='border-left:1px none rgb(204, 204, 204); border-right:1pt solid rgb(153, 153, 153); padding:0in 5.4pt; width:130.5pt; border-top-style:none; border-bottom:1pt solid rgb(153, 153, 153);' valign='top' width='174'><p style='margin-top:0px; margin-bottom:1.5rem; text-align:center;'><span style='font-family:inherit; color:rgb(38, 38, 38);'><font size='2' style='font-family:inherit;'>4,500 – 7,000</font></span></p></td></tr><tr style='border-bottom:1px solid rgb(204, 204, 204);'><td style='border-left:1pt solid rgb(153, 153, 153); border-right:1pt solid rgb(153, 153, 153); padding:0in 5.4pt; width:148.25pt; border-top-style:none; border-bottom:1pt solid rgb(153, 153, 153);' valign='top' width='198'><p style='margin-top:0px; margin-bottom:1.5rem;'><b><font size='2' style='font-family:inherit;'>Cool</font></b></p></td><td style='border-left:1px none rgb(204, 204, 204); border-right:1pt solid rgb(153, 153, 153); padding:0in 5.4pt; width:130.5pt; border-top-style:none; border-bottom:1pt solid rgb(153, 153, 153);' valign='top' width='174'><p style='margin-top:0px; margin-bottom:1.5rem; text-align:center;'><span style='font-family:inherit; color:rgb(38, 38, 38);'><font size='2' style='font-family:inherit;'>2,500 – 4,500</font></span></p></td></tr><tr style='border-bottom:1px solid rgb(204, 204, 204);'><td style='border-left:1pt solid rgb(153, 153, 153); border-right:1pt solid rgb(153, 153, 153); padding:0in 5.4pt; width:148.25pt; border-top-style:none; border-bottom:1pt solid rgb(153, 153, 153);' valign='top' width='198'><p style='margin-top:0px; margin-bottom:1.5rem;'><b><font size='2' style='font-family:inherit;'>Cold</font></b></p></td><td style='border-left:1px none rgb(204, 204, 204); border-right:1pt solid rgb(153, 153, 153); padding:0in 5.4pt; width:130.5pt; border-top-style:none; border-bottom:1pt solid rgb(153, 153, 153);' valign='top' width='174'><p style='margin-top:0px; margin-bottom:1.5rem; text-align:center;'><span style='font-family:inherit; color:rgb(38, 38, 38);'><font size='2' style='font-family:inherit;'>1,000 – 2,500</font></span></p></td></tr><tr style='border-bottom:1px solid rgb(204, 204, 204);'><td style='border-left:1pt solid rgb(153, 153, 153); border-right:1pt solid rgb(153, 153, 153); padding:0in 5.4pt; width:148.25pt; border-top-style:none; border-bottom:1pt solid rgb(153, 153, 153);' valign='top' width='198'><p style='margin-top:0px; margin-bottom:1.5rem;'><b><font size='2' style='font-family:inherit;'>Very Cold</font></b></p></td><td style='border-left:1px none rgb(204, 204, 204); border-right:1pt solid rgb(153, 153, 153); padding:0in 5.4pt; width:130.5pt; border-top-style:none; border-bottom:1pt solid rgb(153, 153, 153);' valign='top' width='174'><p style='margin-top:0px; margin-bottom:1.5rem; text-align:center;'><span style='font-family:inherit; color:rgb(38, 38, 38);'><font size='2' style='font-family:inherit;'>300 – 1,000</font></span></p></td></tr><tr style='border-bottom:none;'><td style='border-left:1pt solid rgb(153, 153, 153); border-right:1pt solid rgb(153, 153, 153); padding:0in 5.4pt; width:148.25pt; border-top-style:none; border-bottom:1pt solid rgb(153, 153, 153);' valign='top' width='198'><p style='margin-top:0px; margin-bottom:1.5rem;'><b><span style='font-family:inherit; color:rgb(38, 38, 38);'><font size='2' style='font-family:inherit;'>Arctic</font></span></b></p></td><td style='border-left:1px none rgb(204, 204, 204); border-right:1pt solid rgb(153, 153, 153); padding:0in 5.4pt; width:130.5pt; border-top-style:none; border-bottom:1pt solid rgb(153, 153, 153);' valign='top' width='174'><p style='margin-top:0px; margin-bottom:1.5rem; text-align:center;'><span style='font-family:inherit; color:rgb(38, 38, 38);'><font size='2' style='font-family:inherit;'>0 - 300</font></span></p></td></tr></tbody></table></div><div><span style='font-family:inherit; font-size:12.7273px;'><br /></span></div><div><i><b><font color='#8b0000' style='font-family:inherit;'>Aridity Description</font></b></i><font color='#000000' style='font-family:inherit; font-size:12.7273px;'> </font>- Six classes based on an index of aridity calculated by dividing precipitation by evapotranspiration. Precipitation and evapotranspiration are average values from 1950 to 2000.<font color='#000000' style='font-family:inherit; font-size:12.7273px;'><br /></font></div><div><br /></div><div><table border='1' cellpadding='0' cellspacing='0' style='margin-bottom:1.5rem; width:1004px; border-collapse:collapse; border-spacing:0px; border:none; font-size:0.875rem;'><tbody><tr style='border-bottom:1px solid rgb(204, 204, 204);'><td style='border-width:1pt 1pt 1.5pt; border-style:solid; border-color:rgb(153, 153, 153) rgb(153, 153, 153) rgb(102, 102, 102); padding:0in 5.4pt; width:148.25pt;' valign='bottom' width='198'><p style='margin-top:0px; margin-bottom:1.5rem; text-align:center;'><b>Aridity Description</b></p></td><td style='border-width:1pt 1pt 1.5pt 1px; border-style:solid solid solid none; border-color:rgb(153, 153, 153) rgb(153, 153, 153) rgb(102, 102, 102) rgb(204, 204, 204); padding:0in 5.4pt; width:130.5pt;' valign='bottom' width='174'><p style='margin-top:0px; margin-bottom:1.5rem; text-align:center;'><b>Aridity Index</b></p></td></tr><tr style='border-bottom:1px solid rgb(204, 204, 204);'><td style='border-left:1pt solid rgb(153, 153, 153); border-right:1pt solid rgb(153, 153, 153); padding:0in 5.4pt; width:148.25pt; border-top-style:none; border-bottom:1pt solid rgb(153, 153, 153);' valign='bottom' width='198'><p style='margin-top:0px; margin-bottom:1.5rem; text-align:center;'><b>Very Wet</b></p></td><td style='border-left:1px none rgb(204, 204, 204); border-right:1pt solid rgb(153, 153, 153); padding:0in 5.4pt; width:130.5pt; border-top-style:none; border-bottom:1pt solid rgb(153, 153, 153);' valign='bottom' width='174'><p style='margin-top:0px; margin-bottom:1.5rem; text-align:center;'><span style='font-family:inherit; color:rgb(38, 38, 38);'>1.5 – 70</span></p></td></tr><tr style='border-bottom:1px solid rgb(204, 204, 204);'><td style='border-left:1pt solid rgb(153, 153, 153); border-right:1pt solid rgb(153, 153, 153); padding:0in 5.4pt; width:148.25pt; border-top-style:none; border-bottom:1pt solid rgb(153, 153, 153);' valign='bottom' width='198'><p style='margin-top:0px; margin-bottom:1.5rem; text-align:center;'><b>Wet</b></p></td><td style='border-left:1px none rgb(204, 204, 204); border-right:1pt solid rgb(153, 153, 153); padding:0in 5.4pt; width:130.5pt; border-top-style:none; border-bottom:1pt solid rgb(153, 153, 153);' valign='bottom' width='174'><p style='margin-top:0px; margin-bottom:1.5rem; text-align:center;'><span style='font-family:inherit; color:rgb(38, 38, 38);'>1.0 – 1.5</span></p></td></tr><tr style='border-bottom:1px solid rgb(204, 204, 204);'><td style='border-left:1pt solid rgb(153, 153, 153); border-right:1pt solid rgb(153, 153, 153); padding:0in 5.4pt; width:148.25pt; border-top-style:none; border-bottom:1pt solid rgb(153, 153, 153);' valign='bottom' width='198'><p style='margin-top:0px; margin-bottom:1.5rem; text-align:center;'><b>Moist</b></p></td><td style='border-left:1px none rgb(204, 204, 204); border-right:1pt solid rgb(153, 153, 153); padding:0in 5.4pt; width:130.5pt; border-top-style:none; border-bottom:1pt solid rgb(153, 153, 153);' valign='bottom' width='174'><p style='margin-top:0px; margin-bottom:1.5rem; text-align:center;'><span style='font-family:inherit; color:rgb(38, 38, 38);'>0.6 – 1.0</span></p></td></tr><tr style='border-bottom:1px solid rgb(204, 204, 204);'><td style='border-left:1pt solid rgb(153, 153, 153); border-right:1pt solid rgb(153, 153, 153); padding:0in 5.4pt; width:148.25pt; border-top-style:none; border-bottom:1pt solid rgb(153, 153, 153);' valign='bottom' width='198'><p style='margin-top:0px; margin-bottom:1.5rem; text-align:center;'><b>Semi-dry</b></p></td><td style='border-left:1px none rgb(204, 204, 204); border-right:1pt solid rgb(153, 153, 153); padding:0in 5.4pt; width:130.5pt; border-top-style:none; border-bottom:1pt solid rgb(153, 153, 153);' valign='bottom' width='174'><p style='margin-top:0px; margin-bottom:1.5rem; text-align:center;'><span style='font-family:inherit; color:rgb(38, 38, 38);'>0.3 – 0.6</span></p></td></tr><tr style='border-bottom:1px solid rgb(204, 204, 204);'><td style='border-left:1pt solid rgb(153, 153, 153); border-right:1pt solid rgb(153, 153, 153); padding:0in 5.4pt; width:148.25pt; border-top-style:none; border-bottom:1pt solid rgb(153, 153, 153);' valign='bottom' width='198'><p style='margin-top:0px; margin-bottom:1.5rem; text-align:center;'><b>Dry</b></p></td><td style='border-left:1px none rgb(204, 204, 204); border-right:1pt solid rgb(153, 153, 153); padding:0in 5.4pt; width:130.5pt; border-top-style:none; border-bottom:1pt solid rgb(153, 153, 153);' valign='bottom' width='174'><p style='margin-top:0px; margin-bottom:1.5rem; text-align:center;'><span style='font-family:inherit; color:rgb(38, 38, 38);'>0.1 – 0.3</span></p></td></tr><tr style='border-bottom:none;'><td style='border-left:1pt solid rgb(153, 153, 153); border-right:1pt solid rgb(153, 153, 153); padding:0in 5.4pt; width:148.25pt; border-top-style:none; border-bottom:1pt solid rgb(153, 153, 153);' valign='bottom' width='198'><p style='margin-top:0px; margin-bottom:1.5rem; text-align:center;'><b>Very Dry</b></p></td><td style='border-left:1px none rgb(204, 204, 204); border-right:1pt solid rgb(153, 153, 153); padding:0in 5.4pt; width:130.5pt; border-top-style:none; border-bottom:1pt solid rgb(153, 153, 153);' valign='bottom' width='174'><p style='margin-top:0px; margin-bottom:1.5rem; text-align:center;'><span style='font-family:inherit; color:rgb(38, 38, 38);'>0.01 – 0.1</span></p></td></tr></tbody></table></div><div><span style='font-family:inherit; font-size:12.7273px;'><i><b><font color='#8b0000' style='font-family:inherit;'><br /></font></b></i></span></div><div><b><i><font color='#8b0000' style='font-family:inherit;'>Bioclimate Class</font></i></b> - a 2-part description that combines the value of the Temperature Description field and the Aridity Description field. The alias for this field is ELU Bioclimate Reclass. </div><div><br /></div><div>This layer was created by modifying the dataset documented in the publication: <br /></div><div><a href='https://www.earthobservations.org/documents/cop/bi_geobon/outreach/201211_Metzger_GEB_inpress_1.pdf' style='color:rgb(0, 97, 155); text-decoration-line:none; font-family:inherit;' target='_blank' rel='nofollow ugc noopener noreferrer'>Metzger and others</a>. 2012. A high-resolution bioclimate map of the world: a unifying framework for global biodiversity research and monitoring. </div><div><br /></div><div><font size='4' style='font-family:inherit;'>What can you do with this layer? </font></div><div><br /></div><div>This layer is suitable for both visualization and analysis. It can be used in ArcGIS Online in web maps and applications and can be used in ArcGIS Desktop.</div><div><br /><div style='font-family:inherit; margin:0px; padding:0px;'>This layer has <a href='https://resources.arcgis.com/en/help/main/10.2/index.html#//00sp00000007000000' style='color:rgb(0, 97, 155); text-decoration-line:none; font-family:inherit;' target='_blank' rel='nofollow ugc noopener noreferrer'>query</a>, <a href='https://resources.arcgis.com/en/help/main/10.2/index.html#//00s500000010000000' style='color:rgb(0, 97, 155); text-decoration-line:none; font-family:inherit;' target='_blank' rel='nofollow ugc noopener noreferrer'>identify</a>, and <a href='https://resources.arcgis.com/en/help/main/10.2/index.html#/Downloading_data_from_an_image_service/00sp00000016000000/' style='color:rgb(0, 97, 155); text-decoration-line:none; font-family:inherit;' target='_blank' rel='nofollow ugc noopener noreferrer'>export</a> image services available. This layer is restricted to a maximum area of 16,000 x 16,000 pixels - an area 4,000 kilometers on a side or an area approximately the size of Europe. </div><div style='font-family:inherit; margin:0px; padding:0px;'><br /></div><div style='font-family:inherit; margin:0px; padding:0px;'>A service is available providing access to the data table associated with this layer. The data table services can be used by developers to quickly and efficiently query the data and to create custom applications. For more information see the <a href='https://www.arcgis.com/home/item.html?id=5c321f97872b4643a0f061e9781991cf' style='color:rgb(0, 97, 155); text-decoration-line:none; font-family:inherit;' target='_blank' rel='nofollow ugc noopener noreferrer'>World Ecophysiographic Tables</a>.<br /></div><div style='font-family:inherit; margin:0px; padding:0px;'><br /></div><div style='font-family:inherit; margin:0px; padding:0px;'>This layer is part of a larger collection of <a href='https://www.arcgis.com/home/group.html?owner=esri&amp;title=Landscape%20Layers&amp;start=131&amp;q=' style='color:rgb(0, 97, 155); text-decoration-line:none; font-family:inherit;' target='_blank' rel='nofollow ugc noopener noreferrer'>landscape layers</a> that you can use to perform a wide variety of mapping and analysis tasks.</div><div style='font-family:inherit; margin:0px; padding:0px;'><br /></div><div style='font-family:inherit; margin:0px; padding:0px;'>The <a href='https://doc.arcgis.com/en/living-atlas/#s=0&amp;n=0&amp;d=1&amp;col=&amp;fs=0&amp;fn=30&amp;npp=120&amp;subCat=0' style='color:rgb(0, 97, 155); text-decoration-line:none; font-family:inherit;' target='_blank' rel='nofollow ugc noopener noreferrer'>Living Atlas of the World</a> provides an easy way to explore the landscape layers and many other beautiful and authoritative maps on hundreds of topics.</div><div style='font-family:inherit; margin:0px; padding:0px;'><font size='3' style='font-family:inherit;'><br /></font></div><div style='font-family:inherit; margin:0px; padding:0px;'><div style='font-family:inherit; margin:0px; padding:0px;'><font size='3' style='font-family:inherit;'><a href='https://geonet.esri.com/' style='color:rgb(0, 97, 155); text-decoration-line:none; font-family:inherit;' target='_blank' rel='nofollow ugc noopener noreferrer'>Geonet</a> is a good resource for learning more about landscape layers and the Living Atlas of the World. To get started see the <a href='https://geonet.esri.com/groups/livingatlas?sr=search&amp;searchId=ec0b33d6-14bb-4319-8ad5-38961b68610e&amp;searchIndex=0' style='color:rgb(0, 97, 155); text-decoration-line:none; font-family:inherit;' target='_blank' rel='nofollow ugc noopener noreferrer'>Living Atlas Discussion Group</a>.</font></div><div style='font-family:inherit; margin:0px; padding:0px;'><font size='3' style='font-family:inherit;'><br /></font></div><div style='font-family:inherit; margin:0px; padding:0px;'><font size='3' style='font-family:inherit;'>The <a href='https://goto.arcgisonline.com/arcgis/Ecological_Land_Units/RolloutBlog' style='color:rgb(0, 97, 155); text-decoration-line:none; font-family:inherit;' target='_blank' rel='nofollow ugc noopener noreferrer'>Esri Insider Blog</a> provides an introduction to the Ecophysiographic Mapping project.</font></div></div></div></div></div>",
			"keyword": [
				"ecophysiography",
				"landscape6",
				"esri_landscape",
				"climate",
				"landscape"
			],
			"issued": "2024-06-26T18:31:59.000Z",
			"modified": "2024-06-26T18:53:52.000Z",
			"publisher": {
				"name": "Pacific GeoPortal - Core Organization"
			},
			"contactPoint": {
				"@type": "vcard:Contact",
				"fn": "dkaragulle_pacificcore",
				"hasEmail": "mailto:pacific_geoportal@esri.com"
			},
			"accessLevel": "public",
			"spatial": "177.0699,-18.9920,179.3331,-16.9806",
			"license": "<img src='https://downloads.esri.com/blogs/arcgisonline/esrilogo_new.png' style='max-width:100%; height:auto; font-family:&quot;Avenir Next W01&quot;, &quot;Avenir Next W00&quot;, &quot;Avenir Next&quot;, Avenir, &quot;Helvetica Neue&quot;, sans-serif; font-size:16px;' /><span style='font-family:&quot;Avenir Next W01&quot;, &quot;Avenir Next W00&quot;, &quot;Avenir Next&quot;, Avenir, &quot;Helvetica Neue&quot;, sans-serif; font-size:16px;'>This work is licensed under the Esri Master License Agreement.</span><br /><div style='font-family:&quot;Avenir Next W01&quot;, &quot;Avenir Next W00&quot;, &quot;Avenir Next&quot;, Avenir, &quot;Helvetica Neue&quot;, sans-serif; font-size:16px;'><a href='https://goto.arcgis.com/termsofuse/viewsummary' style='color:rgb(0, 97, 155); text-decoration-line:none;' target='_blank' rel='nofollow ugc noopener noreferrer'><b>View Summary</b></a> | <a href='https://goto.arcgis.com/termsofuse/viewtermsofuse' style='color:rgb(0, 97, 155); text-decoration-line:none;' target='_blank' rel='nofollow ugc noopener noreferrer'><b>View Terms of Use</b></a></div><div style='font-family:&quot;Avenir Next W01&quot;, &quot;Avenir Next W00&quot;, &quot;Avenir Next&quot;, Avenir, &quot;Helvetica Neue&quot;, sans-serif; font-size:16px;'><br /></div><div style='font-family:&quot;Avenir Next W01&quot;, &quot;Avenir Next W00&quot;, &quot;Avenir Next&quot;, Avenir, &quot;Helvetica Neue&quot;, sans-serif; font-size:16px;'><font color='#b22222'>Important Note:</font> This item requires an ArcGIS Online organizational subscription or an ArcGIS Developer account and does not consume credits. To access this item, you'll need to do one of the following:</div><div style='font-family:&quot;Avenir Next W01&quot;, &quot;Avenir Next W00&quot;, &quot;Avenir Next&quot;, Avenir, &quot;Helvetica Neue&quot;, sans-serif; font-size:16px;'><ul><li>Sign in with an account that is a member of an organizational subscription</li><li>Sign in with a developer account</li><li><a href='https://goto.arcgis.com/termsofuse/registeranapplication' style='color:rgb(0, 97, 155); text-decoration-line:none;' target='_blank' rel='nofollow ugc noopener noreferrer'>Register an application</a> and use your application's credentials.</li></ul>If you don't have an account, you can sign up for a <a href='https://goto.arcgis.com/features/trial' style='color:rgb(0, 97, 155); text-decoration-line:none;' target='_blank' rel='nofollow ugc noopener noreferrer'>free trial of ArcGIS</a> or a <a href='https://goto.arcgis.com/developers/signup' style='color:rgb(0, 97, 155); text-decoration-line:none;' target='_blank' rel='nofollow ugc noopener noreferrer'>free ArcGIS Developer account</a>.</div>",
			"distribution": [
				{
					"@type": "dcat:Distribution",
					"title": "ArcGIS Hub Dataset",
					"format": "Web Page",
					"mediaType": "text/html",
					"accessURL": "https://www.pacificgeoportal.com/maps/pacificcore::fiji-bioclimate"
				}
			],
			"theme": [
				"geospatial"
			]
		},
		{
			"@type": "dcat:Dataset",
			"identifier": "https://www.arcgis.com/home/item.html?id=fc8e118ff6a14dd1b658d2ca73c8a5e5",
			"landingPage": "https://www.pacificgeoportal.com/pages/pacificcore::tools",
			"title": "Tools",
			"description": "{{description}}",
			"keyword": [
				""
			],
			"issued": "2023-10-20T19:48:19.000Z",
			"modified": "2024-06-24T14:55:25.000Z",
			"publisher": {
				"name": "Pacific GeoPortal - Core Organization"
			},
			"contactPoint": {
				"@type": "vcard:Contact",
				"fn": "Pacific_Core_Admin",
				"hasEmail": "mailto:pacific_geoportal@esri.com"
			},
			"accessLevel": "public",
			"spatial": "-134.7473,23.5610,-55.6955,50.3092",
			"license": "",
			"distribution": [
				{
					"@type": "dcat:Distribution",
					"title": "ArcGIS Hub Dataset",
					"format": "Web Page",
					"mediaType": "text/html",
					"accessURL": "https://www.pacificgeoportal.com/pages/pacificcore::tools"
				}
			],
			"theme": [
				"geospatial"
			]
		},
		{
			"@type": "dcat:Dataset",
			"identifier": "https://www.arcgis.com/home/item.html?id=8ad7e2189d8a4da2aa2f6da7b5e19e52",
			"landingPage": "https://www.pacificgeoportal.com/pages/pacificcore::about",
			"title": "About",
			"description": "{{description}}",
			"keyword": [
				""
			],
			"issued": "2023-10-20T19:48:19.000Z",
			"modified": "2024-06-24T08:52:12.000Z",
			"publisher": {
				"name": "Pacific GeoPortal - Core Organization"
			},
			"contactPoint": {
				"@type": "vcard:Contact",
				"fn": "Pacific_Core_Admin",
				"hasEmail": "mailto:pacific_geoportal@esri.com"
			},
			"accessLevel": "public",
			"spatial": "-134.7473,23.5610,-55.6955,50.3092",
			"license": "",
			"distribution": [
				{
					"@type": "dcat:Distribution",
					"title": "ArcGIS Hub Dataset",
					"format": "Web Page",
					"mediaType": "text/html",
					"accessURL": "https://www.pacificgeoportal.com/pages/pacificcore::about"
				}
			],
			"theme": [
				"geospatial"
			]
		},
		{
			"@type": "dcat:Dataset",
			"identifier": "https://www.arcgis.com/home/item.html?id=2b697f6f892948718f7a1b1597c0b34f",
			"landingPage": "https://www.pacificgeoportal.com/apps/pacificcore::live-openstreetmap-feature-count",
			"title": "Live OpenStreetMap Feature Count",
			"description": "<span style='font-family:&quot;Avenir Next W01&quot;, &quot;Avenir Next W00&quot;, &quot;Avenir Next&quot;, Avenir, &quot;Helvetica Neue&quot;, sans-serif; font-size:16px;'>Dashboard that displays location and quanitity of Open Street Maps features in the Pacific region.</span>",
			"keyword": [
				""
			],
			"issued": "2023-10-16T02:49:22.000Z",
			"modified": "2024-06-24T06:59:16.000Z",
			"publisher": {
				"name": "Pacific GeoPortal - Core Organization"
			},
			"contactPoint": {
				"@type": "vcard:Contact",
				"fn": "dkaragulle_pacificcore",
				"hasEmail": "mailto:pacific_geoportal@esri.com"
			},
			"accessLevel": "public",
			"spatial": "",
			"license": "",
			"distribution": [
				{
					"@type": "dcat:Distribution",
					"title": "ArcGIS Hub Dataset",
					"format": "Web Page",
					"mediaType": "text/html",
					"accessURL": "https://www.pacificgeoportal.com/apps/pacificcore::live-openstreetmap-feature-count"
				}
			],
			"theme": ""
		},
		{
			"@type": "dcat:Dataset",
			"identifier": "https://www.arcgis.com/home/item.html?id=a843749f76654b3f8b0940eab73c66d6",
			"landingPage": "https://www.pacificgeoportal.com/apps/pacificcore::pacific-region-disaster-awareness-dashboard",
			"title": "Pacific Region Disaster Awareness Dashboard",
			"description": "",
			"keyword": [
				"pgp"
			],
			"issued": "2023-09-27T03:06:51.000Z",
			"modified": "2024-06-24T05:55:24.000Z",
			"publisher": {
				"name": "Pacific GeoPortal - Core Organization"
			},
			"contactPoint": {
				"@type": "vcard:Contact",
				"fn": "klevy_pacificcore",
				"hasEmail": "mailto:pacific_geoportal@esri.com"
			},
			"accessLevel": "public",
			"spatial": "",
			"license": "",
			"distribution": [
				{
					"@type": "dcat:Distribution",
					"title": "ArcGIS Hub Dataset",
					"format": "Web Page",
					"mediaType": "text/html",
					"accessURL": "https://www.pacificgeoportal.com/apps/pacificcore::pacific-region-disaster-awareness-dashboard"
				}
			],
			"theme": ""
		},
		{
			"@type": "dcat:Dataset",
			"identifier": "https://www.arcgis.com/home/item.html?id=4e9eaeda54f14a528f2804a238fd8e8b",
			"landingPage": "https://www.pacificgeoportal.com/pages/pacificcore::pacific-geoportal-member-gallery",
			"title": "Pacific Geoportal - Member Gallery",
			"description": "{{description}}",
			"keyword": [
				""
			],
			"issued": "2024-04-08T23:16:56.000Z",
			"modified": "2024-04-08T23:31:01.000Z",
			"publisher": {
				"name": "Pacific GeoPortal - Core Organization"
			},
			"contactPoint": {
				"@type": "vcard:Contact",
				"fn": "Pacific_Core_Admin",
				"hasEmail": "mailto:pacific_geoportal@esri.com"
			},
			"accessLevel": "public",
			"spatial": "",
			"license": "",
			"distribution": [
				{
					"@type": "dcat:Distribution",
					"title": "ArcGIS Hub Dataset",
					"format": "Web Page",
					"mediaType": "text/html",
					"accessURL": "https://www.pacificgeoportal.com/pages/pacificcore::pacific-geoportal-member-gallery"
				}
			],
			"theme": ""
		},
		{
			"@type": "dcat:Dataset",
			"identifier": "https://www.arcgis.com/home/item.html?id=58d69d1559274fe1a6f22e3a4483e6d9&sublayer=0",
			"landingPage": "https://www.pacificgeoportal.com/datasets/eaglegis::nz-community-boards-2021-mature-support",
			"title": "NZ Community Boards - 2021 (Mature Support)",
			"description": "<font size='3'><b><span style='color:firebrick;'>Important Note:</span></b><b> This item is in<span style='color:#C00000;'> mature support</span> as of January 2024 and will retire in January 2025.</b><b><span> When you need the most recent boundary layer please use <a href='https://www.arcgis.com/home/item.html?id=f67d663afaab470982b63d0f37db0f30' rel='nofollow ugc'>this item</a>. When you need the boundaries for a specific year, please use <a href='https://www.arcgis.com/home/item.html?id=a855671b0d884afb91be42331f469138' rel='nofollow ugc'>this item</a> and set a filter on the required year.</span></b><br /><br /></font><div><br /><font size='3' style='font-family: \"Avenir Next W01\", \"Avenir Next W00\", \"Avenir Next\", Avenir, \"Helvetica Neue\", Helvetica, Arial, sans-serif !important;'>Topicality: 01-01-2021</font><div><div style='font-size: 17px; font-family: \"Avenir Next W01\", \"Avenir Next W00\", \"Avenir Next\", Avenir, \"Helvetica Neue\", Helvetica, Arial, sans-serif !important;'><span style='font-size: medium;'>Projection: New Zealand Transverse Mercator (NZTM)</span><br /></div><div style='font-size: 17px; font-family: \"Avenir Next W01\", \"Avenir Next W00\", \"Avenir Next\", Avenir, \"Helvetica Neue\", Helvetica, Arial, sans-serif !important;'></div><div style='font-family: \"Avenir Next W01\", \"Avenir Next W00\", \"Avenir Next\", Avenir, \"Helvetica Neue\", Helvetica, Arial, sans-serif !important;'><font size='3'><br /></font></div><div><div><font size='3'><font face='Avenir Next W01, Avenir Next W00, Avenir Next, Avenir, Helvetica Neue, Helvetica, Arial, sans-serif'>This layer is based on the dataset CB2021 (clipped)  retrieved from Stats NZ. It contains the </font>definitive set of Community Board boundaries as at 1 January 2021, clipped to the coastline.This clipped and generalized version has been created for map creation/cartographic purposes and does not fully represent the official full extent boundaries.</font></div><div><font face='Avenir Next W01, Avenir Next W00, Avenir Next, Avenir, Helvetica Neue, Helvetica, Arial, sans-serif' size='3'><br /></font></div><div><span style='font-family: \"Avenir Next W01\", \"Avenir Next W00\", \"Avenir Next\", Avenir, \"Helvetica Neue\", Helvetica, Arial, sans-serif; font-size: medium;'>This layer shows the data for 2021. If you would like to use the layer that gets updated yearly with the latest boundary data, you can use <a href='https://www.arcgis.com/home/item.html?id=f67d663afaab470982b63d0f37db0f30' target='_blank' rel='nofollow ugc noopener noreferrer'>this item</a>.<br /><br />All the boundary layers can be found <a href='https://www.arcgis.com/home/group.html?id=8047736c3e43467aa62241976851eff9' target='_blank' rel='nofollow ugc noopener noreferrer'>here</a>.<br /><br />All the boundary layers that are updated yearly can be found <a href='https://www.arcgis.com/home/group.html?id=b22e4f0012a8426dac21cd3d02f25c67' target='_blank' rel='nofollow ugc noopener noreferrer'>here</a>.<br /><br />The official dataset can be found on</span><font face='Avenir Next W01, Avenir Next W00, Avenir Next, Avenir, Helvetica Neue, Helvetica, Arial, sans-serif' size='3'> </font><a href='https://datafinder.stats.govt.nz/data/category/annual-boundaries/2021/' target='_blank' rel='nofollow ugc noopener noreferrer'>https://datafinder.stats.govt.nz</a>.</div><div><font face='Avenir Next W01, Avenir Next W00, Avenir Next, Avenir, Helvetica Neue, Helvetica, Arial, sans-serif' size='3'><br /></font></div><div><font size='3'><span style='font-family: \"Avenir Next W01\", \"Avenir Next W00\", \"Avenir Next\", Avenir, \"Helvetica Neue\", Helvetica, Arial, sans-serif;'>This layer contains the following attributes (see data tab):</span></font></div><div><ul><li>Community Board number</li><li>Community Board name</li><li>Total area in square kilometers</li><li>Total land area in square kilometers.</li></ul>The layer is further generalised by Eagle Technology for improved performance on the web, <span style='font-size: medium; font-family: \"Avenir Next W01\", \"Avenir Next W00\", \"Avenir Next\", Avenir, \"Helvetica Neue\", sans-serif;'>therefore it doesn't fully represent the official boundaries.</span><br /></div><div style='font-family: \"Avenir Next W01\", \"Avenir Next W00\", \"Avenir Next\", Avenir, \"Helvetica Neue\", Helvetica, Arial, sans-serif !important;'><font size='3'><br /></font></div><div><div style='font-family: \"Avenir Next W01\", \"Avenir Next W00\", \"Avenir Next\", Avenir, \"Helvetica Neue\", Helvetica, Arial, sans-serif !important;'><font color='#2f4f4f' size='3'>This layer is offered by Eagle Technology (Official Esri Distributor). Eagle Technology offers services that can be used in the ArcGIS platform. The Content team at Eagle Technology updates the layers on a regular basis and regularly adds new content to the Living Atlas. By using this content and combining it with other data you can create new information products quickly and easily.</font></div><div style='font-family: \"Avenir Next W01\", \"Avenir Next W00\", \"Avenir Next\", Avenir, \"Helvetica Neue\", Helvetica, Arial, sans-serif !important;'><font color='#2f4f4f' size='3'><br /></font></div><div style='font-family: \"Avenir Next W01\", \"Avenir Next W00\", \"Avenir Next\", Avenir, \"Helvetica Neue\", Helvetica, Arial, sans-serif !important;'><font size='3'><font color='#2f4f4f'>If you have any questions or comments about the content, please let us now  at </font><a href='mailto:livingatlas@eagle.co.nz' style='color: rgb(0, 121, 193); text-decoration-line: none;' target='_blank' rel='nofollow ugc noopener noreferrer'>livingatlas@eagle.co.nz</a></font></div></div></div></div></div>",
			"keyword": [
				"eaglegis",
				"mature support",
				"retiring",
				"deprecated"
			],
			"issued": "2021-02-04T02:16:36.000Z",
			"modified": "2021-02-15T23:02:10.430Z",
			"publisher": {
				"name": "Eagle Technology Group Ltd"
			},
			"contactPoint": {
				"@type": "vcard:Contact",
				"fn": "eaglegis",
				"hasEmail": "mailto:ts@eaglegis.co.nz"
			},
			"accessLevel": "public",
			"spatial": "166.2620,-47.2230,-177.6189,-33.7734",
			"license": "https://creativecommons.org/licenses/by/4.0",
			"distribution": [
				{
					"@type": "dcat:Distribution",
					"title": "ArcGIS Hub Dataset",
					"format": "Web Page",
					"mediaType": "text/html",
					"accessURL": "https://www.pacificgeoportal.com/datasets/eaglegis::nz-community-boards-2021-mature-support"
				},
				{
					"@type": "dcat:Distribution",
					"title": "ArcGIS GeoService",
					"format": "ArcGIS GeoServices REST API",
					"mediaType": "application/json",
					"accessURL": "https://services.arcgis.com/XTtANUDT8Va4DLwI/arcgis/rest/services/nz_community_boards_2021/FeatureServer/0"
				},
				{
					"@type": "dcat:Distribution",
					"title": "CSV",
					"format": "CSV",
					"mediaType": "text/csv",
					"accessURL": "https://www.pacificgeoportal.com/api/download/v1/items/58d69d1559274fe1a6f22e3a4483e6d9/csv?layers=0"
				},
				{
					"@type": "dcat:Distribution",
					"title": "Shapefile",
					"format": "ZIP",
					"mediaType": "application/zip",
					"accessURL": "https://www.pacificgeoportal.com/api/download/v1/items/58d69d1559274fe1a6f22e3a4483e6d9/shapefile?layers=0"
				},
				{
					"@type": "dcat:Distribution",
					"title": "GeoJSON",
					"format": "GeoJSON",
					"mediaType": "application/vnd.geo+json",
					"accessURL": "https://www.pacificgeoportal.com/api/download/v1/items/58d69d1559274fe1a6f22e3a4483e6d9/geojson?layers=0"
				},
				{
					"@type": "dcat:Distribution",
					"title": "KML",
					"format": "KML",
					"mediaType": "application/vnd.google-earth.kml+xml",
					"accessURL": "https://www.pacificgeoportal.com/api/download/v1/items/58d69d1559274fe1a6f22e3a4483e6d9/kml?layers=0"
				},
				{
					"@type": "dcat:Distribution",
					"title": "File Geodatabase",
					"format": "ZIP",
					"mediaType": "application/zip",
					"accessURL": "https://www.pacificgeoportal.com/api/download/v1/items/58d69d1559274fe1a6f22e3a4483e6d9/filegdb?layers=0"
				},
				{
					"@type": "dcat:Distribution",
					"title": "Feature Collection",
					"format": "TXT",
					"mediaType": "text/plain",
					"accessURL": "https://www.pacificgeoportal.com/api/download/v1/items/58d69d1559274fe1a6f22e3a4483e6d9/featureCollection?layers=0"
				},
				{
					"@type": "dcat:Distribution",
					"title": "Excel",
					"format": "XLSX",
					"mediaType": "application/vnd.ms-excel",
					"accessURL": "https://www.pacificgeoportal.com/api/download/v1/items/58d69d1559274fe1a6f22e3a4483e6d9/excel?layers=0"
				},
				{
					"@type": "dcat:Distribution",
					"title": "GeoPackage",
					"format": "GPKG",
					"mediaType": "application/geopackage+sqlite3",
					"accessURL": "https://www.pacificgeoportal.com/api/download/v1/items/58d69d1559274fe1a6f22e3a4483e6d9/geoPackage?layers=0"
				},
				{
					"@type": "dcat:Distribution",
					"title": "SQLite Geodatabase",
					"format": "GDB",
					"mediaType": "application/geopackage+sqlite3",
					"accessURL": "https://www.pacificgeoportal.com/api/download/v1/items/58d69d1559274fe1a6f22e3a4483e6d9/sqlite?layers=0"
				}
			],
			"theme": [
				"geospatial"
			]
		},
		{
			"@type": "dcat:Dataset",
			"identifier": "https://www.arcgis.com/home/item.html?id=018653579ef2499aa4b32bd4c42a2286",
			"landingPage": "https://www.pacificgeoportal.com/apps/pacificcore::pacific-geoportal-hub-living-atlas-content-1",
			"title": "Pacific GeoPortal Hub Living Atlas Content",
			"description": "<p>The map portfolio contains information from:</p><p>Federal sources - USGS, EPA, NOAA, NWS, NWC, FCC, USDOT, CEQ,  DEP, and DOE </p><p>Maps are Compiled and Published by Esri.</p>",
			"keyword": [
				"environment",
				"earthquake",
				"wildfires"
			],
			"issued": "2024-04-05T00:04:09.000Z",
			"modified": "2024-04-05T00:07:44.000Z",
			"publisher": {
				"name": "Pacific GeoPortal - Core Organization"
			},
			"contactPoint": {
				"@type": "vcard:Contact",
				"fn": "dkaragulle_pacificcore",
				"hasEmail": "mailto:pacific_geoportal@esri.com"
			},
			"accessLevel": "public",
			"spatial": "",
			"license": "<img src='https://downloads.esri.com/blogs/arcgisonline/esrilogo_new.png' style='max-width:100%; height:auto; font-family:&quot;Avenir Next W01&quot;, &quot;Avenir Next W00&quot;, &quot;Avenir Next&quot;, Avenir, &quot;Helvetica Neue&quot;, sans-serif; font-size:16px;' /><span style='font-family:&quot;Avenir Next W01&quot;, &quot;Avenir Next W00&quot;, &quot;Avenir Next&quot;, Avenir, &quot;Helvetica Neue&quot;, sans-serif; font-size:16px;'> This work is licensed under the Esri Master License Agreement.</span><br /><div style='font-family:&quot;Avenir Next W01&quot;, &quot;Avenir Next W00&quot;, &quot;Avenir Next&quot;, Avenir, &quot;Helvetica Neue&quot;, sans-serif; font-size:16px;'><a href='https://goto.arcgis.com/termsofuse/viewsummary' style='color:rgb(0, 97, 155); text-decoration-line:none;' target='_blank' rel='nofollow ugc noopener noreferrer'><b>View Summary</b></a> | <a href='https://goto.arcgis.com/termsofuse/viewtermsofuse' style='color:rgb(0, 97, 155); text-decoration-line:none;' target='_blank' rel='nofollow ugc noopener noreferrer'><b>View Terms of Use</b></a></div>",
			"distribution": [
				{
					"@type": "dcat:Distribution",
					"title": "ArcGIS Hub Dataset",
					"format": "Web Page",
					"mediaType": "text/html",
					"accessURL": "https://www.pacificgeoportal.com/apps/pacificcore::pacific-geoportal-hub-living-atlas-content-1"
				},
				{
					"@type": "dcat:Distribution",
					"title": "ArcGIS GeoService",
					"format": "ArcGIS GeoServices REST API",
					"mediaType": "application/json",
					"accessURL": "https://storymaps.arcgis.com/collections/018653579ef2499aa4b32bd4c42a2286"
				}
			],
			"theme": ""
		},
		{
			"@type": "dcat:Dataset",
			"identifier": "https://www.arcgis.com/home/item.html?id=290c21efa2984760a3236b3991afee5d",
			"landingPage": "https://www.pacificgeoportal.com/pages/pacificcore::data-library",
			"title": "Data Library",
			"description": "{{description}}",
			"keyword": [
				""
			],
			"issued": "2023-10-20T19:48:19.000Z",
			"modified": "2024-03-05T22:35:00.000Z",
			"publisher": {
				"name": "Pacific GeoPortal - Core Organization"
			},
			"contactPoint": {
				"@type": "vcard:Contact",
				"fn": "Pacific_Core_Admin",
				"hasEmail": "mailto:pacific_geoportal@esri.com"
			},
			"accessLevel": "public",
			"spatial": "-134.7473,23.5610,-55.6955,50.3092",
			"license": "",
			"distribution": [
				{
					"@type": "dcat:Distribution",
					"title": "ArcGIS Hub Dataset",
					"format": "Web Page",
					"mediaType": "text/html",
					"accessURL": "https://www.pacificgeoportal.com/pages/pacificcore::data-library"
				}
			],
			"theme": [
				"geospatial"
			]
		},
		{
			"@type": "dcat:Dataset",
			"identifier": "https://www.arcgis.com/home/item.html?id=e79ec88c884e4579856bd15f2f422f97",
			"landingPage": "https://www.pacificgeoportal.com/apps/pacificcore::pacific-geoportal-hub-living-atlas-content",
			"title": "Pacific GeoPortal Hub Living Atlas Content",
			"description": "<p>The map portfolio contains information from:</p><p>Federal sources - USGS, EPA, NOAA, NWS, NWC, FCC, USDOT, CEQ,  DEP, and DOE </p><p>Maps are Compiled and Published by Esri.</p>",
			"keyword": [
				"environment",
				"earthquake",
				"wildfires"
			],
			"issued": "2023-09-18T23:55:50.000Z",
			"modified": "2024-02-16T19:57:17.000Z",
			"publisher": {
				"name": "Pacific GeoPortal - Core Organization"
			},
			"contactPoint": {
				"@type": "vcard:Contact",
				"fn": "dkaragulle_pacificcore",
				"hasEmail": "mailto:pacific_geoportal@esri.com"
			},
			"accessLevel": "public",
			"spatial": "",
			"license": "<img src='https://downloads.esri.com/blogs/arcgisonline/esrilogo_new.png' style='max-width:100%; height:auto; font-family:&quot;Avenir Next W01&quot;, &quot;Avenir Next W00&quot;, &quot;Avenir Next&quot;, Avenir, &quot;Helvetica Neue&quot;, sans-serif; font-size:16px;' /><span style='font-family:&quot;Avenir Next W01&quot;, &quot;Avenir Next W00&quot;, &quot;Avenir Next&quot;, Avenir, &quot;Helvetica Neue&quot;, sans-serif; font-size:16px;'> This work is licensed under the Esri Master License Agreement.</span><br /><div style='font-family:&quot;Avenir Next W01&quot;, &quot;Avenir Next W00&quot;, &quot;Avenir Next&quot;, Avenir, &quot;Helvetica Neue&quot;, sans-serif; font-size:16px;'><a href='https://goto.arcgis.com/termsofuse/viewsummary' style='color:rgb(0, 97, 155); text-decoration-line:none;' target='_blank' rel='nofollow ugc noopener noreferrer'><b>View Summary</b></a> | <a href='https://goto.arcgis.com/termsofuse/viewtermsofuse' style='color:rgb(0, 97, 155); text-decoration-line:none;' target='_blank' rel='nofollow ugc noopener noreferrer'><b>View Terms of Use</b></a></div>",
			"distribution": [
				{
					"@type": "dcat:Distribution",
					"title": "ArcGIS Hub Dataset",
					"format": "Web Page",
					"mediaType": "text/html",
					"accessURL": "https://www.pacificgeoportal.com/apps/pacificcore::pacific-geoportal-hub-living-atlas-content"
				},
				{
					"@type": "dcat:Distribution",
					"title": "ArcGIS GeoService",
					"format": "ArcGIS GeoServices REST API",
					"mediaType": "application/json",
					"accessURL": "https://storymaps.arcgis.com/collections/e79ec88c884e4579856bd15f2f422f97"
				}
			],
			"theme": ""
		},
		{
			"@type": "dcat:Dataset",
			"identifier": "https://www.arcgis.com/home/item.html?id=a357b7fb650d40fc9ffaaf48ef58275a&sublayer=0",
			"landingPage": "https://www.pacificgeoportal.com/datasets/eaglegis::new-zealand-census-2018-and-deprivation-index-statistical-area-1",
			"title": "New Zealand Census 2018 and deprivation index Statistical Area 1",
			"description": "<div><div><div><div style='font-size:17px; font-family:&quot;Avenir Next W01&quot;, &quot;Avenir Next W00&quot;, &quot;Avenir Next&quot;, Avenir, &quot;Helvetica Neue&quot;, Helvetica, Arial, sans-serif !important;'><font size='3'>Topicality: 2018 - 2019</font></div><div style='font-size:17px; font-family:&quot;Avenir Next W01&quot;, &quot;Avenir Next W00&quot;, &quot;Avenir Next&quot;, Avenir, &quot;Helvetica Neue&quot;, Helvetica, Arial, sans-serif !important;'><div><font size='3'><span style='font-size:medium;'>Projection: New Zealand Transverse Mercator (NZTM)</span></font></div><div><font size='3'><span style='font-size:medium;'><br /></span></font></div><div><font size='3'><span>This dataset contains \noccupied and unoccupied private dwelling counts from and usually \nresident population counts from the 2006, 2013, and 2018 Censuses, with \npercentage changes between the 2013 Census and 2018 Censuses, by \nstatistical area 2.</span></font></div><div><font size='3'><span><br /></span></font></div><div><font size='3'><span>The data is sourced from the Census 2018 data published by Statistics New Zealand (StatsNZ) and </span></font><br /><font size='3'><span style='color:rgb(76, 76, 76); font-family:&quot;Avenir Next W01&quot;, &quot;Avenir Next W00&quot;, &quot;Avenir Next&quot;, Avenir, &quot;Helvetica Neue&quot;, sans-serif; font-size:16px; font-variant-ligatures:normal;'>Index of Multiple Deprivation by the Ministry of Health/ University of Otago.</span></font></div><div><ul><li><font size='3'><span style='font-family:&quot;Avenir Next W01&quot;, &quot;Avenir Next W00&quot;, &quot;Avenir Next&quot;, Avenir, &quot;Helvetica Neue&quot;, sans-serif;'><a href='https://www.stats.govt.nz/information-releases/statistical-area-1-dataset-for-2018-census-updated-march-2020' target='_blank' rel='nofollow ugc noopener noreferrer'>StatsNZ data</a>: <br /></span></font></li><li><a href='https://www.otago.ac.nz/wellington/departments/publichealth/research/hirp/otago020194.html#2018' target='_blank' rel='nofollow ugc noopener noreferrer'>Ministery of Health/University of Otago data</a><font size='3'><span style='font-family:&quot;Avenir Next W01&quot;, &quot;Avenir Next W00&quot;, &quot;Avenir Next&quot;, Avenir, &quot;Helvetica Neue&quot;, sans-serif;'></span></font></li></ul></div></div><br /><div style='font-size:17px; font-family:&quot;Avenir Next W01&quot;, &quot;Avenir Next W00&quot;, &quot;Avenir Next&quot;, Avenir, &quot;Helvetica Neue&quot;, Helvetica, Arial, sans-serif !important;'><div><font color='#2f4f4f' size='3'>This\n layer is offered by Eagle Technology (Official Esri Distributor). Eagle\n Technology offers services that can be used in the ArcGIS platform. The\n Content team at Eagle Technology updates the layers on a regular basis \nand regularly adds new content to the Living Atlas. By using this \ncontent and combining it with other data you can create new information \nproducts quickly and easily.</font></div><div><font color='#2f4f4f' size='3'><br /></font></div><div><font color='#2f4f4f' size='3'>If you have any questions or comments about the content, please let us now  at </font><font size='3'><a href='mailto:livingatlas@eagle.co.nz' style='color:rgb(0, 121, 193); text-decoration-line:none;' target='_blank' rel='nofollow ugc noopener noreferrer'>livingatlas@eagle.co.nz</a>.</font></div></div></div></div></div>",
			"keyword": [
				"Census 2018",
				"Kiwi",
				"Census",
				"2018",
				"Boundary",
				"New Zealand",
				"Statistics New Zealand",
				"StatsNZ",
				"Boundaries",
				"Council",
				"Region",
				"data",
				"dataset",
				"Eagle Technology",
				"open",
				"layer",
				"web",
				"web layer",
				"service",
				"map",
				"map layer",
				"NZ",
				"Content",
				"municipalities",
				"Territorial Authority",
				"Authority",
				"Authorities",
				"border",
				"boundary",
				"StatNZ",
				"Community",
				"Board",
				"Communit Board",
				"local",
				"local board",
				"city",
				"council",
				"Statistical",
				"Statistics",
				"demography",
				"statistical area",
				"area",
				"2020",
				"demographics",
				"Deprivation index",
				"university of Otago",
				"Ministry of Health"
			],
			"issued": "2020-03-25T00:45:48.000Z",
			"modified": "2022-08-11T00:33:58.895Z",
			"publisher": {
				"name": "Eagle Technology Group Ltd"
			},
			"contactPoint": {
				"@type": "vcard:Contact",
				"fn": "eaglegis",
				"hasEmail": "mailto:ts@eaglegis.co.nz"
			},
			"accessLevel": "public",
			"spatial": "166.2620,-47.2230,-177.6196,-33.7735",
			"license": "https://creativecommons.org/licenses/by/4.0",
			"distribution": [
				{
					"@type": "dcat:Distribution",
					"title": "ArcGIS Hub Dataset",
					"format": "Web Page",
					"mediaType": "text/html",
					"accessURL": "https://www.pacificgeoportal.com/datasets/eaglegis::new-zealand-census-2018-and-deprivation-index-statistical-area-1"
				},
				{
					"@type": "dcat:Distribution",
					"title": "ArcGIS GeoService",
					"format": "ArcGIS GeoServices REST API",
					"mediaType": "application/json",
					"accessURL": "https://services.arcgis.com/XTtANUDT8Va4DLwI/arcgis/rest/services/New_Zealand_Census_2018_and_deprivation_index_Statistical_Area_1/FeatureServer/0"
				},
				{
					"@type": "dcat:Distribution",
					"title": "CSV",
					"format": "CSV",
					"mediaType": "text/csv",
					"accessURL": "https://www.pacificgeoportal.com/api/download/v1/items/a357b7fb650d40fc9ffaaf48ef58275a/csv?layers=0"
				},
				{
					"@type": "dcat:Distribution",
					"title": "Shapefile",
					"format": "ZIP",
					"mediaType": "application/zip",
					"accessURL": "https://www.pacificgeoportal.com/api/download/v1/items/a357b7fb650d40fc9ffaaf48ef58275a/shapefile?layers=0"
				},
				{
					"@type": "dcat:Distribution",
					"title": "GeoJSON",
					"format": "GeoJSON",
					"mediaType": "application/vnd.geo+json",
					"accessURL": "https://www.pacificgeoportal.com/api/download/v1/items/a357b7fb650d40fc9ffaaf48ef58275a/geojson?layers=0"
				},
				{
					"@type": "dcat:Distribution",
					"title": "KML",
					"format": "KML",
					"mediaType": "application/vnd.google-earth.kml+xml",
					"accessURL": "https://www.pacificgeoportal.com/api/download/v1/items/a357b7fb650d40fc9ffaaf48ef58275a/kml?layers=0"
				},
				{
					"@type": "dcat:Distribution",
					"title": "File Geodatabase",
					"format": "ZIP",
					"mediaType": "application/zip",
					"accessURL": "https://www.pacificgeoportal.com/api/download/v1/items/a357b7fb650d40fc9ffaaf48ef58275a/filegdb?layers=0"
				},
				{
					"@type": "dcat:Distribution",
					"title": "Feature Collection",
					"format": "TXT",
					"mediaType": "text/plain",
					"accessURL": "https://www.pacificgeoportal.com/api/download/v1/items/a357b7fb650d40fc9ffaaf48ef58275a/featureCollection?layers=0"
				},
				{
					"@type": "dcat:Distribution",
					"title": "Excel",
					"format": "XLSX",
					"mediaType": "application/vnd.ms-excel",
					"accessURL": "https://www.pacificgeoportal.com/api/download/v1/items/a357b7fb650d40fc9ffaaf48ef58275a/excel?layers=0"
				},
				{
					"@type": "dcat:Distribution",
					"title": "GeoPackage",
					"format": "GPKG",
					"mediaType": "application/geopackage+sqlite3",
					"accessURL": "https://www.pacificgeoportal.com/api/download/v1/items/a357b7fb650d40fc9ffaaf48ef58275a/geoPackage?layers=0"
				},
				{
					"@type": "dcat:Distribution",
					"title": "SQLite Geodatabase",
					"format": "GDB",
					"mediaType": "application/geopackage+sqlite3",
					"accessURL": "https://www.pacificgeoportal.com/api/download/v1/items/a357b7fb650d40fc9ffaaf48ef58275a/sqlite?layers=0"
				}
			],
			"theme": [
				"geospatial"
			]
		},
		{
			"@type": "dcat:Dataset",
			"identifier": "https://www.arcgis.com/home/item.html?id=37c265e67f564a18b42166c2571b03fe&sublayer=0",
			"landingPage": "https://www.pacificgeoportal.com/datasets/eaglegis::nz-māori-wards-2023-provisional-mature-support",
			"title": "NZ Māori Wards - 2023 - Provisional (Mature Support)",
			"description": "<font size='3'><b><span style='color:firebrick;'>Important Note:</span></b><b> This item is in<span style='color:#C00000;'> mature support</span> as of January 2024 and will retire in January 2025.</b><b><span> When you need the most recent boundary layer please use <a href='https://www.arcgis.com/home/item.html?id=dc1888b123da42b19f09d96608fc3b0e' rel='nofollow ugc'>this item</a>. When you need the boundaries for a specific year, please use <a href='https://www.arcgis.com/home/item.html?id=5e95349d27754b21b3068b713df63173' rel='nofollow ugc'>this item</a> and set a filter on the required year.</span></b><br /><br /></font><div><br /><div><font size='3' style='font-family:\"Avenir Next W01\", \"Avenir Next W00\", \"Avenir Next\", Avenir, \"Helvetica Neue\", Helvetica, Arial, sans-serif !important;'>Topicality: 23-06-2022</font></div><div style='font-size:17px; font-family:\"Avenir Next W01\", \"Avenir Next W00\", \"Avenir Next\", Avenir, \"Helvetica Neue\", Helvetica, Arial, sans-serif !important;'><font style='font-family:\"Avenir Next W01\", \"Avenir Next W00\", \"Avenir Next\", Avenir, \"Helvetica Neue\", Helvetica, Arial, sans-serif !important; font-size:17px;'><span style='font-size:17px;'>Projection: New Zealand Transverse Mercator (NZTM)</span></font><span style='font-style:italic;'><font size='3'><br /></font></span></div><div style='font-size:17px; font-family:\"Avenir Next W01\", \"Avenir Next W00\", \"Avenir Next\", Avenir, \"Helvetica Neue\", Helvetica, Arial, sans-serif !important;'><span style='font-style:italic;'><font size='3'><br /></font></span></div><div style='font-size:17px; font-family:\"Avenir Next W01\", \"Avenir Next W00\", \"Avenir Next\", Avenir, \"Helvetica Neue\", Helvetica, Arial, sans-serif !important;'><span style='font-style:italic;'><font size='3'><span style='font-weight:bold;'>NB: This layer will be <span style='color:rgb(255, 0, 0);'>deprecated </span>when the official 2023 boundary layers are released.</span><br /></font></span></div><div style='font-size:17px; font-family:\"Avenir Next W01\", \"Avenir Next W00\", \"Avenir Next\", Avenir, \"Helvetica Neue\", Helvetica, Arial, sans-serif !important;'><span style='font-style:italic;'><font size='3'><br /></font></span></div><div style='font-family:\"Avenir Next W01\", \"Avenir Next W00\", \"Avenir Next\", Avenir, \"Helvetica Neue\", Helvetica, Arial, sans-serif !important;'><span style='font-style:italic;'><font size='3'>This dataset is the povisional 2023 dataset for Community Board.\n The final 2023 layer is scheduled to be published on 8 December 2022 as\n part of the annual boundary release.</font></span></div><div style='font-family:\"Avenir Next W01\", \"Avenir Next W00\", \"Avenir Next\", Avenir, \"Helvetica Neue\", Helvetica, Arial, sans-serif !important;'><span style='font-style:italic;'><font size='3'><br /></font></span></div><div style='font-family:\"Avenir Next W01\", \"Avenir Next W00\", \"Avenir Next\", Avenir, \"Helvetica Neue\", Helvetica, Arial, sans-serif !important;'><span style='font-style:italic;'><font size='3'>The intention of providing this provisional dataset is to make \navailable the boundaries that will be used for the local body elections \nbeing held in October 2022.</font></span></div><div><font style='font-family:\"Avenir Next W01\", \"Avenir Next W00\", \"Avenir Next\", Avenir, \"Helvetica Neue\", Helvetica, Arial, sans-serif !important; font-size:17px;'><span style='font-size:17px;'></span></font></div><div style='font-family:\"Avenir Next W01\", \"Avenir Next W00\", \"Avenir Next\", Avenir, \"Helvetica Neue\", Helvetica, Arial, sans-serif !important; font-size:17px;'><font size='3'><font><br /></font></font></div><div style='font-family:\"Avenir Next W01\", \"Avenir Next W00\", \"Avenir Next\", Avenir, \"Helvetica Neue\", Helvetica, Arial, sans-serif !important; font-size:17px;'><font size='3'><font>This layer is based on the provisional </font>set of </font><span>Māori </span><span style='font-family:\"Avenir Next W01\", \"Avenir Next W00\", \"Avenir Next\", Avenir, \"Helvetica Neue\", sans-serif;'>Ward boundaries</span><font size='3'> for 2023 as defined by the regional councils and Local Government Commission but maintained by Stats NZ (the custodian).</font></div><div style='font-family:\"Avenir Next W01\", \"Avenir Next W00\", \"Avenir Next\", Avenir, \"Helvetica Neue\", Helvetica, Arial, sans-serif !important; font-size:17px;'><font size='3'><br /></font></div><div style='font-family:\"Avenir Next W01\", \"Avenir Next W00\", \"Avenir Next\", Avenir, \"Helvetica Neue\", Helvetica, Arial, sans-serif !important; font-size:17px;'>The Local Electoral Act 2001 provides that Māori wards may be \nestablished in territorial authorities. The statutory provisions for \nestablishing Māori wards are set out in sections 19Z to 19ZH of the \nLocal Electoral Act 2001. The first Māori ward was established by \nrepresentation review in 2019 and appears in the 2023 geographic \nboundaries released by Stats NZ. The first Māori ward to be created is \nWairoa Māori ward (02901) in the Wairoa District. Māori ward boundaries \nare defined at meshblock level. <br /></div><div style='font-family:\"Avenir Next W01\", \"Avenir Next W00\", \"Avenir Next\", Avenir, \"Helvetica Neue\", Helvetica, Arial, sans-serif !important; font-size:17px;'><br /></div><div style='font-family:\"Avenir Next W01\", \"Avenir Next W00\", \"Avenir Next\", Avenir, \"Helvetica Neue\", Helvetica, Arial, sans-serif !important; font-size:17px;'><div><font size='3' style='font-family:\"Avenir Next W01\", \"Avenir Next W00\", \"Avenir Next\", Avenir, \"Helvetica Neue\", Helvetica, Arial, sans-serif;'>This layer shows the data for 2023. If you would like to use the layer that gets updated yearly with the latest boundary data, you can use <a href='https://www.arcgis.com/home/item.html?id=dc1888b123da42b19f09d96608fc3b0e' target='_blank' rel='nofollow ugc noopener noreferrer'>this item</a>.<br /><br />All the boundary layers can be found <a href='https://www.arcgis.com/home/group.html?id=8047736c3e43467aa62241976851eff9' target='_blank' rel='nofollow ugc noopener noreferrer'>here</a>.<br /><br />All the boundary layers that are updated yearly can be found <a href='https://www.arcgis.com/home/group.html?id=b22e4f0012a8426dac21cd3d02f25c67' target='_blank' rel='nofollow ugc noopener noreferrer'>here</a>.</font><br /></div><div><font size='3' style='font-family:\"Avenir Next W01\", \"Avenir Next W00\", \"Avenir Next\", Avenir, \"Helvetica Neue\", Helvetica, Arial, sans-serif;'><br /></font></div><div><font size='3' style='font-family:\"Avenir Next W01\", \"Avenir Next W00\", \"Avenir Next\", Avenir, \"Helvetica Neue\", Helvetica, Arial, sans-serif;'>The official dataset can be found on<font> </font></font><a href='https://datafinder.stats.govt.nz/data/category/provisional-boundaries/' target='_blank' rel='nofollow ugc noopener noreferrer'>https://datafinder.stats.govt.nz.</a></div><div><div style='font-family:\"Avenir Next W01\", \"Avenir Next W00\", \"Avenir Next\", Avenir, \"Helvetica Neue\", Helvetica, Arial, sans-serif; font-size:17px;'><br /></div></div><div><div style='font-family:\"Avenir Next W01\", \"Avenir Next W00\", \"Avenir Next\", Avenir, \"Helvetica Neue\", Helvetica, Arial, sans-serif; font-size:17px;'><div><font size='3'>This layer contains the following attributes (see data tab):</font></div><div><ul><li><font size='3'>Maori Ward code</font></li><li><font size='3'>Maori Ward name</font></li><li><font size='3'>Total area in square kilometers</font></li><li><font size='3'>Total land area in square kilometers.</font></li></ul><div><font size='3'>The layer is further generalised by Eagle Technology for improved performance on the web, <span style='font-family:\"Avenir Next W01\", \"Avenir Next W00\", \"Avenir Next\", Avenir, \"Helvetica Neue\", sans-serif;'>therefore it doesn't fully represent the official boundaries.</span><br /></font></div></div></div><div style='font-family:\"Avenir Next W01\", \"Avenir Next W00\", \"Avenir Next\", Avenir, \"Helvetica Neue\", Helvetica, Arial, sans-serif; font-size:17px;'><font size='3'><br /></font></div><div style='font-family:\"Avenir Next W01\", \"Avenir Next W00\", \"Avenir Next\", Avenir, \"Helvetica Neue\", Helvetica, Arial, sans-serif; font-size:17px;'><div><font color='#2f4f4f' size='3'>This\n layer is offered by Eagle Technology (Official Esri Distributor). Eagle\n Technology offers services that can be used in the ArcGIS platform. The\n Content team at Eagle Technology updates the layers on a regular basis \nand regularly adds new content to the Living Atlas. By using this \ncontent and combining it with other data you can create new information \nproducts quickly and easily.</font></div><div><font color='#2f4f4f' size='3'><br /></font></div><div><font size='3'><font color='#2f4f4f'>If you have any questions or comments about the content, please let us now  at </font><a href='mailto:livingatlas@eagle.co.nz' style='color:rgb(0, 121, 193); text-decoration-line:none;' target='_blank' rel='nofollow ugc noopener noreferrer'>livingatlas@eagle.co.nz</a></font></div></div></div></div></div>",
			"keyword": [
				"eaglegis",
				"mature support",
				"retiring",
				"deprecated"
			],
			"issued": "2022-07-25T09:11:32.000Z",
			"modified": "2022-07-27T00:08:57.641Z",
			"publisher": {
				"name": "Eagle Technology Group Ltd"
			},
			"contactPoint": {
				"@type": "vcard:Contact",
				"fn": "eaglegis",
				"hasEmail": "mailto:ts@eaglegis.co.nz"
			},
			"accessLevel": "public",
			"spatial": "166.2620,-47.2230,-177.6189,-33.7734",
			"license": "https://creativecommons.org/licenses/by/4.0",
			"distribution": [
				{
					"@type": "dcat:Distribution",
					"title": "ArcGIS Hub Dataset",
					"format": "Web Page",
					"mediaType": "text/html",
					"accessURL": "https://www.pacificgeoportal.com/datasets/eaglegis::nz-māori-wards-2023-provisional-mature-support"
				},
				{
					"@type": "dcat:Distribution",
					"title": "ArcGIS GeoService",
					"format": "ArcGIS GeoServices REST API",
					"mediaType": "application/json",
					"accessURL": "https://services.arcgis.com/XTtANUDT8Va4DLwI/arcgis/rest/services/nz_maori_wards_2023/FeatureServer/0"
				},
				{
					"@type": "dcat:Distribution",
					"title": "CSV",
					"format": "CSV",
					"mediaType": "text/csv",
					"accessURL": "https://www.pacificgeoportal.com/api/download/v1/items/37c265e67f564a18b42166c2571b03fe/csv?layers=0"
				},
				{
					"@type": "dcat:Distribution",
					"title": "Shapefile",
					"format": "ZIP",
					"mediaType": "application/zip",
					"accessURL": "https://www.pacificgeoportal.com/api/download/v1/items/37c265e67f564a18b42166c2571b03fe/shapefile?layers=0"
				},
				{
					"@type": "dcat:Distribution",
					"title": "GeoJSON",
					"format": "GeoJSON",
					"mediaType": "application/vnd.geo+json",
					"accessURL": "https://www.pacificgeoportal.com/api/download/v1/items/37c265e67f564a18b42166c2571b03fe/geojson?layers=0"
				},
				{
					"@type": "dcat:Distribution",
					"title": "KML",
					"format": "KML",
					"mediaType": "application/vnd.google-earth.kml+xml",
					"accessURL": "https://www.pacificgeoportal.com/api/download/v1/items/37c265e67f564a18b42166c2571b03fe/kml?layers=0"
				},
				{
					"@type": "dcat:Distribution",
					"title": "File Geodatabase",
					"format": "ZIP",
					"mediaType": "application/zip",
					"accessURL": "https://www.pacificgeoportal.com/api/download/v1/items/37c265e67f564a18b42166c2571b03fe/filegdb?layers=0"
				},
				{
					"@type": "dcat:Distribution",
					"title": "Feature Collection",
					"format": "TXT",
					"mediaType": "text/plain",
					"accessURL": "https://www.pacificgeoportal.com/api/download/v1/items/37c265e67f564a18b42166c2571b03fe/featureCollection?layers=0"
				},
				{
					"@type": "dcat:Distribution",
					"title": "Excel",
					"format": "XLSX",
					"mediaType": "application/vnd.ms-excel",
					"accessURL": "https://www.pacificgeoportal.com/api/download/v1/items/37c265e67f564a18b42166c2571b03fe/excel?layers=0"
				},
				{
					"@type": "dcat:Distribution",
					"title": "GeoPackage",
					"format": "GPKG",
					"mediaType": "application/geopackage+sqlite3",
					"accessURL": "https://www.pacificgeoportal.com/api/download/v1/items/37c265e67f564a18b42166c2571b03fe/geoPackage?layers=0"
				},
				{
					"@type": "dcat:Distribution",
					"title": "SQLite Geodatabase",
					"format": "GDB",
					"mediaType": "application/geopackage+sqlite3",
					"accessURL": "https://www.pacificgeoportal.com/api/download/v1/items/37c265e67f564a18b42166c2571b03fe/sqlite?layers=0"
				}
			],
			"theme": [
				"geospatial"
			]
		},
		{
			"@type": "dcat:Dataset",
			"identifier": "https://www.arcgis.com/home/item.html?id=da3e123da1454749ae66be15c10f7481&sublayer=0",
			"landingPage": "https://www.pacificgeoportal.com/datasets/eaglegis::nz-subdivisions-2023-provisional-mature-support",
			"title": "NZ Subdivisions - 2023 - Provisional (Mature Support)",
			"description": "<font size='3'><b><span style='color:firebrick;'>Important Note:</span></b><b> This item is in<span style='color:#C00000;'> mature support</span> as of January 2024 and will retire in January 2025.</b><b><span> When you need the most recent boundary layer please use <a href='https://www.arcgis.com/home/item.html?id=4f0cb6eb82ea4a12a3a749067b6ee1fd' rel='nofollow ugc'>this item</a>. When you need the boundaries for a specific year, please use <a href='https://www.arcgis.com/home/item.html?id=725ccdca733d49268ff6a707d20cf14e' rel='nofollow ugc'>this item</a> and set a filter on the required year.</span></b><br /><br /></font><div><br /><font size='3' style='font-family:\"Avenir Next W01\", \"Avenir Next W00\", \"Avenir Next\", Avenir, \"Helvetica Neue\", Helvetica, Arial, sans-serif !important;'>Topicality: </font><font size='3' style='font-family:\"Avenir Next W01\", \"Avenir Next W00\", \"Avenir Next\", Avenir, \"Helvetica Neue\", Helvetica, Arial, sans-serif !important;'>23-06-2022</font><font size='3' style='font-family:\"Avenir Next W01\", \"Avenir Next W00\", \"Avenir Next\", Avenir, \"Helvetica Neue\", Helvetica, Arial, sans-serif !important;'></font><div><font size='3' style='font-family:\"Avenir Next W01\", \"Avenir Next W00\", \"Avenir Next\", Avenir, \"Helvetica Neue\", Helvetica, Arial, sans-serif !important; font-size:17px;'>Projection: New Zealand Transverse Mercator (NZTM)<font face='Avenir Next W01, Avenir Next W00, Avenir Next, Avenir, Helvetica Neue, Helvetica, Arial, sans-serif'><br /></font></font></div><div><font size='3' style='font-family:\"Avenir Next W01\", \"Avenir Next W00\", \"Avenir Next\", Avenir, \"Helvetica Neue\", Helvetica, Arial, sans-serif !important; font-size:17px;'><font face='Avenir Next W01, Avenir Next W00, Avenir Next, Avenir, Helvetica Neue, Helvetica, Arial, sans-serif'><br /></font></font></div><div><span style='font-style:italic;'><font size='3'><span style='font-weight:bold;'>NB: This layer will be <span style='color:rgb(255, 0, 0);'>deprecated </span>when the official 2023 boundary layers are released.</span></font></span><font size='3' style='font-family:\"Avenir Next W01\", \"Avenir Next W00\", \"Avenir Next\", Avenir, \"Helvetica Neue\", Helvetica, Arial, sans-serif !important; font-size:17px;'><font face='Avenir Next W01, Avenir Next W00, Avenir Next, Avenir, Helvetica Neue, Helvetica, Arial, sans-serif'></font></font></div><div><div style='font-size:17px; font-family:\"Avenir Next W01\", \"Avenir Next W00\", \"Avenir Next\", Avenir, \"Helvetica Neue\", Helvetica, Arial, sans-serif !important;'><span style='font-style:italic;'><font size='3'><br /></font></span></div><div style='font-family:\"Avenir Next W01\", \"Avenir Next W00\", \"Avenir Next\", Avenir, \"Helvetica Neue\", Helvetica, Arial, sans-serif !important;'><span style='font-style:italic;'><font size='3'>This dataset is the povisional 2023 dataset for Community Board.\n The final 2023 layer is scheduled to be published on 8 December 2022 as\n part of the annual boundary release.</font></span></div><div style='font-family:\"Avenir Next W01\", \"Avenir Next W00\", \"Avenir Next\", Avenir, \"Helvetica Neue\", Helvetica, Arial, sans-serif !important;'><span style='font-style:italic;'><font size='3'><br /></font></span></div><div style='font-family:\"Avenir Next W01\", \"Avenir Next W00\", \"Avenir Next\", Avenir, \"Helvetica Neue\", Helvetica, Arial, sans-serif !important;'><span style='font-style:italic;'><font size='3'>The intention of providing this provisional dataset is to make \navailable the boundaries that will be used for the local body elections \nbeing held in October 2022.</font></span></div><div style='font-family:\"Avenir Next W01\", \"Avenir Next W00\", \"Avenir Next\", Avenir, \"Helvetica Neue\", Helvetica, Arial, sans-serif !important;'><span style='font-style:italic;'><font size='3'><br /></font></span></div><div><font style='font-family:\"Avenir Next W01\", \"Avenir Next W00\", \"Avenir Next\", Avenir, \"Helvetica Neue\", Helvetica, Arial, sans-serif !important; font-size:17px;'><span style='font-size:17px;'></span></font></div><div style='font-family:\"Avenir Next W01\", \"Avenir Next W00\", \"Avenir Next\", Avenir, \"Helvetica Neue\", Helvetica, Arial, sans-serif !important; font-size:17px;'><font size='3'><font face='Avenir Next W01, Avenir Next W00, Avenir Next, Avenir, Helvetica Neue, Helvetica, Arial, sans-serif'>This layer is based on the </font></font><font size='3'><font face='Avenir Next W01, Avenir Next W00, Avenir Next, Avenir, Helvetica Neue, Helvetica, Arial, sans-serif'><font size='3'><font>provisional </font></font></font>set of </font><span style='font-family:\"Avenir Next W01\", \"Avenir Next W00\", \"Avenir Next\", Avenir, \"Helvetica Neue\", sans-serif;'>Territorial Authority Subdivision boundaries</span><font size='3'> for 2023 as defined by the regional councils and Local Government Commission but maintained by Stats NZ (the custodian).<font face='Avenir Next W01, Avenir Next W00, Avenir Next, Avenir, Helvetica Neue, Helvetica, Arial, sans-serif'> </font></font></div><div style='font-family:\"Avenir Next W01\", \"Avenir Next W00\", \"Avenir Next\", Avenir, \"Helvetica Neue\", Helvetica, Arial, sans-serif !important; font-size:17px;'><font size='3'><font face='Avenir Next W01, Avenir Next W00, Avenir Next, Avenir, Helvetica Neue, Helvetica, Arial, sans-serif'><br /></font></font></div><div><font size='3'><font face='Avenir Next W01, Avenir Next W00, Avenir Next, Avenir, Helvetica Neue, Helvetica, Arial, sans-serif'><div>Subdivisions are set up under the Local Government Act 2002 and Local Electoral Act 2001. A subdivision is a division of a community or local board area for electoral purposes.</div><div><br /></div><div>Subdivisions are defined at meshblock level, and do not coincide with the  statistical area 1 (SA1) geography or the statistical area 2 (SA2) geography. A  number of territorial authorities do not have subdivisions, and if they do, the  subdivisions do not necessarily cover the whole territorial authority area.  Subdivisions nest within community or local boards. Where a community or  local board is divided into subdivisions all of the community or local board area  must be included in a subdivision.<br /></div><div><br /></div><div>Subdivisions are numbered based on their corresponding territorial authority. Each subdivision has a unique five-digit number. The first three digits refer to the territorial authority that the subdivision lies within. The following two digits are sequential, and represent the number of subdivisions within the territorial authority. For example, Southland District (073) has two subdivisions numbered 07301 and 07302. The rest of the district is not represented by a subdivision and is coded 07399 (Area Outside Subdivision).<br /></div><div><br /></div><div><div style='font-size:17px;'><font size='3'>This layer shows the </font><font size='3'><font size='3'><font face='Avenir Next W01, Avenir Next W00, Avenir Next, Avenir, Helvetica Neue, Helvetica, Arial, sans-serif'>provisional </font></font>data for 2023. If you would like to use the layer that gets updated yearly with the latest boundary data, you can use <a href='https://www.arcgis.com/home/item.html?id=4f0cb6eb82ea4a12a3a749067b6ee1fd' target='_blank' rel='nofollow ugc noopener noreferrer'>this item</a>.<br /><br />All the boundary layers can be found <a href='https://www.arcgis.com/home/group.html?id=8047736c3e43467aa62241976851eff9' target='_blank' rel='nofollow ugc noopener noreferrer'>here</a>.<br /><br />All the boundary layers that are updated yearly can be found <a href='https://www.arcgis.com/home/group.html?id=b22e4f0012a8426dac21cd3d02f25c67' target='_blank' rel='nofollow ugc noopener noreferrer'>here</a>.</font><font size='3'><br /><br />The official dataset can be found on<font face='Avenir Next W01, Avenir Next W00, Avenir Next, Avenir, Helvetica Neue, Helvetica, Arial, sans-serif'> </font></font><a href='https://datafinder.stats.govt.nz/data/category/provisional-boundaries/' target='_blank' rel='nofollow ugc noopener noreferrer'>https://datafinder.stats.govt.nz.</a></div><div style='font-size:17px;'><br /></div><div style='font-size:17px;'><div><font size='3'>This layer contains the following attributes (see data tab):</font></div><div><ul><li><font size='3'>Territorial Authority Subdivision code</font></li><li><font size='3'>Territorial Authority Subdivision name</font></li><li><font size='3'>Total area in square kilometers</font></li><li><font size='3'>Total land area in square kilometers.</font></li></ul><div><font size='3'>The layer is further generalised by Eagle Technology for improved performance on the web, <span style='font-family:\"Avenir Next W01\", \"Avenir Next W00\", \"Avenir Next\", Avenir, \"Helvetica Neue\", sans-serif;'>therefore it doesn't fully represent the official boundaries.</span><br /></font></div></div></div><div style='font-size:17px;'><font size='3'><br /></font></div><div style='font-size:17px;'><div><font color='#2f4f4f' size='3'>This layer is offered by Eagle Technology (Official Esri Distributor). Eagle Technology offers services that can be used in the ArcGIS platform. The Content team at Eagle Technology updates the layers on a regular basis and regularly adds new content to the Living Atlas. By using this content and combining it with other data you can create new information products quickly and easily.</font></div><div><font color='#2f4f4f' size='3'><br /></font></div><div><font size='3'><font color='#2f4f4f'>If you have any questions or comments about the content, please let us now  at </font><a href='mailto:livingatlas@eagle.co.nz' style='color:rgb(0, 121, 193); text-decoration-line:none;' target='_blank' rel='nofollow ugc noopener noreferrer'>livingatlas@eagle.co.nz</a></font></div></div></div></font></font></div></div></div>",
			"keyword": [
				"eaglegis",
				"mature support",
				"retiring",
				"deprecated"
			],
			"issued": "2022-07-25T09:11:11.000Z",
			"modified": "2022-07-27T00:13:08.798Z",
			"publisher": {
				"name": "Eagle Technology Group Ltd"
			},
			"contactPoint": {
				"@type": "vcard:Contact",
				"fn": "eaglegis",
				"hasEmail": "mailto:ts@eaglegis.co.nz"
			},
			"accessLevel": "public",
			"spatial": "166.2620,-47.2230,-177.6189,-33.7734",
			"license": "https://creativecommons.org/licenses/by/4.0",
			"distribution": [
				{
					"@type": "dcat:Distribution",
					"title": "ArcGIS Hub Dataset",
					"format": "Web Page",
					"mediaType": "text/html",
					"accessURL": "https://www.pacificgeoportal.com/datasets/eaglegis::nz-subdivisions-2023-provisional-mature-support"
				},
				{
					"@type": "dcat:Distribution",
					"title": "ArcGIS GeoService",
					"format": "ArcGIS GeoServices REST API",
					"mediaType": "application/json",
					"accessURL": "https://services.arcgis.com/XTtANUDT8Va4DLwI/arcgis/rest/services/nz_subdivisions_2023/FeatureServer/0"
				},
				{
					"@type": "dcat:Distribution",
					"title": "CSV",
					"format": "CSV",
					"mediaType": "text/csv",
					"accessURL": "https://www.pacificgeoportal.com/api/download/v1/items/da3e123da1454749ae66be15c10f7481/csv?layers=0"
				},
				{
					"@type": "dcat:Distribution",
					"title": "Shapefile",
					"format": "ZIP",
					"mediaType": "application/zip",
					"accessURL": "https://www.pacificgeoportal.com/api/download/v1/items/da3e123da1454749ae66be15c10f7481/shapefile?layers=0"
				},
				{
					"@type": "dcat:Distribution",
					"title": "GeoJSON",
					"format": "GeoJSON",
					"mediaType": "application/vnd.geo+json",
					"accessURL": "https://www.pacificgeoportal.com/api/download/v1/items/da3e123da1454749ae66be15c10f7481/geojson?layers=0"
				},
				{
					"@type": "dcat:Distribution",
					"title": "KML",
					"format": "KML",
					"mediaType": "application/vnd.google-earth.kml+xml",
					"accessURL": "https://www.pacificgeoportal.com/api/download/v1/items/da3e123da1454749ae66be15c10f7481/kml?layers=0"
				},
				{
					"@type": "dcat:Distribution",
					"title": "File Geodatabase",
					"format": "ZIP",
					"mediaType": "application/zip",
					"accessURL": "https://www.pacificgeoportal.com/api/download/v1/items/da3e123da1454749ae66be15c10f7481/filegdb?layers=0"
				},
				{
					"@type": "dcat:Distribution",
					"title": "Feature Collection",
					"format": "TXT",
					"mediaType": "text/plain",
					"accessURL": "https://www.pacificgeoportal.com/api/download/v1/items/da3e123da1454749ae66be15c10f7481/featureCollection?layers=0"
				},
				{
					"@type": "dcat:Distribution",
					"title": "Excel",
					"format": "XLSX",
					"mediaType": "application/vnd.ms-excel",
					"accessURL": "https://www.pacificgeoportal.com/api/download/v1/items/da3e123da1454749ae66be15c10f7481/excel?layers=0"
				},
				{
					"@type": "dcat:Distribution",
					"title": "GeoPackage",
					"format": "GPKG",
					"mediaType": "application/geopackage+sqlite3",
					"accessURL": "https://www.pacificgeoportal.com/api/download/v1/items/da3e123da1454749ae66be15c10f7481/geoPackage?layers=0"
				},
				{
					"@type": "dcat:Distribution",
					"title": "SQLite Geodatabase",
					"format": "GDB",
					"mediaType": "application/geopackage+sqlite3",
					"accessURL": "https://www.pacificgeoportal.com/api/download/v1/items/da3e123da1454749ae66be15c10f7481/sqlite?layers=0"
				}
			],
			"theme": [
				"geospatial"
			]
		},
		{
			"@type": "dcat:Dataset",
			"identifier": "https://www.arcgis.com/home/item.html?id=00507f21185c4ea4939cecfe0c656817&sublayer=0",
			"landingPage": "https://www.pacificgeoportal.com/datasets/eaglegis::nz-māori-constituencies-2023-provisional-mature-support",
			"title": "NZ Māori Constituencies - 2023 - Provisional (Mature Support)",
			"description": "<font size='3'><b><span style='color:firebrick;'>Important Note:</span></b><b> This item is in<span style='color:#C00000;'> mature support</span> as of January 2024 and will retire in January 2025.</b><b><span> When you need the most recent boundary layer please use <a href='https://www.arcgis.com/home/item.html?id=c79cf92a933a44b8ba27ed833163202f' rel='nofollow ugc'>this item</a>. When you need the boundaries for a specific year, please use <a href='https://www.arcgis.com/home/item.html?id=8d442899956446188be600fbaa8ad6dc' rel='nofollow ugc'>this item</a> and set a filter on the required year.</span></b><br /><br /></font><div><br /><font size='3' style='font-family:\"Avenir Next W01\", \"Avenir Next W00\", \"Avenir Next\", Avenir, \"Helvetica Neue\", Helvetica, Arial, sans-serif !important;'>Topicality: </font><font size='3' style='font-family:\"Avenir Next W01\", \"Avenir Next W00\", \"Avenir Next\", Avenir, \"Helvetica Neue\", Helvetica, Arial, sans-serif !important;'>23-06-2022</font><div><font face='Avenir Next W01, Avenir Next W00, Avenir Next, Avenir, Helvetica Neue, Helvetica, Arial, sans-serif' size='3'>Projection: New Zealand Transverse Mercator (NZTM)<br /></font></div><div><font face='Avenir Next W01, Avenir Next W00, Avenir Next, Avenir, Helvetica Neue, Helvetica, Arial, sans-serif' size='3'><br /></font></div><div><span style='font-style:italic;'><font size='3'><span style='font-weight:bold;'>NB: This layer will be <span style='color:rgb(255, 0, 0);'>deprecated </span>when the official 2023 boundary layers are released.</span></font></span><font face='Avenir Next W01, Avenir Next W00, Avenir Next, Avenir, Helvetica Neue, Helvetica, Arial, sans-serif' size='3'></font></div><div><div style='font-size:17px; font-family:\"Avenir Next W01\", \"Avenir Next W00\", \"Avenir Next\", Avenir, \"Helvetica Neue\", Helvetica, Arial, sans-serif !important;'><span style='font-style:italic;'><font size='3'><br /></font></span></div><div style='font-family:\"Avenir Next W01\", \"Avenir Next W00\", \"Avenir Next\", Avenir, \"Helvetica Neue\", Helvetica, Arial, sans-serif !important;'><span style='font-style:italic;'><font size='3'>This dataset is the povisional 2023 dataset for Community Board.\n The final 2023 layer is scheduled to be published on 8 December 2022 as\n part of the annual boundary release.</font></span></div><div style='font-family:\"Avenir Next W01\", \"Avenir Next W00\", \"Avenir Next\", Avenir, \"Helvetica Neue\", Helvetica, Arial, sans-serif !important;'><span style='font-style:italic;'><font size='3'><br /></font></span></div><div style='font-family:\"Avenir Next W01\", \"Avenir Next W00\", \"Avenir Next\", Avenir, \"Helvetica Neue\", Helvetica, Arial, sans-serif !important;'><span style='font-style:italic;'><font size='3'>The intention of providing this provisional dataset is to make \navailable the boundaries that will be used for the local body elections \nbeing held in October 2022.</font></span></div><div><font style='font-family:\"Avenir Next W01\", \"Avenir Next W00\", \"Avenir Next\", Avenir, \"Helvetica Neue\", Helvetica, Arial, sans-serif !important; font-size:17px;'><span style='font-size:17px;'></span></font></div><div><div style='font-size:17px; font-family:\"Avenir Next W01\", \"Avenir Next W00\", \"Avenir Next\", Avenir, \"Helvetica Neue\", Helvetica, Arial, sans-serif !important;'><font face='Avenir Next W01, Avenir Next W00, Avenir Next, Avenir, Helvetica Neue, Helvetica, Arial, sans-serif'><br /></font></div><div style='font-size:17px; font-family:\"Avenir Next W01\", \"Avenir Next W00\", \"Avenir Next\", Avenir, \"Helvetica Neue\", Helvetica, Arial, sans-serif !important;'><font face='Avenir Next W01, Avenir Next W00, Avenir Next, Avenir, Helvetica Neue, Helvetica, Arial, sans-serif'>This layer is based on the </font><font size='3'><font>provisional </font></font>set of regional council Māori constituency boundaries for 2023 as defined by the regional councils and Local Government Commission but maintained by Stats NZ (the custodian).<font face='Avenir Next W01, Avenir Next W00, Avenir Next, Avenir, Helvetica Neue, Helvetica, Arial, sans-serif'> </font></div></div><div style='font-size:17px; font-family:\"Avenir Next W01\", \"Avenir Next W00\", \"Avenir Next\", Avenir, \"Helvetica Neue\", Helvetica, Arial, sans-serif !important;'><font face='Avenir Next W01, Avenir Next W00, Avenir Next, Avenir, Helvetica Neue, Helvetica, Arial, sans-serif'><br /></font></div><div style='font-size:17px; font-family:\"Avenir Next W01\", \"Avenir Next W00\", \"Avenir Next\", Avenir, \"Helvetica Neue\", Helvetica, Arial, sans-serif !important;'>Māori constituencies are established under the Local Electoral Act 2001 and\nresult from the division of a region for electoral purposes.<font face='Avenir Next W01, Avenir Next W00, Avenir Next, Avenir, Helvetica Neue, Helvetica, Arial, sans-serif'><br /></font></div><div style='font-size:17px; font-family:\"Avenir Next W01\", \"Avenir Next W00\", \"Avenir Next\", Avenir, \"Helvetica Neue\", Helvetica, Arial, sans-serif !important;'><br /></div><div style='font-size:17px; font-family:\"Avenir Next W01\", \"Avenir Next W00\", \"Avenir Next\", Avenir, \"Helvetica Neue\", Helvetica, Arial, sans-serif !important;'>Māori constituencies are divisions of regional council areas. They are created,\nbased on population, to be the voting areas within councils. Māori\nconstituencies are defined at meshblock level, and do not coincide with the\nstatistical area 1 (SA1) geography or the statistical area 2 (SA2) geography. </div><div style='font-size:17px; font-family:\"Avenir Next W01\", \"Avenir Next W00\", \"Avenir Next\", Avenir, \"Helvetica Neue\", Helvetica, Arial, sans-serif !important;'><br /></div><div style='font-size:17px; font-family:\"Avenir Next W01\", \"Avenir Next W00\", \"Avenir Next\", Avenir, \"Helvetica Neue\", Helvetica, Arial, sans-serif !important;'>If a regional council decides to have a Māori constituency, the constituencies\nwithin the council are known as general constituencies and Māori\nconstituencies. </div><div style='font-size:17px; font-family:\"Avenir Next W01\", \"Avenir Next W00\", \"Avenir Next\", Avenir, \"Helvetica Neue\", Helvetica, Arial, sans-serif !important;'><br /></div><div style='font-size:17px; font-family:\"Avenir Next W01\", \"Avenir Next W00\", \"Avenir Next\", Avenir, \"Helvetica Neue\", Helvetica, Arial, sans-serif !important;'>Classifications exist annually from 2005 to 2023. </div><div style='font-size:17px; font-family:\"Avenir Next W01\", \"Avenir Next W00\", \"Avenir Next\", Avenir, \"Helvetica Neue\", Helvetica, Arial, sans-serif !important;'><br /></div><div style='font-size:17px; font-family:\"Avenir Next W01\", \"Avenir Next W00\", \"Avenir Next\", Avenir, \"Helvetica Neue\", Helvetica, Arial, sans-serif !important;'>The boundaries of Māori constituencies may be reviewed before each three yearly\nlocal government election. Regional councils must review their\nrepresentation arrangements at least once every six years. The provisions for\nsuch reviews are contained in the Local Government Act 2002. </div><div style='font-size:17px; font-family:\"Avenir Next W01\", \"Avenir Next W00\", \"Avenir Next\", Avenir, \"Helvetica Neue\", Helvetica, Arial, sans-serif !important;'><br /></div><div style='font-size:17px; font-family:\"Avenir Next W01\", \"Avenir Next W00\", \"Avenir Next\", Avenir, \"Helvetica Neue\", Helvetica, Arial, sans-serif !important;'>Māori constituencies are numbered based on their corresponding regional\ncouncil. Each Māori constituency has a unique four-digit code. The first two\ndigits represent the regional council that the Māori constituency lies within. The\nlast two digits are sequential and represent the number of Māori constituencies\nwithin a regional council. For example, the Waikato Regional Council (03)\ncontains two Māori constituencies which are coded 0301 and 0302.<br /></div><div style='font-size:17px; font-family:\"Avenir Next W01\", \"Avenir Next W00\", \"Avenir Next\", Avenir, \"Helvetica Neue\", Helvetica, Arial, sans-serif !important;'><br /></div><div style='font-size:17px; font-family:\"Avenir Next W01\", \"Avenir Next W00\", \"Avenir Next\", Avenir, \"Helvetica Neue\", Helvetica, Arial, sans-serif !important;'><span style='font-size:medium;'>This layer shows the </span><span style='font-size:medium;'><font size='3'><font face='Avenir Next W01, Avenir Next W00, Avenir Next, Avenir, Helvetica Neue, Helvetica, Arial, sans-serif'>provisional </font></font>data for 2023. If you would like to use the layer that gets updated yearly with the latest boundary data, you can use <a href='https://www.arcgis.com/home/item.html?id=c79cf92a933a44b8ba27ed833163202f' target='_blank' rel='nofollow ugc noopener noreferrer'>this item</a>.<br /><br />All the boundary layers can be found <a href='https://www.arcgis.com/home/group.html?id=8047736c3e43467aa62241976851eff9' target='_blank' rel='nofollow ugc noopener noreferrer'>here</a>.<br /><br />All the boundary layers that are updated yearly can be found <a href='https://www.arcgis.com/home/group.html?id=b22e4f0012a8426dac21cd3d02f25c67' target='_blank' rel='nofollow ugc noopener noreferrer'>here</a>.<br /><br />The official dataset can be found on</span><font face='Avenir Next W01, Avenir Next W00, Avenir Next, Avenir, Helvetica Neue, Helvetica, Arial, sans-serif' size='3'> </font><a href='https://datafinder.stats.govt.nz/data/category/provisional-boundaries/' target='_blank' rel='nofollow ugc noopener noreferrer'>https://datafinder.stats.govt.nz</a>.<br /></div><div style='font-size:17px; font-family:\"Avenir Next W01\", \"Avenir Next W00\", \"Avenir Next\", Avenir, \"Helvetica Neue\", Helvetica, Arial, sans-serif !important;'><div><br /></div><div><div><font size='3'>This layer contains the following attributes (see data tab):</font></div><div><ul><li>Māori Constituency code</li><li>Māori Constituency name</li><li>Total area in square kilometers</li><li>Total land area in square kilometers.</li></ul><div><span style='font-size:medium;'>The layer is further generalised by Eagle Technology for improved performance on the web, </span><span style='font-family:\"Avenir Next W01\", \"Avenir Next W00\", \"Avenir Next\", Avenir, \"Helvetica Neue\", sans-serif; font-size:medium;'>therefore it doesn't fully represent the official boundaries.</span><br /></div></div></div><div><font size='3'><br /></font></div><div><div><font color='#2f4f4f' size='3'>This layer is offered by Eagle Technology (Official Esri Distributor). Eagle Technology offers services that can be used in the ArcGIS platform. The Content team at Eagle Technology updates the layers on a regular basis and regularly adds new content to the Living Atlas. By using this content and combining it with other data you can create new information products quickly and easily.</font></div><div><font color='#2f4f4f' size='3'><br /></font></div><div><font size='3'><font color='#2f4f4f'>If you have any questions or comments about the content, please let us now  at </font><a href='mailto:livingatlas@eagle.co.nz' style='color:rgb(0, 121, 193); text-decoration-line:none;' target='_blank' rel='nofollow ugc noopener noreferrer'>livingatlas@eagle.co.nz</a></font></div></div></div></div></div>",
			"keyword": [
				"eaglegis",
				"mature support",
				"retiring",
				"deprecated"
			],
			"issued": "2022-07-25T09:10:55.000Z",
			"modified": "2022-07-27T00:09:11.764Z",
			"publisher": {
				"name": "Eagle Technology Group Ltd"
			},
			"contactPoint": {
				"@type": "vcard:Contact",
				"fn": "eaglegis",
				"hasEmail": "mailto:ts@eaglegis.co.nz"
			},
			"accessLevel": "public",
			"spatial": "166.2620,-47.2230,-177.6189,-33.7734",
			"license": "https://creativecommons.org/licenses/by/4.0",
			"distribution": [
				{
					"@type": "dcat:Distribution",
					"title": "ArcGIS Hub Dataset",
					"format": "Web Page",
					"mediaType": "text/html",
					"accessURL": "https://www.pacificgeoportal.com/datasets/eaglegis::nz-māori-constituencies-2023-provisional-mature-support"
				},
				{
					"@type": "dcat:Distribution",
					"title": "ArcGIS GeoService",
					"format": "ArcGIS GeoServices REST API",
					"mediaType": "application/json",
					"accessURL": "https://services.arcgis.com/XTtANUDT8Va4DLwI/arcgis/rest/services/nz_maori_constituencies_2023/FeatureServer/0"
				},
				{
					"@type": "dcat:Distribution",
					"title": "CSV",
					"format": "CSV",
					"mediaType": "text/csv",
					"accessURL": "https://www.pacificgeoportal.com/api/download/v1/items/00507f21185c4ea4939cecfe0c656817/csv?layers=0"
				},
				{
					"@type": "dcat:Distribution",
					"title": "Shapefile",
					"format": "ZIP",
					"mediaType": "application/zip",
					"accessURL": "https://www.pacificgeoportal.com/api/download/v1/items/00507f21185c4ea4939cecfe0c656817/shapefile?layers=0"
				},
				{
					"@type": "dcat:Distribution",
					"title": "GeoJSON",
					"format": "GeoJSON",
					"mediaType": "application/vnd.geo+json",
					"accessURL": "https://www.pacificgeoportal.com/api/download/v1/items/00507f21185c4ea4939cecfe0c656817/geojson?layers=0"
				},
				{
					"@type": "dcat:Distribution",
					"title": "KML",
					"format": "KML",
					"mediaType": "application/vnd.google-earth.kml+xml",
					"accessURL": "https://www.pacificgeoportal.com/api/download/v1/items/00507f21185c4ea4939cecfe0c656817/kml?layers=0"
				},
				{
					"@type": "dcat:Distribution",
					"title": "File Geodatabase",
					"format": "ZIP",
					"mediaType": "application/zip",
					"accessURL": "https://www.pacificgeoportal.com/api/download/v1/items/00507f21185c4ea4939cecfe0c656817/filegdb?layers=0"
				},
				{
					"@type": "dcat:Distribution",
					"title": "Feature Collection",
					"format": "TXT",
					"mediaType": "text/plain",
					"accessURL": "https://www.pacificgeoportal.com/api/download/v1/items/00507f21185c4ea4939cecfe0c656817/featureCollection?layers=0"
				},
				{
					"@type": "dcat:Distribution",
					"title": "Excel",
					"format": "XLSX",
					"mediaType": "application/vnd.ms-excel",
					"accessURL": "https://www.pacificgeoportal.com/api/download/v1/items/00507f21185c4ea4939cecfe0c656817/excel?layers=0"
				},
				{
					"@type": "dcat:Distribution",
					"title": "GeoPackage",
					"format": "GPKG",
					"mediaType": "application/geopackage+sqlite3",
					"accessURL": "https://www.pacificgeoportal.com/api/download/v1/items/00507f21185c4ea4939cecfe0c656817/geoPackage?layers=0"
				},
				{
					"@type": "dcat:Distribution",
					"title": "SQLite Geodatabase",
					"format": "GDB",
					"mediaType": "application/geopackage+sqlite3",
					"accessURL": "https://www.pacificgeoportal.com/api/download/v1/items/00507f21185c4ea4939cecfe0c656817/sqlite?layers=0"
				}
			],
			"theme": [
				"geospatial"
			]
		},
		{
			"@type": "dcat:Dataset",
			"identifier": "https://www.arcgis.com/home/item.html?id=66920926155d4b9a813ba151567b603c&sublayer=0",
			"landingPage": "https://www.pacificgeoportal.com/datasets/eaglegis::nz-constituencies-2023-provisional-mature-support",
			"title": "NZ Constituencies - 2023 - Provisional (Mature Support)",
			"description": "<font size='3'><b><span style='color:firebrick;'>Important Note:</span></b><b> This item is in<span style='color:#C00000;'> mature support</span> as of January 2024 and will retire in January 2025.</b><b><span> When you need the most recent boundary layer please use <a href='https://www.arcgis.com/home/item.html?id=6712602ebaa54b60a421fe7ac73eb7aa' rel='nofollow ugc'>this item</a>. When you need the boundaries for a specific year, please use <a href='https://www.arcgis.com/home/item.html?id=5f373fde10f8442f81c4a3ef8a47961e' rel='nofollow ugc'>this item</a> and set a filter on the required year.</span></b><br /><br /></font><div><br /><font size='3' style='font-family:\"Avenir Next W01\", \"Avenir Next W00\", \"Avenir Next\", Avenir, \"Helvetica Neue\", Helvetica, Arial, sans-serif !important;'>Topicality: </font><font size='3' style='font-family:\"Avenir Next W01\", \"Avenir Next W00\", \"Avenir Next\", Avenir, \"Helvetica Neue\", Helvetica, Arial, sans-serif !important;'>23-06-2022</font><div><font size='3'><span style='font-family:\"Avenir Next W01\", \"Avenir Next W00\", \"Avenir Next\", Avenir, \"Helvetica Neue\", Helvetica, Arial, sans-serif;'>Projection: New Zealand Transverse Mercator (NZTM)</span><font face='Avenir Next W01, Avenir Next W00, Avenir Next, Avenir, Helvetica Neue, Helvetica, Arial, sans-serif'><br /></font></font></div><div><font size='3'><font face='Avenir Next W01, Avenir Next W00, Avenir Next, Avenir, Helvetica Neue, Helvetica, Arial, sans-serif'><br /></font></font></div><div><span style='font-style:italic;'><font size='3'><span style='font-weight:bold;'>NB: This layer will be <span style='color:rgb(255, 0, 0);'>deprecated </span>when the official 2023 boundary layers are released.</span></font></span><font size='3'><font face='Avenir Next W01, Avenir Next W00, Avenir Next, Avenir, Helvetica Neue, Helvetica, Arial, sans-serif'></font></font></div><div><div style='font-size:17px; font-family:\"Avenir Next W01\", \"Avenir Next W00\", \"Avenir Next\", Avenir, \"Helvetica Neue\", Helvetica, Arial, sans-serif !important;'><span style='font-style:italic;'><font size='3'><br /></font></span></div><div style='font-family:\"Avenir Next W01\", \"Avenir Next W00\", \"Avenir Next\", Avenir, \"Helvetica Neue\", Helvetica, Arial, sans-serif !important;'><span style='font-style:italic;'><font size='3'>This dataset is the povisional 2023 dataset for Community Board.\n The final 2023 layer is scheduled to be published on 8 December 2022 as\n part of the annual boundary release.</font></span></div><div style='font-family:\"Avenir Next W01\", \"Avenir Next W00\", \"Avenir Next\", Avenir, \"Helvetica Neue\", Helvetica, Arial, sans-serif !important;'><span style='font-style:italic;'><font size='3'><br /></font></span></div><div style='font-family:\"Avenir Next W01\", \"Avenir Next W00\", \"Avenir Next\", Avenir, \"Helvetica Neue\", Helvetica, Arial, sans-serif !important;'><span style='font-style:italic;'><font size='3'>The intention of providing this provisional dataset is to make \navailable the boundaries that will be used for the local body elections \nbeing held in October 2022.</font></span></div><div><div style='font-family:\"Avenir Next W01\", \"Avenir Next W00\", \"Avenir Next\", Avenir, \"Helvetica Neue\", Helvetica, Arial, sans-serif !important;'><font size='3'><font face='Avenir Next W01, Avenir Next W00, Avenir Next, Avenir, Helvetica Neue, Helvetica, Arial, sans-serif'><br /></font></font></div><div style='font-family:\"Avenir Next W01\", \"Avenir Next W00\", \"Avenir Next\", Avenir, \"Helvetica Neue\", Helvetica, Arial, sans-serif !important;'><font size='3'><font face='Avenir Next W01, Avenir Next W00, Avenir Next, Avenir, Helvetica Neue, Helvetica, Arial, sans-serif'>This layer is based on the </font></font><font size='3'><font face='Avenir Next W01, Avenir Next W00, Avenir Next, Avenir, Helvetica Neue, Helvetica, Arial, sans-serif'><font size='3'><font>provisional </font></font></font>set of regional council constituency boundaries for\n2023 as defined by the regional councils and Local Government Commission\nbut maintained by Stats NZ (the custodian).<font face='Avenir Next W01, Avenir Next W00, Avenir Next, Avenir, Helvetica Neue, Helvetica, Arial, sans-serif'> </font></font></div><div><font face='Avenir Next W01, Avenir Next W00, Avenir Next, Avenir, Helvetica Neue, Helvetica, Arial, sans-serif' size='3'><div><br /></div><div><div>Constituencies are established under the Local Electoral Act 2001 and result from the division of a region for electoral purposes. If a regional council decides to have a Māori constituency, the constituencies within the council are known as general constituencies and Māori constituencies.  </div><div> </div><div>Constituencies are divisions of regional council areas. They are defined at meshblock level, and do not coincide with the statistical area 1 (SA1) geography or the statistical area 2 (SA2) geography. They are created, based on population, to be the voting areas within councils. Constituencies are required to reflect communities of interest. Their boundaries, so far as is practicable, coincide with those of territorial authorities or wards. The boundaries of constituencies may be reviewed before each three-yearly local government election. Regional councils must review their representation arrangements at least once every six years. The provisions for such reviews are in the Local Government Act 2002. </div><div> </div><div>Constituencies are numbered based on their corresponding regional council. Each constituency has a unique four-digit code. The first two digits represent the regional council that the constituency lies within. The last two digits are sequential and represent the number of constituencies within a regional council. For example, the West Coast Regional Council (12) contains three constituencies, which are coded 1201, 1202, and 1203.</div></div></font></div><div style='font-family:\"Avenir Next W01\", \"Avenir Next W00\", \"Avenir Next\", Avenir, \"Helvetica Neue\", Helvetica, Arial, sans-serif !important;'><font face='Avenir Next W01, Avenir Next W00, Avenir Next, Avenir, Helvetica Neue, Helvetica, Arial, sans-serif' size='3'><br /></font></div><div style='font-family:\"Avenir Next W01\", \"Avenir Next W00\", \"Avenir Next\", Avenir, \"Helvetica Neue\", Helvetica, Arial, sans-serif !important;'><font size='3'>This layer shows the provisional data for 2023. If you would like to use the layer that gets updated yearly with the latest boundary data, you can use <a href='https://www.arcgis.com/home/item.html?id=6712602ebaa54b60a421fe7ac73eb7aa' target='_blank' rel='nofollow ugc noopener noreferrer'>this item</a>.<br /><br />All the boundary layers can be found <a href='https://www.arcgis.com/home/group.html?id=8047736c3e43467aa62241976851eff9' target='_blank' rel='nofollow ugc noopener noreferrer'>here</a>.<br /><br />All the boundary layers that are updated yearly can be found <a href='https://www.arcgis.com/home/group.html?id=b22e4f0012a8426dac21cd3d02f25c67' target='_blank' rel='nofollow ugc noopener noreferrer'>here</a>.<br /><br />The official dataset can be found on<font face='Avenir Next W01, Avenir Next W00, Avenir Next, Avenir, Helvetica Neue, Helvetica, Arial, sans-serif'> </font></font><a href='https://datafinder.stats.govt.nz/data/category/provisional-boundaries/' target='_blank' rel='nofollow ugc noopener noreferrer'>https://datafinder.stats.govt.nz</a><font size='3'>.</font></div><div style='font-family:\"Avenir Next W01\", \"Avenir Next W00\", \"Avenir Next\", Avenir, \"Helvetica Neue\", Helvetica, Arial, sans-serif !important;'><br /></div><div style='font-family:\"Avenir Next W01\", \"Avenir Next W00\", \"Avenir Next\", Avenir, \"Helvetica Neue\", Helvetica, Arial, sans-serif !important;'><div><font size='3'>This layer contains the following attributes (see data tab):</font></div><div><ul><li><font size='3'>Constituency code</font></li><li><font size='3'>Constituency name</font></li><li><font size='3'>Total area in square kilometers</font></li><li><font size='3'>Total land area in square kilometers.</font></li></ul><div><font size='3'>The layer is further generalised by Eagle Technology for improved performance on the web, <span style='font-family:\"Avenir Next W01\", \"Avenir Next W00\", \"Avenir Next\", Avenir, \"Helvetica Neue\", sans-serif;'>therefore it doesn't fully represent the official boundaries.</span><br /></font></div></div></div><div style='font-family:\"Avenir Next W01\", \"Avenir Next W00\", \"Avenir Next\", Avenir, \"Helvetica Neue\", Helvetica, Arial, sans-serif !important;'><font size='3'><br /></font></div><div style='font-family:\"Avenir Next W01\", \"Avenir Next W00\", \"Avenir Next\", Avenir, \"Helvetica Neue\", Helvetica, Arial, sans-serif !important;'><div><font color='#2f4f4f' size='3'>This layer is offered by Eagle Technology (Official Esri Distributor). Eagle Technology offers services that can be used in the ArcGIS platform. The Content team at Eagle Technology updates the layers on a regular basis and regularly adds new content to the Living Atlas. By using this content and combining it with other data you can create new information products quickly and easily.</font></div><div><font color='#2f4f4f' size='3'><br /></font></div><div><font size='3'><font color='#2f4f4f'>If you have any questions or comments about the content, please let us now  at </font><a href='mailto:livingatlas@eagle.co.nz' style='color:rgb(0, 121, 193); text-decoration-line:none;' target='_blank' rel='nofollow ugc noopener noreferrer'>livingatlas@eagle.co.nz</a></font></div></div></div></div></div>",
			"keyword": [
				"eaglegis",
				"mature support",
				"retiring",
				"deprecated"
			],
			"issued": "2022-07-25T09:10:40.000Z",
			"modified": "2022-07-27T00:09:07.625Z",
			"publisher": {
				"name": "Eagle Technology Group Ltd"
			},
			"contactPoint": {
				"@type": "vcard:Contact",
				"fn": "eaglegis",
				"hasEmail": "mailto:ts@eaglegis.co.nz"
			},
			"accessLevel": "public",
			"spatial": "166.2620,-47.2230,-177.6189,-33.7734",
			"license": "https://creativecommons.org/licenses/by/4.0",
			"distribution": [
				{
					"@type": "dcat:Distribution",
					"title": "ArcGIS Hub Dataset",
					"format": "Web Page",
					"mediaType": "text/html",
					"accessURL": "https://www.pacificgeoportal.com/datasets/eaglegis::nz-constituencies-2023-provisional-mature-support"
				},
				{
					"@type": "dcat:Distribution",
					"title": "ArcGIS GeoService",
					"format": "ArcGIS GeoServices REST API",
					"mediaType": "application/json",
					"accessURL": "https://services.arcgis.com/XTtANUDT8Va4DLwI/arcgis/rest/services/nz_constituencies_2023/FeatureServer/0"
				},
				{
					"@type": "dcat:Distribution",
					"title": "CSV",
					"format": "CSV",
					"mediaType": "text/csv",
					"accessURL": "https://www.pacificgeoportal.com/api/download/v1/items/66920926155d4b9a813ba151567b603c/csv?layers=0"
				},
				{
					"@type": "dcat:Distribution",
					"title": "Shapefile",
					"format": "ZIP",
					"mediaType": "application/zip",
					"accessURL": "https://www.pacificgeoportal.com/api/download/v1/items/66920926155d4b9a813ba151567b603c/shapefile?layers=0"
				},
				{
					"@type": "dcat:Distribution",
					"title": "GeoJSON",
					"format": "GeoJSON",
					"mediaType": "application/vnd.geo+json",
					"accessURL": "https://www.pacificgeoportal.com/api/download/v1/items/66920926155d4b9a813ba151567b603c/geojson?layers=0"
				},
				{
					"@type": "dcat:Distribution",
					"title": "KML",
					"format": "KML",
					"mediaType": "application/vnd.google-earth.kml+xml",
					"accessURL": "https://www.pacificgeoportal.com/api/download/v1/items/66920926155d4b9a813ba151567b603c/kml?layers=0"
				},
				{
					"@type": "dcat:Distribution",
					"title": "File Geodatabase",
					"format": "ZIP",
					"mediaType": "application/zip",
					"accessURL": "https://www.pacificgeoportal.com/api/download/v1/items/66920926155d4b9a813ba151567b603c/filegdb?layers=0"
				},
				{
					"@type": "dcat:Distribution",
					"title": "Feature Collection",
					"format": "TXT",
					"mediaType": "text/plain",
					"accessURL": "https://www.pacificgeoportal.com/api/download/v1/items/66920926155d4b9a813ba151567b603c/featureCollection?layers=0"
				},
				{
					"@type": "dcat:Distribution",
					"title": "Excel",
					"format": "XLSX",
					"mediaType": "application/vnd.ms-excel",
					"accessURL": "https://www.pacificgeoportal.com/api/download/v1/items/66920926155d4b9a813ba151567b603c/excel?layers=0"
				},
				{
					"@type": "dcat:Distribution",
					"title": "GeoPackage",
					"format": "GPKG",
					"mediaType": "application/geopackage+sqlite3",
					"accessURL": "https://www.pacificgeoportal.com/api/download/v1/items/66920926155d4b9a813ba151567b603c/geoPackage?layers=0"
				},
				{
					"@type": "dcat:Distribution",
					"title": "SQLite Geodatabase",
					"format": "GDB",
					"mediaType": "application/geopackage+sqlite3",
					"accessURL": "https://www.pacificgeoportal.com/api/download/v1/items/66920926155d4b9a813ba151567b603c/sqlite?layers=0"
				}
			],
			"theme": [
				"geospatial"
			]
		},
		{
			"@type": "dcat:Dataset",
			"identifier": "https://www.arcgis.com/home/item.html?id=30567a6314c04c5c8fbd84f47927bb7f&sublayer=0",
			"landingPage": "https://www.pacificgeoportal.com/datasets/eaglegis::nz-community-boards-2023-provisional-mature-support",
			"title": "NZ Community Boards - 2023 - Provisional (Mature Support)",
			"description": "<font size='3'><b><span style='color:firebrick;'>Important Note:</span></b><b> This item is in<span style='color:#C00000;'> mature support</span> as of January 2024 and will retire in January 2025.</b><b><span> When you need the most recent boundary layer please use <a href='https://www.arcgis.com/home/item.html?id=f67d663afaab470982b63d0f37db0f30' rel='nofollow ugc'>this item</a>. When you need the boundaries for a specific year, please use <a href='https://www.arcgis.com/home/item.html?id=a855671b0d884afb91be42331f469138' rel='nofollow ugc'>this item</a> and set a filter on the required year.</span></b><br /><br /></font><div><br /><font size='3' style='font-family:\"Avenir Next W01\", \"Avenir Next W00\", \"Avenir Next\", Avenir, \"Helvetica Neue\", Helvetica, Arial, sans-serif !important;'>Topicality: </font><font size='3' style='font-family:\"Avenir Next W01\", \"Avenir Next W00\", \"Avenir Next\", Avenir, \"Helvetica Neue\", Helvetica, Arial, sans-serif !important;'>23-06-2022</font><div><div style='font-size:17px; font-family:\"Avenir Next W01\", \"Avenir Next W00\", \"Avenir Next\", Avenir, \"Helvetica Neue\", Helvetica, Arial, sans-serif !important;'><span style='font-size:medium;'>Projection: New Zealand Transverse Mercator (NZTM)</span><i><br /></i></div><div style='font-size:17px; font-family:\"Avenir Next W01\", \"Avenir Next W00\", \"Avenir Next\", Avenir, \"Helvetica Neue\", Helvetica, Arial, sans-serif !important;'><i><br /></i></div><div style='font-size:17px; font-family:\"Avenir Next W01\", \"Avenir Next W00\", \"Avenir Next\", Avenir, \"Helvetica Neue\", Helvetica, Arial, sans-serif !important;'><span style='font-style:italic;'><font size='3'><span style='font-weight:bold;'>NB: This layer will be <span style='color:rgb(255, 0, 0);'>deprecated </span>when the official 2023 boundary layers are released.</span></font></span></div><div style='font-size:17px; font-family:\"Avenir Next W01\", \"Avenir Next W00\", \"Avenir Next\", Avenir, \"Helvetica Neue\", Helvetica, Arial, sans-serif !important;'><i><br /></i></div><div style='font-family:\"Avenir Next W01\", \"Avenir Next W00\", \"Avenir Next\", Avenir, \"Helvetica Neue\", Helvetica, Arial, sans-serif !important;'><span style='font-style:italic;'><font size='3'>This dataset is the povisional 2023 dataset for Community Board.\n The final 2023 layer is scheduled to be published on 8 December 2022 as\n part of the annual boundary release.</font></span></div><div style='font-family:\"Avenir Next W01\", \"Avenir Next W00\", \"Avenir Next\", Avenir, \"Helvetica Neue\", Helvetica, Arial, sans-serif !important;'><span style='font-style:italic;'><font size='3'><br /></font></span></div><div style='font-family:\"Avenir Next W01\", \"Avenir Next W00\", \"Avenir Next\", Avenir, \"Helvetica Neue\", Helvetica, Arial, sans-serif !important;'><span style='font-style:italic;'><font size='3'>The intention of providing this provisional dataset is to make \navailable the boundaries that will be used for the local body elections \nbeing held in October 2022.</font></span></div><div><div><font size='3'><font face='Avenir Next W01, Avenir Next W00, Avenir Next, Avenir, Helvetica Neue, Helvetica, Arial, sans-serif'><br /></font></font></div><div><font size='3'><font face='Avenir Next W01, Avenir Next W00, Avenir Next, Avenir, Helvetica Neue, Helvetica, Arial, sans-serif'>This layer is based on the </font></font><font size='3'><font face='Avenir Next W01, Avenir Next W00, Avenir Next, Avenir, Helvetica Neue, Helvetica, Arial, sans-serif'><font size='3'><font>provisional Community Boards</font></font> </font></font><font size='3'><font face='Avenir Next W01, Avenir Next W00, Avenir Next, Avenir, Helvetica Neue, Helvetica, Arial, sans-serif'><font size='3'>boundaries for\n2023</font>. It contains the provisional </font>set of Community Board boundaries as at 23 June 2022, clipped to the coastline.This clipped and generalized version has been created for map creation/cartographic purposes and does not fully represent the official full extent boundaries.</font></div><div><font face='Avenir Next W01, Avenir Next W00, Avenir Next, Avenir, Helvetica Neue, Helvetica, Arial, sans-serif' size='3'><br /></font></div><div><span style='font-family:\"Avenir Next W01\", \"Avenir Next W00\", \"Avenir Next\", Avenir, \"Helvetica Neue\", Helvetica, Arial, sans-serif; font-size:medium;'>This layer shows the </span><span style='font-family:\"Avenir Next W01\", \"Avenir Next W00\", \"Avenir Next\", Avenir, \"Helvetica Neue\", Helvetica, Arial, sans-serif; font-size:medium;'><font size='3'><font face='Avenir Next W01, Avenir Next W00, Avenir Next, Avenir, Helvetica Neue, Helvetica, Arial, sans-serif'>provisional </font></font>data for 2023. If you would like to use the layer that gets updated yearly with the latest boundary data, you can use <a href='https://www.arcgis.com/home/item.html?id=f67d663afaab470982b63d0f37db0f30' target='_blank' rel='nofollow ugc noopener noreferrer'>this item</a>.<br /><br />All the boundary layers can be found <a href='https://www.arcgis.com/home/group.html?id=8047736c3e43467aa62241976851eff9' target='_blank' rel='nofollow ugc noopener noreferrer'>here</a>.<br /><br />All the boundary layers that are updated yearly can be found <a href='https://www.arcgis.com/home/group.html?id=b22e4f0012a8426dac21cd3d02f25c67' target='_blank' rel='nofollow ugc noopener noreferrer'>here</a>.<br /><br />The official dataset can be found on</span><font face='Avenir Next W01, Avenir Next W00, Avenir Next, Avenir, Helvetica Neue, Helvetica, Arial, sans-serif' size='3'> </font><a href='https://datafinder.stats.govt.nz/data/category/provisional-boundaries/' target='_blank' rel='nofollow ugc noopener noreferrer'>https://datafinder.stats.govt.nz</a>.</div><div><font face='Avenir Next W01, Avenir Next W00, Avenir Next, Avenir, Helvetica Neue, Helvetica, Arial, sans-serif' size='3'><br /></font></div><div><font size='3'><span style='font-family:\"Avenir Next W01\", \"Avenir Next W00\", \"Avenir Next\", Avenir, \"Helvetica Neue\", Helvetica, Arial, sans-serif;'>This layer contains the following attributes (see data tab):</span></font></div><div><ul><li>Community Board number</li><li>Community Board name</li><li>Total area in square kilometers</li><li>Total land area in square kilometers.</li></ul>The layer is further generalised by Eagle Technology for improved performance on the web, <span style='font-size:medium; font-family:\"Avenir Next W01\", \"Avenir Next W00\", \"Avenir Next\", Avenir, \"Helvetica Neue\", sans-serif;'>therefore it doesn't fully represent the official boundaries.</span><br /></div><div style='font-family:\"Avenir Next W01\", \"Avenir Next W00\", \"Avenir Next\", Avenir, \"Helvetica Neue\", Helvetica, Arial, sans-serif !important;'><font size='3'><br /></font></div><div><div style='font-family:\"Avenir Next W01\", \"Avenir Next W00\", \"Avenir Next\", Avenir, \"Helvetica Neue\", Helvetica, Arial, sans-serif !important;'><font color='#2f4f4f' size='3'>This layer is offered by Eagle Technology (Official Esri Distributor). Eagle Technology offers services that can be used in the ArcGIS platform. The Content team at Eagle Technology updates the layers on a regular basis and regularly adds new content to the Living Atlas. By using this content and combining it with other data you can create new information products quickly and easily.</font></div><div style='font-family:\"Avenir Next W01\", \"Avenir Next W00\", \"Avenir Next\", Avenir, \"Helvetica Neue\", Helvetica, Arial, sans-serif !important;'><font color='#2f4f4f' size='3'><br /></font></div><div style='font-family:\"Avenir Next W01\", \"Avenir Next W00\", \"Avenir Next\", Avenir, \"Helvetica Neue\", Helvetica, Arial, sans-serif !important;'><font size='3'><font color='#2f4f4f'>If you have any questions or comments about the content, please let us now  at </font><a href='mailto:livingatlas@eagle.co.nz' style='color:rgb(0, 121, 193); text-decoration-line:none;' target='_blank' rel='nofollow ugc noopener noreferrer'>livingatlas@eagle.co.nz</a></font></div></div></div></div></div>",
			"keyword": [
				"eaglegis",
				"mature support",
				"retiring",
				"deprecated"
			],
			"issued": "2022-07-25T09:10:25.000Z",
			"modified": "2022-07-27T00:09:03.982Z",
			"publisher": {
				"name": "Eagle Technology Group Ltd"
			},
			"contactPoint": {
				"@type": "vcard:Contact",
				"fn": "eaglegis",
				"hasEmail": "mailto:ts@eaglegis.co.nz"
			},
			"accessLevel": "public",
			"spatial": "166.2620,-47.2230,-177.6189,-33.7734",
			"license": "https://creativecommons.org/licenses/by/4.0",
			"distribution": [
				{
					"@type": "dcat:Distribution",
					"title": "ArcGIS Hub Dataset",
					"format": "Web Page",
					"mediaType": "text/html",
					"accessURL": "https://www.pacificgeoportal.com/datasets/eaglegis::nz-community-boards-2023-provisional-mature-support"
				},
				{
					"@type": "dcat:Distribution",
					"title": "ArcGIS GeoService",
					"format": "ArcGIS GeoServices REST API",
					"mediaType": "application/json",
					"accessURL": "https://services.arcgis.com/XTtANUDT8Va4DLwI/arcgis/rest/services/nz_community_boards_2023/FeatureServer/0"
				},
				{
					"@type": "dcat:Distribution",
					"title": "CSV",
					"format": "CSV",
					"mediaType": "text/csv",
					"accessURL": "https://www.pacificgeoportal.com/api/download/v1/items/30567a6314c04c5c8fbd84f47927bb7f/csv?layers=0"
				},
				{
					"@type": "dcat:Distribution",
					"title": "Shapefile",
					"format": "ZIP",
					"mediaType": "application/zip",
					"accessURL": "https://www.pacificgeoportal.com/api/download/v1/items/30567a6314c04c5c8fbd84f47927bb7f/shapefile?layers=0"
				},
				{
					"@type": "dcat:Distribution",
					"title": "GeoJSON",
					"format": "GeoJSON",
					"mediaType": "application/vnd.geo+json",
					"accessURL": "https://www.pacificgeoportal.com/api/download/v1/items/30567a6314c04c5c8fbd84f47927bb7f/geojson?layers=0"
				},
				{
					"@type": "dcat:Distribution",
					"title": "KML",
					"format": "KML",
					"mediaType": "application/vnd.google-earth.kml+xml",
					"accessURL": "https://www.pacificgeoportal.com/api/download/v1/items/30567a6314c04c5c8fbd84f47927bb7f/kml?layers=0"
				},
				{
					"@type": "dcat:Distribution",
					"title": "File Geodatabase",
					"format": "ZIP",
					"mediaType": "application/zip",
					"accessURL": "https://www.pacificgeoportal.com/api/download/v1/items/30567a6314c04c5c8fbd84f47927bb7f/filegdb?layers=0"
				},
				{
					"@type": "dcat:Distribution",
					"title": "Feature Collection",
					"format": "TXT",
					"mediaType": "text/plain",
					"accessURL": "https://www.pacificgeoportal.com/api/download/v1/items/30567a6314c04c5c8fbd84f47927bb7f/featureCollection?layers=0"
				},
				{
					"@type": "dcat:Distribution",
					"title": "Excel",
					"format": "XLSX",
					"mediaType": "application/vnd.ms-excel",
					"accessURL": "https://www.pacificgeoportal.com/api/download/v1/items/30567a6314c04c5c8fbd84f47927bb7f/excel?layers=0"
				},
				{
					"@type": "dcat:Distribution",
					"title": "GeoPackage",
					"format": "GPKG",
					"mediaType": "application/geopackage+sqlite3",
					"accessURL": "https://www.pacificgeoportal.com/api/download/v1/items/30567a6314c04c5c8fbd84f47927bb7f/geoPackage?layers=0"
				},
				{
					"@type": "dcat:Distribution",
					"title": "SQLite Geodatabase",
					"format": "GDB",
					"mediaType": "application/geopackage+sqlite3",
					"accessURL": "https://www.pacificgeoportal.com/api/download/v1/items/30567a6314c04c5c8fbd84f47927bb7f/sqlite?layers=0"
				}
			],
			"theme": [
				"geospatial"
			]
		},
		{
			"@type": "dcat:Dataset",
			"identifier": "https://www.arcgis.com/home/item.html?id=1e098a2de87d4f72adbe7f474b6dcb54&sublayer=0",
			"landingPage": "https://www.pacificgeoportal.com/datasets/eaglegis::nz-wards-2023-provisional-mature-support",
			"title": "NZ Wards - 2023 - Provisional (Mature Support)",
			"description": "<font size='3'><b><span style='color:firebrick;'>Important Note:</span></b><b> This item is in<span style='color:#C00000;'> mature support</span> as of January 2024 and will retire in January 2025.</b><b><span> When you need the most recent boundary layer please use <a href='https://www.arcgis.com/home/item.html?id=030d32f649c94ab8959215951c03fbca' rel='nofollow ugc'>this item</a>. When you need the boundaries for a specific year, please use <a href='https://www.arcgis.com/home/item.html?id=31b3469be5c4445c93f11e7ec02d78a6' rel='nofollow ugc'>this item</a> and set a filter on the required year.</span></b><br /><br /></font><div><br /><font size='3' style='font-family:\"Avenir Next W01\", \"Avenir Next W00\", \"Avenir Next\", Avenir, \"Helvetica Neue\", Helvetica, Arial, sans-serif !important;'>Topicality: </font><font size='3' style='font-family:\"Avenir Next W01\", \"Avenir Next W00\", \"Avenir Next\", Avenir, \"Helvetica Neue\", Helvetica, Arial, sans-serif !important;'>23-06-2022</font><div><font face='Avenir Next W01, Avenir Next W00, Avenir Next, Avenir, Helvetica Neue, Helvetica, Arial, sans-serif' style='font-family:\"Avenir Next W01\", \"Avenir Next W00\", \"Avenir Next\", Avenir, \"Helvetica Neue\", Helvetica, Arial, sans-serif !important; font-size:17px;'><span style='font-size:17px;'>Projection: New Zealand Transverse Mercator (NZTM)</span><br /></font></div><div><font face='Avenir Next W01, Avenir Next W00, Avenir Next, Avenir, Helvetica Neue, Helvetica, Arial, sans-serif' style='font-family:\"Avenir Next W01\", \"Avenir Next W00\", \"Avenir Next\", Avenir, \"Helvetica Neue\", Helvetica, Arial, sans-serif !important; font-size:17px;'><br /></font></div><div><span style='font-style:italic;'><font size='3'><span style='font-weight:bold;'>NB: This layer will be <span style='color:rgb(255, 0, 0);'>deprecated </span>when the official 2023 boundary layers are released.</span></font></span><font face='Avenir Next W01, Avenir Next W00, Avenir Next, Avenir, Helvetica Neue, Helvetica, Arial, sans-serif' style='font-family:\"Avenir Next W01\", \"Avenir Next W00\", \"Avenir Next\", Avenir, \"Helvetica Neue\", Helvetica, Arial, sans-serif !important; font-size:17px;'></font></div><div><div style='font-size:17px; font-family:\"Avenir Next W01\", \"Avenir Next W00\", \"Avenir Next\", Avenir, \"Helvetica Neue\", Helvetica, Arial, sans-serif !important;'><span style='font-style:italic;'><font size='3'><br /></font></span></div><div style='font-family:\"Avenir Next W01\", \"Avenir Next W00\", \"Avenir Next\", Avenir, \"Helvetica Neue\", Helvetica, Arial, sans-serif !important;'><span style='font-style:italic;'><font size='3'>This dataset is the povisional 2023 dataset for Community Board.\n The final 2023 layer is scheduled to be published on 8 December 2022 as\n part of the annual boundary release.</font></span></div><div style='font-family:\"Avenir Next W01\", \"Avenir Next W00\", \"Avenir Next\", Avenir, \"Helvetica Neue\", Helvetica, Arial, sans-serif !important;'><span style='font-style:italic;'><font size='3'><br /></font></span></div><div style='font-family:\"Avenir Next W01\", \"Avenir Next W00\", \"Avenir Next\", Avenir, \"Helvetica Neue\", Helvetica, Arial, sans-serif !important;'><span style='font-style:italic;'><font size='3'>The intention of providing this provisional dataset is to make \navailable the boundaries that will be used for the local body elections \nbeing held in October 2022.</font></span></div><div style='font-family:\"Avenir Next W01\", \"Avenir Next W00\", \"Avenir Next\", Avenir, \"Helvetica Neue\", Helvetica, Arial, sans-serif !important; font-size:17px;'><font size='3'><font face='Avenir Next W01, Avenir Next W00, Avenir Next, Avenir, Helvetica Neue, Helvetica, Arial, sans-serif'><br /></font></font></div><div style='font-family:\"Avenir Next W01\", \"Avenir Next W00\", \"Avenir Next\", Avenir, \"Helvetica Neue\", Helvetica, Arial, sans-serif !important; font-size:17px;'><font size='3'><font face='Avenir Next W01, Avenir Next W00, Avenir Next, Avenir, Helvetica Neue, Helvetica, Arial, sans-serif'>This layer is based on the </font></font><font size='3'><font face='Avenir Next W01, Avenir Next W00, Avenir Next, Avenir, Helvetica Neue, Helvetica, Arial, sans-serif'><font size='3'><font face='Avenir Next W01, Avenir Next W00, Avenir Next, Avenir, Helvetica Neue, Helvetica, Arial, sans-serif'>provisional </font></font></font>set of </font><span style='font-family:\"Avenir Next W01\", \"Avenir Next W00\", \"Avenir Next\", Avenir, \"Helvetica Neue\", sans-serif;'>Ward boundaries</span><font size='3'> for 2023 as defined by the regional councils and Local Government Commission but maintained by Stats NZ (the custodian).</font></div><div style='font-family:\"Avenir Next W01\", \"Avenir Next W00\", \"Avenir Next\", Avenir, \"Helvetica Neue\", Helvetica, Arial, sans-serif !important; font-size:17px;'><font size='3'><br /></font></div><div><font size='3'><font face='Avenir Next W01, Avenir Next W00, Avenir Next, Avenir, Helvetica Neue, Helvetica, Arial, sans-serif'>Wards were originally set up within any territorial authority with a population of at least 20,000. Wards are defined under the Local Electoral Act 2001 and result from dividing a territorial authority for electoral purposes. The ward system was designed to allow for the recognition of communities within a territorial authority and to increase community involvement in the local government system.</font><br /></font></div><div><font size='3'><font face='Avenir Next W01, Avenir Next W00, Avenir Next, Avenir, Helvetica Neue, Helvetica, Arial, sans-serif'><br /></font></font></div><div><font size='3'><font face='Avenir Next W01, Avenir Next W00, Avenir Next, Avenir, Helvetica Neue, Helvetica, Arial, sans-serif'>Territorial authorities can now choose whether they would like to maintain electoral wards. As a result, the number of wards has steadily decreased since they were first created in 1989. Ward boundaries are reviewed in the year before the three-yearly local government elections.</font><br /></font></div><div><font size='3'><font face='Avenir Next W01, Avenir Next W00, Avenir Next, Avenir, Helvetica Neue, Helvetica, Arial, sans-serif'><br /></font></font></div><div><font size='3' style='font-family:\"Avenir Next W01\", \"Avenir Next W00\", \"Avenir Next\", Avenir, \"Helvetica Neue\", Helvetica, Arial, sans-serif;'>This layer shows the </font><font size='3' style='font-family:\"Avenir Next W01\", \"Avenir Next W00\", \"Avenir Next\", Avenir, \"Helvetica Neue\", Helvetica, Arial, sans-serif;'><font size='3'><font face='Avenir Next W01, Avenir Next W00, Avenir Next, Avenir, Helvetica Neue, Helvetica, Arial, sans-serif'>provisional </font></font>data for 2023. If you would like to use the layer that gets updated yearly with the latest boundary data, you can use <a href='https://www.arcgis.com/home/item.html?id=030d32f649c94ab8959215951c03fbca' target='_blank' rel='nofollow ugc noopener noreferrer'>this item</a>.<br /><br />All the boundary layers can be found <a href='https://www.arcgis.com/home/group.html?id=8047736c3e43467aa62241976851eff9' target='_blank' rel='nofollow ugc noopener noreferrer'>here</a>.<br /><br />All the boundary layers that are updated yearly can be found <a href='https://www.arcgis.com/home/group.html?id=b22e4f0012a8426dac21cd3d02f25c67' target='_blank' rel='nofollow ugc noopener noreferrer'>here</a>.<br /><br />The official dataset can be found on<font face='Avenir Next W01, Avenir Next W00, Avenir Next, Avenir, Helvetica Neue, Helvetica, Arial, sans-serif'> </font></font><a href='https://datafinder.stats.govt.nz/data/category/provisional-boundaries/' target='_blank' rel='nofollow ugc noopener noreferrer'>https://datafinder.stats.govt.nz.</a></div><div><div style='font-family:\"Avenir Next W01\", \"Avenir Next W00\", \"Avenir Next\", Avenir, \"Helvetica Neue\", Helvetica, Arial, sans-serif; font-size:17px;'><br /></div></div><div><div style='font-family:\"Avenir Next W01\", \"Avenir Next W00\", \"Avenir Next\", Avenir, \"Helvetica Neue\", Helvetica, Arial, sans-serif; font-size:17px;'><div><font size='3'>This layer contains the following attributes (see data tab):</font></div><div><ul><li><font size='3'>Ward code</font></li><li><font size='3'>Ward name</font></li><li><font size='3'>Total area in square kilometers</font></li><li><font size='3'>Total land area in square kilometers.</font></li></ul><div><font size='3'>The layer is further generalised by Eagle Technology for improved performance on the web, <span style='font-family:\"Avenir Next W01\", \"Avenir Next W00\", \"Avenir Next\", Avenir, \"Helvetica Neue\", sans-serif;'>therefore it doesn't fully represent the official boundaries.</span><br /></font></div></div></div><div style='font-family:\"Avenir Next W01\", \"Avenir Next W00\", \"Avenir Next\", Avenir, \"Helvetica Neue\", Helvetica, Arial, sans-serif; font-size:17px;'><font size='3'><br /></font></div><div style='font-family:\"Avenir Next W01\", \"Avenir Next W00\", \"Avenir Next\", Avenir, \"Helvetica Neue\", Helvetica, Arial, sans-serif; font-size:17px;'><div><font color='#2f4f4f' size='3'>This layer is offered by Eagle Technology (Official Esri Distributor). Eagle Technology offers services that can be used in the ArcGIS platform. The Content team at Eagle Technology updates the layers on a regular basis and regularly adds new content to the Living Atlas. By using this content and combining it with other data you can create new information products quickly and easily.</font></div><div><font color='#2f4f4f' size='3'><br /></font></div><div><font size='3'><font color='#2f4f4f'>If you have any questions or comments about the content, please let us now  at </font><a href='mailto:livingatlas@eagle.co.nz' style='color:rgb(0, 121, 193); text-decoration-line:none;' target='_blank' rel='nofollow ugc noopener noreferrer'>livingatlas@eagle.co.nz</a></font></div></div></div></div></div>",
			"keyword": [
				"eaglegis",
				"mature support",
				"retiring",
				"deprecated"
			],
			"issued": "2022-07-25T09:10:03.000Z",
			"modified": "2022-07-27T00:08:59.741Z",
			"publisher": {
				"name": "Eagle Technology Group Ltd"
			},
			"contactPoint": {
				"@type": "vcard:Contact",
				"fn": "eaglegis",
				"hasEmail": "mailto:ts@eaglegis.co.nz"
			},
			"accessLevel": "public",
			"spatial": "166.2620,-47.2230,-177.6189,-33.7734",
			"license": "https://creativecommons.org/licenses/by/4.0",
			"distribution": [
				{
					"@type": "dcat:Distribution",
					"title": "ArcGIS Hub Dataset",
					"format": "Web Page",
					"mediaType": "text/html",
					"accessURL": "https://www.pacificgeoportal.com/datasets/eaglegis::nz-wards-2023-provisional-mature-support"
				},
				{
					"@type": "dcat:Distribution",
					"title": "ArcGIS GeoService",
					"format": "ArcGIS GeoServices REST API",
					"mediaType": "application/json",
					"accessURL": "https://services.arcgis.com/XTtANUDT8Va4DLwI/arcgis/rest/services/nz_wards_2023/FeatureServer/0"
				},
				{
					"@type": "dcat:Distribution",
					"title": "CSV",
					"format": "CSV",
					"mediaType": "text/csv",
					"accessURL": "https://www.pacificgeoportal.com/api/download/v1/items/1e098a2de87d4f72adbe7f474b6dcb54/csv?layers=0"
				},
				{
					"@type": "dcat:Distribution",
					"title": "Shapefile",
					"format": "ZIP",
					"mediaType": "application/zip",
					"accessURL": "https://www.pacificgeoportal.com/api/download/v1/items/1e098a2de87d4f72adbe7f474b6dcb54/shapefile?layers=0"
				},
				{
					"@type": "dcat:Distribution",
					"title": "GeoJSON",
					"format": "GeoJSON",
					"mediaType": "application/vnd.geo+json",
					"accessURL": "https://www.pacificgeoportal.com/api/download/v1/items/1e098a2de87d4f72adbe7f474b6dcb54/geojson?layers=0"
				},
				{
					"@type": "dcat:Distribution",
					"title": "KML",
					"format": "KML",
					"mediaType": "application/vnd.google-earth.kml+xml",
					"accessURL": "https://www.pacificgeoportal.com/api/download/v1/items/1e098a2de87d4f72adbe7f474b6dcb54/kml?layers=0"
				},
				{
					"@type": "dcat:Distribution",
					"title": "File Geodatabase",
					"format": "ZIP",
					"mediaType": "application/zip",
					"accessURL": "https://www.pacificgeoportal.com/api/download/v1/items/1e098a2de87d4f72adbe7f474b6dcb54/filegdb?layers=0"
				},
				{
					"@type": "dcat:Distribution",
					"title": "Feature Collection",
					"format": "TXT",
					"mediaType": "text/plain",
					"accessURL": "https://www.pacificgeoportal.com/api/download/v1/items/1e098a2de87d4f72adbe7f474b6dcb54/featureCollection?layers=0"
				},
				{
					"@type": "dcat:Distribution",
					"title": "Excel",
					"format": "XLSX",
					"mediaType": "application/vnd.ms-excel",
					"accessURL": "https://www.pacificgeoportal.com/api/download/v1/items/1e098a2de87d4f72adbe7f474b6dcb54/excel?layers=0"
				},
				{
					"@type": "dcat:Distribution",
					"title": "GeoPackage",
					"format": "GPKG",
					"mediaType": "application/geopackage+sqlite3",
					"accessURL": "https://www.pacificgeoportal.com/api/download/v1/items/1e098a2de87d4f72adbe7f474b6dcb54/geoPackage?layers=0"
				},
				{
					"@type": "dcat:Distribution",
					"title": "SQLite Geodatabase",
					"format": "GDB",
					"mediaType": "application/geopackage+sqlite3",
					"accessURL": "https://www.pacificgeoportal.com/api/download/v1/items/1e098a2de87d4f72adbe7f474b6dcb54/sqlite?layers=0"
				}
			],
			"theme": [
				"geospatial"
			]
		},
		{
			"@type": "dcat:Dataset",
			"identifier": "https://www.arcgis.com/home/item.html?id=2c8971ec34ce47bd8ddd212c9a1ef3e3&sublayer=0",
			"landingPage": "https://www.pacificgeoportal.com/datasets/eaglegis::nz-territorial-authorities-and-local-boards-2021-mature-support",
			"title": "NZ Territorial Authorities and Local Boards - 2021 (Mature Support)",
			"description": "<font size='3'><b><span style='color:firebrick;'>Important Note:</span></b><b> This item is in<span style='color:#C00000;'> mature support</span> as of January 2024 and will retire in January 2025.</b><b><span> When you need the most recent boundary layer please use <a href='https://www.arcgis.com/home/item.html?id=c8f6ba6b968c4d31beddfb69abfe3df0' rel='nofollow ugc'>this item</a>. When you need the boundaries for a specific year, please use <a href='https://www.arcgis.com/home/item.html?id=240bca66c4f242c7be1355621c83fd57' rel='nofollow ugc'>this item</a> and set a filter on the required year.</span></b><br /><br /></font><div><br /><div><font size='3' style='font-family:\"Avenir Next W01\", \"Avenir Next W00\", \"Avenir Next\", Avenir, \"Helvetica Neue\", Helvetica, Arial, sans-serif !important;'>Topicality: 01-01-2021</font><br /><font size='3' style='font-family:\"Avenir Next W01\", \"Avenir Next W00\", \"Avenir Next\", Avenir, \"Helvetica Neue\", Helvetica, Arial, sans-serif !important;'><font style='font-family:\"Avenir Next W01\", \"Avenir Next W00\", \"Avenir Next\", Avenir, \"Helvetica Neue\", Helvetica, Arial, sans-serif !important; font-size:17px;'><span style='font-size:17px;'>Projection: New Zealand Transverse Mercator (NZTM)</span></font></font></div><div><font size='3' style='font-family:\"Avenir Next W01\", \"Avenir Next W00\", \"Avenir Next\", Avenir, \"Helvetica Neue\", Helvetica, Arial, sans-serif !important;'><font style='font-family:\"Avenir Next W01\", \"Avenir Next W00\", \"Avenir Next\", Avenir, \"Helvetica Neue\", Helvetica, Arial, sans-serif !important; font-size:17px;'><span style='font-size:17px;'><br /></span></font></font></div><div><div><p><font size='3'>This dataset is a derived version comprising local boards for \nAuckland and territorial authorities for the rest of New Zealand, as \ndefined by the territorial authorities and/or Local Government \nCommission and maintained by Stats NZ(the custodian), clipped to the \ncoastline. This clipped version has been created for map \ncreation/cartographic purposes and so does not fully represent the \nofficial full extent boundaries. This version contains 21 local boards \nin the Auckland Council and 66 territorial authority boundaries for the \nrest New Zealand.  </font></p>\n<font size='3'>For statistical outputs that use territorial authorities to aggregate\n and report data Auckland Council is treated as a single geographic \nentity. This can hide meaningful patterns and trends for a significant \nportion of the population. A solution was to create a new classification\n of territorial authorities that includes the local boards for Auckland.\n The Auckland Council was established in 2010 under the Local Government\n (Tamaki Makaurau Reorganisation) Act 2009. Seven territorial \nauthorities within the Auckland Region were abolished and replaced by \nthe unitary authority Auckland Council. Local boards fall within the \ncommunity board classification</font></div><div><font size='3'><br /></font></div><div><span style='font-family:\"Avenir Next W01\", \"Avenir Next W00\", \"Avenir Next\", Avenir, \"Helvetica Neue\", Helvetica, Arial, sans-serif; font-size:medium;'>This layer shows the data for 2021. If you would like to use the layer that gets updated yearly with the latest boundary data, you can use <a href='https://www.arcgis.com/home/item.html?id=c8f6ba6b968c4d31beddfb69abfe3df0' target='_blank' rel='nofollow ugc noopener noreferrer'>this item</a>.<br /><br />All the boundary layers can be found <a href='https://www.arcgis.com/home/group.html?id=8047736c3e43467aa62241976851eff9' target='_blank' rel='nofollow ugc noopener noreferrer'>here</a>.<br /><br />All the boundary layers that are updated yearly can be found <a href='https://www.arcgis.com/home/group.html?id=b22e4f0012a8426dac21cd3d02f25c67' target='_blank' rel='nofollow ugc noopener noreferrer'>here</a>.<br /><br />The official dataset can be found on</span><font size='3'> </font><a href='https://datafinder.stats.govt.nz/data/category/annual-boundaries/2021/' target='_blank' rel='nofollow ugc noopener noreferrer'>https://datafinder.stats.govt.nz</a>.</div><div><font size='3'><br /></font></div><div><font size='3'><span style='font-family:\"Avenir Next W01\", \"Avenir Next W00\", \"Avenir Next\", Avenir, \"Helvetica Neue\", Helvetica, Arial, sans-serif;'> The layer is further \ngeneralised by Eagle Technology for improved performance on the web, </span><span style='font-family:\"Avenir Next W01\", \"Avenir Next W00\", \"Avenir Next\", Avenir, \"Helvetica Neue\", sans-serif;'>therefore it doesn't fully represent the official boundaries.</span><br /></font></div><div style='font-family:\"Avenir Next W01\", \"Avenir Next W00\", \"Avenir Next\", Avenir, \"Helvetica Neue\", Helvetica, Arial, sans-serif !important;'><font size='3'><br /></font></div><div><div style='font-family:\"Avenir Next W01\", \"Avenir Next W00\", \"Avenir Next\", Avenir, \"Helvetica Neue\", Helvetica, Arial, sans-serif !important;'><font color='#2f4f4f' size='3'>This\n layer is offered by Eagle Technology (Official Esri Distributor). Eagle\n Technology offers services that can be used in the ArcGIS platform. The\n Content team at Eagle Technology updates the layers on a regular basis \nand regularly adds new content to the Living Atlas. By using this \ncontent and combining it with other data you can create new information \nproducts quickly and easily.</font></div><div style='font-family:\"Avenir Next W01\", \"Avenir Next W00\", \"Avenir Next\", Avenir, \"Helvetica Neue\", Helvetica, Arial, sans-serif !important;'><font color='#2f4f4f' size='3'><br /></font></div><div style='font-family:\"Avenir Next W01\", \"Avenir Next W00\", \"Avenir Next\", Avenir, \"Helvetica Neue\", Helvetica, Arial, sans-serif !important;'><font size='3'><font color='#2f4f4f'>If you have any questions or comments about the content, please let us now  at </font><a href='mailto:livingatlas@eagle.co.nz' style='color:rgb(0, 121, 193); text-decoration-line:none;' target='_blank' rel='nofollow ugc noopener noreferrer'>livingatlas@eagle.co.nz</a></font></div></div></div></div>",
			"keyword": [
				"eaglegis",
				"mature support",
				"retiring",
				"deprecated"
			],
			"issued": "2021-02-04T02:23:37.000Z",
			"modified": "2021-02-15T23:04:27.397Z",
			"publisher": {
				"name": "Eagle Technology Group Ltd"
			},
			"contactPoint": {
				"@type": "vcard:Contact",
				"fn": "eaglegis",
				"hasEmail": "mailto:ts@eaglegis.co.nz"
			},
			"accessLevel": "public",
			"spatial": "166.2620,-47.2230,-177.6189,-33.7734",
			"license": "https://creativecommons.org/licenses/by/4.0",
			"distribution": [
				{
					"@type": "dcat:Distribution",
					"title": "ArcGIS Hub Dataset",
					"format": "Web Page",
					"mediaType": "text/html",
					"accessURL": "https://www.pacificgeoportal.com/datasets/eaglegis::nz-territorial-authorities-and-local-boards-2021-mature-support"
				},
				{
					"@type": "dcat:Distribution",
					"title": "ArcGIS GeoService",
					"format": "ArcGIS GeoServices REST API",
					"mediaType": "application/json",
					"accessURL": "https://services.arcgis.com/XTtANUDT8Va4DLwI/arcgis/rest/services/nz_territorial_authorities_and_local_boards_2021/FeatureServer/0"
				},
				{
					"@type": "dcat:Distribution",
					"title": "CSV",
					"format": "CSV",
					"mediaType": "text/csv",
					"accessURL": "https://www.pacificgeoportal.com/api/download/v1/items/2c8971ec34ce47bd8ddd212c9a1ef3e3/csv?layers=0"
				},
				{
					"@type": "dcat:Distribution",
					"title": "Shapefile",
					"format": "ZIP",
					"mediaType": "application/zip",
					"accessURL": "https://www.pacificgeoportal.com/api/download/v1/items/2c8971ec34ce47bd8ddd212c9a1ef3e3/shapefile?layers=0"
				},
				{
					"@type": "dcat:Distribution",
					"title": "GeoJSON",
					"format": "GeoJSON",
					"mediaType": "application/vnd.geo+json",
					"accessURL": "https://www.pacificgeoportal.com/api/download/v1/items/2c8971ec34ce47bd8ddd212c9a1ef3e3/geojson?layers=0"
				},
				{
					"@type": "dcat:Distribution",
					"title": "KML",
					"format": "KML",
					"mediaType": "application/vnd.google-earth.kml+xml",
					"accessURL": "https://www.pacificgeoportal.com/api/download/v1/items/2c8971ec34ce47bd8ddd212c9a1ef3e3/kml?layers=0"
				},
				{
					"@type": "dcat:Distribution",
					"title": "File Geodatabase",
					"format": "ZIP",
					"mediaType": "application/zip",
					"accessURL": "https://www.pacificgeoportal.com/api/download/v1/items/2c8971ec34ce47bd8ddd212c9a1ef3e3/filegdb?layers=0"
				},
				{
					"@type": "dcat:Distribution",
					"title": "Feature Collection",
					"format": "TXT",
					"mediaType": "text/plain",
					"accessURL": "https://www.pacificgeoportal.com/api/download/v1/items/2c8971ec34ce47bd8ddd212c9a1ef3e3/featureCollection?layers=0"
				},
				{
					"@type": "dcat:Distribution",
					"title": "Excel",
					"format": "XLSX",
					"mediaType": "application/vnd.ms-excel",
					"accessURL": "https://www.pacificgeoportal.com/api/download/v1/items/2c8971ec34ce47bd8ddd212c9a1ef3e3/excel?layers=0"
				},
				{
					"@type": "dcat:Distribution",
					"title": "GeoPackage",
					"format": "GPKG",
					"mediaType": "application/geopackage+sqlite3",
					"accessURL": "https://www.pacificgeoportal.com/api/download/v1/items/2c8971ec34ce47bd8ddd212c9a1ef3e3/geoPackage?layers=0"
				},
				{
					"@type": "dcat:Distribution",
					"title": "SQLite Geodatabase",
					"format": "GDB",
					"mediaType": "application/geopackage+sqlite3",
					"accessURL": "https://www.pacificgeoportal.com/api/download/v1/items/2c8971ec34ce47bd8ddd212c9a1ef3e3/sqlite?layers=0"
				}
			],
			"theme": [
				"geospatial"
			]
		},
		{
			"@type": "dcat:Dataset",
			"identifier": "https://www.arcgis.com/home/item.html?id=0cfe3482ff5b486ba08d6a6198523190&sublayer=0",
			"landingPage": "https://www.pacificgeoportal.com/datasets/eaglegis::nz-territorial-authority-and-local-boards-boundaries-2020-mature-support",
			"title": "NZ Territorial Authority and Local Boards boundaries 2020 (Mature Support)",
			"description": "<font size='3'><b><span style='color:firebrick;'>Important Note:</span></b><b> This item is in<span style='color:#C00000;'> mature support</span> as of January 2024 and will retire in January 2025.</b><b><span> When you need the most recent boundary layer please use <a href='https://www.arcgis.com/home/item.html?id=c8f6ba6b968c4d31beddfb69abfe3df0' rel='nofollow ugc'>this item</a>. When you need the boundaries for a specific year, please use <a href='https://www.arcgis.com/home/item.html?id=240bca66c4f242c7be1355621c83fd57' rel='nofollow ugc'>this item</a> and set a filter on the required year.</span></b><br /><br /></font><div><br /><div><font size='3' style='font-family:\"Avenir Next W01\", \"Avenir Next W00\", \"Avenir Next\", Avenir, \"Helvetica Neue\", Helvetica, Arial, sans-serif !important;'>Topicality: 01-01-2020</font><br /><font size='3' style='font-family:\"Avenir Next W01\", \"Avenir Next W00\", \"Avenir Next\", Avenir, \"Helvetica Neue\", Helvetica, Arial, sans-serif !important;'><font style='font-family:\"Avenir Next W01\", \"Avenir Next W00\", \"Avenir Next\", Avenir, \"Helvetica Neue\", Helvetica, Arial, sans-serif !important; font-size:17px;'><span style='font-size:17px;'>Projection: New Zealand Transverse Mercator (NZTM)</span></font></font></div><div><font size='3' style='font-family:\"Avenir Next W01\", \"Avenir Next W00\", \"Avenir Next\", Avenir, \"Helvetica Neue\", Helvetica, Arial, sans-serif !important;'><font style='font-family:\"Avenir Next W01\", \"Avenir Next W00\", \"Avenir Next\", Avenir, \"Helvetica Neue\", Helvetica, Arial, sans-serif !important; font-size:17px;'><span style='font-size:17px;'><br /></span></font></font></div><div><div><p><font size='3'>This dataset is a derived version comprising local boards for \nAuckland and territorial authorities for the rest of New Zealand, as \ndefined by the territorial authorities and/or Local Government \nCommission and maintained by Stats NZ(the custodian), clipped to the \ncoastline. This clipped version has been created for map \ncreation/cartographic purposes and so does not fully represent the \nofficial full extent boundaries. This version contains 21 local boards \nin the Auckland Council and 66 territorial authority boundaries for the \nrest New Zealand.  </font></p>\n<font size='3'>For statistical outputs that use territorial authorities to aggregate\n and report data Auckland Council is treated as a single geographic \nentity. This can hide meaningful patterns and trends for a significant \nportion of the population. A solution was to create a new classification\n of territorial authorities that includes the local boards for Auckland.\n The Auckland Council was established in 2010 under the Local Government\n (Tamaki Makaurau Reorganisation) Act 2009. Seven territorial \nauthorities within the Auckland Region were abolished and replaced by \nthe unitary authority Auckland Council. Local boards fall within the \ncommunity board classification</font></div><div><font size='3'><br /></font></div><div><span style='font-family:\"Avenir Next W01\", \"Avenir Next W00\", \"Avenir Next\", Avenir, \"Helvetica Neue\", Helvetica, Arial, sans-serif; font-size:medium;'>The official dataset can be found on</span><font size='3'> </font><a href='https://datafinder.stats.govt.nz/data/category/annual-boundaries/2020/' target='_blank' rel='nofollow ugc noopener noreferrer'>https://datafinder.stats.govt.nz</a>.</div><div><font size='3'><br /></font></div><div><font size='3'><span style='font-family:\"Avenir Next W01\", \"Avenir Next W00\", \"Avenir Next\", Avenir, \"Helvetica Neue\", Helvetica, Arial, sans-serif;'> The layer is further \ngeneralised by Eagle Technology for improved performance on the web, </span><span style='font-family:\"Avenir Next W01\", \"Avenir Next W00\", \"Avenir Next\", Avenir, \"Helvetica Neue\", sans-serif;'>therefore it doesn't fully represent the official boundaries.</span><br /></font></div><div style='font-family:\"Avenir Next W01\", \"Avenir Next W00\", \"Avenir Next\", Avenir, \"Helvetica Neue\", Helvetica, Arial, sans-serif !important;'><font size='3'><br /></font></div><div><div style='font-family:\"Avenir Next W01\", \"Avenir Next W00\", \"Avenir Next\", Avenir, \"Helvetica Neue\", Helvetica, Arial, sans-serif !important;'><font color='#2f4f4f' size='3'>This\n layer is offered by Eagle Technology (Official Esri Distributor). Eagle\n Technology offers services that can be used in the ArcGIS platform. The\n Content team at Eagle Technology updates the layers on a regular basis \nand regularly adds new content to the Living Atlas. By using this \ncontent and combining it with other data you can create new information \nproducts quickly and easily.</font></div><div style='font-family:\"Avenir Next W01\", \"Avenir Next W00\", \"Avenir Next\", Avenir, \"Helvetica Neue\", Helvetica, Arial, sans-serif !important;'><font color='#2f4f4f' size='3'><br /></font></div><div style='font-family:\"Avenir Next W01\", \"Avenir Next W00\", \"Avenir Next\", Avenir, \"Helvetica Neue\", Helvetica, Arial, sans-serif !important;'><font size='3'><font color='#2f4f4f'>If you have any questions or comments about the content, please let us now  at </font><a href='mailto:livingatlas@eagle.co.nz' style='color:rgb(0, 121, 193); text-decoration-line:none;' target='_blank' rel='nofollow ugc noopener noreferrer'>livingatlas@eagle.co.nz</a></font></div></div></div></div>",
			"keyword": [
				"eaglegis",
				"mature support",
				"retiring",
				"deprecated"
			],
			"issued": "2020-01-11T10:24:08.000Z",
			"modified": "2023-11-18T01:58:31.801Z",
			"publisher": {
				"name": "Eagle Technology Group Ltd"
			},
			"contactPoint": {
				"@type": "vcard:Contact",
				"fn": "eaglegis",
				"hasEmail": "mailto:ts@eaglegis.co.nz"
			},
			"accessLevel": "public",
			"spatial": "166.2620,-47.2230,-177.6190,-33.7734",
			"license": "https://creativecommons.org/licenses/by/4.0",
			"distribution": [
				{
					"@type": "dcat:Distribution",
					"title": "ArcGIS Hub Dataset",
					"format": "Web Page",
					"mediaType": "text/html",
					"accessURL": "https://www.pacificgeoportal.com/datasets/eaglegis::nz-territorial-authority-and-local-boards-boundaries-2020-mature-support"
				},
				{
					"@type": "dcat:Distribution",
					"title": "ArcGIS GeoService",
					"format": "ArcGIS GeoServices REST API",
					"mediaType": "application/json",
					"accessURL": "https://services.arcgis.com/XTtANUDT8Va4DLwI/arcgis/rest/services/Territorial_Authority_Local_Board_2020_Clipped_generalised/FeatureServer/0"
				},
				{
					"@type": "dcat:Distribution",
					"title": "CSV",
					"format": "CSV",
					"mediaType": "text/csv",
					"accessURL": "https://www.pacificgeoportal.com/api/download/v1/items/0cfe3482ff5b486ba08d6a6198523190/csv?layers=0"
				},
				{
					"@type": "dcat:Distribution",
					"title": "Shapefile",
					"format": "ZIP",
					"mediaType": "application/zip",
					"accessURL": "https://www.pacificgeoportal.com/api/download/v1/items/0cfe3482ff5b486ba08d6a6198523190/shapefile?layers=0"
				},
				{
					"@type": "dcat:Distribution",
					"title": "GeoJSON",
					"format": "GeoJSON",
					"mediaType": "application/vnd.geo+json",
					"accessURL": "https://www.pacificgeoportal.com/api/download/v1/items/0cfe3482ff5b486ba08d6a6198523190/geojson?layers=0"
				},
				{
					"@type": "dcat:Distribution",
					"title": "KML",
					"format": "KML",
					"mediaType": "application/vnd.google-earth.kml+xml",
					"accessURL": "https://www.pacificgeoportal.com/api/download/v1/items/0cfe3482ff5b486ba08d6a6198523190/kml?layers=0"
				},
				{
					"@type": "dcat:Distribution",
					"title": "File Geodatabase",
					"format": "ZIP",
					"mediaType": "application/zip",
					"accessURL": "https://www.pacificgeoportal.com/api/download/v1/items/0cfe3482ff5b486ba08d6a6198523190/filegdb?layers=0"
				},
				{
					"@type": "dcat:Distribution",
					"title": "Feature Collection",
					"format": "TXT",
					"mediaType": "text/plain",
					"accessURL": "https://www.pacificgeoportal.com/api/download/v1/items/0cfe3482ff5b486ba08d6a6198523190/featureCollection?layers=0"
				},
				{
					"@type": "dcat:Distribution",
					"title": "Excel",
					"format": "XLSX",
					"mediaType": "application/vnd.ms-excel",
					"accessURL": "https://www.pacificgeoportal.com/api/download/v1/items/0cfe3482ff5b486ba08d6a6198523190/excel?layers=0"
				},
				{
					"@type": "dcat:Distribution",
					"title": "GeoPackage",
					"format": "GPKG",
					"mediaType": "application/geopackage+sqlite3",
					"accessURL": "https://www.pacificgeoportal.com/api/download/v1/items/0cfe3482ff5b486ba08d6a6198523190/geoPackage?layers=0"
				},
				{
					"@type": "dcat:Distribution",
					"title": "SQLite Geodatabase",
					"format": "GDB",
					"mediaType": "application/geopackage+sqlite3",
					"accessURL": "https://www.pacificgeoportal.com/api/download/v1/items/0cfe3482ff5b486ba08d6a6198523190/sqlite?layers=0"
				}
			],
			"theme": [
				"geospatial"
			]
		},
		{
			"@type": "dcat:Dataset",
			"identifier": "https://www.arcgis.com/home/item.html?id=60f32cfb5dc94414b708949897d53bda&sublayer=0",
			"landingPage": "https://www.pacificgeoportal.com/datasets/eaglegis::nz-māori-wards-2021-mature-support",
			"title": "NZ Māori Wards - 2021 (Mature Support)",
			"description": "<font size='3'><b><span style='color:firebrick;'>Important Note:</span></b><b> This item is in<span style='color:#C00000;'> mature support</span> as of January 2024 and will retire in January 2025.</b><b><span> When you need the most recent boundary layer please use <a href='https://www.arcgis.com/home/item.html?id=dc1888b123da42b19f09d96608fc3b0e' rel='nofollow ugc'>this item</a>. When you need the boundaries for a specific year, please use <a href='https://www.arcgis.com/home/item.html?id=5e95349d27754b21b3068b713df63173' rel='nofollow ugc'>this item</a> and set a filter on the required year.</span></b><br /><br /></font><div><br /><div><font size='3' style='font-family:\"Avenir Next W01\", \"Avenir Next W00\", \"Avenir Next\", Avenir, \"Helvetica Neue\", Helvetica, Arial, sans-serif !important;'>Topicality: 01-01-2021</font></div><div><font style='font-family:\"Avenir Next W01\", \"Avenir Next W00\", \"Avenir Next\", Avenir, \"Helvetica Neue\", Helvetica, Arial, sans-serif !important; font-size:17px;'><span style='font-size:17px;'>Projection: New Zealand Transverse Mercator (NZTM)</span></font></div><div style='font-family:\"Avenir Next W01\", \"Avenir Next W00\", \"Avenir Next\", Avenir, \"Helvetica Neue\", Helvetica, Arial, sans-serif !important; font-size:17px;'><font size='3'><br /></font></div><div style='font-family:\"Avenir Next W01\", \"Avenir Next W00\", \"Avenir Next\", Avenir, \"Helvetica Neue\", Helvetica, Arial, sans-serif !important; font-size:17px;'><font size='3'><font>This layer is based on the </font>definitive set of </font><span>Māori </span><span style='font-family:\"Avenir Next W01\", \"Avenir Next W00\", \"Avenir Next\", Avenir, \"Helvetica Neue\", sans-serif;'>Ward boundaries</span><font size='3'> for 2021 as defined by the regional councils and Local Government Commission but maintained by Stats NZ (the custodian).</font></div><div style='font-family:\"Avenir Next W01\", \"Avenir Next W00\", \"Avenir Next\", Avenir, \"Helvetica Neue\", Helvetica, Arial, sans-serif !important; font-size:17px;'><font size='3'><br /></font></div><div style='font-family:\"Avenir Next W01\", \"Avenir Next W00\", \"Avenir Next\", Avenir, \"Helvetica Neue\", Helvetica, Arial, sans-serif !important; font-size:17px;'>The Local Electoral Act 2001 provides that Māori wards may be \nestablished in territorial authorities. The statutory provisions for \nestablishing Māori wards are set out in sections 19Z to 19ZH of the \nLocal Electoral Act 2001. The first Māori ward was established by \nrepresentation review in 2019 and appears in the 2021 geographic \nboundaries released by Stats NZ. The first Māori ward to be created is \nWairoa Māori ward (02901) in the Wairoa District. Māori ward boundaries \nare defined at meshblock level. <br /></div><div style='font-family:\"Avenir Next W01\", \"Avenir Next W00\", \"Avenir Next\", Avenir, \"Helvetica Neue\", Helvetica, Arial, sans-serif !important; font-size:17px;'><br /></div><div style='font-family:\"Avenir Next W01\", \"Avenir Next W00\", \"Avenir Next\", Avenir, \"Helvetica Neue\", Helvetica, Arial, sans-serif !important; font-size:17px;'><div style=''><font size='3' style='font-family:\"Avenir Next W01\", \"Avenir Next W00\", \"Avenir Next\", Avenir, \"Helvetica Neue\", Helvetica, Arial, sans-serif;'>This layer shows the data for 2021. If you would like to use the layer that gets updated yearly with the latest boundary data, you can use <a href='https://www.arcgis.com/home/item.html?id=dc1888b123da42b19f09d96608fc3b0e' target='_blank' rel='nofollow ugc noopener noreferrer'>this item</a>.<br /><br />All the boundary layers can be found <a href='https://www.arcgis.com/home/group.html?id=8047736c3e43467aa62241976851eff9' target='_blank' rel='nofollow ugc noopener noreferrer'>here</a>.<br /><br />All the boundary layers that are updated yearly can be found <a href='https://www.arcgis.com/home/group.html?id=b22e4f0012a8426dac21cd3d02f25c67' target='_blank' rel='nofollow ugc noopener noreferrer'>here</a>.<br /><br />The official dataset can be found on<font> </font></font><a href='https://datafinder.stats.govt.nz/data/category/annual-boundaries/2021/' target='_blank' rel='nofollow ugc noopener noreferrer'>https://datafinder.stats.govt.nz.</a><br /></div><div style=''><div style='font-family:\"Avenir Next W01\", \"Avenir Next W00\", \"Avenir Next\", Avenir, \"Helvetica Neue\", Helvetica, Arial, sans-serif; font-size:17px;'><br /></div></div><div style=''><div style='font-family:\"Avenir Next W01\", \"Avenir Next W00\", \"Avenir Next\", Avenir, \"Helvetica Neue\", Helvetica, Arial, sans-serif; font-size:17px;'><div><font size='3'>This layer contains the following attributes (see data tab):</font></div><div><ul><li><font size='3'>Maori Ward code</font></li><li><font size='3'>Maori Ward name</font></li><li><font size='3'>Total area in square kilometers</font></li><li><font size='3'>Total land area in square kilometers.</font></li></ul><div><font size='3'>The layer is further generalised by Eagle Technology for improved performance on the web, <span style='font-family:\"Avenir Next W01\", \"Avenir Next W00\", \"Avenir Next\", Avenir, \"Helvetica Neue\", sans-serif;'>therefore it doesn't fully represent the official boundaries.</span><br /></font></div></div></div><div style='font-family:\"Avenir Next W01\", \"Avenir Next W00\", \"Avenir Next\", Avenir, \"Helvetica Neue\", Helvetica, Arial, sans-serif; font-size:17px;'><font size='3'><br /></font></div><div style='font-family:\"Avenir Next W01\", \"Avenir Next W00\", \"Avenir Next\", Avenir, \"Helvetica Neue\", Helvetica, Arial, sans-serif; font-size:17px;'><div><font color='#2f4f4f' size='3'>This\n layer is offered by Eagle Technology (Official Esri Distributor). Eagle\n Technology offers services that can be used in the ArcGIS platform. The\n Content team at Eagle Technology updates the layers on a regular basis \nand regularly adds new content to the Living Atlas. By using this \ncontent and combining it with other data you can create new information \nproducts quickly and easily.</font></div><div><font color='#2f4f4f' size='3'><br /></font></div><div><font size='3'><font color='#2f4f4f'>If you have any questions or comments about the content, please let us now  at </font><a href='mailto:livingatlas@eagle.co.nz' style='color:rgb(0, 121, 193); text-decoration-line:none;' target='_blank' rel='nofollow ugc noopener noreferrer'>livingatlas@eagle.co.nz</a></font></div></div></div></div></div>",
			"keyword": [
				"eaglegis",
				"mature support",
				"retiring",
				"deprecated"
			],
			"issued": "2021-02-04T02:23:12.000Z",
			"modified": "2021-02-15T23:04:15.134Z",
			"publisher": {
				"name": "Eagle Technology Group Ltd"
			},
			"contactPoint": {
				"@type": "vcard:Contact",
				"fn": "eaglegis",
				"hasEmail": "mailto:ts@eaglegis.co.nz"
			},
			"accessLevel": "public",
			"spatial": "166.2620,-47.2230,-177.6189,-33.7734",
			"license": "https://creativecommons.org/licenses/by/4.0",
			"distribution": [
				{
					"@type": "dcat:Distribution",
					"title": "ArcGIS Hub Dataset",
					"format": "Web Page",
					"mediaType": "text/html",
					"accessURL": "https://www.pacificgeoportal.com/datasets/eaglegis::nz-māori-wards-2021-mature-support"
				},
				{
					"@type": "dcat:Distribution",
					"title": "ArcGIS GeoService",
					"format": "ArcGIS GeoServices REST API",
					"mediaType": "application/json",
					"accessURL": "https://services.arcgis.com/XTtANUDT8Va4DLwI/arcgis/rest/services/nz_maori_wards_2021/FeatureServer/0"
				},
				{
					"@type": "dcat:Distribution",
					"title": "CSV",
					"format": "CSV",
					"mediaType": "text/csv",
					"accessURL": "https://www.pacificgeoportal.com/api/download/v1/items/60f32cfb5dc94414b708949897d53bda/csv?layers=0"
				},
				{
					"@type": "dcat:Distribution",
					"title": "Shapefile",
					"format": "ZIP",
					"mediaType": "application/zip",
					"accessURL": "https://www.pacificgeoportal.com/api/download/v1/items/60f32cfb5dc94414b708949897d53bda/shapefile?layers=0"
				},
				{
					"@type": "dcat:Distribution",
					"title": "GeoJSON",
					"format": "GeoJSON",
					"mediaType": "application/vnd.geo+json",
					"accessURL": "https://www.pacificgeoportal.com/api/download/v1/items/60f32cfb5dc94414b708949897d53bda/geojson?layers=0"
				},
				{
					"@type": "dcat:Distribution",
					"title": "KML",
					"format": "KML",
					"mediaType": "application/vnd.google-earth.kml+xml",
					"accessURL": "https://www.pacificgeoportal.com/api/download/v1/items/60f32cfb5dc94414b708949897d53bda/kml?layers=0"
				},
				{
					"@type": "dcat:Distribution",
					"title": "File Geodatabase",
					"format": "ZIP",
					"mediaType": "application/zip",
					"accessURL": "https://www.pacificgeoportal.com/api/download/v1/items/60f32cfb5dc94414b708949897d53bda/filegdb?layers=0"
				},
				{
					"@type": "dcat:Distribution",
					"title": "Feature Collection",
					"format": "TXT",
					"mediaType": "text/plain",
					"accessURL": "https://www.pacificgeoportal.com/api/download/v1/items/60f32cfb5dc94414b708949897d53bda/featureCollection?layers=0"
				},
				{
					"@type": "dcat:Distribution",
					"title": "Excel",
					"format": "XLSX",
					"mediaType": "application/vnd.ms-excel",
					"accessURL": "https://www.pacificgeoportal.com/api/download/v1/items/60f32cfb5dc94414b708949897d53bda/excel?layers=0"
				},
				{
					"@type": "dcat:Distribution",
					"title": "GeoPackage",
					"format": "GPKG",
					"mediaType": "application/geopackage+sqlite3",
					"accessURL": "https://www.pacificgeoportal.com/api/download/v1/items/60f32cfb5dc94414b708949897d53bda/geoPackage?layers=0"
				},
				{
					"@type": "dcat:Distribution",
					"title": "SQLite Geodatabase",
					"format": "GDB",
					"mediaType": "application/geopackage+sqlite3",
					"accessURL": "https://www.pacificgeoportal.com/api/download/v1/items/60f32cfb5dc94414b708949897d53bda/sqlite?layers=0"
				}
			],
			"theme": [
				"geospatial"
			]
		},
		{
			"@type": "dcat:Dataset",
			"identifier": "https://www.arcgis.com/home/item.html?id=6bd49ffc9e2c4ef393e26d6bbf55bb21&sublayer=0",
			"landingPage": "https://www.pacificgeoportal.com/datasets/eaglegis::nz-māori-ward-boundaries-2020-mature-support",
			"title": "NZ Māori Ward boundaries 2020 (Mature Support)",
			"description": "<font size='3'><b><span style='color:firebrick;'>Important Note:</span></b><b> This item is in<span style='color:#C00000;'> mature support</span> as of January 2024 and will retire in January 2025.</b><b><span> When you need the most recent boundary layer please use <a href='https://www.arcgis.com/home/item.html?id=dc1888b123da42b19f09d96608fc3b0e' rel='nofollow ugc'>this item</a>. When you need the boundaries for a specific year, please use <a href='https://www.arcgis.com/home/item.html?id=5e95349d27754b21b3068b713df63173' rel='nofollow ugc'>this item</a> and set a filter on the required year.</span></b><br /><br /></font><div><br /><div><font size='3' style='font-family:\"Avenir Next W01\", \"Avenir Next W00\", \"Avenir Next\", Avenir, \"Helvetica Neue\", Helvetica, Arial, sans-serif !important;'>Topicality: 01-01-2020</font></div><div><font style='font-family:\"Avenir Next W01\", \"Avenir Next W00\", \"Avenir Next\", Avenir, \"Helvetica Neue\", Helvetica, Arial, sans-serif !important; font-size:17px;'><span style='font-size:17px;'>Projection: New Zealand Transverse Mercator (NZTM)</span></font></div><div style='font-family:\"Avenir Next W01\", \"Avenir Next W00\", \"Avenir Next\", Avenir, \"Helvetica Neue\", Helvetica, Arial, sans-serif !important; font-size:17px;'><font size='3'><br /></font></div><div style='font-family:\"Avenir Next W01\", \"Avenir Next W00\", \"Avenir Next\", Avenir, \"Helvetica Neue\", Helvetica, Arial, sans-serif !important; font-size:17px;'><font size='3'><font>This layer is based on the </font>definitive set of </font><span>Māori </span><span style='font-family:\"Avenir Next W01\", \"Avenir Next W00\", \"Avenir Next\", Avenir, \"Helvetica Neue\", sans-serif;'>Ward boundaries</span><font size='3'> for 2020 as defined by the regional councils and Local Government Commission but maintained by Stats NZ (the custodian).</font></div><div style='font-family:\"Avenir Next W01\", \"Avenir Next W00\", \"Avenir Next\", Avenir, \"Helvetica Neue\", Helvetica, Arial, sans-serif !important; font-size:17px;'><font size='3'><br /></font></div><div style='font-family:\"Avenir Next W01\", \"Avenir Next W00\", \"Avenir Next\", Avenir, \"Helvetica Neue\", Helvetica, Arial, sans-serif !important; font-size:17px;'>The Local Electoral Act 2001 provides that Māori wards may be \nestablished in territorial authorities. The statutory provisions for \nestablishing Māori wards are set out in sections 19Z to 19ZH of the \nLocal Electoral Act 2001. The first Māori ward was established by \nrepresentation review in 2019 and appears in the 2020 geographic \nboundaries released by Stats NZ. The first Māori ward to be created is \nWairoa Māori ward (02901) in the Wairoa District. Māori ward boundaries \nare defined at meshblock level. <br /></div><div style='font-family:\"Avenir Next W01\", \"Avenir Next W00\", \"Avenir Next\", Avenir, \"Helvetica Neue\", Helvetica, Arial, sans-serif !important; font-size:17px;'><br /></div><div style='font-family:\"Avenir Next W01\", \"Avenir Next W00\", \"Avenir Next\", Avenir, \"Helvetica Neue\", Helvetica, Arial, sans-serif !important; font-size:17px;'><div style=''><font size='3' style='font-family:\"Avenir Next W01\", \"Avenir Next W00\", \"Avenir Next\", Avenir, \"Helvetica Neue\", Helvetica, Arial, sans-serif;'>The official dataset can be found on<font> </font></font><a href='https://datafinder.stats.govt.nz/data/category/annual-boundaries/2020/' target='_blank' rel='nofollow ugc noopener noreferrer'>https://datafinder.stats.govt.nz.</a><br /></div><div style=''><div style='font-family:\"Avenir Next W01\", \"Avenir Next W00\", \"Avenir Next\", Avenir, \"Helvetica Neue\", Helvetica, Arial, sans-serif; font-size:17px;'><br /></div></div><div style=''><div style='font-family:\"Avenir Next W01\", \"Avenir Next W00\", \"Avenir Next\", Avenir, \"Helvetica Neue\", Helvetica, Arial, sans-serif; font-size:17px;'><div><font size='3'>This layer contains the following attributes (see data tab):</font></div><div><ul><li><font size='3'>Maori Ward code</font></li><li><font size='3'>Maori Ward name</font></li><li><font size='3'>Total area in square kilometers</font></li><li><font size='3'>Total land area in square kilometers.</font></li></ul><div><font size='3'>The layer is further generalised by Eagle Technology for improved performance on the web, <span style='font-family:\"Avenir Next W01\", \"Avenir Next W00\", \"Avenir Next\", Avenir, \"Helvetica Neue\", sans-serif;'>therefore it doesn't fully represent the official boundaries.</span><br /></font></div></div></div><div style='font-family:\"Avenir Next W01\", \"Avenir Next W00\", \"Avenir Next\", Avenir, \"Helvetica Neue\", Helvetica, Arial, sans-serif; font-size:17px;'><font size='3'><br /></font></div><div style='font-family:\"Avenir Next W01\", \"Avenir Next W00\", \"Avenir Next\", Avenir, \"Helvetica Neue\", Helvetica, Arial, sans-serif; font-size:17px;'><div><font color='#2f4f4f' size='3'>This\n layer is offered by Eagle Technology (Official Esri Distributor). Eagle\n Technology offers services that can be used in the ArcGIS platform. The\n Content team at Eagle Technology updates the layers on a regular basis \nand regularly adds new content to the Living Atlas. By using this \ncontent and combining it with other data you can create new information \nproducts quickly and easily.</font></div><div><font color='#2f4f4f' size='3'><br /></font></div><div><font size='3'><font color='#2f4f4f'>If you have any questions or comments about the content, please let us now  at </font><a href='mailto:livingatlas@eagle.co.nz' style='color:rgb(0, 121, 193); text-decoration-line:none;' target='_blank' rel='nofollow ugc noopener noreferrer'>livingatlas@eagle.co.nz</a></font></div></div></div></div></div>",
			"keyword": [
				"eaglegis",
				"mature support",
				"retiring",
				"deprecated"
			],
			"issued": "2020-01-11T10:23:35.000Z",
			"modified": "2021-02-10T03:52:53.535Z",
			"publisher": {
				"name": "Eagle Technology Group Ltd"
			},
			"contactPoint": {
				"@type": "vcard:Contact",
				"fn": "eaglegis",
				"hasEmail": "mailto:ts@eaglegis.co.nz"
			},
			"accessLevel": "public",
			"spatial": "166.2620,-47.2230,-177.6190,-33.7734",
			"license": "https://creativecommons.org/licenses/by/4.0",
			"distribution": [
				{
					"@type": "dcat:Distribution",
					"title": "ArcGIS Hub Dataset",
					"format": "Web Page",
					"mediaType": "text/html",
					"accessURL": "https://www.pacificgeoportal.com/datasets/eaglegis::nz-māori-ward-boundaries-2020-mature-support"
				},
				{
					"@type": "dcat:Distribution",
					"title": "ArcGIS GeoService",
					"format": "ArcGIS GeoServices REST API",
					"mediaType": "application/json",
					"accessURL": "https://services.arcgis.com/XTtANUDT8Va4DLwI/arcgis/rest/services/Maori_Ward_2020_Clipped_generalised/FeatureServer/0"
				},
				{
					"@type": "dcat:Distribution",
					"title": "CSV",
					"format": "CSV",
					"mediaType": "text/csv",
					"accessURL": "https://www.pacificgeoportal.com/api/download/v1/items/6bd49ffc9e2c4ef393e26d6bbf55bb21/csv?layers=0"
				},
				{
					"@type": "dcat:Distribution",
					"title": "Shapefile",
					"format": "ZIP",
					"mediaType": "application/zip",
					"accessURL": "https://www.pacificgeoportal.com/api/download/v1/items/6bd49ffc9e2c4ef393e26d6bbf55bb21/shapefile?layers=0"
				},
				{
					"@type": "dcat:Distribution",
					"title": "GeoJSON",
					"format": "GeoJSON",
					"mediaType": "application/vnd.geo+json",
					"accessURL": "https://www.pacificgeoportal.com/api/download/v1/items/6bd49ffc9e2c4ef393e26d6bbf55bb21/geojson?layers=0"
				},
				{
					"@type": "dcat:Distribution",
					"title": "KML",
					"format": "KML",
					"mediaType": "application/vnd.google-earth.kml+xml",
					"accessURL": "https://www.pacificgeoportal.com/api/download/v1/items/6bd49ffc9e2c4ef393e26d6bbf55bb21/kml?layers=0"
				},
				{
					"@type": "dcat:Distribution",
					"title": "File Geodatabase",
					"format": "ZIP",
					"mediaType": "application/zip",
					"accessURL": "https://www.pacificgeoportal.com/api/download/v1/items/6bd49ffc9e2c4ef393e26d6bbf55bb21/filegdb?layers=0"
				},
				{
					"@type": "dcat:Distribution",
					"title": "Feature Collection",
					"format": "TXT",
					"mediaType": "text/plain",
					"accessURL": "https://www.pacificgeoportal.com/api/download/v1/items/6bd49ffc9e2c4ef393e26d6bbf55bb21/featureCollection?layers=0"
				},
				{
					"@type": "dcat:Distribution",
					"title": "Excel",
					"format": "XLSX",
					"mediaType": "application/vnd.ms-excel",
					"accessURL": "https://www.pacificgeoportal.com/api/download/v1/items/6bd49ffc9e2c4ef393e26d6bbf55bb21/excel?layers=0"
				},
				{
					"@type": "dcat:Distribution",
					"title": "GeoPackage",
					"format": "GPKG",
					"mediaType": "application/geopackage+sqlite3",
					"accessURL": "https://www.pacificgeoportal.com/api/download/v1/items/6bd49ffc9e2c4ef393e26d6bbf55bb21/geoPackage?layers=0"
				},
				{
					"@type": "dcat:Distribution",
					"title": "SQLite Geodatabase",
					"format": "GDB",
					"mediaType": "application/geopackage+sqlite3",
					"accessURL": "https://www.pacificgeoportal.com/api/download/v1/items/6bd49ffc9e2c4ef393e26d6bbf55bb21/sqlite?layers=0"
				}
			],
			"theme": [
				"geospatial"
			]
		},
		{
			"@type": "dcat:Dataset",
			"identifier": "https://www.arcgis.com/home/item.html?id=c95c42f302954779be5680c9b7efa0b6&sublayer=0",
			"landingPage": "https://www.pacificgeoportal.com/datasets/eaglegis::nz-urban-rural-indicator-areas-2021-mature-support",
			"title": "NZ Urban Rural Indicator Areas - 2021 (Mature Support)",
			"description": "<font size='3'><b><span style='color:firebrick;'>Important Note:</span></b><b> This item is in<span style='color:#C00000;'> mature support</span> as of January 2024 and will retire in January 2025.</b><b><span> When you need the most recent boundary layer please use <a href='https://www.arcgis.com/home/item.html?id=0182b19deac74ce6bcdc16b0ee290b56' rel='nofollow ugc'>this item</a>. When you need the boundaries for a specific year, please use <a href='https://www.arcgis.com/home/item.html?id=a1e9e78dbdaf49e39dffd5020dc4f7fc' rel='nofollow ugc'>this item</a> and set a filter on the required year.</span></b><br /><br /></font><div><br /><font size='3' style='font-family:\"Avenir Next W01\", \"Avenir Next W00\", \"Avenir Next\", Avenir, \"Helvetica Neue\", Helvetica, Arial, sans-serif !important;'>Topicality: 01-01-2021</font><div><span style='font-family:\"Avenir Next W01\", \"Avenir Next W00\", \"Avenir Next\", Avenir, \"Helvetica Neue\", Helvetica, Arial, sans-serif; font-size:medium;'>Projection: New Zealand Transverse Mercator (NZTM)</span><br /></div><div><div style='font-size:17px; font-family:\"Avenir Next W01\", \"Avenir Next W00\", \"Avenir Next\", Avenir, \"Helvetica Neue\", Helvetica, Arial, sans-serif !important;'><font size='3'><br /></font></div><div><div><font size='3' style='font-family:\"Avenir Next W01\", \"Avenir Next W00\", \"Avenir Next\", Avenir, \"Helvetica Neue\", Helvetica, Arial, sans-serif !important; font-size:17px;'><font>This layer is based on the dataset UR12021 (clipped) retrieved from Stats NZ. </font></font><font size='3'>Urban rural is an output geography that classifies New Zealand into areas that share common urban or rural characteristics and is used to disseminate a broad range of Stats NZ’s social, demographic and economic statistics. The urban rural geography separately identifies urban areas, rural settlements, other rural areas, and water areas. The urban areas represent densely developed spaces, and encompass residential, commercial, and other nonresidential urban land uses. Rural settlements, other rural areas, and bodies of water represent areas not included within an urban area.</font></div><div style='font-family:\"Avenir Next W01\", \"Avenir Next W00\", \"Avenir Next\", Avenir, \"Helvetica Neue\", Helvetica, Arial, sans-serif !important; font-size:17px;'><font size='3'><br /></font></div><div style='font-family:\"Avenir Next W01\", \"Avenir Next W00\", \"Avenir Next\", Avenir, \"Helvetica Neue\", Helvetica, Arial, sans-serif !important; font-size:17px;'><font size='3'><font><font size='3'>This layer shows the data for 2021. If you would like to use the layer that gets updated yearly with the latest boundary data, you can use <a href='https://www.arcgis.com/home/item.html?id=0182b19deac74ce6bcdc16b0ee290b56' target='_blank' rel='nofollow ugc noopener noreferrer'>this item</a>.<br /><br />All the boundary layers can be found <a href='https://www.arcgis.com/home/group.html?id=8047736c3e43467aa62241976851eff9' target='_blank' rel='nofollow ugc noopener noreferrer'>here</a>.<br /><br />All the boundary layers that are updated yearly can be found <a href='https://www.arcgis.com/home/group.html?id=b22e4f0012a8426dac21cd3d02f25c67' target='_blank' rel='nofollow ugc noopener noreferrer'>here</a>.<br /><br />The official dataset can be found on</font></font></font><font size='3'> </font><a href='https://datafinder.stats.govt.nz/data/category/annual-boundaries/2021/' target='_blank' rel='nofollow ugc noopener noreferrer'>https://datafinder.stats.govt.nz</a>.</div><div style='font-family:\"Avenir Next W01\", \"Avenir Next W00\", \"Avenir Next\", Avenir, \"Helvetica Neue\", Helvetica, Arial, sans-serif !important; font-size:17px;'><font size='3'><br /></font></div><div style='font-family:\"Avenir Next W01\", \"Avenir Next W00\", \"Avenir Next\", Avenir, \"Helvetica Neue\", Helvetica, Arial, sans-serif !important;'><div style='font-size:17px;'><font size='3'>This layer contains the following attributes (see data tab):</font></div><div><ul><li>Urban Rural number</li><li>Urban Rural name</li><li>Urban Rural Indicator code</li><li>Urban Rural Indicator description </li><li>Total area in square kilometers</li><li>Total land area in square kilometers.</li></ul><div><b>Urban Rural indicator classes</b></div><div><div><ul><li><div style='display:inline !important;'>urban area:</div><br /></li><ul><li><div style='display:inline !important;'>urban major (11)</div></li><li><div style='display:inline !important;'>urban large (12)</div></li><li><div style='display:inline !important;'>urban medium (13)</div></li><li><div style='display:inline !important;'>urban small (14)</div></li></ul><li><div style='display:inline !important;'>rural area:</div><br /></li><ul><li><div style='display:inline !important;'>rural settlement (21)</div></li><li><div style='display:inline !important;'>rural other (22)</div></li></ul><li><div style='display:inline !important;'>water:</div><br /></li><ul><li><div style='display:inline !important;'>inland water (31)</div></li><li><div style='display:inline !important;'>inlet (32)</div></li><li><div style='display:inline !important;'>oceanic (33)</div></li></ul></ul></div></div><div><span style='font-size:medium;'>The layer is further generalised by Eagle Technology for improved performance on the web, </span><span style='font-size:medium; font-family:\"Avenir Next W01\", \"Avenir Next W00\", \"Avenir Next\", Avenir, \"Helvetica Neue\", sans-serif;'>therefore it doesn't fully represent the official boundaries.</span><br /></div></div></div><div style='font-family:\"Avenir Next W01\", \"Avenir Next W00\", \"Avenir Next\", Avenir, \"Helvetica Neue\", Helvetica, Arial, sans-serif !important; font-size:17px;'><font size='3'><br /></font></div><div style='font-family:\"Avenir Next W01\", \"Avenir Next W00\", \"Avenir Next\", Avenir, \"Helvetica Neue\", Helvetica, Arial, sans-serif !important; font-size:17px;'><div><font color='#2f4f4f' size='3'>This layer is offered by Eagle Technology (Official Esri Distributor). Eagle Technology offers services that can be used in the ArcGIS platform. The Content team at Eagle Technology updates the layers on a regular basis and regularly adds new content to the Living Atlas. By using this content and combining it with other data you can create new information products quickly and easily.</font></div><div><font color='#2f4f4f' size='3'><br /></font></div><div><font size='3'><font color='#2f4f4f'>If you have any questions or comments about the content, please let us now  at </font><a href='mailto:livingatlas@eagle.co.nz' style='color:rgb(0, 121, 193); text-decoration-line:none;' target='_blank' rel='nofollow ugc noopener noreferrer'>livingatlas@eagle.co.nz</a></font></div></div></div></div></div>",
			"keyword": [
				"eaglegis",
				"mature support",
				"retiring",
				"deprecated"
			],
			"issued": "2021-02-04T02:22:36.000Z",
			"modified": "2021-02-15T23:04:01.261Z",
			"publisher": {
				"name": "Eagle Technology Group Ltd"
			},
			"contactPoint": {
				"@type": "vcard:Contact",
				"fn": "eaglegis",
				"hasEmail": "mailto:ts@eaglegis.co.nz"
			},
			"accessLevel": "public",
			"spatial": "166.2620,-47.2230,-177.6190,-33.7734",
			"license": "https://creativecommons.org/licenses/by/4.0",
			"distribution": [
				{
					"@type": "dcat:Distribution",
					"title": "ArcGIS Hub Dataset",
					"format": "Web Page",
					"mediaType": "text/html",
					"accessURL": "https://www.pacificgeoportal.com/datasets/eaglegis::nz-urban-rural-indicator-areas-2021-mature-support"
				},
				{
					"@type": "dcat:Distribution",
					"title": "ArcGIS GeoService",
					"format": "ArcGIS GeoServices REST API",
					"mediaType": "application/json",
					"accessURL": "https://services.arcgis.com/XTtANUDT8Va4DLwI/arcgis/rest/services/nz_urban_rural_indicator_areas_2021/FeatureServer/0"
				},
				{
					"@type": "dcat:Distribution",
					"title": "CSV",
					"format": "CSV",
					"mediaType": "text/csv",
					"accessURL": "https://www.pacificgeoportal.com/api/download/v1/items/c95c42f302954779be5680c9b7efa0b6/csv?layers=0"
				},
				{
					"@type": "dcat:Distribution",
					"title": "Shapefile",
					"format": "ZIP",
					"mediaType": "application/zip",
					"accessURL": "https://www.pacificgeoportal.com/api/download/v1/items/c95c42f302954779be5680c9b7efa0b6/shapefile?layers=0"
				},
				{
					"@type": "dcat:Distribution",
					"title": "GeoJSON",
					"format": "GeoJSON",
					"mediaType": "application/vnd.geo+json",
					"accessURL": "https://www.pacificgeoportal.com/api/download/v1/items/c95c42f302954779be5680c9b7efa0b6/geojson?layers=0"
				},
				{
					"@type": "dcat:Distribution",
					"title": "KML",
					"format": "KML",
					"mediaType": "application/vnd.google-earth.kml+xml",
					"accessURL": "https://www.pacificgeoportal.com/api/download/v1/items/c95c42f302954779be5680c9b7efa0b6/kml?layers=0"
				},
				{
					"@type": "dcat:Distribution",
					"title": "File Geodatabase",
					"format": "ZIP",
					"mediaType": "application/zip",
					"accessURL": "https://www.pacificgeoportal.com/api/download/v1/items/c95c42f302954779be5680c9b7efa0b6/filegdb?layers=0"
				},
				{
					"@type": "dcat:Distribution",
					"title": "Feature Collection",
					"format": "TXT",
					"mediaType": "text/plain",
					"accessURL": "https://www.pacificgeoportal.com/api/download/v1/items/c95c42f302954779be5680c9b7efa0b6/featureCollection?layers=0"
				},
				{
					"@type": "dcat:Distribution",
					"title": "Excel",
					"format": "XLSX",
					"mediaType": "application/vnd.ms-excel",
					"accessURL": "https://www.pacificgeoportal.com/api/download/v1/items/c95c42f302954779be5680c9b7efa0b6/excel?layers=0"
				},
				{
					"@type": "dcat:Distribution",
					"title": "GeoPackage",
					"format": "GPKG",
					"mediaType": "application/geopackage+sqlite3",
					"accessURL": "https://www.pacificgeoportal.com/api/download/v1/items/c95c42f302954779be5680c9b7efa0b6/geoPackage?layers=0"
				},
				{
					"@type": "dcat:Distribution",
					"title": "SQLite Geodatabase",
					"format": "GDB",
					"mediaType": "application/geopackage+sqlite3",
					"accessURL": "https://www.pacificgeoportal.com/api/download/v1/items/c95c42f302954779be5680c9b7efa0b6/sqlite?layers=0"
				}
			],
			"theme": [
				"geospatial"
			]
		},
		{
			"@type": "dcat:Dataset",
			"identifier": "https://www.arcgis.com/home/item.html?id=31f20560dd884c4baf8cb38d049ed928&sublayer=0",
			"landingPage": "https://www.pacificgeoportal.com/datasets/eaglegis::nz-urban-rural-indicator-boundaries-2020-mature-support",
			"title": "NZ Urban Rural Indicator boundaries 2020 (Mature Support)",
			"description": "<font size='3'><b><span style='color:firebrick;'>Important Note:</span></b><b> This item is in<span style='color:#C00000;'> mature support</span> as of January 2024 and will retire in January 2025.</b><b><span> When you need the most recent boundary layer please use <a href='https://www.arcgis.com/home/item.html?id=0182b19deac74ce6bcdc16b0ee290b56' rel='nofollow ugc'>this item</a>. When you need the boundaries for a specific year, please use <a href='https://www.arcgis.com/home/item.html?id=a1e9e78dbdaf49e39dffd5020dc4f7fc' rel='nofollow ugc'>this item</a> and set a filter on the required year.</span></b><br /><br /></font><div><br /><font size='3' style='font-family:\"Avenir Next W01\", \"Avenir Next W00\", \"Avenir Next\", Avenir, \"Helvetica Neue\", Helvetica, Arial, sans-serif !important;'>Topicality: 01-01-2020</font><div><span style='font-family:\"Avenir Next W01\", \"Avenir Next W00\", \"Avenir Next\", Avenir, \"Helvetica Neue\", Helvetica, Arial, sans-serif; font-size:medium;'>Projection: New Zealand Transverse Mercator (NZTM)</span><br /></div><div><div style='font-size:17px; font-family:\"Avenir Next W01\", \"Avenir Next W00\", \"Avenir Next\", Avenir, \"Helvetica Neue\", Helvetica, Arial, sans-serif !important;'><font size='3'><br /></font></div><div><div><font size='3' style='font-family:\"Avenir Next W01\", \"Avenir Next W00\", \"Avenir Next\", Avenir, \"Helvetica Neue\", Helvetica, Arial, sans-serif !important; font-size:17px;'><font>This layer is based on the dataset UR12020 (clipped) retrieved from Stat NZ. </font></font><font size='3'>Urban rural is an output geography that classifies New Zealand into areas that share common urban or rural characteristics and is used to disseminate a broad range of Stats NZ’s social, demographic and economic statistics. The urban rural geography separately identifies urban areas, rural settlements, other rural areas, and water areas. The urban areas represent densely developed spaces, and encompass residential, commercial, and other nonresidential urban land uses. Rural settlements, other rural areas, and bodies of water represent areas not included within an urban area.</font></div><div style='font-family:\"Avenir Next W01\", \"Avenir Next W00\", \"Avenir Next\", Avenir, \"Helvetica Neue\", Helvetica, Arial, sans-serif !important; font-size:17px;'><font size='3'><br /></font></div><div style='font-family:\"Avenir Next W01\", \"Avenir Next W00\", \"Avenir Next\", Avenir, \"Helvetica Neue\", Helvetica, Arial, sans-serif !important; font-size:17px;'><font size='3'><font><font size='3'>The official dataset can be found on</font></font></font><font size='3'> </font><a href='https://datafinder.stats.govt.nz/data/category/annual-boundaries/2020/' target='_blank' rel='nofollow ugc noopener noreferrer'>https://datafinder.stats.govt.nz</a>.</div><div style='font-family:\"Avenir Next W01\", \"Avenir Next W00\", \"Avenir Next\", Avenir, \"Helvetica Neue\", Helvetica, Arial, sans-serif !important; font-size:17px;'><font size='3'><br /></font></div><div style='font-family:\"Avenir Next W01\", \"Avenir Next W00\", \"Avenir Next\", Avenir, \"Helvetica Neue\", Helvetica, Arial, sans-serif !important;'><div style='font-size:17px;'><font size='3'>This layer contains the following attributes (see data tab):</font></div><div><ul><li>Urban Rural number</li><li>Urban Rural name</li><li>Urban Rural Indicator code</li><li>Urban Rural Indicator description </li><li>Total area in square kilometers</li><li>Total land area in square kilometers.</li></ul><div><b>Urban Rural indicator classes</b></div><div><div><ul><li><div style='display:inline !important;'>urban area:</div><br /></li><ul><li><div style='display:inline !important;'>urban major (11)</div></li><li><div style='display:inline !important;'>urban large (12)</div></li><li><div style='display:inline !important;'>urban medium (13)</div></li><li><div style='display:inline !important;'>urban small (14)</div></li></ul><li><div style='display:inline !important;'>rural area:</div><br /></li><ul><li><div style='display:inline !important;'>rural settlement (21)</div></li><li><div style='display:inline !important;'>rural other (22)</div></li></ul><li><div style='display:inline !important;'>water:</div><br /></li><ul><li><div style='display:inline !important;'>inland water (31)</div></li><li><div style='display:inline !important;'>inlet (32)</div></li><li><div style='display:inline !important;'>oceanic (33)</div></li></ul></ul></div></div><div><span style='font-size:medium;'>The layer is further generalised by Eagle Technology for improved performance on the web, </span><span style='font-size:medium; font-family:\"Avenir Next W01\", \"Avenir Next W00\", \"Avenir Next\", Avenir, \"Helvetica Neue\", sans-serif;'>therefore it doesn't fully represent the official boundaries.</span><br /></div></div></div><div style='font-family:\"Avenir Next W01\", \"Avenir Next W00\", \"Avenir Next\", Avenir, \"Helvetica Neue\", Helvetica, Arial, sans-serif !important; font-size:17px;'><font size='3'><br /></font></div><div style='font-family:\"Avenir Next W01\", \"Avenir Next W00\", \"Avenir Next\", Avenir, \"Helvetica Neue\", Helvetica, Arial, sans-serif !important; font-size:17px;'><div><font color='#2f4f4f' size='3'>This layer is offered by Eagle Technology (Official Esri Distributor). Eagle Technology offers services that can be used in the ArcGIS platform. The Content team at Eagle Technology updates the layers on a regular basis and regularly adds new content to the Living Atlas. By using this content and combining it with other data you can create new information products quickly and easily.</font></div><div><font color='#2f4f4f' size='3'><br /></font></div><div><font size='3'><font color='#2f4f4f'>If you have any questions or comments about the content, please let us now  at </font><a href='mailto:livingatlas@eagle.co.nz' style='color:rgb(0, 121, 193); text-decoration-line:none;' target='_blank' rel='nofollow ugc noopener noreferrer'>livingatlas@eagle.co.nz</a></font></div></div></div></div></div>",
			"keyword": [
				"eaglegis",
				"mature support",
				"retiring",
				"deprecated"
			],
			"issued": "2020-01-11T10:22:54.000Z",
			"modified": "2021-02-10T03:39:35.055Z",
			"publisher": {
				"name": "Eagle Technology Group Ltd"
			},
			"contactPoint": {
				"@type": "vcard:Contact",
				"fn": "eaglegis",
				"hasEmail": "mailto:ts@eaglegis.co.nz"
			},
			"accessLevel": "public",
			"spatial": "166.2620,-47.2230,-177.6190,-33.7734",
			"license": "https://creativecommons.org/licenses/by/4.0",
			"distribution": [
				{
					"@type": "dcat:Distribution",
					"title": "ArcGIS Hub Dataset",
					"format": "Web Page",
					"mediaType": "text/html",
					"accessURL": "https://www.pacificgeoportal.com/datasets/eaglegis::nz-urban-rural-indicator-boundaries-2020-mature-support"
				},
				{
					"@type": "dcat:Distribution",
					"title": "ArcGIS GeoService",
					"format": "ArcGIS GeoServices REST API",
					"mediaType": "application/json",
					"accessURL": "https://services.arcgis.com/XTtANUDT8Va4DLwI/arcgis/rest/services/Urban_Rural_2020_Clipped_generalised/FeatureServer/0"
				},
				{
					"@type": "dcat:Distribution",
					"title": "CSV",
					"format": "CSV",
					"mediaType": "text/csv",
					"accessURL": "https://www.pacificgeoportal.com/api/download/v1/items/31f20560dd884c4baf8cb38d049ed928/csv?layers=0"
				},
				{
					"@type": "dcat:Distribution",
					"title": "Shapefile",
					"format": "ZIP",
					"mediaType": "application/zip",
					"accessURL": "https://www.pacificgeoportal.com/api/download/v1/items/31f20560dd884c4baf8cb38d049ed928/shapefile?layers=0"
				},
				{
					"@type": "dcat:Distribution",
					"title": "GeoJSON",
					"format": "GeoJSON",
					"mediaType": "application/vnd.geo+json",
					"accessURL": "https://www.pacificgeoportal.com/api/download/v1/items/31f20560dd884c4baf8cb38d049ed928/geojson?layers=0"
				},
				{
					"@type": "dcat:Distribution",
					"title": "KML",
					"format": "KML",
					"mediaType": "application/vnd.google-earth.kml+xml",
					"accessURL": "https://www.pacificgeoportal.com/api/download/v1/items/31f20560dd884c4baf8cb38d049ed928/kml?layers=0"
				},
				{
					"@type": "dcat:Distribution",
					"title": "File Geodatabase",
					"format": "ZIP",
					"mediaType": "application/zip",
					"accessURL": "https://www.pacificgeoportal.com/api/download/v1/items/31f20560dd884c4baf8cb38d049ed928/filegdb?layers=0"
				},
				{
					"@type": "dcat:Distribution",
					"title": "Feature Collection",
					"format": "TXT",
					"mediaType": "text/plain",
					"accessURL": "https://www.pacificgeoportal.com/api/download/v1/items/31f20560dd884c4baf8cb38d049ed928/featureCollection?layers=0"
				},
				{
					"@type": "dcat:Distribution",
					"title": "Excel",
					"format": "XLSX",
					"mediaType": "application/vnd.ms-excel",
					"accessURL": "https://www.pacificgeoportal.com/api/download/v1/items/31f20560dd884c4baf8cb38d049ed928/excel?layers=0"
				},
				{
					"@type": "dcat:Distribution",
					"title": "GeoPackage",
					"format": "GPKG",
					"mediaType": "application/geopackage+sqlite3",
					"accessURL": "https://www.pacificgeoportal.com/api/download/v1/items/31f20560dd884c4baf8cb38d049ed928/geoPackage?layers=0"
				},
				{
					"@type": "dcat:Distribution",
					"title": "SQLite Geodatabase",
					"format": "GDB",
					"mediaType": "application/geopackage+sqlite3",
					"accessURL": "https://www.pacificgeoportal.com/api/download/v1/items/31f20560dd884c4baf8cb38d049ed928/sqlite?layers=0"
				}
			],
			"theme": [
				"geospatial"
			]
		},
		{
			"@type": "dcat:Dataset",
			"identifier": "https://www.arcgis.com/home/item.html?id=a30c299bdd9a48ea91ab9b1239f4a7f8&sublayer=0",
			"landingPage": "https://www.pacificgeoportal.com/datasets/eaglegis::nz-urban-rural-indicator-boundaries-2019-mature-support",
			"title": "NZ Urban Rural Indicator boundaries 2019 (Mature Support)",
			"description": "<font size='3'><b><span style='color:firebrick;'>Important Note:</span></b><b> This item is in<span style='color:#C00000;'> mature support</span> as of January 2024 and will retire in January 2025.</b><b><span> When you need the most recent boundary layer please use <a href='https://www.arcgis.com/home/item.html?id=0182b19deac74ce6bcdc16b0ee290b56' rel='nofollow ugc'>this item</a>. When you need the boundaries for a specific year, please use <a href='https://www.arcgis.com/home/item.html?id=a1e9e78dbdaf49e39dffd5020dc4f7fc' rel='nofollow ugc'>this item</a> and set a filter on the required year.</span></b><br /><br /></font><div><br /><font size='3' style='font-family: \"Avenir Next W01\", \"Avenir Next W00\", \"Avenir Next\", Avenir, \"Helvetica Neue\", Helvetica, Arial, sans-serif !important;'>Topicality: 01-01-2019</font><div><span style='font-family: \"Avenir Next W01\", \"Avenir Next W00\", \"Avenir Next\", Avenir, \"Helvetica Neue\", Helvetica, Arial, sans-serif; font-size: medium;'>Projection: New Zealand Transverse Mercator (NZTM)</span><br /></div><div><div style='font-size: 17px; font-family: \"Avenir Next W01\", \"Avenir Next W00\", \"Avenir Next\", Avenir, \"Helvetica Neue\", Helvetica, Arial, sans-serif !important;'><font size='3'><br /></font></div><div style=''><div style=''><font size='3' style='font-family: \"Avenir Next W01\", \"Avenir Next W00\", \"Avenir Next\", Avenir, \"Helvetica Neue\", Helvetica, Arial, sans-serif !important; font-size: 17px;'><font face='Avenir Next W01, Avenir Next W00, Avenir Next, Avenir, Helvetica Neue, Helvetica, Arial, sans-serif'>This layer is based on the dataset UR12019 (clipped) retrieved from Stat NZ. </font></font><font face='Avenir Next W01, Avenir Next W00, Avenir Next, Avenir, Helvetica Neue, Helvetica, Arial, sans-serif' size='3'>Urban rural is an output geography that classifies New Zealand into areas that share common urban or rural characteristics and is used to disseminate a broad range of Stats NZ’s social, demographic and economic statistics. The urban rural geography separately identifies urban areas, rural settlements, other rural areas, and water areas. The urban areas represent densely developed spaces, and encompass residential, commercial, and other nonresidential urban land uses. Rural settlements, other rural areas, and bodies of water represent areas not included within an urban area.</font></div><div style='font-family: \"Avenir Next W01\", \"Avenir Next W00\", \"Avenir Next\", Avenir, \"Helvetica Neue\", Helvetica, Arial, sans-serif !important; font-size: 17px;'><font face='Avenir Next W01, Avenir Next W00, Avenir Next, Avenir, Helvetica Neue, Helvetica, Arial, sans-serif' size='3'><br /></font></div><div style='font-family: \"Avenir Next W01\", \"Avenir Next W00\", \"Avenir Next\", Avenir, \"Helvetica Neue\", Helvetica, Arial, sans-serif !important; font-size: 17px;'><span style='font-size: medium;'>The official dataset and metadata can be found on</span><font face='Avenir Next W01, Avenir Next W00, Avenir Next, Avenir, Helvetica Neue, Helvetica, Arial, sans-serif' size='3'> </font><a href='https://datafinder.stats.govt.nz/layer/98743-urban-rural-2019-clipped-generalised/' target='_blank' rel='nofollow ugc noopener noreferrer'>https://datafinder.stats.govt.nz</a>.</div><div style='font-family: \"Avenir Next W01\", \"Avenir Next W00\", \"Avenir Next\", Avenir, \"Helvetica Neue\", Helvetica, Arial, sans-serif !important; font-size: 17px;'><font face='Avenir Next W01, Avenir Next W00, Avenir Next, Avenir, Helvetica Neue, Helvetica, Arial, sans-serif' size='3'><br /></font></div><div style='font-family: \"Avenir Next W01\", \"Avenir Next W00\", \"Avenir Next\", Avenir, \"Helvetica Neue\", Helvetica, Arial, sans-serif !important;'><div style='font-size: 17px;'><font size='3'>This layer contains the following attributes (see data tab):</font></div><div style=''><ul><li>Urban Rural number</li><li>Urban Rural name</li><li>Urban Rural Indicator code</li><li>Urban Rural Indicator description </li><li>Total area in square kilometers</li><li>Total land area in square kilometers.</li></ul><div style=''><b>Urban Rural indicator classes</b></div><div style=''><div style=''><ul><li><div style='display: inline !important;'>urban area:</div><br /></li><ul><li><div style='display: inline !important;'>urban major (11)</div></li><li><div style='display: inline !important;'>urban large (12)</div></li><li><div style='display: inline !important;'>urban medium (13)</div></li><li><div style='display: inline !important;'>urban small (14)</div></li></ul><li><div style='display: inline !important;'>rural area:</div><br /></li><ul><li><div style='display: inline !important;'>rural settlement (21)</div></li><li><div style='display: inline !important;'>rural other (22)</div></li></ul><li><div style='display: inline !important;'>water:</div><br /></li><ul><li><div style='display: inline !important;'>inland water (31)</div></li><li><div style='display: inline !important;'>inlet (32)</div></li><li><div style='display: inline !important;'>oceanic (33)</div></li></ul></ul></div></div><div style=''><span style='font-size: medium;'>The layer is further generalised by Eagle Technology for improved performance on the web, </span><span style='font-size: medium; font-family: \"Avenir Next W01\", \"Avenir Next W00\", \"Avenir Next\", Avenir, \"Helvetica Neue\", sans-serif;'>therefore it doesn't fully represent the official boundaries.</span><br /></div></div></div><div style='font-family: \"Avenir Next W01\", \"Avenir Next W00\", \"Avenir Next\", Avenir, \"Helvetica Neue\", Helvetica, Arial, sans-serif !important; font-size: 17px;'><font size='3'><br /></font></div><div style='font-family: \"Avenir Next W01\", \"Avenir Next W00\", \"Avenir Next\", Avenir, \"Helvetica Neue\", Helvetica, Arial, sans-serif !important; font-size: 17px;'><div><font color='#2f4f4f' size='3'>This layer is offered by Eagle Technology (Official Esri Distributor). Eagle Technology offers services that can be used in the ArcGIS platform. The Content team at Eagle Technology updates the layers on a regular basis and regularly adds new content to the Living Atlas. By using this content and combining it with other data you can create new information products quickly and easily.</font></div><div><font color='#2f4f4f' size='3'><br /></font></div><div><font size='3'><font color='#2f4f4f'>If you have any questions or comments about the content, please let us now  at </font><a href='mailto:livingatlas@eagle.co.nz.' style='color: rgb(0, 121, 193); text-decoration-line: none;' target='_blank' rel='nofollow ugc noopener noreferrer'>livingatlas@eagle.co.nz</a></font></div></div></div></div></div>",
			"keyword": [
				"eaglegis",
				"mature support",
				"retiring",
				"deprecated"
			],
			"issued": "2018-12-21T13:02:41.000Z",
			"modified": "2019-05-09T20:18:37.768Z",
			"publisher": {
				"name": "Eagle Technology Group Ltd"
			},
			"contactPoint": {
				"@type": "vcard:Contact",
				"fn": "eaglegis",
				"hasEmail": "mailto:ts@eaglegis.co.nz"
			},
			"accessLevel": "public",
			"spatial": "166.2620,-47.2230,-177.6196,-33.7735",
			"license": "https://creativecommons.org/licenses/by/4.0",
			"distribution": [
				{
					"@type": "dcat:Distribution",
					"title": "ArcGIS Hub Dataset",
					"format": "Web Page",
					"mediaType": "text/html",
					"accessURL": "https://www.pacificgeoportal.com/datasets/eaglegis::nz-urban-rural-indicator-boundaries-2019-mature-support"
				},
				{
					"@type": "dcat:Distribution",
					"title": "ArcGIS GeoService",
					"format": "ArcGIS GeoServices REST API",
					"mediaType": "application/json",
					"accessURL": "https://services.arcgis.com/XTtANUDT8Va4DLwI/arcgis/rest/services/Urban_Rural_2019_Clipped_generalised/FeatureServer/0"
				},
				{
					"@type": "dcat:Distribution",
					"title": "CSV",
					"format": "CSV",
					"mediaType": "text/csv",
					"accessURL": "https://www.pacificgeoportal.com/api/download/v1/items/a30c299bdd9a48ea91ab9b1239f4a7f8/csv?layers=0"
				},
				{
					"@type": "dcat:Distribution",
					"title": "Shapefile",
					"format": "ZIP",
					"mediaType": "application/zip",
					"accessURL": "https://www.pacificgeoportal.com/api/download/v1/items/a30c299bdd9a48ea91ab9b1239f4a7f8/shapefile?layers=0"
				},
				{
					"@type": "dcat:Distribution",
					"title": "GeoJSON",
					"format": "GeoJSON",
					"mediaType": "application/vnd.geo+json",
					"accessURL": "https://www.pacificgeoportal.com/api/download/v1/items/a30c299bdd9a48ea91ab9b1239f4a7f8/geojson?layers=0"
				},
				{
					"@type": "dcat:Distribution",
					"title": "KML",
					"format": "KML",
					"mediaType": "application/vnd.google-earth.kml+xml",
					"accessURL": "https://www.pacificgeoportal.com/api/download/v1/items/a30c299bdd9a48ea91ab9b1239f4a7f8/kml?layers=0"
				},
				{
					"@type": "dcat:Distribution",
					"title": "File Geodatabase",
					"format": "ZIP",
					"mediaType": "application/zip",
					"accessURL": "https://www.pacificgeoportal.com/api/download/v1/items/a30c299bdd9a48ea91ab9b1239f4a7f8/filegdb?layers=0"
				},
				{
					"@type": "dcat:Distribution",
					"title": "Feature Collection",
					"format": "TXT",
					"mediaType": "text/plain",
					"accessURL": "https://www.pacificgeoportal.com/api/download/v1/items/a30c299bdd9a48ea91ab9b1239f4a7f8/featureCollection?layers=0"
				},
				{
					"@type": "dcat:Distribution",
					"title": "Excel",
					"format": "XLSX",
					"mediaType": "application/vnd.ms-excel",
					"accessURL": "https://www.pacificgeoportal.com/api/download/v1/items/a30c299bdd9a48ea91ab9b1239f4a7f8/excel?layers=0"
				},
				{
					"@type": "dcat:Distribution",
					"title": "GeoPackage",
					"format": "GPKG",
					"mediaType": "application/geopackage+sqlite3",
					"accessURL": "https://www.pacificgeoportal.com/api/download/v1/items/a30c299bdd9a48ea91ab9b1239f4a7f8/geoPackage?layers=0"
				},
				{
					"@type": "dcat:Distribution",
					"title": "SQLite Geodatabase",
					"format": "GDB",
					"mediaType": "application/geopackage+sqlite3",
					"accessURL": "https://www.pacificgeoportal.com/api/download/v1/items/a30c299bdd9a48ea91ab9b1239f4a7f8/sqlite?layers=0"
				}
			],
			"theme": [
				"geospatial"
			]
		},
		{
			"@type": "dcat:Dataset",
			"identifier": "https://www.arcgis.com/home/item.html?id=953884278b9641a38b90520ecdbee3b9&sublayer=0",
			"landingPage": "https://www.pacificgeoportal.com/datasets/eaglegis::nz-urban-rural-indicator-boundaries-2018-mature-support",
			"title": "NZ Urban Rural Indicator boundaries 2018 (Mature Support)",
			"description": "<font size='3'><b><span style='color:firebrick;'>Important Note:</span></b><b> This item is in<span style='color:#C00000;'> mature support</span> as of January 2024 and will retire in January 2025.</b><b><span> When you need the most recent boundary layer please use <a href='https://www.arcgis.com/home/item.html?id=0182b19deac74ce6bcdc16b0ee290b56' rel='nofollow ugc'>this item</a>. When you need the boundaries for a specific year, please use <a href='https://www.arcgis.com/home/item.html?id=a1e9e78dbdaf49e39dffd5020dc4f7fc' rel='nofollow ugc'>this item</a> and set a filter on the required year.</span></b><br /><br /></font><div><br /><font size='3' style='font-family: \"Avenir Next W01\", \"Avenir Next W00\", \"Avenir Next\", Avenir, \"Helvetica Neue\", Helvetica, Arial, sans-serif !important;'>Topicality: 01-01-2018</font><div><span style='font-family: \"Avenir Next W01\", \"Avenir Next W00\", \"Avenir Next\", Avenir, \"Helvetica Neue\", Helvetica, Arial, sans-serif; font-size: medium;'>Projection: New Zealand Transverse Mercator (NZTM)</span><br /></div><div><div style='font-size: 17px; font-family: \"Avenir Next W01\", \"Avenir Next W00\", \"Avenir Next\", Avenir, \"Helvetica Neue\", Helvetica, Arial, sans-serif !important;'><font size='3'><br /></font></div><div style=''><div style=''><font size='3' style='font-family: \"Avenir Next W01\", \"Avenir Next W00\", \"Avenir Next\", Avenir, \"Helvetica Neue\", Helvetica, Arial, sans-serif !important; font-size: 17px;'><font face='Avenir Next W01, Avenir Next W00, Avenir Next, Avenir, Helvetica Neue, Helvetica, Arial, sans-serif'>This layer is based on the dataset UR12018 (clipped) retrieved from Stat NZ. </font></font><font face='Avenir Next W01, Avenir Next W00, Avenir Next, Avenir, Helvetica Neue, Helvetica, Arial, sans-serif' size='3'>Urban rural is an output geography that classifies New Zealand into areas that share common urban or rural characteristics and is used to disseminate a broad range of Stats NZ’s social, demographic and economic statistics. The urban rural geography separately identifies urban areas, rural settlements, other rural areas, and water areas. The urban areas represent densely developed spaces, and encompass residential, commercial, and other nonresidential urban land uses. Rural settlements, other rural areas, and bodies of water represent areas not included within an urban area.</font></div><div style='font-family: \"Avenir Next W01\", \"Avenir Next W00\", \"Avenir Next\", Avenir, \"Helvetica Neue\", Helvetica, Arial, sans-serif !important; font-size: 17px;'><font face='Avenir Next W01, Avenir Next W00, Avenir Next, Avenir, Helvetica Neue, Helvetica, Arial, sans-serif' size='3'><br /></font></div><div style='font-family: \"Avenir Next W01\", \"Avenir Next W00\", \"Avenir Next\", Avenir, \"Helvetica Neue\", Helvetica, Arial, sans-serif !important; font-size: 17px;'><span style='font-size: medium;'>The official dataset and metadata can be found on</span><font face='Avenir Next W01, Avenir Next W00, Avenir Next, Avenir, Helvetica Neue, Helvetica, Arial, sans-serif' size='3'> </font><a href='https://datafinder.stats.govt.nz/layer/92219-urban-rural-2018-clipped-generalised/' target='_blank' rel='nofollow ugc noopener noreferrer'>https://datafinder.stats.govt.nz</a>.</div><div style='font-family: \"Avenir Next W01\", \"Avenir Next W00\", \"Avenir Next\", Avenir, \"Helvetica Neue\", Helvetica, Arial, sans-serif !important; font-size: 17px;'><font face='Avenir Next W01, Avenir Next W00, Avenir Next, Avenir, Helvetica Neue, Helvetica, Arial, sans-serif' size='3'><br /></font></div><div style='font-family: \"Avenir Next W01\", \"Avenir Next W00\", \"Avenir Next\", Avenir, \"Helvetica Neue\", Helvetica, Arial, sans-serif !important;'><div style='font-size: 17px;'><font size='3'>This layer contains the following attributes (see data tab):</font></div><div style=''><ul><li>Urban Rural number</li><li>Urban Rural name</li><li>Urban Rural Indicator code</li><li>Urban Rural Indicator description </li><li>Total area in square kilometers</li><li>Total land area in square kilometers.</li></ul><div style=''><b>Urban Rural indicator classes</b></div><div style=''><div style=''><ul><li><div style='display: inline !important;'>urban area:</div><br /></li><ul><li><div style='display: inline !important;'>urban major (11)</div></li><li><div style='display: inline !important;'>urban large (12)</div></li><li><div style='display: inline !important;'>urban medium (13)</div></li><li><div style='display: inline !important;'>urban small (14)</div></li></ul><li><div style='display: inline !important;'>rural area:</div><br /></li><ul><li><div style='display: inline !important;'>rural settlement (21)</div></li><li><div style='display: inline !important;'>rural other (22)</div></li></ul><li><div style='display: inline !important;'>water:</div><br /></li><ul><li><div style='display: inline !important;'>inland water (31)</div></li><li><div style='display: inline !important;'>inlet (32)</div></li><li><div style='display: inline !important;'>oceanic (33)</div></li></ul></ul></div></div><div style=''><span style='font-size: medium;'>The layer is further generalised by Eagle Technology for improved performance on the web, </span><span style='font-size: medium; font-family: \"Avenir Next W01\", \"Avenir Next W00\", \"Avenir Next\", Avenir, \"Helvetica Neue\", sans-serif;'>therefore it doesn't fully represent the official boundaries.</span><br /></div></div></div><div style='font-family: \"Avenir Next W01\", \"Avenir Next W00\", \"Avenir Next\", Avenir, \"Helvetica Neue\", Helvetica, Arial, sans-serif !important; font-size: 17px;'><font size='3'><br /></font></div><div style='font-family: \"Avenir Next W01\", \"Avenir Next W00\", \"Avenir Next\", Avenir, \"Helvetica Neue\", Helvetica, Arial, sans-serif !important; font-size: 17px;'><div><font color='#2f4f4f' size='3'>This layer is offered by Eagle Technology (Official Esri Distributor). Eagle Technology offers services that can be used in the ArcGIS platform. The Content team at Eagle Technology updates the layers on a regular basis and regularly adds new content to the Living Atlas. By using this content and combining it with other data you can create new information products quickly and easily.</font></div><div><font color='#2f4f4f' size='3'><br /></font></div><div><font size='3'><font color='#2f4f4f'>If you have any questions or comments about the content, please let us now  at </font><a href='mailto:livingatlas@eagle.co.nz.' style='color: rgb(0, 121, 193); text-decoration-line: none;' target='_blank' rel='nofollow ugc noopener noreferrer'>livingatlas@eagle.co.nz</a></font></div></div></div></div></div>",
			"keyword": [
				"eaglegis",
				"mature support",
				"retiring",
				"deprecated"
			],
			"issued": "2018-09-05T10:07:08.000Z",
			"modified": "2021-05-27T04:42:42.871Z",
			"publisher": {
				"name": "Eagle Technology Group Ltd"
			},
			"contactPoint": {
				"@type": "vcard:Contact",
				"fn": "eaglegis",
				"hasEmail": "mailto:ts@eaglegis.co.nz"
			},
			"accessLevel": "public",
			"spatial": "166.2620,-47.2230,-177.6196,-33.7735",
			"license": "https://creativecommons.org/licenses/by/4.0",
			"distribution": [
				{
					"@type": "dcat:Distribution",
					"title": "ArcGIS Hub Dataset",
					"format": "Web Page",
					"mediaType": "text/html",
					"accessURL": "https://www.pacificgeoportal.com/datasets/eaglegis::nz-urban-rural-indicator-boundaries-2018-mature-support"
				},
				{
					"@type": "dcat:Distribution",
					"title": "ArcGIS GeoService",
					"format": "ArcGIS GeoServices REST API",
					"mediaType": "application/json",
					"accessURL": "https://services.arcgis.com/XTtANUDT8Va4DLwI/arcgis/rest/services/NZ_Urban_Rural_Indicator_boundaries_2018_generalised/FeatureServer/0"
				},
				{
					"@type": "dcat:Distribution",
					"title": "CSV",
					"format": "CSV",
					"mediaType": "text/csv",
					"accessURL": "https://www.pacificgeoportal.com/api/download/v1/items/953884278b9641a38b90520ecdbee3b9/csv?layers=0"
				},
				{
					"@type": "dcat:Distribution",
					"title": "Shapefile",
					"format": "ZIP",
					"mediaType": "application/zip",
					"accessURL": "https://www.pacificgeoportal.com/api/download/v1/items/953884278b9641a38b90520ecdbee3b9/shapefile?layers=0"
				},
				{
					"@type": "dcat:Distribution",
					"title": "GeoJSON",
					"format": "GeoJSON",
					"mediaType": "application/vnd.geo+json",
					"accessURL": "https://www.pacificgeoportal.com/api/download/v1/items/953884278b9641a38b90520ecdbee3b9/geojson?layers=0"
				},
				{
					"@type": "dcat:Distribution",
					"title": "KML",
					"format": "KML",
					"mediaType": "application/vnd.google-earth.kml+xml",
					"accessURL": "https://www.pacificgeoportal.com/api/download/v1/items/953884278b9641a38b90520ecdbee3b9/kml?layers=0"
				},
				{
					"@type": "dcat:Distribution",
					"title": "File Geodatabase",
					"format": "ZIP",
					"mediaType": "application/zip",
					"accessURL": "https://www.pacificgeoportal.com/api/download/v1/items/953884278b9641a38b90520ecdbee3b9/filegdb?layers=0"
				},
				{
					"@type": "dcat:Distribution",
					"title": "Feature Collection",
					"format": "TXT",
					"mediaType": "text/plain",
					"accessURL": "https://www.pacificgeoportal.com/api/download/v1/items/953884278b9641a38b90520ecdbee3b9/featureCollection?layers=0"
				},
				{
					"@type": "dcat:Distribution",
					"title": "Excel",
					"format": "XLSX",
					"mediaType": "application/vnd.ms-excel",
					"accessURL": "https://www.pacificgeoportal.com/api/download/v1/items/953884278b9641a38b90520ecdbee3b9/excel?layers=0"
				},
				{
					"@type": "dcat:Distribution",
					"title": "GeoPackage",
					"format": "GPKG",
					"mediaType": "application/geopackage+sqlite3",
					"accessURL": "https://www.pacificgeoportal.com/api/download/v1/items/953884278b9641a38b90520ecdbee3b9/geoPackage?layers=0"
				},
				{
					"@type": "dcat:Distribution",
					"title": "SQLite Geodatabase",
					"format": "GDB",
					"mediaType": "application/geopackage+sqlite3",
					"accessURL": "https://www.pacificgeoportal.com/api/download/v1/items/953884278b9641a38b90520ecdbee3b9/sqlite?layers=0"
				}
			],
			"theme": [
				"geospatial"
			]
		},
		{
			"@type": "dcat:Dataset",
			"identifier": "https://www.arcgis.com/home/item.html?id=fda7d88c5b704ae39f002591a2e39ec7&sublayer=0",
			"landingPage": "https://www.pacificgeoportal.com/datasets/eaglegis::nz-subdivisions-2021-mature-support",
			"title": "NZ Subdivisions - 2021 (Mature Support)",
			"description": "<font size='3'><b><span style='color:firebrick;'>Important Note:</span></b><b> This item is in<span style='color:#C00000;'> mature support</span> as of January 2024 and will retire in January 2025.</b><b><span> When you need the most recent boundary layer please use <a href='https://www.arcgis.com/home/item.html?id=4f0cb6eb82ea4a12a3a749067b6ee1fd' rel='nofollow ugc'>this item</a>. When you need the boundaries for a specific year, please use <a href='https://www.arcgis.com/home/item.html?id=725ccdca733d49268ff6a707d20cf14e' rel='nofollow ugc'>this item</a> and set a filter on the required year.</span></b><br /><br /></font><div><br /><font size='3' style='font-family: \"Avenir Next W01\", \"Avenir Next W00\", \"Avenir Next\", Avenir, \"Helvetica Neue\", Helvetica, Arial, sans-serif !important;'>Topicality: 01-01-2021</font><div style=''><font size='3' style='font-family: \"Avenir Next W01\", \"Avenir Next W00\", \"Avenir Next\", Avenir, \"Helvetica Neue\", Helvetica, Arial, sans-serif !important; font-size: 17px;'>Projection: New Zealand Transverse Mercator (NZTM)<font face='Avenir Next W01, Avenir Next W00, Avenir Next, Avenir, Helvetica Neue, Helvetica, Arial, sans-serif'><br /></font></font><div style='font-family: \"Avenir Next W01\", \"Avenir Next W00\", \"Avenir Next\", Avenir, \"Helvetica Neue\", Helvetica, Arial, sans-serif !important; font-size: 17px;'><font size='3'><br /></font></div><div style='font-family: \"Avenir Next W01\", \"Avenir Next W00\", \"Avenir Next\", Avenir, \"Helvetica Neue\", Helvetica, Arial, sans-serif !important; font-size: 17px;'><font size='3'><font face='Avenir Next W01, Avenir Next W00, Avenir Next, Avenir, Helvetica Neue, Helvetica, Arial, sans-serif'>This layer is based on the </font>definitive set of </font><span style='font-family: \"Avenir Next W01\", \"Avenir Next W00\", \"Avenir Next\", Avenir, \"Helvetica Neue\", sans-serif;'>Territorial Authority Subdivision boundaries</span><font size='3'> for 2021 as defined by the regional councils and Local Government Commission but maintained by Stats NZ (the custodian).<font face='Avenir Next W01, Avenir Next W00, Avenir Next, Avenir, Helvetica Neue, Helvetica, Arial, sans-serif'> </font></font></div><div style='font-family: \"Avenir Next W01\", \"Avenir Next W00\", \"Avenir Next\", Avenir, \"Helvetica Neue\", Helvetica, Arial, sans-serif !important; font-size: 17px;'><font size='3'><font face='Avenir Next W01, Avenir Next W00, Avenir Next, Avenir, Helvetica Neue, Helvetica, Arial, sans-serif'><br /></font></font></div><div style=''><font size='3' style=''><font face='Avenir Next W01, Avenir Next W00, Avenir Next, Avenir, Helvetica Neue, Helvetica, Arial, sans-serif' style=''><div style=''>Subdivisions are set up under the Local Government Act 2002 and Local Electoral Act 2001. A subdivision is a division of a community or local board area for electoral purposes.</div><div style=''><br /></div><div style=''>Subdivisions are defined at meshblock level, and do not coincide with the  statistical area 1 (SA1) geography or the statistical area 2 (SA2) geography. A  number of territorial authorities do not have subdivisions, and if they do, the  subdivisions do not necessarily cover the whole territorial authority area.  Subdivisions nest within community or local boards. Where a community or  local board is divided into subdivisions all of the community or local board area  must be included in a subdivision.<br /></div><div style=''><br /></div><div style=''>Subdivisions are numbered based on their corresponding territorial authority. Each subdivision has a unique five-digit number. The first three digits refer to the territorial authority that the subdivision lies within. The following two digits are sequential, and represent the number of subdivisions within the territorial authority. For example, Southland District (073) has two subdivisions numbered 07301 and 07302. The rest of the district is not represented by a subdivision and is coded 07399 (Area Outside Subdivision).<br /></div><div style=''><br /></div><div style=''><div style='font-size: 17px;'><font size='3'>This layer shows the data for 2021. If you would like to use the layer that gets updated yearly with the latest boundary data, you can use <a href='https://www.arcgis.com/home/item.html?id=4f0cb6eb82ea4a12a3a749067b6ee1fd' target='_blank' rel='nofollow ugc noopener noreferrer'>this item</a>.<br /><br />All the boundary layers can be found <a href='https://www.arcgis.com/home/group.html?id=8047736c3e43467aa62241976851eff9' target='_blank' rel='nofollow ugc noopener noreferrer'>here</a>.<br /><br />All the boundary layers that are updated yearly can be found <a href='https://www.arcgis.com/home/group.html?id=b22e4f0012a8426dac21cd3d02f25c67' target='_blank' rel='nofollow ugc noopener noreferrer'>here</a>.<br /><br />The official dataset can be found on<font face='Avenir Next W01, Avenir Next W00, Avenir Next, Avenir, Helvetica Neue, Helvetica, Arial, sans-serif'> </font></font><a href='https://datafinder.stats.govt.nz/data/category/annual-boundaries/2021/' style='font-size: medium;' target='_blank' rel='nofollow ugc noopener noreferrer'>https://datafinder.stats.govt.nz.</a></div><div style='font-size: 17px;'><br /></div><div style='font-size: 17px;'><div><font size='3'>This layer contains the following attributes (see data tab):</font></div><div><ul><li><font size='3'>Territorial Authority Subdivision code</font></li><li><font size='3'>Territorial Authority Subdivision name</font></li><li><font size='3'>Total area in square kilometers</font></li><li><font size='3'>Total land area in square kilometers.</font></li></ul><div><font size='3'>The layer is further generalised by Eagle Technology for improved performance on the web, <span style='font-family: \"Avenir Next W01\", \"Avenir Next W00\", \"Avenir Next\", Avenir, \"Helvetica Neue\", sans-serif;'>therefore it doesn't fully represent the official boundaries.</span><br /></font></div></div></div><div style='font-size: 17px;'><font size='3'><br /></font></div><div style='font-size: 17px;'><div><font color='#2f4f4f' size='3'>This layer is offered by Eagle Technology (Official Esri Distributor). Eagle Technology offers services that can be used in the ArcGIS platform. The Content team at Eagle Technology updates the layers on a regular basis and regularly adds new content to the Living Atlas. By using this content and combining it with other data you can create new information products quickly and easily.</font></div><div><font color='#2f4f4f' size='3'><br /></font></div><div><font size='3'><font color='#2f4f4f'>If you have any questions or comments about the content, please let us now  at </font><a href='mailto:livingatlas@eagle.co.nz' style='color: rgb(0, 121, 193); text-decoration-line: none;' target='_blank' rel='nofollow ugc noopener noreferrer'>livingatlas@eagle.co.nz</a></font></div></div></div></font></font></div></div></div>",
			"keyword": [
				"eaglegis",
				"mature support",
				"retiring",
				"deprecated"
			],
			"issued": "2021-02-04T02:22:10.000Z",
			"modified": "2021-02-15T23:03:46.677Z",
			"publisher": {
				"name": "Eagle Technology Group Ltd"
			},
			"contactPoint": {
				"@type": "vcard:Contact",
				"fn": "eaglegis",
				"hasEmail": "mailto:ts@eaglegis.co.nz"
			},
			"accessLevel": "public",
			"spatial": "166.2620,-47.2230,-177.6189,-33.7734",
			"license": "https://creativecommons.org/licenses/by/4.0",
			"distribution": [
				{
					"@type": "dcat:Distribution",
					"title": "ArcGIS Hub Dataset",
					"format": "Web Page",
					"mediaType": "text/html",
					"accessURL": "https://www.pacificgeoportal.com/datasets/eaglegis::nz-subdivisions-2021-mature-support"
				},
				{
					"@type": "dcat:Distribution",
					"title": "ArcGIS GeoService",
					"format": "ArcGIS GeoServices REST API",
					"mediaType": "application/json",
					"accessURL": "https://services.arcgis.com/XTtANUDT8Va4DLwI/arcgis/rest/services/nz_subdivisions_2021/FeatureServer/0"
				},
				{
					"@type": "dcat:Distribution",
					"title": "CSV",
					"format": "CSV",
					"mediaType": "text/csv",
					"accessURL": "https://www.pacificgeoportal.com/api/download/v1/items/fda7d88c5b704ae39f002591a2e39ec7/csv?layers=0"
				},
				{
					"@type": "dcat:Distribution",
					"title": "Shapefile",
					"format": "ZIP",
					"mediaType": "application/zip",
					"accessURL": "https://www.pacificgeoportal.com/api/download/v1/items/fda7d88c5b704ae39f002591a2e39ec7/shapefile?layers=0"
				},
				{
					"@type": "dcat:Distribution",
					"title": "GeoJSON",
					"format": "GeoJSON",
					"mediaType": "application/vnd.geo+json",
					"accessURL": "https://www.pacificgeoportal.com/api/download/v1/items/fda7d88c5b704ae39f002591a2e39ec7/geojson?layers=0"
				},
				{
					"@type": "dcat:Distribution",
					"title": "KML",
					"format": "KML",
					"mediaType": "application/vnd.google-earth.kml+xml",
					"accessURL": "https://www.pacificgeoportal.com/api/download/v1/items/fda7d88c5b704ae39f002591a2e39ec7/kml?layers=0"
				},
				{
					"@type": "dcat:Distribution",
					"title": "File Geodatabase",
					"format": "ZIP",
					"mediaType": "application/zip",
					"accessURL": "https://www.pacificgeoportal.com/api/download/v1/items/fda7d88c5b704ae39f002591a2e39ec7/filegdb?layers=0"
				},
				{
					"@type": "dcat:Distribution",
					"title": "Feature Collection",
					"format": "TXT",
					"mediaType": "text/plain",
					"accessURL": "https://www.pacificgeoportal.com/api/download/v1/items/fda7d88c5b704ae39f002591a2e39ec7/featureCollection?layers=0"
				},
				{
					"@type": "dcat:Distribution",
					"title": "Excel",
					"format": "XLSX",
					"mediaType": "application/vnd.ms-excel",
					"accessURL": "https://www.pacificgeoportal.com/api/download/v1/items/fda7d88c5b704ae39f002591a2e39ec7/excel?layers=0"
				},
				{
					"@type": "dcat:Distribution",
					"title": "GeoPackage",
					"format": "GPKG",
					"mediaType": "application/geopackage+sqlite3",
					"accessURL": "https://www.pacificgeoportal.com/api/download/v1/items/fda7d88c5b704ae39f002591a2e39ec7/geoPackage?layers=0"
				},
				{
					"@type": "dcat:Distribution",
					"title": "SQLite Geodatabase",
					"format": "GDB",
					"mediaType": "application/geopackage+sqlite3",
					"accessURL": "https://www.pacificgeoportal.com/api/download/v1/items/fda7d88c5b704ae39f002591a2e39ec7/sqlite?layers=0"
				}
			],
			"theme": [
				"geospatial"
			]
		},
		{
			"@type": "dcat:Dataset",
			"identifier": "https://www.arcgis.com/home/item.html?id=44ba33a512044f13a585967a43ab8004&sublayer=0",
			"landingPage": "https://www.pacificgeoportal.com/datasets/eaglegis::nz-subdivision-boundaries-2020-mature-support",
			"title": "NZ Subdivision boundaries 2020 (Mature Support)",
			"description": "<font size='3'><b><span style='color:firebrick;'>Important Note:</span></b><b> This item is in<span style='color:#C00000;'> mature support</span> as of January 2024 and will retire in January 2025.</b><b><span> When you need the most recent boundary layer please use <a href='https://www.arcgis.com/home/item.html?id=4f0cb6eb82ea4a12a3a749067b6ee1fd' rel='nofollow ugc'>this item</a>. When you need the boundaries for a specific year, please use <a href='https://www.arcgis.com/home/item.html?id=725ccdca733d49268ff6a707d20cf14e' rel='nofollow ugc'>this item</a> and set a filter on the required year.</span></b><br /><br /></font><div><br /><font size='3' style='font-family: \"Avenir Next W01\", \"Avenir Next W00\", \"Avenir Next\", Avenir, \"Helvetica Neue\", Helvetica, Arial, sans-serif !important;'>Topicality: 01-01-2020</font><div style=''><font size='3' style='font-family: \"Avenir Next W01\", \"Avenir Next W00\", \"Avenir Next\", Avenir, \"Helvetica Neue\", Helvetica, Arial, sans-serif !important; font-size: 17px;'>Projection: New Zealand Transverse Mercator (NZTM)<font face='Avenir Next W01, Avenir Next W00, Avenir Next, Avenir, Helvetica Neue, Helvetica, Arial, sans-serif'><br /></font></font><div style='font-family: \"Avenir Next W01\", \"Avenir Next W00\", \"Avenir Next\", Avenir, \"Helvetica Neue\", Helvetica, Arial, sans-serif !important; font-size: 17px;'><font size='3'><br /></font></div><div style='font-family: \"Avenir Next W01\", \"Avenir Next W00\", \"Avenir Next\", Avenir, \"Helvetica Neue\", Helvetica, Arial, sans-serif !important; font-size: 17px;'><font size='3'><font face='Avenir Next W01, Avenir Next W00, Avenir Next, Avenir, Helvetica Neue, Helvetica, Arial, sans-serif'>This layer is based on the </font>definitive set of </font><span style='font-family: \"Avenir Next W01\", \"Avenir Next W00\", \"Avenir Next\", Avenir, \"Helvetica Neue\", sans-serif;'>Territorial Authority Subdivision boundaries</span><font size='3'> for 2020 as defined by the regional councils and Local Government Commission but maintained by Stats NZ (the custodian).<font face='Avenir Next W01, Avenir Next W00, Avenir Next, Avenir, Helvetica Neue, Helvetica, Arial, sans-serif'> </font></font></div><div style='font-family: \"Avenir Next W01\", \"Avenir Next W00\", \"Avenir Next\", Avenir, \"Helvetica Neue\", Helvetica, Arial, sans-serif !important; font-size: 17px;'><font size='3'><font face='Avenir Next W01, Avenir Next W00, Avenir Next, Avenir, Helvetica Neue, Helvetica, Arial, sans-serif'><br /></font></font></div><div style=''><font size='3' style=''><font face='Avenir Next W01, Avenir Next W00, Avenir Next, Avenir, Helvetica Neue, Helvetica, Arial, sans-serif' style=''><div style=''>Subdivisions are set up under the Local Government Act 2002 and Local Electoral Act 2001. A subdivision is a division of a community or local board area for electoral purposes.</div><div style=''><br /></div><div style=''>Subdivisions are defined at meshblock level, and do not coincide with the  statistical area 1 (SA1) geography or the statistical area 2 (SA2) geography. A  number of territorial authorities do not have subdivisions, and if they do, the  subdivisions do not necessarily cover the whole territorial authority area.  Subdivisions nest within community or local boards. Where a community or  local board is divided into subdivisions all of the community or local board area  must be included in a subdivision.<br /></div><div style=''><br /></div><div style=''>Subdivisions are numbered based on their corresponding territorial authority. Each subdivision has a unique five-digit number. The first three digits refer to the territorial authority that the subdivision lies within. The following two digits are sequential, and represent the number of subdivisions within the territorial authority. For example, Southland District (073) has two subdivisions numbered 07301 and 07302. The rest of the district is not represented by a subdivision and is coded 07399 (Area Outside Subdivision).<br /></div><div style=''><br /></div><div style=''><div style='font-size: 17px;'><font size='3'>The official dataset can be found on<font face='Avenir Next W01, Avenir Next W00, Avenir Next, Avenir, Helvetica Neue, Helvetica, Arial, sans-serif'> </font></font><a href='https://datafinder.stats.govt.nz/data/category/annual-boundaries/2020/' style='font-size: medium;' target='_blank' rel='nofollow ugc noopener noreferrer'>https://datafinder.stats.govt.nz.</a></div><div style='font-size: 17px;'><br /></div><div style='font-size: 17px;'><div><font size='3'>This layer contains the following attributes (see data tab):</font></div><div><ul><li><font size='3'>Territorial Authority Subdivision code</font></li><li><font size='3'>Territorial Authority Subdivision name</font></li><li><font size='3'>Total area in square kilometers</font></li><li><font size='3'>Total land area in square kilometers.</font></li></ul><div><font size='3'>The layer is further generalised by Eagle Technology for improved performance on the web, <span style='font-family: \"Avenir Next W01\", \"Avenir Next W00\", \"Avenir Next\", Avenir, \"Helvetica Neue\", sans-serif;'>therefore it doesn't fully represent the official boundaries.</span><br /></font></div></div></div><div style='font-size: 17px;'><font size='3'><br /></font></div><div style='font-size: 17px;'><div><font color='#2f4f4f' size='3'>This layer is offered by Eagle Technology (Official Esri Distributor). Eagle Technology offers services that can be used in the ArcGIS platform. The Content team at Eagle Technology updates the layers on a regular basis and regularly adds new content to the Living Atlas. By using this content and combining it with other data you can create new information products quickly and easily.</font></div><div><font color='#2f4f4f' size='3'><br /></font></div><div><font size='3'><font color='#2f4f4f'>If you have any questions or comments about the content, please let us now  at </font><a href='mailto:livingatlas@eagle.co.nz' style='color: rgb(0, 121, 193); text-decoration-line: none;' target='_blank' rel='nofollow ugc noopener noreferrer'>livingatlas@eagle.co.nz</a></font></div></div></div></font></font></div></div></div>",
			"keyword": [
				"eaglegis",
				"mature support",
				"retiring",
				"deprecated"
			],
			"issued": "2020-01-11T10:22:21.000Z",
			"modified": "2021-02-10T03:39:16.044Z",
			"publisher": {
				"name": "Eagle Technology Group Ltd"
			},
			"contactPoint": {
				"@type": "vcard:Contact",
				"fn": "eaglegis",
				"hasEmail": "mailto:ts@eaglegis.co.nz"
			},
			"accessLevel": "public",
			"spatial": "166.2620,-47.2230,-177.6190,-33.7734",
			"license": "https://creativecommons.org/licenses/by/4.0",
			"distribution": [
				{
					"@type": "dcat:Distribution",
					"title": "ArcGIS Hub Dataset",
					"format": "Web Page",
					"mediaType": "text/html",
					"accessURL": "https://www.pacificgeoportal.com/datasets/eaglegis::nz-subdivision-boundaries-2020-mature-support"
				},
				{
					"@type": "dcat:Distribution",
					"title": "ArcGIS GeoService",
					"format": "ArcGIS GeoServices REST API",
					"mediaType": "application/json",
					"accessURL": "https://services.arcgis.com/XTtANUDT8Va4DLwI/arcgis/rest/services/Subdivision_2020_Clipped_generalised/FeatureServer/0"
				},
				{
					"@type": "dcat:Distribution",
					"title": "CSV",
					"format": "CSV",
					"mediaType": "text/csv",
					"accessURL": "https://www.pacificgeoportal.com/api/download/v1/items/44ba33a512044f13a585967a43ab8004/csv?layers=0"
				},
				{
					"@type": "dcat:Distribution",
					"title": "Shapefile",
					"format": "ZIP",
					"mediaType": "application/zip",
					"accessURL": "https://www.pacificgeoportal.com/api/download/v1/items/44ba33a512044f13a585967a43ab8004/shapefile?layers=0"
				},
				{
					"@type": "dcat:Distribution",
					"title": "GeoJSON",
					"format": "GeoJSON",
					"mediaType": "application/vnd.geo+json",
					"accessURL": "https://www.pacificgeoportal.com/api/download/v1/items/44ba33a512044f13a585967a43ab8004/geojson?layers=0"
				},
				{
					"@type": "dcat:Distribution",
					"title": "KML",
					"format": "KML",
					"mediaType": "application/vnd.google-earth.kml+xml",
					"accessURL": "https://www.pacificgeoportal.com/api/download/v1/items/44ba33a512044f13a585967a43ab8004/kml?layers=0"
				},
				{
					"@type": "dcat:Distribution",
					"title": "File Geodatabase",
					"format": "ZIP",
					"mediaType": "application/zip",
					"accessURL": "https://www.pacificgeoportal.com/api/download/v1/items/44ba33a512044f13a585967a43ab8004/filegdb?layers=0"
				},
				{
					"@type": "dcat:Distribution",
					"title": "Feature Collection",
					"format": "TXT",
					"mediaType": "text/plain",
					"accessURL": "https://www.pacificgeoportal.com/api/download/v1/items/44ba33a512044f13a585967a43ab8004/featureCollection?layers=0"
				},
				{
					"@type": "dcat:Distribution",
					"title": "Excel",
					"format": "XLSX",
					"mediaType": "application/vnd.ms-excel",
					"accessURL": "https://www.pacificgeoportal.com/api/download/v1/items/44ba33a512044f13a585967a43ab8004/excel?layers=0"
				},
				{
					"@type": "dcat:Distribution",
					"title": "GeoPackage",
					"format": "GPKG",
					"mediaType": "application/geopackage+sqlite3",
					"accessURL": "https://www.pacificgeoportal.com/api/download/v1/items/44ba33a512044f13a585967a43ab8004/geoPackage?layers=0"
				},
				{
					"@type": "dcat:Distribution",
					"title": "SQLite Geodatabase",
					"format": "GDB",
					"mediaType": "application/geopackage+sqlite3",
					"accessURL": "https://www.pacificgeoportal.com/api/download/v1/items/44ba33a512044f13a585967a43ab8004/sqlite?layers=0"
				}
			],
			"theme": [
				"geospatial"
			]
		},
		{
			"@type": "dcat:Dataset",
			"identifier": "https://www.arcgis.com/home/item.html?id=974a62a34c874c55b1be766e75095b17&sublayer=0",
			"landingPage": "https://www.pacificgeoportal.com/datasets/eaglegis::nz-subdivision-boundaries-2019-mature-support",
			"title": "NZ Subdivision boundaries 2019 (Mature Support)",
			"description": "<font size='3'><b><span style='color:firebrick;'>Important Note:</span></b><b> This item is in<span style='color:#C00000;'> mature support</span> as of January 2024 and will retire in January 2025.</b><b><span> When you need the most recent boundary layer please use <a href='https://www.arcgis.com/home/item.html?id=4f0cb6eb82ea4a12a3a749067b6ee1fd' rel='nofollow ugc'>this item</a>. When you need the boundaries for a specific year, please use <a href='https://www.arcgis.com/home/item.html?id=725ccdca733d49268ff6a707d20cf14e' rel='nofollow ugc'>this item</a> and set a filter on the required year.</span></b><br /><br /></font><div><br /><font size='3' style='font-family: \"Avenir Next W01\", \"Avenir Next W00\", \"Avenir Next\", Avenir, \"Helvetica Neue\", Helvetica, Arial, sans-serif !important;'>Topicality: 01-01-2019</font><div style=''><font size='3' style='font-family: \"Avenir Next W01\", \"Avenir Next W00\", \"Avenir Next\", Avenir, \"Helvetica Neue\", Helvetica, Arial, sans-serif !important; font-size: 17px;'>Projection: New Zealand Transverse Mercator (NZTM)<font face='Avenir Next W01, Avenir Next W00, Avenir Next, Avenir, Helvetica Neue, Helvetica, Arial, sans-serif'><br /></font></font><div style='font-family: \"Avenir Next W01\", \"Avenir Next W00\", \"Avenir Next\", Avenir, \"Helvetica Neue\", Helvetica, Arial, sans-serif !important; font-size: 17px;'><font size='3'><br /></font></div><div style='font-family: \"Avenir Next W01\", \"Avenir Next W00\", \"Avenir Next\", Avenir, \"Helvetica Neue\", Helvetica, Arial, sans-serif !important; font-size: 17px;'><font size='3'><font face='Avenir Next W01, Avenir Next W00, Avenir Next, Avenir, Helvetica Neue, Helvetica, Arial, sans-serif'>This layer is based on the </font>definitive set of </font><span style='font-family: \"Avenir Next W01\", \"Avenir Next W00\", \"Avenir Next\", Avenir, \"Helvetica Neue\", sans-serif;'>Territorial Authority Subdivision boundaries</span><font size='3'> for 2019 as defined by the regional councils and Local Government Commission but maintained by Stats NZ (the custodian).<font face='Avenir Next W01, Avenir Next W00, Avenir Next, Avenir, Helvetica Neue, Helvetica, Arial, sans-serif'> </font></font></div><div style='font-family: \"Avenir Next W01\", \"Avenir Next W00\", \"Avenir Next\", Avenir, \"Helvetica Neue\", Helvetica, Arial, sans-serif !important; font-size: 17px;'><font size='3'><font face='Avenir Next W01, Avenir Next W00, Avenir Next, Avenir, Helvetica Neue, Helvetica, Arial, sans-serif'><br /></font></font></div><div style=''><font size='3' style=''><font face='Avenir Next W01, Avenir Next W00, Avenir Next, Avenir, Helvetica Neue, Helvetica, Arial, sans-serif' style=''><div style=''>Subdivisions are set up under the Local Government Act 2002 and Local Electoral Act 2001. A subdivision is a division of a community or local board area for electoral purposes.</div><div style=''><br /></div><div style=''>Subdivisions are defined at meshblock level, and do not coincide with the  statistical area 1 (SA1) geography or the statistical area 2 (SA2) geography. A  number of territorial authorities do not have subdivisions, and if they do, the  subdivisions do not necessarily cover the whole territorial authority area.  Subdivisions nest within community or local boards. Where a community or  local board is divided into subdivisions all of the community or local board area  must be included in a subdivision.<br /></div><div style=''><br /></div><div style=''>Subdivisions are numbered based on their corresponding territorial authority. Each subdivision has a unique five-digit number. The first three digits refer to the territorial authority that the subdivision lies within. The following two digits are sequential, and represent the number of subdivisions within the territorial authority. For example, Southland District (073) has two subdivisions numbered 07301 and 07302. The rest of the district is not represented by a subdivision and is coded 07399 (Area Outside Subdivision).<br /></div><div style=''><br /></div><div style=''><div style='font-size: 17px;'><font size='3'>The official dataset can be found on<font face='Avenir Next W01, Avenir Next W00, Avenir Next, Avenir, Helvetica Neue, Helvetica, Arial, sans-serif'> </font></font><a href='https://datafinder.stats.govt.nz/layer/98756-subdivision-2019-clipped-generalised/' style='font-size: medium;' target='_blank' rel='nofollow ugc noopener noreferrer'>https://datafinder.stats.govt.nz.</a></div><div style='font-size: 17px;'><br /></div><div style='font-size: 17px;'><div><font size='3'>This layer contains the following attributes (see data tab):</font></div><div><ul><li><font size='3'>Territorial Authority Subdivision code</font></li><li><font size='3'>Territorial Authority Subdivision name</font></li><li><font size='3'>Total area in square kilometers</font></li><li><font size='3'>Total land area in square kilometers.</font></li></ul><div><font size='3'>The layer is further generalised by Eagle Technology for improved performance on the web, <span style='font-family: \"Avenir Next W01\", \"Avenir Next W00\", \"Avenir Next\", Avenir, \"Helvetica Neue\", sans-serif;'>therefore it doesn't fully represent the official boundaries.</span><br /></font></div></div></div><div style='font-size: 17px;'><font size='3'><br /></font></div><div style='font-size: 17px;'><div><font color='#2f4f4f' size='3'>This layer is offered by Eagle Technology (Official Esri Distributor). Eagle Technology offers services that can be used in the ArcGIS platform. The Content team at Eagle Technology updates the layers on a regular basis and regularly adds new content to the Living Atlas. By using this content and combining it with other data you can create new information products quickly and easily.</font></div><div><font color='#2f4f4f' size='3'><br /></font></div><div><font size='3'><font color='#2f4f4f'>If you have any questions or comments about the content, please let us now  at </font><a href='mailto:livingatlas@eagle.co.nz.' style='color: rgb(0, 121, 193); text-decoration-line: none;' target='_blank' rel='nofollow ugc noopener noreferrer'>livingatlas@eagle.co.nz</a></font></div></div></div></font></font></div></div></div>",
			"keyword": [
				"eaglegis",
				"mature support",
				"retiring",
				"deprecated"
			],
			"issued": "2018-12-21T13:01:22.000Z",
			"modified": "2020-01-13T02:16:04.118Z",
			"publisher": {
				"name": "Eagle Technology Group Ltd"
			},
			"contactPoint": {
				"@type": "vcard:Contact",
				"fn": "eaglegis",
				"hasEmail": "mailto:ts@eaglegis.co.nz"
			},
			"accessLevel": "public",
			"spatial": "166.2620,-47.2230,-177.6196,-33.7735",
			"license": "https://creativecommons.org/licenses/by/4.0",
			"distribution": [
				{
					"@type": "dcat:Distribution",
					"title": "ArcGIS Hub Dataset",
					"format": "Web Page",
					"mediaType": "text/html",
					"accessURL": "https://www.pacificgeoportal.com/datasets/eaglegis::nz-subdivision-boundaries-2019-mature-support"
				},
				{
					"@type": "dcat:Distribution",
					"title": "ArcGIS GeoService",
					"format": "ArcGIS GeoServices REST API",
					"mediaType": "application/json",
					"accessURL": "https://services.arcgis.com/XTtANUDT8Va4DLwI/arcgis/rest/services/TA_Subdivision_2019_generalised/FeatureServer/0"
				},
				{
					"@type": "dcat:Distribution",
					"title": "CSV",
					"format": "CSV",
					"mediaType": "text/csv",
					"accessURL": "https://www.pacificgeoportal.com/api/download/v1/items/974a62a34c874c55b1be766e75095b17/csv?layers=0"
				},
				{
					"@type": "dcat:Distribution",
					"title": "Shapefile",
					"format": "ZIP",
					"mediaType": "application/zip",
					"accessURL": "https://www.pacificgeoportal.com/api/download/v1/items/974a62a34c874c55b1be766e75095b17/shapefile?layers=0"
				},
				{
					"@type": "dcat:Distribution",
					"title": "GeoJSON",
					"format": "GeoJSON",
					"mediaType": "application/vnd.geo+json",
					"accessURL": "https://www.pacificgeoportal.com/api/download/v1/items/974a62a34c874c55b1be766e75095b17/geojson?layers=0"
				},
				{
					"@type": "dcat:Distribution",
					"title": "KML",
					"format": "KML",
					"mediaType": "application/vnd.google-earth.kml+xml",
					"accessURL": "https://www.pacificgeoportal.com/api/download/v1/items/974a62a34c874c55b1be766e75095b17/kml?layers=0"
				}
			],
			"theme": [
				"geospatial"
			]
		},
		{
			"@type": "dcat:Dataset",
			"identifier": "https://www.arcgis.com/home/item.html?id=315aa626ecec4825ab6f685e785c79fb&sublayer=0",
			"landingPage": "https://www.pacificgeoportal.com/datasets/eaglegis::nz-subdivision-boundaries-2018-mature-support",
			"title": "NZ Subdivision boundaries 2018 (Mature Support)",
			"description": "<font size='3'><b><span style='color:firebrick;'>Important Note:</span></b><b> This item is in<span style='color:#C00000;'> mature support</span> as of January 2024 and will retire in January 2025.</b><b><span> When you need the most recent boundary layer please use <a href='https://www.arcgis.com/home/item.html?id=4f0cb6eb82ea4a12a3a749067b6ee1fd' rel='nofollow ugc'>this item</a>. When you need the boundaries for a specific year, please use <a href='https://www.arcgis.com/home/item.html?id=725ccdca733d49268ff6a707d20cf14e' rel='nofollow ugc'>this item</a> and set a filter on the required year.</span></b><br /><br /></font><div><br /><font size='3' style='font-family: \"Avenir Next W01\", \"Avenir Next W00\", \"Avenir Next\", Avenir, \"Helvetica Neue\", Helvetica, Arial, sans-serif !important;'>Topicality: 01-01-2018</font><div style=''><font size='3' style='font-family: \"Avenir Next W01\", \"Avenir Next W00\", \"Avenir Next\", Avenir, \"Helvetica Neue\", Helvetica, Arial, sans-serif !important; font-size: 17px;'>Projection: New Zealand Transverse Mercator (NZTM)<font face='Avenir Next W01, Avenir Next W00, Avenir Next, Avenir, Helvetica Neue, Helvetica, Arial, sans-serif'><br /></font></font><div style='font-family: \"Avenir Next W01\", \"Avenir Next W00\", \"Avenir Next\", Avenir, \"Helvetica Neue\", Helvetica, Arial, sans-serif !important; font-size: 17px;'><font size='3'><br /></font></div><div style='font-family: \"Avenir Next W01\", \"Avenir Next W00\", \"Avenir Next\", Avenir, \"Helvetica Neue\", Helvetica, Arial, sans-serif !important; font-size: 17px;'><font size='3'><font face='Avenir Next W01, Avenir Next W00, Avenir Next, Avenir, Helvetica Neue, Helvetica, Arial, sans-serif'>This layer is based on the </font>definitive set of </font><span style='font-family: \"Avenir Next W01\", \"Avenir Next W00\", \"Avenir Next\", Avenir, \"Helvetica Neue\", sans-serif;'>Territorial Authority Subdivision boundaries</span><font size='3'> for 2018 as defined by the regional councils and Local Government Commission but maintained by Stats NZ (the custodian).<font face='Avenir Next W01, Avenir Next W00, Avenir Next, Avenir, Helvetica Neue, Helvetica, Arial, sans-serif'> </font></font></div><div style='font-family: \"Avenir Next W01\", \"Avenir Next W00\", \"Avenir Next\", Avenir, \"Helvetica Neue\", Helvetica, Arial, sans-serif !important; font-size: 17px;'><font size='3'><font face='Avenir Next W01, Avenir Next W00, Avenir Next, Avenir, Helvetica Neue, Helvetica, Arial, sans-serif'><br /></font></font></div><div style=''><font size='3' style=''><font face='Avenir Next W01, Avenir Next W00, Avenir Next, Avenir, Helvetica Neue, Helvetica, Arial, sans-serif' style=''><div style=''>Subdivisions are set up under the Local Government Act 2002 and Local Electoral Act 2001. A subdivision is a division of a community or local board area for electoral purposes.</div><div style=''><br /></div><div style=''>Subdivisions are defined at meshblock level, and do not coincide with the  statistical area 1 (SA1) geography or the statistical area 2 (SA2) geography. A  number of territorial authorities do not have subdivisions, and if they do, the  subdivisions do not necessarily cover the whole territorial authority area.  Subdivisions nest within community or local boards. Where a community or  local board is divided into subdivisions all of the community or local board area  must be included in a subdivision.<br /></div><div style=''><br /></div><div style=''>Subdivisions are numbered based on their corresponding territorial authority. Each subdivision has a unique five-digit number. The first three digits refer to the territorial authority that the subdivision lies within. The following two digits are sequential, and represent the number of subdivisions within the territorial authority. For example, Southland District (073) has two subdivisions numbered 07301 and 07302. The rest of the district is not represented by a subdivision and is coded 07399 (Area Outside Subdivision).<br /></div><div style=''><br /></div><div style=''><div style='font-size: 17px;'><font size='3'>The official dataset can be found on<font face='Avenir Next W01, Avenir Next W00, Avenir Next, Avenir, Helvetica Neue, Helvetica, Arial, sans-serif'> </font></font><a href='https://datafinder.stats.govt.nz/layer/92217-subdivision-2018-clipped-generalised/' style='font-size: medium;' target='_blank' rel='nofollow ugc noopener noreferrer'>https://datafinder.stats.govt.nz.</a></div><div style='font-size: 17px;'><br /></div><div style='font-size: 17px;'><div><font size='3'>This layer contains the following attributes (see data tab):</font></div><div><ul><li><font size='3'>Territorial Authority Subdivision code</font></li><li><font size='3'>Territorial Authority Subdivision name</font></li><li><font size='3'>Total area in square kilometers</font></li><li><font size='3'>Total land area in square kilometers.</font></li></ul><div><font size='3'>The layer is further generalised by Eagle Technology for improved performance on the web, <span style='font-family: \"Avenir Next W01\", \"Avenir Next W00\", \"Avenir Next\", Avenir, \"Helvetica Neue\", sans-serif;'>therefore it doesn't fully represent the official boundaries.</span><br /></font></div></div></div><div style='font-size: 17px;'><font size='3'><br /></font></div><div style='font-size: 17px;'><div><font color='#2f4f4f' size='3'>This layer is offered by Eagle Technology (Official Esri Distributor). Eagle Technology offers services that can be used in the ArcGIS platform. The Content team at Eagle Technology updates the layers on a regular basis and regularly adds new content to the Living Atlas. By using this content and combining it with other data you can create new information products quickly and easily.</font></div><div><font color='#2f4f4f' size='3'><br /></font></div><div><font size='3'><font color='#2f4f4f'>If you have any questions or comments about the content, please let us now  at </font><a href='mailto:livingatlas@eagle.co.nz.' style='color: rgb(0, 121, 193); text-decoration-line: none;' target='_blank' rel='nofollow ugc noopener noreferrer'>livingatlas@eagle.co.nz</a></font></div></div></div></font></font></div></div></div>",
			"keyword": [
				"eaglegis",
				"mature support",
				"retiring",
				"deprecated"
			],
			"issued": "2018-09-13T23:56:18.000Z",
			"modified": "2018-09-14T03:26:00.538Z",
			"publisher": {
				"name": "Eagle Technology Group Ltd"
			},
			"contactPoint": {
				"@type": "vcard:Contact",
				"fn": "eaglegis",
				"hasEmail": "mailto:ts@eaglegis.co.nz"
			},
			"accessLevel": "public",
			"spatial": "166.2620,-47.2230,-177.6196,-33.7735",
			"license": "https://creativecommons.org/licenses/by/4.0",
			"distribution": [
				{
					"@type": "dcat:Distribution",
					"title": "ArcGIS Hub Dataset",
					"format": "Web Page",
					"mediaType": "text/html",
					"accessURL": "https://www.pacificgeoportal.com/datasets/eaglegis::nz-subdivision-boundaries-2018-mature-support"
				},
				{
					"@type": "dcat:Distribution",
					"title": "ArcGIS GeoService",
					"format": "ArcGIS GeoServices REST API",
					"mediaType": "application/json",
					"accessURL": "https://services.arcgis.com/XTtANUDT8Va4DLwI/arcgis/rest/services/NZ_TA_Subdivision_boundaries_2018_generalised/FeatureServer/0"
				},
				{
					"@type": "dcat:Distribution",
					"title": "CSV",
					"format": "CSV",
					"mediaType": "text/csv",
					"accessURL": "https://www.pacificgeoportal.com/api/download/v1/items/315aa626ecec4825ab6f685e785c79fb/csv?layers=0"
				},
				{
					"@type": "dcat:Distribution",
					"title": "Shapefile",
					"format": "ZIP",
					"mediaType": "application/zip",
					"accessURL": "https://www.pacificgeoportal.com/api/download/v1/items/315aa626ecec4825ab6f685e785c79fb/shapefile?layers=0"
				},
				{
					"@type": "dcat:Distribution",
					"title": "GeoJSON",
					"format": "GeoJSON",
					"mediaType": "application/vnd.geo+json",
					"accessURL": "https://www.pacificgeoportal.com/api/download/v1/items/315aa626ecec4825ab6f685e785c79fb/geojson?layers=0"
				},
				{
					"@type": "dcat:Distribution",
					"title": "KML",
					"format": "KML",
					"mediaType": "application/vnd.google-earth.kml+xml",
					"accessURL": "https://www.pacificgeoportal.com/api/download/v1/items/315aa626ecec4825ab6f685e785c79fb/kml?layers=0"
				},
				{
					"@type": "dcat:Distribution",
					"title": "File Geodatabase",
					"format": "ZIP",
					"mediaType": "application/zip",
					"accessURL": "https://www.pacificgeoportal.com/api/download/v1/items/315aa626ecec4825ab6f685e785c79fb/filegdb?layers=0"
				},
				{
					"@type": "dcat:Distribution",
					"title": "Feature Collection",
					"format": "TXT",
					"mediaType": "text/plain",
					"accessURL": "https://www.pacificgeoportal.com/api/download/v1/items/315aa626ecec4825ab6f685e785c79fb/featureCollection?layers=0"
				},
				{
					"@type": "dcat:Distribution",
					"title": "Excel",
					"format": "XLSX",
					"mediaType": "application/vnd.ms-excel",
					"accessURL": "https://www.pacificgeoportal.com/api/download/v1/items/315aa626ecec4825ab6f685e785c79fb/excel?layers=0"
				},
				{
					"@type": "dcat:Distribution",
					"title": "GeoPackage",
					"format": "GPKG",
					"mediaType": "application/geopackage+sqlite3",
					"accessURL": "https://www.pacificgeoportal.com/api/download/v1/items/315aa626ecec4825ab6f685e785c79fb/geoPackage?layers=0"
				},
				{
					"@type": "dcat:Distribution",
					"title": "SQLite Geodatabase",
					"format": "GDB",
					"mediaType": "application/geopackage+sqlite3",
					"accessURL": "https://www.pacificgeoportal.com/api/download/v1/items/315aa626ecec4825ab6f685e785c79fb/sqlite?layers=0"
				}
			],
			"theme": [
				"geospatial"
			]
		},
		{
			"@type": "dcat:Dataset",
			"identifier": "https://www.arcgis.com/home/item.html?id=5e559f2d5ea048b884138df646b51344&sublayer=0",
			"landingPage": "https://www.pacificgeoportal.com/datasets/eaglegis::nz-statistical-areas-2-2021-mature-support",
			"title": "NZ Statistical Areas 2 - 2021 (Mature Support)",
			"description": "<font size='3'><b><span style='color:firebrick;'>Important Note:</span></b><b> This item is in<span style='color:#C00000;'> mature support</span> as of January 2024 and will retire in January 2025.</b><b><span> When you need the most recent boundary layer please use <a href='https://www.arcgis.com/home/item.html?id=6b4508cfd8c4445fb5074aacd13eb4b8' rel='nofollow ugc'>this item</a>. When you need the boundaries for a specific year, please use <a href='https://www.arcgis.com/home/item.html?id=a3422b4ed51645919308d5f595770eff' rel='nofollow ugc'>this item</a> and set a filter on the required year.</span></b><br /><br /></font><div><br /><div style='font-size:17px; font-family:\"Avenir Next W01\", \"Avenir Next W00\", \"Avenir Next\", Avenir, \"Helvetica Neue\", Helvetica, Arial, sans-serif !important;'><font size='3'>Topicality: 01-01-2021</font></div><div style='font-size:17px; font-family:\"Avenir Next W01\", \"Avenir Next W00\", \"Avenir Next\", Avenir, \"Helvetica Neue\", Helvetica, Arial, sans-serif !important;'><div><span style='font-size:medium;'>Projection: New Zealand Transverse Mercator (NZTM)</span><br /></div><div></div></div><div style='font-size:17px; font-family:\"Avenir Next W01\", \"Avenir Next W00\", \"Avenir Next\", Avenir, \"Helvetica Neue\", Helvetica, Arial, sans-serif !important;'><br /></div><div style='font-size:17px; font-family:\"Avenir Next W01\", \"Avenir Next W00\", \"Avenir Next\", Avenir, \"Helvetica Neue\", Helvetica, Arial, sans-serif !important;'>Statistical area 2 (SA2) is a new output geography that provides higher\naggregations of population data than can be provided at the <a href='https://datafinder.stats.govt.nz/data/category/annual-boundaries/2021/' target='_blank' rel='nofollow ugc noopener noreferrer'>statistical area 1 (SA1)</a> level. The SA2 geography aims to reflect communities that interact\ntogether socially and economically. In populated areas, SA2s generally contain\nsimilar sized populations.<font size='3'><br /></font></div><div style='font-size:17px; font-family:\"Avenir Next W01\", \"Avenir Next W00\", \"Avenir Next\", Avenir, \"Helvetica Neue\", Helvetica, Arial, sans-serif !important;'><br /></div><font size='3' style='font-family:\"Avenir Next W01\", \"Avenir Next W00\", \"Avenir Next\", Avenir, \"Helvetica Neue\", Helvetica, Arial, sans-serif !important;'><span style='font-family:\"Avenir Next W01\", \"Avenir Next W00\", \"Avenir Next\", Avenir, \"Helvetica Neue\", sans-serif;'>This layer contains the definitive set of statistical area 2 (SA2) boundaries for 2021 as defined by Stats NZ.</span><span style='font-family:\"Avenir Next W01\", \"Avenir Next W00\", \"Avenir Next\", Avenir, \"Helvetica Neue\", sans-serif;'> </span></font><span style='font-family:\"Avenir Next W01\", \"Avenir Next W00\", \"Avenir Next\", Avenir, \"Helvetica Neue\", Helvetica, Arial, sans-serif; font-size:17px;'>Statistical area 2 (SA2) is a new output geography that provides higher aggregations of population data than can be provided at the statistical area 1 (SA1) level. The SA2 geography aims to reflect communities that interact together socially and economically. In populated areas, SA2s generally contain similar sized populations.</span><div style='font-size:17px; font-family:\"Avenir Next W01\", \"Avenir Next W00\", \"Avenir Next\", Avenir, \"Helvetica Neue\", Helvetica, Arial, sans-serif !important;'><font size='3'><br /></font></div><div style='font-size:17px; font-family:\"Avenir Next W01\", \"Avenir Next W00\", \"Avenir Next\", Avenir, \"Helvetica Neue\", Helvetica, Arial, sans-serif !important;'><font size='3'><font>This layer shows the data for 2021. If you would like to use the layer that gets updated yearly with the latest boundary data, you can use <a href='https://www.arcgis.com/home/item.html?id=6b4508cfd8c4445fb5074aacd13eb4b8' target='_blank' rel='nofollow ugc noopener noreferrer'>this item</a>.<br /><br />All the boundary layers can be found <a href='https://www.arcgis.com/home/group.html?id=8047736c3e43467aa62241976851eff9' target='_blank' rel='nofollow ugc noopener noreferrer'>here</a>.<br /><br />All the boundary layers that are updated yearly can be found <a href='https://www.arcgis.com/home/group.html?id=b22e4f0012a8426dac21cd3d02f25c67' target='_blank' rel='nofollow ugc noopener noreferrer'>here</a>.<br /><br />The official dataset can be found on </font></font><a href='https://datafinder.stats.govt.nz/layer/98766-statistical-area-2-2021-clipped-generalised/' target='_blank' rel='nofollow ugc noopener noreferrer'>https://datafinder.stats.govt.nz</a><font size='3'>.</font></div><div style='font-size:17px; font-family:\"Avenir Next W01\", \"Avenir Next W00\", \"Avenir Next\", Avenir, \"Helvetica Neue\", Helvetica, Arial, sans-serif !important;'><br /></div><div style='font-family:\"Avenir Next W01\", \"Avenir Next W00\", \"Avenir Next\", Avenir, \"Helvetica Neue\", Helvetica, Arial, sans-serif; font-size:17px;'><font size='3'>This layer contains the following attributes (see data tab):</font></div><div style='font-family:\"Avenir Next W01\", \"Avenir Next W00\", \"Avenir Next\", Avenir, \"Helvetica Neue\", Helvetica, Arial, sans-serif;'><ul><li><font size='3'>Statistical Area 2 code<br /></font></li><li><font size='3'>Statistical Area 2 name</font></li><li><font size='3'>Total area in square kilometers</font></li><li><font size='3'>Total land area in square kilometers.</font></li></ul></div><div style='font-size:17px; font-family:\"Avenir Next W01\", \"Avenir Next W00\", \"Avenir Next\", Avenir, \"Helvetica Neue\", Helvetica, Arial, sans-serif !important;'><font size='3'>The layer is further generalised by Eagle Technology for improved performance on the web, therefore it doesn't fully represent the official boundaries.</font></div><div style='font-size:17px; font-family:\"Avenir Next W01\", \"Avenir Next W00\", \"Avenir Next\", Avenir, \"Helvetica Neue\", Helvetica, Arial, sans-serif !important;'><font size='3'><br /></font></div><div style='font-size:17px; font-family:\"Avenir Next W01\", \"Avenir Next W00\", \"Avenir Next\", Avenir, \"Helvetica Neue\", Helvetica, Arial, sans-serif !important;'><div><font color='#2f4f4f' size='3'>This layer is offered by Eagle Technology (Official Esri Distributor). Eagle Technology offers services that can be used in the ArcGIS platform. The Content team at Eagle Technology updates the layers on a regular basis and regularly adds new content to the Living Atlas. By using this content and combining it with other data you can create new information products quickly and easily.</font></div><div><font color='#2f4f4f' size='3'><br /></font></div><div><font size='3'><font color='#2f4f4f'>If you have any questions or comments about the content, please let us now  at </font><a href='mailto:livingatlas@eagle.co.nz' style='color:rgb(0, 121, 193); text-decoration-line:none;' target='_blank' rel='nofollow ugc noopener noreferrer'>livingatlas@eagle.co.nz</a>.</font></div></div></div>",
			"keyword": [
				"eaglegis",
				"mature support",
				"retiring",
				"deprecated"
			],
			"issued": "2021-02-04T02:21:29.000Z",
			"modified": "2021-02-15T23:03:34.526Z",
			"publisher": {
				"name": "Eagle Technology Group Ltd"
			},
			"contactPoint": {
				"@type": "vcard:Contact",
				"fn": "eaglegis",
				"hasEmail": "mailto:ts@eaglegis.co.nz"
			},
			"accessLevel": "public",
			"spatial": "166.2620,-47.2230,-177.6189,-33.7734",
			"license": "https://creativecommons.org/licenses/by/4.0",
			"distribution": [
				{
					"@type": "dcat:Distribution",
					"title": "ArcGIS Hub Dataset",
					"format": "Web Page",
					"mediaType": "text/html",
					"accessURL": "https://www.pacificgeoportal.com/datasets/eaglegis::nz-statistical-areas-2-2021-mature-support"
				},
				{
					"@type": "dcat:Distribution",
					"title": "ArcGIS GeoService",
					"format": "ArcGIS GeoServices REST API",
					"mediaType": "application/json",
					"accessURL": "https://services.arcgis.com/XTtANUDT8Va4DLwI/arcgis/rest/services/nz_statistical_areas_2_2021/FeatureServer/0"
				},
				{
					"@type": "dcat:Distribution",
					"title": "CSV",
					"format": "CSV",
					"mediaType": "text/csv",
					"accessURL": "https://www.pacificgeoportal.com/api/download/v1/items/5e559f2d5ea048b884138df646b51344/csv?layers=0"
				},
				{
					"@type": "dcat:Distribution",
					"title": "Shapefile",
					"format": "ZIP",
					"mediaType": "application/zip",
					"accessURL": "https://www.pacificgeoportal.com/api/download/v1/items/5e559f2d5ea048b884138df646b51344/shapefile?layers=0"
				},
				{
					"@type": "dcat:Distribution",
					"title": "GeoJSON",
					"format": "GeoJSON",
					"mediaType": "application/vnd.geo+json",
					"accessURL": "https://www.pacificgeoportal.com/api/download/v1/items/5e559f2d5ea048b884138df646b51344/geojson?layers=0"
				},
				{
					"@type": "dcat:Distribution",
					"title": "KML",
					"format": "KML",
					"mediaType": "application/vnd.google-earth.kml+xml",
					"accessURL": "https://www.pacificgeoportal.com/api/download/v1/items/5e559f2d5ea048b884138df646b51344/kml?layers=0"
				},
				{
					"@type": "dcat:Distribution",
					"title": "File Geodatabase",
					"format": "ZIP",
					"mediaType": "application/zip",
					"accessURL": "https://www.pacificgeoportal.com/api/download/v1/items/5e559f2d5ea048b884138df646b51344/filegdb?layers=0"
				},
				{
					"@type": "dcat:Distribution",
					"title": "Feature Collection",
					"format": "TXT",
					"mediaType": "text/plain",
					"accessURL": "https://www.pacificgeoportal.com/api/download/v1/items/5e559f2d5ea048b884138df646b51344/featureCollection?layers=0"
				},
				{
					"@type": "dcat:Distribution",
					"title": "Excel",
					"format": "XLSX",
					"mediaType": "application/vnd.ms-excel",
					"accessURL": "https://www.pacificgeoportal.com/api/download/v1/items/5e559f2d5ea048b884138df646b51344/excel?layers=0"
				},
				{
					"@type": "dcat:Distribution",
					"title": "GeoPackage",
					"format": "GPKG",
					"mediaType": "application/geopackage+sqlite3",
					"accessURL": "https://www.pacificgeoportal.com/api/download/v1/items/5e559f2d5ea048b884138df646b51344/geoPackage?layers=0"
				},
				{
					"@type": "dcat:Distribution",
					"title": "SQLite Geodatabase",
					"format": "GDB",
					"mediaType": "application/geopackage+sqlite3",
					"accessURL": "https://www.pacificgeoportal.com/api/download/v1/items/5e559f2d5ea048b884138df646b51344/sqlite?layers=0"
				}
			],
			"theme": [
				"geospatial"
			]
		},
		{
			"@type": "dcat:Dataset",
			"identifier": "https://www.arcgis.com/home/item.html?id=b6b10fe7e48e47658b1fec94a15d5709&sublayer=0",
			"landingPage": "https://www.pacificgeoportal.com/datasets/eaglegis::nz-statistical-area-2-boundaries-2020-mature-support",
			"title": "NZ Statistical Area 2 boundaries 2020 (Mature Support)",
			"description": "<font size='3'><b><span style='color:firebrick;'>Important Note:</span></b><b> This item is in<span style='color:#C00000;'> mature support</span> as of January 2024 and will retire in January 2025.</b><b><span> When you need the most recent boundary layer please use <a href='https://www.arcgis.com/home/item.html?id=6b4508cfd8c4445fb5074aacd13eb4b8' rel='nofollow ugc'>this item</a>. When you need the boundaries for a specific year, please use <a href='https://www.arcgis.com/home/item.html?id=a3422b4ed51645919308d5f595770eff' rel='nofollow ugc'>this item</a> and set a filter on the required year.</span></b><br /><br /></font><div><br /><div style='font-size:17px; font-family:\"Avenir Next W01\", \"Avenir Next W00\", \"Avenir Next\", Avenir, \"Helvetica Neue\", Helvetica, Arial, sans-serif !important;'><font size='3'>Topicality: 01-01-2020</font></div><div style='font-size:17px; font-family:\"Avenir Next W01\", \"Avenir Next W00\", \"Avenir Next\", Avenir, \"Helvetica Neue\", Helvetica, Arial, sans-serif !important;'><div><span style='font-size:medium;'>Projection: New Zealand Transverse Mercator (NZTM)</span><br /></div><div></div></div><div style='font-size:17px; font-family:\"Avenir Next W01\", \"Avenir Next W00\", \"Avenir Next\", Avenir, \"Helvetica Neue\", Helvetica, Arial, sans-serif !important;'><br /></div><div style='font-size:17px; font-family:\"Avenir Next W01\", \"Avenir Next W00\", \"Avenir Next\", Avenir, \"Helvetica Neue\", Helvetica, Arial, sans-serif !important;'>Statistical area 2 (SA2) is a new output geography that provides higher\naggregations of population data than can be provided at the <a href='https://datafinder.stats.govt.nz/data/category/annual-boundaries/2020/' target='_blank' rel='nofollow ugc noopener noreferrer'>statistical area 1 (SA1)</a> level. The SA2 geography aims to reflect communities that interact\ntogether socially and economically. In populated areas, SA2s generally contain\nsimilar sized populations.<font size='3'><br /></font></div><div style='font-size:17px; font-family:\"Avenir Next W01\", \"Avenir Next W00\", \"Avenir Next\", Avenir, \"Helvetica Neue\", Helvetica, Arial, sans-serif !important;'><br /></div><font size='3' style='font-family:\"Avenir Next W01\", \"Avenir Next W00\", \"Avenir Next\", Avenir, \"Helvetica Neue\", Helvetica, Arial, sans-serif !important;'><span style='font-family:\"Avenir Next W01\", \"Avenir Next W00\", \"Avenir Next\", Avenir, \"Helvetica Neue\", sans-serif;'>This layer contains the definitive set of statistical area 2 (SA2) boundaries for 2020 as defined by Stats NZ.</span><span style='font-family:\"Avenir Next W01\", \"Avenir Next W00\", \"Avenir Next\", Avenir, \"Helvetica Neue\", sans-serif;'> </span></font><span style='font-family:\"Avenir Next W01\", \"Avenir Next W00\", \"Avenir Next\", Avenir, \"Helvetica Neue\", Helvetica, Arial, sans-serif; font-size:17px;'>Statistical area 2 (SA2) is a new output geography that provides higher aggregations of population data than can be provided at the statistical area 1 (SA1) level. The SA2 geography aims to reflect communities that interact together socially and economically. In populated areas, SA2s generally contain similar sized populations.</span><div style='font-size:17px; font-family:\"Avenir Next W01\", \"Avenir Next W00\", \"Avenir Next\", Avenir, \"Helvetica Neue\", Helvetica, Arial, sans-serif !important;'><font size='3'><br /></font></div><div style='font-size:17px; font-family:\"Avenir Next W01\", \"Avenir Next W00\", \"Avenir Next\", Avenir, \"Helvetica Neue\", Helvetica, Arial, sans-serif !important;'><font size='3'><font>The official dataset can be found on </font></font><a href='https://datafinder.stats.govt.nz/layer/98766-statistical-area-2-2020-clipped-generalised/' target='_blank' rel='nofollow ugc noopener noreferrer'>https://datafinder.stats.govt.nz</a><font size='3'>.</font></div><div style='font-size:17px; font-family:\"Avenir Next W01\", \"Avenir Next W00\", \"Avenir Next\", Avenir, \"Helvetica Neue\", Helvetica, Arial, sans-serif !important;'><br /></div><div style='font-family:\"Avenir Next W01\", \"Avenir Next W00\", \"Avenir Next\", Avenir, \"Helvetica Neue\", Helvetica, Arial, sans-serif; font-size:17px;'><font size='3'>This layer contains the following attributes (see data tab):</font></div><div style='font-family:\"Avenir Next W01\", \"Avenir Next W00\", \"Avenir Next\", Avenir, \"Helvetica Neue\", Helvetica, Arial, sans-serif;'><ul><li><font size='3'>Statistical Area 2 code<br /></font></li><li><font size='3'>Statistical Area 2 name</font></li><li><font size='3'>Total area in square kilometers</font></li><li><font size='3'>Total land area in square kilometers.</font></li></ul></div><div style='font-size:17px; font-family:\"Avenir Next W01\", \"Avenir Next W00\", \"Avenir Next\", Avenir, \"Helvetica Neue\", Helvetica, Arial, sans-serif !important;'><font size='3'>The layer is further generalised by Eagle Technology for improved performance on the web, therefore it doesn't fully represent the official boundaries.</font></div><div style='font-size:17px; font-family:\"Avenir Next W01\", \"Avenir Next W00\", \"Avenir Next\", Avenir, \"Helvetica Neue\", Helvetica, Arial, sans-serif !important;'><font size='3'><br /></font></div><div style='font-size:17px; font-family:\"Avenir Next W01\", \"Avenir Next W00\", \"Avenir Next\", Avenir, \"Helvetica Neue\", Helvetica, Arial, sans-serif !important;'><div><font color='#2f4f4f' size='3'>This layer is offered by Eagle Technology (Official Esri Distributor). Eagle Technology offers services that can be used in the ArcGIS platform. The Content team at Eagle Technology updates the layers on a regular basis and regularly adds new content to the Living Atlas. By using this content and combining it with other data you can create new information products quickly and easily.</font></div><div><font color='#2f4f4f' size='3'><br /></font></div><div><font size='3'><font color='#2f4f4f'>If you have any questions or comments about the content, please let us now  at </font><a href='mailto:livingatlas@eagle.co.nz' style='color:rgb(0, 121, 193); text-decoration-line:none;' target='_blank' rel='nofollow ugc noopener noreferrer'>livingatlas@eagle.co.nz</a>.</font></div></div></div>",
			"keyword": [
				"eaglegis",
				"mature support",
				"retiring",
				"deprecated"
			],
			"issued": "2020-01-11T10:21:41.000Z",
			"modified": "2021-02-10T03:38:55.899Z",
			"publisher": {
				"name": "Eagle Technology Group Ltd"
			},
			"contactPoint": {
				"@type": "vcard:Contact",
				"fn": "eaglegis",
				"hasEmail": "mailto:ts@eaglegis.co.nz"
			},
			"accessLevel": "public",
			"spatial": "166.2620,-47.2230,-177.6190,-33.7734",
			"license": "https://creativecommons.org/licenses/by/4.0",
			"distribution": [
				{
					"@type": "dcat:Distribution",
					"title": "ArcGIS Hub Dataset",
					"format": "Web Page",
					"mediaType": "text/html",
					"accessURL": "https://www.pacificgeoportal.com/datasets/eaglegis::nz-statistical-area-2-boundaries-2020-mature-support"
				},
				{
					"@type": "dcat:Distribution",
					"title": "ArcGIS GeoService",
					"format": "ArcGIS GeoServices REST API",
					"mediaType": "application/json",
					"accessURL": "https://services.arcgis.com/XTtANUDT8Va4DLwI/arcgis/rest/services/Statistical_Area_2_2020_Clipped_generalised/FeatureServer/0"
				},
				{
					"@type": "dcat:Distribution",
					"title": "CSV",
					"format": "CSV",
					"mediaType": "text/csv",
					"accessURL": "https://www.pacificgeoportal.com/api/download/v1/items/b6b10fe7e48e47658b1fec94a15d5709/csv?layers=0"
				},
				{
					"@type": "dcat:Distribution",
					"title": "Shapefile",
					"format": "ZIP",
					"mediaType": "application/zip",
					"accessURL": "https://www.pacificgeoportal.com/api/download/v1/items/b6b10fe7e48e47658b1fec94a15d5709/shapefile?layers=0"
				},
				{
					"@type": "dcat:Distribution",
					"title": "GeoJSON",
					"format": "GeoJSON",
					"mediaType": "application/vnd.geo+json",
					"accessURL": "https://www.pacificgeoportal.com/api/download/v1/items/b6b10fe7e48e47658b1fec94a15d5709/geojson?layers=0"
				},
				{
					"@type": "dcat:Distribution",
					"title": "KML",
					"format": "KML",
					"mediaType": "application/vnd.google-earth.kml+xml",
					"accessURL": "https://www.pacificgeoportal.com/api/download/v1/items/b6b10fe7e48e47658b1fec94a15d5709/kml?layers=0"
				},
				{
					"@type": "dcat:Distribution",
					"title": "File Geodatabase",
					"format": "ZIP",
					"mediaType": "application/zip",
					"accessURL": "https://www.pacificgeoportal.com/api/download/v1/items/b6b10fe7e48e47658b1fec94a15d5709/filegdb?layers=0"
				},
				{
					"@type": "dcat:Distribution",
					"title": "Feature Collection",
					"format": "TXT",
					"mediaType": "text/plain",
					"accessURL": "https://www.pacificgeoportal.com/api/download/v1/items/b6b10fe7e48e47658b1fec94a15d5709/featureCollection?layers=0"
				},
				{
					"@type": "dcat:Distribution",
					"title": "Excel",
					"format": "XLSX",
					"mediaType": "application/vnd.ms-excel",
					"accessURL": "https://www.pacificgeoportal.com/api/download/v1/items/b6b10fe7e48e47658b1fec94a15d5709/excel?layers=0"
				},
				{
					"@type": "dcat:Distribution",
					"title": "GeoPackage",
					"format": "GPKG",
					"mediaType": "application/geopackage+sqlite3",
					"accessURL": "https://www.pacificgeoportal.com/api/download/v1/items/b6b10fe7e48e47658b1fec94a15d5709/geoPackage?layers=0"
				},
				{
					"@type": "dcat:Distribution",
					"title": "SQLite Geodatabase",
					"format": "GDB",
					"mediaType": "application/geopackage+sqlite3",
					"accessURL": "https://www.pacificgeoportal.com/api/download/v1/items/b6b10fe7e48e47658b1fec94a15d5709/sqlite?layers=0"
				}
			],
			"theme": [
				"geospatial"
			]
		},
		{
			"@type": "dcat:Dataset",
			"identifier": "https://www.arcgis.com/home/item.html?id=4513907dfe67459f9df1817547ae457a&sublayer=0",
			"landingPage": "https://www.pacificgeoportal.com/datasets/eaglegis::nz-statistical-area-2-boundaries-2019-mature-support",
			"title": "NZ Statistical Area 2 boundaries 2019 (Mature Support)",
			"description": "<font size='3'><b><span style='color:firebrick;'>Important Note:</span></b><b> This item is in<span style='color:#C00000;'> mature support</span> as of January 2024 and will retire in January 2025.</b><b><span> When you need the most recent boundary layer please use <a href='https://www.arcgis.com/home/item.html?id=6b4508cfd8c4445fb5074aacd13eb4b8' rel='nofollow ugc'>this item</a>. When you need the boundaries for a specific year, please use <a href='https://www.arcgis.com/home/item.html?id=a3422b4ed51645919308d5f595770eff' rel='nofollow ugc'>this item</a> and set a filter on the required year.</span></b><br /><br /></font><div><br /><div style='font-size: 17px; font-family: \"Avenir Next W01\", \"Avenir Next W00\", \"Avenir Next\", Avenir, \"Helvetica Neue\", Helvetica, Arial, sans-serif !important;'><font size='3'>Topicality: 01-01-2019</font></div><div style='font-size: 17px; font-family: \"Avenir Next W01\", \"Avenir Next W00\", \"Avenir Next\", Avenir, \"Helvetica Neue\", Helvetica, Arial, sans-serif !important;'><div><span style='font-size: medium;'>Projection: New Zealand Transverse Mercator (NZTM)</span><br /></div><div></div></div><div style='font-size: 17px; font-family: \"Avenir Next W01\", \"Avenir Next W00\", \"Avenir Next\", Avenir, \"Helvetica Neue\", Helvetica, Arial, sans-serif !important;'><br /></div><div style='font-size: 17px; font-family: \"Avenir Next W01\", \"Avenir Next W00\", \"Avenir Next\", Avenir, \"Helvetica Neue\", Helvetica, Arial, sans-serif !important;'>Statistical area 2 (SA2) is a new output geography that provides higher\naggregations of population data than can be provided at the <a href='https://eaglegis.maps.arcgis.com/home/item.html?id=a8985e1463024b918903adc7d8de6959' target='_blank' rel='nofollow ugc noopener noreferrer'>statistical area 1 (SA1)</a> level. The SA2 geography aims to reflect communities that interact\ntogether socially and economically. In populated areas, SA2s generally contain\nsimilar sized populations.<font size='3'><br /></font></div><div style='font-size: 17px; font-family: \"Avenir Next W01\", \"Avenir Next W00\", \"Avenir Next\", Avenir, \"Helvetica Neue\", Helvetica, Arial, sans-serif !important;'><br /></div><font size='3' style='font-family: \"Avenir Next W01\", \"Avenir Next W00\", \"Avenir Next\", Avenir, \"Helvetica Neue\", Helvetica, Arial, sans-serif !important;'><span style='font-family: \"Avenir Next W01\", \"Avenir Next W00\", \"Avenir Next\", Avenir, \"Helvetica Neue\", sans-serif;'>This layer contains s the definitive set of statistical area 2 (SA2) boundaries for 2019 as defined by Stats NZ.</span><span style='font-family: \"Avenir Next W01\", \"Avenir Next W00\", \"Avenir Next\", Avenir, \"Helvetica Neue\", sans-serif;'> </span></font><span style='font-family: \"Avenir Next W01\", \"Avenir Next W00\", \"Avenir Next\", Avenir, \"Helvetica Neue\", Helvetica, Arial, sans-serif; font-size: 17px;'>Statistical area 2 (SA2) is a new output geography that provides higher aggregations of population data than can be provided at the statistical area 1 (SA1) level. The SA2 geography aims to reflect communities that interact together socially and economically. In populated areas, SA2s generally contain similar sized populations.</span><div style='font-size: 17px; font-family: \"Avenir Next W01\", \"Avenir Next W00\", \"Avenir Next\", Avenir, \"Helvetica Neue\", Helvetica, Arial, sans-serif !important;'><font size='3'><br /></font></div><div style='font-size: 17px; font-family: \"Avenir Next W01\", \"Avenir Next W00\", \"Avenir Next\", Avenir, \"Helvetica Neue\", Helvetica, Arial, sans-serif !important;'><font size='3'><font face='Avenir Next W01, Avenir Next W00, Avenir Next, Avenir, Helvetica Neue, Helvetica, Arial, sans-serif'>The official dataset can be found on </font></font><a href='https://datafinder.stats.govt.nz/layer/98766-statistical-area-2-2019-clipped-generalised/' target='_blank' rel='nofollow ugc noopener noreferrer'>https://datafinder.stats.govt.nz</a><font size='3'>.</font></div><div style='font-size: 17px; font-family: \"Avenir Next W01\", \"Avenir Next W00\", \"Avenir Next\", Avenir, \"Helvetica Neue\", Helvetica, Arial, sans-serif !important;'><br /></div><div style='font-family: \"Avenir Next W01\", \"Avenir Next W00\", \"Avenir Next\", Avenir, \"Helvetica Neue\", Helvetica, Arial, sans-serif; font-size: 17px;'><font size='3'>This layer contains the following attributes (see data tab):</font></div><div style='font-family: \"Avenir Next W01\", \"Avenir Next W00\", \"Avenir Next\", Avenir, \"Helvetica Neue\", Helvetica, Arial, sans-serif;'><ul><li><font size='3'>Statistical Area 2 code<br /></font></li><li><font size='3'>Statistical Area 2 name</font></li><li><font size='3'>Total area in square kilometers</font></li><li><font size='3'>Total land area in square kilometers.</font></li></ul></div><div style='font-size: 17px; font-family: \"Avenir Next W01\", \"Avenir Next W00\", \"Avenir Next\", Avenir, \"Helvetica Neue\", Helvetica, Arial, sans-serif !important;'><font size='3'>The layer is further generalised by Eagle Technology for improved performance on the web, therefore it doesn't fully represent the official boundaries.</font></div><div style='font-size: 17px; font-family: \"Avenir Next W01\", \"Avenir Next W00\", \"Avenir Next\", Avenir, \"Helvetica Neue\", Helvetica, Arial, sans-serif !important;'><font size='3'><br /></font></div><div style='font-size: 17px; font-family: \"Avenir Next W01\", \"Avenir Next W00\", \"Avenir Next\", Avenir, \"Helvetica Neue\", Helvetica, Arial, sans-serif !important;'><div><font color='#2f4f4f' size='3'>This layer is offered by Eagle Technology (Official Esri Distributor). Eagle Technology offers services that can be used in the ArcGIS platform. The Content team at Eagle Technology updates the layers on a regular basis and regularly adds new content to the Living Atlas. By using this content and combining it with other data you can create new information products quickly and easily.</font></div><div><font color='#2f4f4f' size='3'><br /></font></div><div><font size='3'><font color='#2f4f4f'>If you have any questions or comments about the content, please let us now  at </font><a href='mailto:livingatlas@eagle.co.nz.' style='color: rgb(0, 121, 193); text-decoration-line: none;' target='_blank' rel='nofollow ugc noopener noreferrer'>livingatlas@eagle.co.nz</a>.</font></div></div></div>",
			"keyword": [
				"eaglegis",
				"mature support",
				"retiring",
				"deprecated"
			],
			"issued": "2018-12-21T13:00:21.000Z",
			"modified": "2018-12-21T13:08:10.937Z",
			"publisher": {
				"name": "Eagle Technology Group Ltd"
			},
			"contactPoint": {
				"@type": "vcard:Contact",
				"fn": "eaglegis",
				"hasEmail": "mailto:ts@eaglegis.co.nz"
			},
			"accessLevel": "public",
			"spatial": "166.2620,-47.2230,-177.6196,-33.7735",
			"license": "https://creativecommons.org/licenses/by/4.0",
			"distribution": [
				{
					"@type": "dcat:Distribution",
					"title": "ArcGIS Hub Dataset",
					"format": "Web Page",
					"mediaType": "text/html",
					"accessURL": "https://www.pacificgeoportal.com/datasets/eaglegis::nz-statistical-area-2-boundaries-2019-mature-support"
				},
				{
					"@type": "dcat:Distribution",
					"title": "ArcGIS GeoService",
					"format": "ArcGIS GeoServices REST API",
					"mediaType": "application/json",
					"accessURL": "https://services.arcgis.com/XTtANUDT8Va4DLwI/arcgis/rest/services/Statistical_Area_2_2019_Clipped_generalised/FeatureServer/0"
				},
				{
					"@type": "dcat:Distribution",
					"title": "CSV",
					"format": "CSV",
					"mediaType": "text/csv",
					"accessURL": "https://www.pacificgeoportal.com/api/download/v1/items/4513907dfe67459f9df1817547ae457a/csv?layers=0"
				},
				{
					"@type": "dcat:Distribution",
					"title": "Shapefile",
					"format": "ZIP",
					"mediaType": "application/zip",
					"accessURL": "https://www.pacificgeoportal.com/api/download/v1/items/4513907dfe67459f9df1817547ae457a/shapefile?layers=0"
				},
				{
					"@type": "dcat:Distribution",
					"title": "GeoJSON",
					"format": "GeoJSON",
					"mediaType": "application/vnd.geo+json",
					"accessURL": "https://www.pacificgeoportal.com/api/download/v1/items/4513907dfe67459f9df1817547ae457a/geojson?layers=0"
				},
				{
					"@type": "dcat:Distribution",
					"title": "KML",
					"format": "KML",
					"mediaType": "application/vnd.google-earth.kml+xml",
					"accessURL": "https://www.pacificgeoportal.com/api/download/v1/items/4513907dfe67459f9df1817547ae457a/kml?layers=0"
				}
			],
			"theme": [
				"geospatial"
			]
		},
		{
			"@type": "dcat:Dataset",
			"identifier": "https://www.arcgis.com/home/item.html?id=0c0a139373724862b58e9a0f1bff6098&sublayer=0",
			"landingPage": "https://www.pacificgeoportal.com/datasets/eaglegis::nz-statistical-area-2-boundaries-2018-mature-support",
			"title": "NZ Statistical Area 2 boundaries 2018 (Mature Support)",
			"description": "<font size='3'><b><span style='color:firebrick;'>Important Note:</span></b><b> This item is in<span style='color:#C00000;'> mature support</span> as of January 2024 and will retire in January 2025.</b><b><span> When you need the most recent boundary layer please use <a href='https://www.arcgis.com/home/item.html?id=6b4508cfd8c4445fb5074aacd13eb4b8' rel='nofollow ugc'>this item</a>. When you need the boundaries for a specific year, please use <a href='https://www.arcgis.com/home/item.html?id=a3422b4ed51645919308d5f595770eff' rel='nofollow ugc'>this item</a> and set a filter on the required year.</span></b><br /><br /></font><div><br /><div style='font-size: 17px; font-family: \"Avenir Next W01\", \"Avenir Next W00\", \"Avenir Next\", Avenir, \"Helvetica Neue\", Helvetica, Arial, sans-serif !important;'><font size='3'>Topicality: 01-01-2018</font></div><div style='font-size: 17px; font-family: \"Avenir Next W01\", \"Avenir Next W00\", \"Avenir Next\", Avenir, \"Helvetica Neue\", Helvetica, Arial, sans-serif !important;'><div><span style='font-size: medium;'>Projection: New Zealand Transverse Mercator (NZTM)</span><br /></div><div></div></div><div style='font-size: 17px; font-family: \"Avenir Next W01\", \"Avenir Next W00\", \"Avenir Next\", Avenir, \"Helvetica Neue\", Helvetica, Arial, sans-serif !important;'><br /></div><div style='font-size: 17px; font-family: \"Avenir Next W01\", \"Avenir Next W00\", \"Avenir Next\", Avenir, \"Helvetica Neue\", Helvetica, Arial, sans-serif !important;'>Statistical area 2 (SA2) is a new output geography that provides higher\naggregations of population data than can be provided at the <a href='https://www.arcgis.com/home/item.html?id=62e1e18d9f4641aaa920258f621c9169' target='_blank' rel='nofollow ugc noopener noreferrer'>statistical area 1 (SA1)</a> level. The SA2 geography aims to reflect communities that interact\ntogether socially and economically. In populated areas, SA2s generally contain\nsimilar sized populations.<font size='3'><br /></font></div><div style='font-size: 17px; font-family: \"Avenir Next W01\", \"Avenir Next W00\", \"Avenir Next\", Avenir, \"Helvetica Neue\", Helvetica, Arial, sans-serif !important;'><br /></div><font size='3' style='font-family: \"Avenir Next W01\", \"Avenir Next W00\", \"Avenir Next\", Avenir, \"Helvetica Neue\", Helvetica, Arial, sans-serif !important;'><span style='font-family: \"Avenir Next W01\", \"Avenir Next W00\", \"Avenir Next\", Avenir, \"Helvetica Neue\", sans-serif;'>This layer contains s the definitive set of statistical area 2 (SA2) boundaries for 2018 as defined by Stats NZ.</span><span style='font-family: \"Avenir Next W01\", \"Avenir Next W00\", \"Avenir Next\", Avenir, \"Helvetica Neue\", sans-serif;'> </span></font><span style='font-family: \"Avenir Next W01\", \"Avenir Next W00\", \"Avenir Next\", Avenir, \"Helvetica Neue\", Helvetica, Arial, sans-serif; font-size: 17px;'>Statistical area 2 (SA2) is a new output geography that provides higher aggregations of population data than can be provided at the statistical area 1 (SA1) level. The SA2 geography aims to reflect communities that interact together socially and economically. In populated areas, SA2s generally contain similar sized populations.</span><div style='font-size: 17px; font-family: \"Avenir Next W01\", \"Avenir Next W00\", \"Avenir Next\", Avenir, \"Helvetica Neue\", Helvetica, Arial, sans-serif !important;'><font size='3'><br /></font></div><div style='font-size: 17px; font-family: \"Avenir Next W01\", \"Avenir Next W00\", \"Avenir Next\", Avenir, \"Helvetica Neue\", Helvetica, Arial, sans-serif !important;'><font size='3'><font face='Avenir Next W01, Avenir Next W00, Avenir Next, Avenir, Helvetica Neue, Helvetica, Arial, sans-serif'>The official dataset can be found on </font></font><a href='https://datafinder.stats.govt.nz/layer/95066-statistical-area-2-higher-geographies-2018-clipped-generalised/' target='_blank' rel='nofollow ugc noopener noreferrer'>https://datafinder.stats.govt.nz</a><font size='3'>.</font></div><div style='font-size: 17px; font-family: \"Avenir Next W01\", \"Avenir Next W00\", \"Avenir Next\", Avenir, \"Helvetica Neue\", Helvetica, Arial, sans-serif !important;'><br /></div><div style='font-family: \"Avenir Next W01\", \"Avenir Next W00\", \"Avenir Next\", Avenir, \"Helvetica Neue\", Helvetica, Arial, sans-serif; font-size: 17px;'><font size='3'>This layer contains the following attributes (see data tab):</font></div><div style='font-family: \"Avenir Next W01\", \"Avenir Next W00\", \"Avenir Next\", Avenir, \"Helvetica Neue\", Helvetica, Arial, sans-serif; font-size: 17px;'><ul><li>Statistical Area 2 code<br /></li><li><font size='3'>Statistical Area 2 name</font></li><li><font size='3'>Regional Council code</font></li><li><font size='3'>Regional Council name</font></li><li><font size='3'>Territorial Authority code</font></li><li><font size='3'>Territorial Authority name</font></li><li><font size='3'>Total area in square kilometers</font></li><li><font size='3'>Total land area in square kilometers.</font></li></ul></div><div style='font-size: 17px; font-family: \"Avenir Next W01\", \"Avenir Next W00\", \"Avenir Next\", Avenir, \"Helvetica Neue\", Helvetica, Arial, sans-serif !important;'><font size='3'>The layer is further generalised by Eagle Technology for improved performance on the web, therefore it doesn't fully represent the official boundaries.</font></div><div style='font-size: 17px; font-family: \"Avenir Next W01\", \"Avenir Next W00\", \"Avenir Next\", Avenir, \"Helvetica Neue\", Helvetica, Arial, sans-serif !important;'><font size='3'><br /></font></div><div style='font-size: 17px; font-family: \"Avenir Next W01\", \"Avenir Next W00\", \"Avenir Next\", Avenir, \"Helvetica Neue\", Helvetica, Arial, sans-serif !important;'><div><font color='#2f4f4f' size='3'>This layer is offered by Eagle Technology (Official Esri Distributor). Eagle Technology offers services that can be used in the ArcGIS platform. The Content team at Eagle Technology updates the layers on a regular basis and regularly adds new content to the Living Atlas. By using this content and combining it with other data you can create new information products quickly and easily.</font></div><div><font color='#2f4f4f' size='3'><br /></font></div><div><font size='3'><font color='#2f4f4f'>If you have any questions or comments about the content, please let us now  at </font><a href='mailto:livingatlas@eagle.co.nz.' style='color: rgb(0, 121, 193); text-decoration-line: none;' target='_blank' rel='nofollow ugc noopener noreferrer'>livingatlas@eagle.co.nz</a>.</font></div></div></div>",
			"keyword": [
				"eaglegis",
				"mature support",
				"retiring",
				"deprecated"
			],
			"issued": "2018-09-06T05:19:42.000Z",
			"modified": "2022-09-01T08:40:53.105Z",
			"publisher": {
				"name": "Eagle Technology Group Ltd"
			},
			"contactPoint": {
				"@type": "vcard:Contact",
				"fn": "eaglegis",
				"hasEmail": "mailto:ts@eaglegis.co.nz"
			},
			"accessLevel": "public",
			"spatial": "166.2620,-47.2230,-177.6196,-33.7735",
			"license": "https://creativecommons.org/licenses/by/4.0",
			"distribution": [
				{
					"@type": "dcat:Distribution",
					"title": "ArcGIS Hub Dataset",
					"format": "Web Page",
					"mediaType": "text/html",
					"accessURL": "https://www.pacificgeoportal.com/datasets/eaglegis::nz-statistical-area-2-boundaries-2018-mature-support"
				},
				{
					"@type": "dcat:Distribution",
					"title": "ArcGIS GeoService",
					"format": "ArcGIS GeoServices REST API",
					"mediaType": "application/json",
					"accessURL": "https://services.arcgis.com/XTtANUDT8Va4DLwI/arcgis/rest/services/NZ_Statistical_Area_2_boundaries_2018_generalised/FeatureServer/0"
				},
				{
					"@type": "dcat:Distribution",
					"title": "CSV",
					"format": "CSV",
					"mediaType": "text/csv",
					"accessURL": "https://www.pacificgeoportal.com/api/download/v1/items/0c0a139373724862b58e9a0f1bff6098/csv?layers=0"
				},
				{
					"@type": "dcat:Distribution",
					"title": "Shapefile",
					"format": "ZIP",
					"mediaType": "application/zip",
					"accessURL": "https://www.pacificgeoportal.com/api/download/v1/items/0c0a139373724862b58e9a0f1bff6098/shapefile?layers=0"
				},
				{
					"@type": "dcat:Distribution",
					"title": "GeoJSON",
					"format": "GeoJSON",
					"mediaType": "application/vnd.geo+json",
					"accessURL": "https://www.pacificgeoportal.com/api/download/v1/items/0c0a139373724862b58e9a0f1bff6098/geojson?layers=0"
				},
				{
					"@type": "dcat:Distribution",
					"title": "KML",
					"format": "KML",
					"mediaType": "application/vnd.google-earth.kml+xml",
					"accessURL": "https://www.pacificgeoportal.com/api/download/v1/items/0c0a139373724862b58e9a0f1bff6098/kml?layers=0"
				},
				{
					"@type": "dcat:Distribution",
					"title": "File Geodatabase",
					"format": "ZIP",
					"mediaType": "application/zip",
					"accessURL": "https://www.pacificgeoportal.com/api/download/v1/items/0c0a139373724862b58e9a0f1bff6098/filegdb?layers=0"
				},
				{
					"@type": "dcat:Distribution",
					"title": "Feature Collection",
					"format": "TXT",
					"mediaType": "text/plain",
					"accessURL": "https://www.pacificgeoportal.com/api/download/v1/items/0c0a139373724862b58e9a0f1bff6098/featureCollection?layers=0"
				},
				{
					"@type": "dcat:Distribution",
					"title": "Excel",
					"format": "XLSX",
					"mediaType": "application/vnd.ms-excel",
					"accessURL": "https://www.pacificgeoportal.com/api/download/v1/items/0c0a139373724862b58e9a0f1bff6098/excel?layers=0"
				},
				{
					"@type": "dcat:Distribution",
					"title": "GeoPackage",
					"format": "GPKG",
					"mediaType": "application/geopackage+sqlite3",
					"accessURL": "https://www.pacificgeoportal.com/api/download/v1/items/0c0a139373724862b58e9a0f1bff6098/geoPackage?layers=0"
				},
				{
					"@type": "dcat:Distribution",
					"title": "SQLite Geodatabase",
					"format": "GDB",
					"mediaType": "application/geopackage+sqlite3",
					"accessURL": "https://www.pacificgeoportal.com/api/download/v1/items/0c0a139373724862b58e9a0f1bff6098/sqlite?layers=0"
				}
			],
			"theme": [
				"geospatial"
			]
		},
		{
			"@type": "dcat:Dataset",
			"identifier": "https://www.arcgis.com/home/item.html?id=03c377108bdf48de84abe444ca8d736d&sublayer=0",
			"landingPage": "https://www.pacificgeoportal.com/datasets/eaglegis::nz-statistical-areas-1-2021-mature-support",
			"title": "NZ Statistical Areas 1 - 2021 (Mature Support)",
			"description": "<font size='3'><b><span style='color:firebrick;'>Important Note:</span></b><b> This item is in<span style='color:#C00000;'> mature support</span> as of January 2024 and will retire in January 2025.</b><b><span> When you need the most recent boundary layer please use <a href='https://www.arcgis.com/home/item.html?id=e0adfbdcfc714ae2a00c1b78a459bd43' rel='nofollow ugc'>this item</a>. When you need the boundaries for a specific year, please use <a href='https://www.arcgis.com/home/item.html?id=c4089e5978944a899679e68aed59ae4d' rel='nofollow ugc'>this item</a> and set a filter on the required year.</span></b><br /><br /></font><div><br /><div style='font-family:\"Avenir Next W01\", \"Avenir Next W00\", \"Avenir Next\", Avenir, \"Helvetica Neue\", Helvetica, Arial, sans-serif !important;'><font size='3'>Topicality: 01-01-2021</font></div><div style='font-family:\"Avenir Next W01\", \"Avenir Next W00\", \"Avenir Next\", Avenir, \"Helvetica Neue\", Helvetica, Arial, sans-serif !important;'><div style='font-size:17px;'><span style='font-size:medium;'>Projection: New Zealand Transverse Mercator (NZTM)</span><br /></div><div style='font-size:17px;'></div></div><div style='font-family:\"Avenir Next W01\", \"Avenir Next W00\", \"Avenir Next\", Avenir, \"Helvetica Neue\", Helvetica, Arial, sans-serif !important;'><font size='3'><br /></font></div><font size='3'><span style='font-family:\"Avenir Next W01\", \"Avenir Next W00\", \"Avenir Next\", Avenir, \"Helvetica Neue\", sans-serif;'>This layer contains the definitive set of statistical area 1 (SA1) boundaries for 2021 as defined by Stats NZ.</span><span style='font-family:\"Avenir Next W01\", \"Avenir Next W00\", \"Avenir Next\", Avenir, \"Helvetica Neue\", sans-serif;'> </span>Statistical area 1 (SA1) is a new output geography that allows the release of\nmore detailed information about population characteristics than is available at\nthe meshblock level. Built by joining meshblocks, SA1s have an ideal size\nrange of 100–200 residents, and a maximum population of about 500. This is to\nminimise suppression of population data in multivariate statistics tables.</font><div style='font-family:\"Avenir Next W01\", \"Avenir Next W00\", \"Avenir Next\", Avenir, \"Helvetica Neue\", Helvetica, Arial, sans-serif !important;'><font size='3'><br /></font></div><div style='font-family:\"Avenir Next W01\", \"Avenir Next W00\", \"Avenir Next\", Avenir, \"Helvetica Neue\", Helvetica, Arial, sans-serif !important;'><font size='3'><font>This layer shows the data for 2021. If you would like to use the layer that gets updated yearly with the latest boundary data, you can use <a href='https://www.arcgis.com/home/item.html?id=e0adfbdcfc714ae2a00c1b78a459bd43' target='_blank' rel='nofollow ugc noopener noreferrer'>this item</a>.<br /><br />All the boundary layers can be found <a href='https://www.arcgis.com/home/group.html?id=8047736c3e43467aa62241976851eff9' target='_blank' rel='nofollow ugc noopener noreferrer'>here</a>.<br /><br />All the boundary layers that are updated yearly can be found <a href='https://www.arcgis.com/home/group.html?id=b22e4f0012a8426dac21cd3d02f25c67' target='_blank' rel='nofollow ugc noopener noreferrer'>here</a>.<br /><br />The official dataset can be found on </font></font><a href='https://datafinder.stats.govt.nz/data/category/annual-boundaries/2021/' target='_blank' rel='nofollow ugc noopener noreferrer'>https://datafinder.stats.govt.nz</a><font size='3'>.</font></div><div style='font-family:\"Avenir Next W01\", \"Avenir Next W00\", \"Avenir Next\", Avenir, \"Helvetica Neue\", Helvetica, Arial, sans-serif !important;'><br /></div><div style='font-family:\"Avenir Next W01\", \"Avenir Next W00\", \"Avenir Next\", Avenir, \"Helvetica Neue\", Helvetica, Arial, sans-serif;'><font size='3'>This layer contains the following attributes (see data tab):</font></div><div style='font-family:\"Avenir Next W01\", \"Avenir Next W00\", \"Avenir Next\", Avenir, \"Helvetica Neue\", Helvetica, Arial, sans-serif;'><ul><li><font size='3'>Statistical Area 1 code</font></li><li><font size='3'>Land -  Water code</font></li><li><font size='3'>Land - Water description</font></li><li><font size='3'>Total area in square kilometers</font></li><li><font size='3'>Total land area in square kilometers.</font></li></ul></div><div style='font-family:\"Avenir Next W01\", \"Avenir Next W00\", \"Avenir Next\", Avenir, \"Helvetica Neue\", Helvetica, Arial, sans-serif !important;'><font size='3'>The layer is further generalised by Eagle Technology for improved performance on the web, therefore it doesn't fully represent the official boundaries.</font></div><div style='font-family:\"Avenir Next W01\", \"Avenir Next W00\", \"Avenir Next\", Avenir, \"Helvetica Neue\", Helvetica, Arial, sans-serif !important;'><font size='3'><br /></font></div><div style='font-family:\"Avenir Next W01\", \"Avenir Next W00\", \"Avenir Next\", Avenir, \"Helvetica Neue\", Helvetica, Arial, sans-serif !important;'><div><font color='#2f4f4f' size='3'>This layer is offered by Eagle Technology (Official Esri Distributor). Eagle Technology offers services that can be used in the ArcGIS platform. The Content team at Eagle Technology updates the layers on a regular basis and regularly adds new content to the Living Atlas. By using this content and combining it with other data you can create new information products quickly and easily.</font></div><div><font color='#2f4f4f' size='3'><br /></font></div><div><font size='3'><font color='#2f4f4f'>If you have any questions or comments about the content, please let us now  at </font><a href='mailto:livingatlas@eagle.co.nz' style='color:rgb(0, 121, 193); text-decoration-line:none;' target='_blank' rel='nofollow ugc noopener noreferrer'>livingatlas@eagle.co.nz</a>.</font></div></div></div>",
			"keyword": [
				"eaglegis",
				"mature support",
				"retiring",
				"deprecated"
			],
			"issued": "2021-02-04T02:20:13.000Z",
			"modified": "2021-02-15T23:03:22.884Z",
			"publisher": {
				"name": "Eagle Technology Group Ltd"
			},
			"contactPoint": {
				"@type": "vcard:Contact",
				"fn": "eaglegis",
				"hasEmail": "mailto:ts@eaglegis.co.nz"
			},
			"accessLevel": "public",
			"spatial": "166.2620,-47.2230,-177.6190,-33.7734",
			"license": "https://creativecommons.org/licenses/by/4.0",
			"distribution": [
				{
					"@type": "dcat:Distribution",
					"title": "ArcGIS Hub Dataset",
					"format": "Web Page",
					"mediaType": "text/html",
					"accessURL": "https://www.pacificgeoportal.com/datasets/eaglegis::nz-statistical-areas-1-2021-mature-support"
				},
				{
					"@type": "dcat:Distribution",
					"title": "ArcGIS GeoService",
					"format": "ArcGIS GeoServices REST API",
					"mediaType": "application/json",
					"accessURL": "https://services.arcgis.com/XTtANUDT8Va4DLwI/arcgis/rest/services/nz_statistical_areas_1_2021/FeatureServer/0"
				},
				{
					"@type": "dcat:Distribution",
					"title": "CSV",
					"format": "CSV",
					"mediaType": "text/csv",
					"accessURL": "https://www.pacificgeoportal.com/api/download/v1/items/03c377108bdf48de84abe444ca8d736d/csv?layers=0"
				},
				{
					"@type": "dcat:Distribution",
					"title": "Shapefile",
					"format": "ZIP",
					"mediaType": "application/zip",
					"accessURL": "https://www.pacificgeoportal.com/api/download/v1/items/03c377108bdf48de84abe444ca8d736d/shapefile?layers=0"
				},
				{
					"@type": "dcat:Distribution",
					"title": "GeoJSON",
					"format": "GeoJSON",
					"mediaType": "application/vnd.geo+json",
					"accessURL": "https://www.pacificgeoportal.com/api/download/v1/items/03c377108bdf48de84abe444ca8d736d/geojson?layers=0"
				},
				{
					"@type": "dcat:Distribution",
					"title": "KML",
					"format": "KML",
					"mediaType": "application/vnd.google-earth.kml+xml",
					"accessURL": "https://www.pacificgeoportal.com/api/download/v1/items/03c377108bdf48de84abe444ca8d736d/kml?layers=0"
				},
				{
					"@type": "dcat:Distribution",
					"title": "File Geodatabase",
					"format": "ZIP",
					"mediaType": "application/zip",
					"accessURL": "https://www.pacificgeoportal.com/api/download/v1/items/03c377108bdf48de84abe444ca8d736d/filegdb?layers=0"
				},
				{
					"@type": "dcat:Distribution",
					"title": "Feature Collection",
					"format": "TXT",
					"mediaType": "text/plain",
					"accessURL": "https://www.pacificgeoportal.com/api/download/v1/items/03c377108bdf48de84abe444ca8d736d/featureCollection?layers=0"
				},
				{
					"@type": "dcat:Distribution",
					"title": "Excel",
					"format": "XLSX",
					"mediaType": "application/vnd.ms-excel",
					"accessURL": "https://www.pacificgeoportal.com/api/download/v1/items/03c377108bdf48de84abe444ca8d736d/excel?layers=0"
				},
				{
					"@type": "dcat:Distribution",
					"title": "GeoPackage",
					"format": "GPKG",
					"mediaType": "application/geopackage+sqlite3",
					"accessURL": "https://www.pacificgeoportal.com/api/download/v1/items/03c377108bdf48de84abe444ca8d736d/geoPackage?layers=0"
				},
				{
					"@type": "dcat:Distribution",
					"title": "SQLite Geodatabase",
					"format": "GDB",
					"mediaType": "application/geopackage+sqlite3",
					"accessURL": "https://www.pacificgeoportal.com/api/download/v1/items/03c377108bdf48de84abe444ca8d736d/sqlite?layers=0"
				}
			],
			"theme": [
				"geospatial"
			]
		},
		{
			"@type": "dcat:Dataset",
			"identifier": "https://www.arcgis.com/home/item.html?id=33e7f65f2c7f454084dae5f603cff16f&sublayer=0",
			"landingPage": "https://www.pacificgeoportal.com/datasets/eaglegis::nz-statistical-area-1-boundaries-2020-mature-support",
			"title": "NZ Statistical Area 1 boundaries 2020 (Mature Support)",
			"description": "<font size='3'><b><span style='color:firebrick;'>Important Note:</span></b><b> This item is in<span style='color:#C00000;'> mature support</span> as of January 2024 and will retire in January 2025.</b><b><span> When you need the most recent boundary layer please use <a href='https://www.arcgis.com/home/item.html?id=e0adfbdcfc714ae2a00c1b78a459bd43' rel='nofollow ugc'>this item</a>. When you need the boundaries for a specific year, please use <a href='https://www.arcgis.com/home/item.html?id=c4089e5978944a899679e68aed59ae4d' rel='nofollow ugc'>this item</a> and set a filter on the required year.</span></b><br /><br /></font><div><br /><div style='font-family:\"Avenir Next W01\", \"Avenir Next W00\", \"Avenir Next\", Avenir, \"Helvetica Neue\", Helvetica, Arial, sans-serif !important;'><font size='3'>Topicality: 01-01-2020</font></div><div style='font-family:\"Avenir Next W01\", \"Avenir Next W00\", \"Avenir Next\", Avenir, \"Helvetica Neue\", Helvetica, Arial, sans-serif !important;'><div style='font-size:17px;'><span style='font-size:medium;'>Projection: New Zealand Transverse Mercator (NZTM)</span><br /></div><div style='font-size:17px;'></div></div><div style='font-family:\"Avenir Next W01\", \"Avenir Next W00\", \"Avenir Next\", Avenir, \"Helvetica Neue\", Helvetica, Arial, sans-serif !important;'><font size='3'><br /></font></div><font size='3'><span style='font-family:\"Avenir Next W01\", \"Avenir Next W00\", \"Avenir Next\", Avenir, \"Helvetica Neue\", sans-serif;'>This layer contains the definitive set of statistical area 1 (SA1) boundaries for 2020 as defined by Stats NZ.</span><span style='font-family:\"Avenir Next W01\", \"Avenir Next W00\", \"Avenir Next\", Avenir, \"Helvetica Neue\", sans-serif;'> </span>Statistical area 1 (SA1) is a new output geography that allows the release of\nmore detailed information about population characteristics than is available at\nthe meshblock level. Built by joining meshblocks, SA1s have an ideal size\nrange of 100–200 residents, and a maximum population of about 500. This is to\nminimise suppression of population data in multivariate statistics tables.</font><div style='font-family:\"Avenir Next W01\", \"Avenir Next W00\", \"Avenir Next\", Avenir, \"Helvetica Neue\", Helvetica, Arial, sans-serif !important;'><font size='3'><br /></font></div><div style='font-family:\"Avenir Next W01\", \"Avenir Next W00\", \"Avenir Next\", Avenir, \"Helvetica Neue\", Helvetica, Arial, sans-serif !important;'><font size='3'><font>The official dataset can be found on </font></font><a href='https://datafinder.stats.govt.nz/data/category/annual-boundaries/2020/' target='_blank' rel='nofollow ugc noopener noreferrer'>https://datafinder.stats.govt.nz</a><font size='3'>.</font></div><div style='font-family:\"Avenir Next W01\", \"Avenir Next W00\", \"Avenir Next\", Avenir, \"Helvetica Neue\", Helvetica, Arial, sans-serif !important;'><br /></div><div style='font-family:\"Avenir Next W01\", \"Avenir Next W00\", \"Avenir Next\", Avenir, \"Helvetica Neue\", Helvetica, Arial, sans-serif;'><font size='3'>This layer contains the following attributes (see data tab):</font></div><div style='font-family:\"Avenir Next W01\", \"Avenir Next W00\", \"Avenir Next\", Avenir, \"Helvetica Neue\", Helvetica, Arial, sans-serif;'><ul><li><font size='3'>Statistical Area 1 code</font></li><li><font size='3'>Land -  Water code</font></li><li><font size='3'>Land - Water description</font></li><li><font size='3'>Total area in square kilometers</font></li><li><font size='3'>Total land area in square kilometers.</font></li></ul></div><div style='font-family:\"Avenir Next W01\", \"Avenir Next W00\", \"Avenir Next\", Avenir, \"Helvetica Neue\", Helvetica, Arial, sans-serif !important;'><font size='3'>The layer is further generalised by Eagle Technology for improved performance on the web, therefore it doesn't fully represent the official boundaries.</font></div><div style='font-family:\"Avenir Next W01\", \"Avenir Next W00\", \"Avenir Next\", Avenir, \"Helvetica Neue\", Helvetica, Arial, sans-serif !important;'><font size='3'><br /></font></div><div style='font-family:\"Avenir Next W01\", \"Avenir Next W00\", \"Avenir Next\", Avenir, \"Helvetica Neue\", Helvetica, Arial, sans-serif !important;'><div><font color='#2f4f4f' size='3'>This layer is offered by Eagle Technology (Official Esri Distributor). Eagle Technology offers services that can be used in the ArcGIS platform. The Content team at Eagle Technology updates the layers on a regular basis and regularly adds new content to the Living Atlas. By using this content and combining it with other data you can create new information products quickly and easily.</font></div><div><font color='#2f4f4f' size='3'><br /></font></div><div><font size='3'><font color='#2f4f4f'>If you have any questions or comments about the content, please let us now  at </font><a href='mailto:livingatlas@eagle.co.nz' style='color:rgb(0, 121, 193); text-decoration-line:none;' target='_blank' rel='nofollow ugc noopener noreferrer'>livingatlas@eagle.co.nz</a>.</font></div></div></div>",
			"keyword": [
				"eaglegis",
				"mature support",
				"retiring",
				"deprecated"
			],
			"issued": "2020-01-11T10:20:41.000Z",
			"modified": "2021-02-10T03:38:34.999Z",
			"publisher": {
				"name": "Eagle Technology Group Ltd"
			},
			"contactPoint": {
				"@type": "vcard:Contact",
				"fn": "eaglegis",
				"hasEmail": "mailto:ts@eaglegis.co.nz"
			},
			"accessLevel": "public",
			"spatial": "166.2620,-47.2230,-177.6190,-33.7734",
			"license": "https://creativecommons.org/licenses/by/4.0",
			"distribution": [
				{
					"@type": "dcat:Distribution",
					"title": "ArcGIS Hub Dataset",
					"format": "Web Page",
					"mediaType": "text/html",
					"accessURL": "https://www.pacificgeoportal.com/datasets/eaglegis::nz-statistical-area-1-boundaries-2020-mature-support"
				},
				{
					"@type": "dcat:Distribution",
					"title": "ArcGIS GeoService",
					"format": "ArcGIS GeoServices REST API",
					"mediaType": "application/json",
					"accessURL": "https://services.arcgis.com/XTtANUDT8Va4DLwI/arcgis/rest/services/Statistical_Area_1_2020_Clipped_generalised/FeatureServer/0"
				},
				{
					"@type": "dcat:Distribution",
					"title": "CSV",
					"format": "CSV",
					"mediaType": "text/csv",
					"accessURL": "https://www.pacificgeoportal.com/api/download/v1/items/33e7f65f2c7f454084dae5f603cff16f/csv?layers=0"
				},
				{
					"@type": "dcat:Distribution",
					"title": "Shapefile",
					"format": "ZIP",
					"mediaType": "application/zip",
					"accessURL": "https://www.pacificgeoportal.com/api/download/v1/items/33e7f65f2c7f454084dae5f603cff16f/shapefile?layers=0"
				},
				{
					"@type": "dcat:Distribution",
					"title": "GeoJSON",
					"format": "GeoJSON",
					"mediaType": "application/vnd.geo+json",
					"accessURL": "https://www.pacificgeoportal.com/api/download/v1/items/33e7f65f2c7f454084dae5f603cff16f/geojson?layers=0"
				},
				{
					"@type": "dcat:Distribution",
					"title": "KML",
					"format": "KML",
					"mediaType": "application/vnd.google-earth.kml+xml",
					"accessURL": "https://www.pacificgeoportal.com/api/download/v1/items/33e7f65f2c7f454084dae5f603cff16f/kml?layers=0"
				},
				{
					"@type": "dcat:Distribution",
					"title": "File Geodatabase",
					"format": "ZIP",
					"mediaType": "application/zip",
					"accessURL": "https://www.pacificgeoportal.com/api/download/v1/items/33e7f65f2c7f454084dae5f603cff16f/filegdb?layers=0"
				},
				{
					"@type": "dcat:Distribution",
					"title": "Feature Collection",
					"format": "TXT",
					"mediaType": "text/plain",
					"accessURL": "https://www.pacificgeoportal.com/api/download/v1/items/33e7f65f2c7f454084dae5f603cff16f/featureCollection?layers=0"
				},
				{
					"@type": "dcat:Distribution",
					"title": "Excel",
					"format": "XLSX",
					"mediaType": "application/vnd.ms-excel",
					"accessURL": "https://www.pacificgeoportal.com/api/download/v1/items/33e7f65f2c7f454084dae5f603cff16f/excel?layers=0"
				},
				{
					"@type": "dcat:Distribution",
					"title": "GeoPackage",
					"format": "GPKG",
					"mediaType": "application/geopackage+sqlite3",
					"accessURL": "https://www.pacificgeoportal.com/api/download/v1/items/33e7f65f2c7f454084dae5f603cff16f/geoPackage?layers=0"
				},
				{
					"@type": "dcat:Distribution",
					"title": "SQLite Geodatabase",
					"format": "GDB",
					"mediaType": "application/geopackage+sqlite3",
					"accessURL": "https://www.pacificgeoportal.com/api/download/v1/items/33e7f65f2c7f454084dae5f603cff16f/sqlite?layers=0"
				}
			],
			"theme": [
				"geospatial"
			]
		},
		{
			"@type": "dcat:Dataset",
			"identifier": "https://www.arcgis.com/home/item.html?id=a8985e1463024b918903adc7d8de6959&sublayer=0",
			"landingPage": "https://www.pacificgeoportal.com/datasets/eaglegis::nz-statistical-area-1-boundaries-2019-mature-support",
			"title": "NZ Statistical Area 1 boundaries 2019 (Mature Support)",
			"description": "<font size='3'><b><span style='color:firebrick;'>Important Note:</span></b><b> This item is in<span style='color:#C00000;'> mature support</span> as of January 2024 and will retire in January 2025.</b><b><span> When you need the most recent boundary layer please use <a href='https://www.arcgis.com/home/item.html?id=e0adfbdcfc714ae2a00c1b78a459bd43' rel='nofollow ugc'>this item</a>. When you need the boundaries for a specific year, please use <a href='https://www.arcgis.com/home/item.html?id=c4089e5978944a899679e68aed59ae4d' rel='nofollow ugc'>this item</a> and set a filter on the required year.</span></b><br /><br /></font><div><br /><div style='font-family: \"Avenir Next W01\", \"Avenir Next W00\", \"Avenir Next\", Avenir, \"Helvetica Neue\", Helvetica, Arial, sans-serif !important;'><font size='3'>Topicality: 01-01-2019</font></div><div style='font-family: \"Avenir Next W01\", \"Avenir Next W00\", \"Avenir Next\", Avenir, \"Helvetica Neue\", Helvetica, Arial, sans-serif !important;'><div style='font-size: 17px;'><span style='font-size: medium;'>Projection: New Zealand Transverse Mercator (NZTM)</span><br /></div><div style='font-size: 17px;'></div></div><div style='font-family: \"Avenir Next W01\", \"Avenir Next W00\", \"Avenir Next\", Avenir, \"Helvetica Neue\", Helvetica, Arial, sans-serif !important;'><font size='3'><br /></font></div><font size='3'><span style='font-family: \"Avenir Next W01\", \"Avenir Next W00\", \"Avenir Next\", Avenir, \"Helvetica Neue\", sans-serif;'>This layer contains s the definitive set of statistical area 1 (SA1) boundaries for 2019 as defined by Stats NZ.</span><span style='font-family: \"Avenir Next W01\", \"Avenir Next W00\", \"Avenir Next\", Avenir, \"Helvetica Neue\", sans-serif;'> </span>Statistical area 1 (SA1) is a new output geography that allows the release of\nmore detailed information about population characteristics than is available at\nthe meshblock level. Built by joining meshblocks, SA1s have an ideal size\nrange of 100–200 residents, and a maximum population of about 500. This is to\nminimise suppression of population data in multivariate statistics tables.</font><div style='font-family: \"Avenir Next W01\", \"Avenir Next W00\", \"Avenir Next\", Avenir, \"Helvetica Neue\", Helvetica, Arial, sans-serif !important;'><font size='3'><br /></font></div><div style='font-family: \"Avenir Next W01\", \"Avenir Next W00\", \"Avenir Next\", Avenir, \"Helvetica Neue\", Helvetica, Arial, sans-serif !important;'><font size='3'><font face='Avenir Next W01, Avenir Next W00, Avenir Next, Avenir, Helvetica Neue, Helvetica, Arial, sans-serif'>The official dataset can be found on </font></font><a href='https://datafinder.stats.govt.nz/layer/98760-statistical-area-1-2019-clipped-generalised/' target='_blank' rel='nofollow ugc noopener noreferrer'>https://datafinder.stats.govt.nz</a><font size='3'>.</font></div><div style='font-family: \"Avenir Next W01\", \"Avenir Next W00\", \"Avenir Next\", Avenir, \"Helvetica Neue\", Helvetica, Arial, sans-serif !important;'><br /></div><div style='font-family: \"Avenir Next W01\", \"Avenir Next W00\", \"Avenir Next\", Avenir, \"Helvetica Neue\", Helvetica, Arial, sans-serif;'><font size='3'>This layer contains the following attributes (see data tab):</font></div><div style='font-family: \"Avenir Next W01\", \"Avenir Next W00\", \"Avenir Next\", Avenir, \"Helvetica Neue\", Helvetica, Arial, sans-serif;'><ul><li><font size='3'>Statistical Area 1 code</font></li><li><font size='3'>Land -  Water code</font></li><li><font size='3'>Land - Water description</font></li><li><font size='3'>Total area in square kilometers</font></li><li><font size='3'>Total land area in square kilometers.</font></li></ul></div><div style='font-family: \"Avenir Next W01\", \"Avenir Next W00\", \"Avenir Next\", Avenir, \"Helvetica Neue\", Helvetica, Arial, sans-serif !important;'><font size='3'>The layer is further generalised by Eagle Technology for improved performance on the web, therefore it doesn't fully represent the official boundaries.</font></div><div style='font-family: \"Avenir Next W01\", \"Avenir Next W00\", \"Avenir Next\", Avenir, \"Helvetica Neue\", Helvetica, Arial, sans-serif !important;'><font size='3'><br /></font></div><div style='font-family: \"Avenir Next W01\", \"Avenir Next W00\", \"Avenir Next\", Avenir, \"Helvetica Neue\", Helvetica, Arial, sans-serif !important;'><div style=''><font color='#2f4f4f' size='3'>This layer is offered by Eagle Technology (Official Esri Distributor). Eagle Technology offers services that can be used in the ArcGIS platform. The Content team at Eagle Technology updates the layers on a regular basis and regularly adds new content to the Living Atlas. By using this content and combining it with other data you can create new information products quickly and easily.</font></div><div style=''><font color='#2f4f4f' size='3'><br /></font></div><div style=''><font size='3'><font color='#2f4f4f'>If you have any questions or comments about the content, please let us now  at </font><a href='mailto:livingatlas@eagle.co.nz.' style='color: rgb(0, 121, 193); text-decoration-line: none;' target='_blank' rel='nofollow ugc noopener noreferrer'>livingatlas@eagle.co.nz</a>.</font></div></div></div>",
			"keyword": [
				"eaglegis",
				"mature support",
				"retiring",
				"deprecated"
			],
			"issued": "2018-12-21T12:59:13.000Z",
			"modified": "2018-12-21T13:08:46.932Z",
			"publisher": {
				"name": "Eagle Technology Group Ltd"
			},
			"contactPoint": {
				"@type": "vcard:Contact",
				"fn": "eaglegis",
				"hasEmail": "mailto:ts@eaglegis.co.nz"
			},
			"accessLevel": "public",
			"spatial": "166.2620,-47.2230,-177.6196,-33.7735",
			"license": "https://creativecommons.org/licenses/by/4.0",
			"distribution": [
				{
					"@type": "dcat:Distribution",
					"title": "ArcGIS Hub Dataset",
					"format": "Web Page",
					"mediaType": "text/html",
					"accessURL": "https://www.pacificgeoportal.com/datasets/eaglegis::nz-statistical-area-1-boundaries-2019-mature-support"
				},
				{
					"@type": "dcat:Distribution",
					"title": "ArcGIS GeoService",
					"format": "ArcGIS GeoServices REST API",
					"mediaType": "application/json",
					"accessURL": "https://services.arcgis.com/XTtANUDT8Va4DLwI/arcgis/rest/services/Statistical_Area_1_2019_Clipped_generalised/FeatureServer/0"
				},
				{
					"@type": "dcat:Distribution",
					"title": "CSV",
					"format": "CSV",
					"mediaType": "text/csv",
					"accessURL": "https://www.pacificgeoportal.com/api/download/v1/items/a8985e1463024b918903adc7d8de6959/csv?layers=0"
				},
				{
					"@type": "dcat:Distribution",
					"title": "Shapefile",
					"format": "ZIP",
					"mediaType": "application/zip",
					"accessURL": "https://www.pacificgeoportal.com/api/download/v1/items/a8985e1463024b918903adc7d8de6959/shapefile?layers=0"
				},
				{
					"@type": "dcat:Distribution",
					"title": "GeoJSON",
					"format": "GeoJSON",
					"mediaType": "application/vnd.geo+json",
					"accessURL": "https://www.pacificgeoportal.com/api/download/v1/items/a8985e1463024b918903adc7d8de6959/geojson?layers=0"
				},
				{
					"@type": "dcat:Distribution",
					"title": "KML",
					"format": "KML",
					"mediaType": "application/vnd.google-earth.kml+xml",
					"accessURL": "https://www.pacificgeoportal.com/api/download/v1/items/a8985e1463024b918903adc7d8de6959/kml?layers=0"
				}
			],
			"theme": [
				"geospatial"
			]
		},
		{
			"@type": "dcat:Dataset",
			"identifier": "https://www.arcgis.com/home/item.html?id=62e1e18d9f4641aaa920258f621c9169&sublayer=0",
			"landingPage": "https://www.pacificgeoportal.com/datasets/eaglegis::nz-statistical-area-1-boundaries-2018-mature-support",
			"title": "NZ Statistical Area 1 boundaries 2018 (Mature Support)",
			"description": "<font size='3'><b><span style='color:firebrick;'>Important Note:</span></b><b> This item is in<span style='color:#C00000;'> mature support</span> as of January 2024 and will retire in January 2025.</b><b><span> When you need the most recent boundary layer please use <a href='https://www.arcgis.com/home/item.html?id=e0adfbdcfc714ae2a00c1b78a459bd43' rel='nofollow ugc'>this item</a>. When you need the boundaries for a specific year, please use <a href='https://www.arcgis.com/home/item.html?id=c4089e5978944a899679e68aed59ae4d' rel='nofollow ugc'>this item</a> and set a filter on the required year.</span></b><br /><br /></font><div><br /><div style='font-family:\"Avenir Next W01\", \"Avenir Next W00\", \"Avenir Next\", Avenir, \"Helvetica Neue\", Helvetica, Arial, sans-serif !important;'><font size='3'>Topicality: 01-01-2018</font></div><div style='font-family:\"Avenir Next W01\", \"Avenir Next W00\", \"Avenir Next\", Avenir, \"Helvetica Neue\", Helvetica, Arial, sans-serif !important;'><div style='font-size:17px;'><span style='font-size:medium;'>Projection: New Zealand Transverse Mercator (NZTM)</span><br /></div><div style='font-size:17px;'></div></div><div style='font-family:\"Avenir Next W01\", \"Avenir Next W00\", \"Avenir Next\", Avenir, \"Helvetica Neue\", Helvetica, Arial, sans-serif !important;'><font size='3'><br /></font></div><font size='3'><span style='font-family:\"Avenir Next W01\", \"Avenir Next W00\", \"Avenir Next\", Avenir, \"Helvetica Neue\", sans-serif;'>This layer contains s the definitive set of statistical area 1 (SA1) boundaries for 2018 as defined by Stats NZ.</span><span style='font-family:\"Avenir Next W01\", \"Avenir Next W00\", \"Avenir Next\", Avenir, \"Helvetica Neue\", sans-serif;'> </span>Statistical area 1 (SA1) is a new output geography that allows the release of\nmore detailed information about population characteristics than is available at\nthe meshblock level. Built by joining meshblocks, SA1s have an ideal size\nrange of 100–200 residents, and a maximum population of about 500. This is to\nminimise suppression of population data in multivariate statistics tables.</font><div style='font-family:\"Avenir Next W01\", \"Avenir Next W00\", \"Avenir Next\", Avenir, \"Helvetica Neue\", Helvetica, Arial, sans-serif !important;'><font size='3'><br /></font></div><div style='font-family:\"Avenir Next W01\", \"Avenir Next W00\", \"Avenir Next\", Avenir, \"Helvetica Neue\", Helvetica, Arial, sans-serif !important;'><font size='3'><font>The official dataset can be found on </font><a href='https://datafinder.stats.govt.nz/layer/92207-statistical-area-1-higher-geographies-2018-clipped-generalised/' target='_blank' rel='nofollow ugc noopener noreferrer'>https://datafinder.stats.govt.nz</a>.</font></div><div style='font-family:\"Avenir Next W01\", \"Avenir Next W00\", \"Avenir Next\", Avenir, \"Helvetica Neue\", Helvetica, Arial, sans-serif !important;'><br /></div><div style='font-family:\"Avenir Next W01\", \"Avenir Next W00\", \"Avenir Next\", Avenir, \"Helvetica Neue\", Helvetica, Arial, sans-serif;'><font size='3'>This layer contains the following attributes (see data tab):</font></div><div style='font-family:\"Avenir Next W01\", \"Avenir Next W00\", \"Avenir Next\", Avenir, \"Helvetica Neue\", Helvetica, Arial, sans-serif;'><ul><li><font size='3'>Statistical Area 1 code</font></li><li><font size='3'>Statistical Area 2 code</font></li><li><font size='3'>Statistical Area 2 name</font></li><li><font size='3'>Regional Council code</font></li><li><font size='3'>Regional Council name</font></li><li><font size='3'>Territorial Authority code</font></li><li><font size='3'>Territorial Authority name</font></li><li><font size='3'>Urban Rural code</font></li><li><font size='3'>Urban Rural name</font></li><li><font size='3'>Urban Rural Indicator code</font></li><li><a href='https://www.arcgis.com/home/item.html?id=953884278b9641a38b90520ecdbee3b9' target='_blank' rel='nofollow ugc noopener noreferrer'>Urban Rural Indicator description</a></li><li><font size='3'>Land -  Water code</font></li><li><font size='3'>Land - Water description</font></li><li><font size='3'>Total area in square kilometers</font></li><li><font size='3'>Total land area in square kilometers.</font></li></ul></div><div style='font-family:\"Avenir Next W01\", \"Avenir Next W00\", \"Avenir Next\", Avenir, \"Helvetica Neue\", Helvetica, Arial, sans-serif !important;'><font size='3'>The layer is further generalised by Eagle Technology for improved performance on the web, therefore it doesn't fully represent the official boundaries.</font></div><div style='font-family:\"Avenir Next W01\", \"Avenir Next W00\", \"Avenir Next\", Avenir, \"Helvetica Neue\", Helvetica, Arial, sans-serif !important;'><font size='3'><br /></font></div><div style='font-family:\"Avenir Next W01\", \"Avenir Next W00\", \"Avenir Next\", Avenir, \"Helvetica Neue\", Helvetica, Arial, sans-serif !important;'><div style=''><font color='#2f4f4f' size='3'>This layer is offered by Eagle Technology (Official Esri Distributor). Eagle Technology offers services that can be used in the ArcGIS platform. The Content team at Eagle Technology updates the layers on a regular basis and regularly adds new content to the Living Atlas. By using this content and combining it with other data you can create new information products quickly and easily.</font></div><div style=''><font color='#2f4f4f' size='3'><br /></font></div><div style=''><font size='3'><font color='#2f4f4f'>If you have any questions or comments about the content, please let us now  at </font><a href='mailto:livingatlas@eagle.co.nz.' style='color:rgb(0, 121, 193); text-decoration-line:none;' target='_blank' rel='nofollow ugc noopener noreferrer'>livingatlas@eagle.co.nz</a>.</font></div></div></div>",
			"keyword": [
				"eaglegis",
				"mature support",
				"retiring",
				"deprecated"
			],
			"issued": "2018-09-06T05:18:01.000Z",
			"modified": "2021-01-31T23:47:50.162Z",
			"publisher": {
				"name": "Eagle Technology Group Ltd"
			},
			"contactPoint": {
				"@type": "vcard:Contact",
				"fn": "eaglegis",
				"hasEmail": "mailto:ts@eaglegis.co.nz"
			},
			"accessLevel": "public",
			"spatial": "166.2620,-47.2230,-177.6196,-33.7735",
			"license": "https://creativecommons.org/licenses/by/4.0",
			"distribution": [
				{
					"@type": "dcat:Distribution",
					"title": "ArcGIS Hub Dataset",
					"format": "Web Page",
					"mediaType": "text/html",
					"accessURL": "https://www.pacificgeoportal.com/datasets/eaglegis::nz-statistical-area-1-boundaries-2018-mature-support"
				},
				{
					"@type": "dcat:Distribution",
					"title": "ArcGIS GeoService",
					"format": "ArcGIS GeoServices REST API",
					"mediaType": "application/json",
					"accessURL": "https://services.arcgis.com/XTtANUDT8Va4DLwI/arcgis/rest/services/NZ_Statistical_Area_1_boundaries_2018_generalised/FeatureServer/0"
				},
				{
					"@type": "dcat:Distribution",
					"title": "CSV",
					"format": "CSV",
					"mediaType": "text/csv",
					"accessURL": "https://www.pacificgeoportal.com/api/download/v1/items/62e1e18d9f4641aaa920258f621c9169/csv?layers=0"
				},
				{
					"@type": "dcat:Distribution",
					"title": "Shapefile",
					"format": "ZIP",
					"mediaType": "application/zip",
					"accessURL": "https://www.pacificgeoportal.com/api/download/v1/items/62e1e18d9f4641aaa920258f621c9169/shapefile?layers=0"
				},
				{
					"@type": "dcat:Distribution",
					"title": "GeoJSON",
					"format": "GeoJSON",
					"mediaType": "application/vnd.geo+json",
					"accessURL": "https://www.pacificgeoportal.com/api/download/v1/items/62e1e18d9f4641aaa920258f621c9169/geojson?layers=0"
				},
				{
					"@type": "dcat:Distribution",
					"title": "KML",
					"format": "KML",
					"mediaType": "application/vnd.google-earth.kml+xml",
					"accessURL": "https://www.pacificgeoportal.com/api/download/v1/items/62e1e18d9f4641aaa920258f621c9169/kml?layers=0"
				},
				{
					"@type": "dcat:Distribution",
					"title": "File Geodatabase",
					"format": "ZIP",
					"mediaType": "application/zip",
					"accessURL": "https://www.pacificgeoportal.com/api/download/v1/items/62e1e18d9f4641aaa920258f621c9169/filegdb?layers=0"
				},
				{
					"@type": "dcat:Distribution",
					"title": "Feature Collection",
					"format": "TXT",
					"mediaType": "text/plain",
					"accessURL": "https://www.pacificgeoportal.com/api/download/v1/items/62e1e18d9f4641aaa920258f621c9169/featureCollection?layers=0"
				},
				{
					"@type": "dcat:Distribution",
					"title": "Excel",
					"format": "XLSX",
					"mediaType": "application/vnd.ms-excel",
					"accessURL": "https://www.pacificgeoportal.com/api/download/v1/items/62e1e18d9f4641aaa920258f621c9169/excel?layers=0"
				},
				{
					"@type": "dcat:Distribution",
					"title": "GeoPackage",
					"format": "GPKG",
					"mediaType": "application/geopackage+sqlite3",
					"accessURL": "https://www.pacificgeoportal.com/api/download/v1/items/62e1e18d9f4641aaa920258f621c9169/geoPackage?layers=0"
				},
				{
					"@type": "dcat:Distribution",
					"title": "SQLite Geodatabase",
					"format": "GDB",
					"mediaType": "application/geopackage+sqlite3",
					"accessURL": "https://www.pacificgeoportal.com/api/download/v1/items/62e1e18d9f4641aaa920258f621c9169/sqlite?layers=0"
				}
			],
			"theme": [
				"geospatial"
			]
		},
		{
			"@type": "dcat:Dataset",
			"identifier": "https://www.arcgis.com/home/item.html?id=98beba25da114f238959d529d9c70910&sublayer=0",
			"landingPage": "https://www.pacificgeoportal.com/datasets/eaglegis::nz-regional-councils-2021-mature-support",
			"title": "NZ Regional Councils - 2021 (Mature Support)",
			"description": "<font size='3'><b><span style='color:firebrick;'>Important Note:</span></b><b> This item is in<span style='color:#C00000;'> mature support</span> as of January 2024 and will retire in January 2025.</b><b><span> When you need the most recent boundary layer please use <a href='https://www.arcgis.com/home/item.html?id=7759fbaecd4649dea39c4ac2b07fc4ab' rel='nofollow ugc'>this item</a>. When you need the boundaries for a specific year, please use <a href='https://www.arcgis.com/home/item.html?id=6ee62a063ce74133af0c7476363ed03e' rel='nofollow ugc'>this item</a> and set a filter on the required year.</span></b><br /><br /></font><div><br /><div><font size='3'>Topicality<b>: </b>01-01-2021</font></div><div><font size='3'><font size='3'>Projection: New Zealand Transverse Mercator (NZTM)</font></font></div><div><font size='3'><br /></font></div><div><div><font size='3'>This layer is based on the dataset REGC2021_V1_00_clipped  retrieved from Stats NZ. It contains the major released version of the annually released regional council boundaries as at 1 January 2021, clipped to the coastline. This clipped version contains 16 regional councils and has been created for map creation/cartographic purposes and does not fully represent the official full extent boundaries.</font></div><div><font size='3'><br /></font></div><div><font size='3'>This layer shows the data for 2021. If you would like to use the layer that gets updated yearly with the latest boundary data, you can use <a href='https://www.arcgis.com/home/item.html?id=7759fbaecd4649dea39c4ac2b07fc4ab' target='_blank' rel='nofollow ugc noopener noreferrer'>this item</a>.<br /><br />All the boundary layers can be found <a href='https://www.arcgis.com/home/group.html?id=8047736c3e43467aa62241976851eff9' target='_blank' rel='nofollow ugc noopener noreferrer'>here</a>.<br /><br />All the boundary layers that are updated yearly can be found <a href='https://www.arcgis.com/home/group.html?id=b22e4f0012a8426dac21cd3d02f25c67' target='_blank' rel='nofollow ugc noopener noreferrer'>here</a>.<br /><br />The official dataset can be found on </font><a href='https://datafinder.stats.govt.nz/data/category/annual-boundaries/2021/' target='_blank' rel='nofollow ugc noopener noreferrer'>https://datafinder.stats.govt.nz</a>.</div><div><font size='3'><br /></font></div><div><font size='3'>This layer contains the Regional Council name and code and the total area and the total land area in square kilometers. The layer is further generalised by Eagle Technology for improved performance on the web, <span style='font-family:\"Avenir Next W01\", \"Avenir Next W00\", \"Avenir Next\", Avenir, \"Helvetica Neue\", sans-serif;'>therefore it doesn't fully represent the official boundaries.</span></font></div><div><font size='3'><br /></font></div><div><div style='font-family:\"Avenir Next W01\", \"Avenir Next W00\", \"Avenir Next\", Avenir, \"Helvetica Neue\", Helvetica, Arial, sans-serif;'><font color='#2f4f4f' size='3'>This layer is offered by Eagle Technology (Official Esri Distributor). Eagle Technology offers services that can be used in the ArcGIS platform. The Content team at Eagle Technology updates the layers on a regular basis and regularly adds new content to the Living Atlas. By using this content and combining it with other data you can create new information products quickly and easily.</font></div><div style='font-family:\"Avenir Next W01\", \"Avenir Next W00\", \"Avenir Next\", Avenir, \"Helvetica Neue\", Helvetica, Arial, sans-serif;'><font color='#2f4f4f' size='3'><br /></font></div><div style='font-family:\"Avenir Next W01\", \"Avenir Next W00\", \"Avenir Next\", Avenir, \"Helvetica Neue\", Helvetica, Arial, sans-serif;'><font size='3'><font color='#2f4f4f' style=''>If you have any questions or comments about the content, please let us now  at </font><a href='mailto:livingatlas@eagle.co.nz' style='color:rgb(0, 121, 193); text-decoration-line:none;' target='_blank' rel='nofollow ugc noopener noreferrer'>livingatlas@eagle.co.nz</a></font></div></div></div></div>",
			"keyword": [
				"eaglegis",
				"mature support",
				"retiring",
				"deprecated"
			],
			"issued": "2021-02-04T02:19:41.000Z",
			"modified": "2021-02-15T23:03:10.389Z",
			"publisher": {
				"name": "Eagle Technology Group Ltd"
			},
			"contactPoint": {
				"@type": "vcard:Contact",
				"fn": "eaglegis",
				"hasEmail": "mailto:ts@eaglegis.co.nz"
			},
			"accessLevel": "public",
			"spatial": "166.2620,-47.2230,-177.6189,-33.7734",
			"license": "https://creativecommons.org/licenses/by/4.0",
			"distribution": [
				{
					"@type": "dcat:Distribution",
					"title": "ArcGIS Hub Dataset",
					"format": "Web Page",
					"mediaType": "text/html",
					"accessURL": "https://www.pacificgeoportal.com/datasets/eaglegis::nz-regional-councils-2021-mature-support"
				},
				{
					"@type": "dcat:Distribution",
					"title": "ArcGIS GeoService",
					"format": "ArcGIS GeoServices REST API",
					"mediaType": "application/json",
					"accessURL": "https://services.arcgis.com/XTtANUDT8Va4DLwI/arcgis/rest/services/nz_regional_councils_2021/FeatureServer/0"
				},
				{
					"@type": "dcat:Distribution",
					"title": "CSV",
					"format": "CSV",
					"mediaType": "text/csv",
					"accessURL": "https://www.pacificgeoportal.com/api/download/v1/items/98beba25da114f238959d529d9c70910/csv?layers=0"
				},
				{
					"@type": "dcat:Distribution",
					"title": "Shapefile",
					"format": "ZIP",
					"mediaType": "application/zip",
					"accessURL": "https://www.pacificgeoportal.com/api/download/v1/items/98beba25da114f238959d529d9c70910/shapefile?layers=0"
				},
				{
					"@type": "dcat:Distribution",
					"title": "GeoJSON",
					"format": "GeoJSON",
					"mediaType": "application/vnd.geo+json",
					"accessURL": "https://www.pacificgeoportal.com/api/download/v1/items/98beba25da114f238959d529d9c70910/geojson?layers=0"
				},
				{
					"@type": "dcat:Distribution",
					"title": "KML",
					"format": "KML",
					"mediaType": "application/vnd.google-earth.kml+xml",
					"accessURL": "https://www.pacificgeoportal.com/api/download/v1/items/98beba25da114f238959d529d9c70910/kml?layers=0"
				},
				{
					"@type": "dcat:Distribution",
					"title": "File Geodatabase",
					"format": "ZIP",
					"mediaType": "application/zip",
					"accessURL": "https://www.pacificgeoportal.com/api/download/v1/items/98beba25da114f238959d529d9c70910/filegdb?layers=0"
				},
				{
					"@type": "dcat:Distribution",
					"title": "Feature Collection",
					"format": "TXT",
					"mediaType": "text/plain",
					"accessURL": "https://www.pacificgeoportal.com/api/download/v1/items/98beba25da114f238959d529d9c70910/featureCollection?layers=0"
				},
				{
					"@type": "dcat:Distribution",
					"title": "Excel",
					"format": "XLSX",
					"mediaType": "application/vnd.ms-excel",
					"accessURL": "https://www.pacificgeoportal.com/api/download/v1/items/98beba25da114f238959d529d9c70910/excel?layers=0"
				},
				{
					"@type": "dcat:Distribution",
					"title": "GeoPackage",
					"format": "GPKG",
					"mediaType": "application/geopackage+sqlite3",
					"accessURL": "https://www.pacificgeoportal.com/api/download/v1/items/98beba25da114f238959d529d9c70910/geoPackage?layers=0"
				},
				{
					"@type": "dcat:Distribution",
					"title": "SQLite Geodatabase",
					"format": "GDB",
					"mediaType": "application/geopackage+sqlite3",
					"accessURL": "https://www.pacificgeoportal.com/api/download/v1/items/98beba25da114f238959d529d9c70910/sqlite?layers=0"
				}
			],
			"theme": [
				"geospatial"
			]
		},
		{
			"@type": "dcat:Dataset",
			"identifier": "https://www.arcgis.com/home/item.html?id=b1198f255cf14b3b8e7d61c2f2f3e038&sublayer=0",
			"landingPage": "https://www.pacificgeoportal.com/datasets/eaglegis::nz-regional-council-boundaries-2020-mature-support",
			"title": "NZ Regional Council boundaries 2020 (Mature Support)",
			"description": "<font size='3'><b><span style='color:firebrick;'>Important Note:</span></b><b> This item is in<span style='color:#C00000;'> mature support</span> as of January 2024 and will retire in January 2025.</b><b><span> When you need the most recent boundary layer please use <a href='https://www.arcgis.com/home/item.html?id=7759fbaecd4649dea39c4ac2b07fc4ab' rel='nofollow ugc'>this item</a>. When you need the boundaries for a specific year, please use <a href='https://www.arcgis.com/home/item.html?id=6ee62a063ce74133af0c7476363ed03e' rel='nofollow ugc'>this item</a> and set a filter on the required year.</span></b><br /><br /></font><div><br /><div><font size='3'>Topicality<b>: </b>01-01-2020</font></div><div><font size='3'><font size='3'>Projection: New Zealand Transverse Mercator (NZTM)</font></font></div><div><font size='3'><br /></font></div><div><div><font size='3'>This layer is based on the dataset REGC2020_V1_00_clipped  retrieved from Stat NZ. It contains the major released version of the annually released regional council boundaries as at 1 January 2020, clipped to the coastline. This clipped version contains 16 regional councils and has been created for map creation/cartographic purposes and does not fully represent the official full extent boundaries.</font></div><div><font size='3'><br /></font></div><div><font size='3'>The official dataset can be found on </font><a href='https://datafinder.stats.govt.nz/data/category/annual-boundaries/2020/' target='_blank' rel='nofollow ugc noopener noreferrer'>https://datafinder.stats.govt.nz</a>.</div><div><font size='3'><br /></font></div><div><font size='3'>This layer contains the Regional Council name and code and the total area and the total land area in square kilometers. The layer is further generalised by Eagle Technology for improved performance on the web, <span style='font-family:\"Avenir Next W01\", \"Avenir Next W00\", \"Avenir Next\", Avenir, \"Helvetica Neue\", sans-serif;'>therefore it doesn't fully represent the official boundaries.</span></font></div><div><font size='3'><br /></font></div><div><div style='font-family:\"Avenir Next W01\", \"Avenir Next W00\", \"Avenir Next\", Avenir, \"Helvetica Neue\", Helvetica, Arial, sans-serif;'><font color='#2f4f4f' size='3'>This layer is offered by Eagle Technology (Official Esri Distributor). Eagle Technology offers services that can be used in the ArcGIS platform. The Content team at Eagle Technology updates the layers on a regular basis and regularly adds new content to the Living Atlas. By using this content and combining it with other data you can create new information products quickly and easily.</font></div><div style='font-family:\"Avenir Next W01\", \"Avenir Next W00\", \"Avenir Next\", Avenir, \"Helvetica Neue\", Helvetica, Arial, sans-serif;'><font color='#2f4f4f' size='3'><br /></font></div><div style='font-family:\"Avenir Next W01\", \"Avenir Next W00\", \"Avenir Next\", Avenir, \"Helvetica Neue\", Helvetica, Arial, sans-serif;'><font size='3'><font color='#2f4f4f' style=''>If you have any questions or comments about the content, please let us now  at </font><a href='mailto:livingatlas@eagle.co.nz' style='color:rgb(0, 121, 193); text-decoration-line:none;' target='_blank' rel='nofollow ugc noopener noreferrer'>livingatlas@eagle.co.nz</a></font></div></div></div></div>",
			"keyword": [
				"eaglegis",
				"mature support",
				"retiring",
				"deprecated"
			],
			"issued": "2020-01-11T10:20:03.000Z",
			"modified": "2021-02-10T03:38:15.111Z",
			"publisher": {
				"name": "Eagle Technology Group Ltd"
			},
			"contactPoint": {
				"@type": "vcard:Contact",
				"fn": "eaglegis",
				"hasEmail": "mailto:ts@eaglegis.co.nz"
			},
			"accessLevel": "public",
			"spatial": "166.2620,-47.2230,-177.6190,-33.7734",
			"license": "https://creativecommons.org/licenses/by/4.0",
			"distribution": [
				{
					"@type": "dcat:Distribution",
					"title": "ArcGIS Hub Dataset",
					"format": "Web Page",
					"mediaType": "text/html",
					"accessURL": "https://www.pacificgeoportal.com/datasets/eaglegis::nz-regional-council-boundaries-2020-mature-support"
				},
				{
					"@type": "dcat:Distribution",
					"title": "ArcGIS GeoService",
					"format": "ArcGIS GeoServices REST API",
					"mediaType": "application/json",
					"accessURL": "https://services.arcgis.com/XTtANUDT8Va4DLwI/arcgis/rest/services/Regional_Council_2020_Clipped_generalised/FeatureServer/0"
				},
				{
					"@type": "dcat:Distribution",
					"title": "CSV",
					"format": "CSV",
					"mediaType": "text/csv",
					"accessURL": "https://www.pacificgeoportal.com/api/download/v1/items/b1198f255cf14b3b8e7d61c2f2f3e038/csv?layers=0"
				},
				{
					"@type": "dcat:Distribution",
					"title": "Shapefile",
					"format": "ZIP",
					"mediaType": "application/zip",
					"accessURL": "https://www.pacificgeoportal.com/api/download/v1/items/b1198f255cf14b3b8e7d61c2f2f3e038/shapefile?layers=0"
				},
				{
					"@type": "dcat:Distribution",
					"title": "GeoJSON",
					"format": "GeoJSON",
					"mediaType": "application/vnd.geo+json",
					"accessURL": "https://www.pacificgeoportal.com/api/download/v1/items/b1198f255cf14b3b8e7d61c2f2f3e038/geojson?layers=0"
				},
				{
					"@type": "dcat:Distribution",
					"title": "KML",
					"format": "KML",
					"mediaType": "application/vnd.google-earth.kml+xml",
					"accessURL": "https://www.pacificgeoportal.com/api/download/v1/items/b1198f255cf14b3b8e7d61c2f2f3e038/kml?layers=0"
				},
				{
					"@type": "dcat:Distribution",
					"title": "File Geodatabase",
					"format": "ZIP",
					"mediaType": "application/zip",
					"accessURL": "https://www.pacificgeoportal.com/api/download/v1/items/b1198f255cf14b3b8e7d61c2f2f3e038/filegdb?layers=0"
				},
				{
					"@type": "dcat:Distribution",
					"title": "Feature Collection",
					"format": "TXT",
					"mediaType": "text/plain",
					"accessURL": "https://www.pacificgeoportal.com/api/download/v1/items/b1198f255cf14b3b8e7d61c2f2f3e038/featureCollection?layers=0"
				},
				{
					"@type": "dcat:Distribution",
					"title": "Excel",
					"format": "XLSX",
					"mediaType": "application/vnd.ms-excel",
					"accessURL": "https://www.pacificgeoportal.com/api/download/v1/items/b1198f255cf14b3b8e7d61c2f2f3e038/excel?layers=0"
				},
				{
					"@type": "dcat:Distribution",
					"title": "GeoPackage",
					"format": "GPKG",
					"mediaType": "application/geopackage+sqlite3",
					"accessURL": "https://www.pacificgeoportal.com/api/download/v1/items/b1198f255cf14b3b8e7d61c2f2f3e038/geoPackage?layers=0"
				},
				{
					"@type": "dcat:Distribution",
					"title": "SQLite Geodatabase",
					"format": "GDB",
					"mediaType": "application/geopackage+sqlite3",
					"accessURL": "https://www.pacificgeoportal.com/api/download/v1/items/b1198f255cf14b3b8e7d61c2f2f3e038/sqlite?layers=0"
				}
			],
			"theme": [
				"geospatial"
			]
		},
		{
			"@type": "dcat:Dataset",
			"identifier": "https://www.arcgis.com/home/item.html?id=0bcfb29f3d804ecd9708357b0a14ddb0&sublayer=0",
			"landingPage": "https://www.pacificgeoportal.com/datasets/eaglegis::nz-regional-council-boundaries-2019-mature-support",
			"title": "NZ Regional Council boundaries 2019 (Mature Support)",
			"description": "<font size='3'><b><span style='color:firebrick;'>Important Note:</span></b><b> This item is in<span style='color:#C00000;'> mature support</span> as of January 2024 and will retire in January 2025.</b><b><span> When you need the most recent boundary layer please use <a href='https://www.arcgis.com/home/item.html?id=7759fbaecd4649dea39c4ac2b07fc4ab' rel='nofollow ugc'>this item</a>. When you need the boundaries for a specific year, please use <a href='https://www.arcgis.com/home/item.html?id=6ee62a063ce74133af0c7476363ed03e' rel='nofollow ugc'>this item</a> and set a filter on the required year.</span></b><br /><br /></font><div><br /><div><font size='3'>Topicality<b>: </b>01-01-2019</font></div><div><font size='3'><font size='3'>Projection: New Zealand Transverse Mercator (NZTM)</font></font></div><div><font size='3'><br /></font></div><div><div><font size='3'>This layer is based on the dataset REGC2019_V1_00_clipped  retrieved from Stat NZ. It contains the major released version of the annually released regional council boundaries as at 1 January 2019, clipped to the coastline. This clipped version contains 16 regional councils and has been created for map creation/cartographic purposes and does not fully represent the official full extent boundaries.</font></div><div><font size='3'><br /></font></div><div><font size='3'>The official dataset can be found on </font><a href='https://datafinder.stats.govt.nz/layer/98765-regional-council-2019-clipped-generalised/' target='_blank' rel='nofollow ugc noopener noreferrer'>https://datafinder.stats.govt.nz</a>.</div><div><font size='3'><br /></font></div><div><font size='3'>This layer contains the Regional Council name and code and the total area and the total land area in square kilometers. The layer is further generalised by Eagle Technology for improved performance on the web, <span style='font-family:\"Avenir Next W01\", \"Avenir Next W00\", \"Avenir Next\", Avenir, \"Helvetica Neue\", sans-serif;'>therefore it doesn't fully represent the official boundaries.</span></font></div><div><font size='3'><br /></font></div><div><div style='font-family:\"Avenir Next W01\", \"Avenir Next W00\", \"Avenir Next\", Avenir, \"Helvetica Neue\", Helvetica, Arial, sans-serif;'><font color='#2f4f4f' size='3'>This layer is offered by Eagle Technology (Official Esri Distributor). Eagle Technology offers services that can be used in the ArcGIS platform. The Content team at Eagle Technology updates the layers on a regular basis and regularly adds new content to the Living Atlas. By using this content and combining it with other data you can create new information products quickly and easily.</font></div><div style='font-family:\"Avenir Next W01\", \"Avenir Next W00\", \"Avenir Next\", Avenir, \"Helvetica Neue\", Helvetica, Arial, sans-serif;'><font color='#2f4f4f' size='3'><br /></font></div><div style='font-family:\"Avenir Next W01\", \"Avenir Next W00\", \"Avenir Next\", Avenir, \"Helvetica Neue\", Helvetica, Arial, sans-serif;'><font size='3'><font color='#2f4f4f' style=''>If you have any questions or comments about the content, please let us now  at </font><a href='mailto:livingatlas@eagle.co.nz.' style='color:rgb(0, 121, 193); text-decoration-line:none;' target='_blank' rel='nofollow ugc noopener noreferrer'>livingatlas@eagle.co.nz</a></font></div></div></div></div>",
			"keyword": [
				"eaglegis",
				"mature support",
				"retiring",
				"deprecated"
			],
			"issued": "2018-12-21T12:58:21.000Z",
			"modified": "2018-12-21T13:09:24.496Z",
			"publisher": {
				"name": "Eagle Technology Group Ltd"
			},
			"contactPoint": {
				"@type": "vcard:Contact",
				"fn": "eaglegis",
				"hasEmail": "mailto:ts@eaglegis.co.nz"
			},
			"accessLevel": "public",
			"spatial": "166.2620,-47.2230,-177.6196,-33.7735",
			"license": "https://creativecommons.org/licenses/by/4.0",
			"distribution": [
				{
					"@type": "dcat:Distribution",
					"title": "ArcGIS Hub Dataset",
					"format": "Web Page",
					"mediaType": "text/html",
					"accessURL": "https://www.pacificgeoportal.com/datasets/eaglegis::nz-regional-council-boundaries-2019-mature-support"
				},
				{
					"@type": "dcat:Distribution",
					"title": "ArcGIS GeoService",
					"format": "ArcGIS GeoServices REST API",
					"mediaType": "application/json",
					"accessURL": "https://services.arcgis.com/XTtANUDT8Va4DLwI/arcgis/rest/services/Regional_Council_2019_Clipped_generalised/FeatureServer/0"
				},
				{
					"@type": "dcat:Distribution",
					"title": "CSV",
					"format": "CSV",
					"mediaType": "text/csv",
					"accessURL": "https://www.pacificgeoportal.com/api/download/v1/items/0bcfb29f3d804ecd9708357b0a14ddb0/csv?layers=0"
				},
				{
					"@type": "dcat:Distribution",
					"title": "Shapefile",
					"format": "ZIP",
					"mediaType": "application/zip",
					"accessURL": "https://www.pacificgeoportal.com/api/download/v1/items/0bcfb29f3d804ecd9708357b0a14ddb0/shapefile?layers=0"
				},
				{
					"@type": "dcat:Distribution",
					"title": "GeoJSON",
					"format": "GeoJSON",
					"mediaType": "application/vnd.geo+json",
					"accessURL": "https://www.pacificgeoportal.com/api/download/v1/items/0bcfb29f3d804ecd9708357b0a14ddb0/geojson?layers=0"
				},
				{
					"@type": "dcat:Distribution",
					"title": "KML",
					"format": "KML",
					"mediaType": "application/vnd.google-earth.kml+xml",
					"accessURL": "https://www.pacificgeoportal.com/api/download/v1/items/0bcfb29f3d804ecd9708357b0a14ddb0/kml?layers=0"
				}
			],
			"theme": [
				"geospatial"
			]
		},
		{
			"@type": "dcat:Dataset",
			"identifier": "https://www.arcgis.com/home/item.html?id=9880c31547c74b39bb0b2e1508bd191a&sublayer=0",
			"landingPage": "https://www.pacificgeoportal.com/datasets/eaglegis::nz-regional-council-boundaries-2018-mature-support",
			"title": "NZ Regional Council boundaries 2018 (Mature Support)",
			"description": "<font size='3'><b><span style='color:firebrick;'>Important Note:</span></b><b> This item is in<span style='color:#C00000;'> mature support</span> as of January 2024 and will retire in January 2025.</b><b><span> When you need the most recent boundary layer please use <a href='https://www.arcgis.com/home/item.html?id=7759fbaecd4649dea39c4ac2b07fc4ab' rel='nofollow ugc'>this item</a>. When you need the boundaries for a specific year, please use <a href='https://www.arcgis.com/home/item.html?id=6ee62a063ce74133af0c7476363ed03e' rel='nofollow ugc'>this item</a> and set a filter on the required year.</span></b><br /><br /></font><div><br /><font size='3'><b>Topicality: </b>01-01-2018</font><div><font size='3'><br /></font></div><div><div><font size='3'>This layer is based on the dataset REGC2018_V1_00_clipped  retrieved from Stat NZ. It contains the major released version of the annually released regional council boundaries as at 1 January 2018, clipped to the coastline. This clipped version contains 16 regional councils and has been created for map creation/cartographic purposes and does not fully represent the official full extent boundaries.</font></div><div><font size='3'><br /></font></div><div><font size='3'>The official dataset can be found on </font><a href='https://datafinder.stats.govt.nz/layer/92205-regional-council-2018-clipped-generalised/' target='_blank' rel='nofollow ugc noopener noreferrer'>https://datafinder.stats.govt.nz</a>.</div><div><font size='3'><br /></font></div><div><font size='3'>This layer contains the Regional Council name and code and the total area and the total land area in square kilometers. The layer is further generalised by Eagle Technology for improved performance on the web, <span style='font-family: \"Avenir Next W01\", \"Avenir Next W00\", \"Avenir Next\", Avenir, \"Helvetica Neue\", sans-serif;'>therefore it doesn't fully represent the official boundaries.</span></font></div><div><font size='3'><br /></font></div><div><div style='font-family: \"Avenir Next W01\", \"Avenir Next W00\", \"Avenir Next\", Avenir, \"Helvetica Neue\", Helvetica, Arial, sans-serif;'><font color='#2f4f4f' size='3'>This layer is offered by Eagle Technology (Official Esri Distributor). Eagle Technology offers services that can be used in the ArcGIS platform. The Content team at Eagle Technology updates the layers on a regular basis and regularly adds new content to the Living Atlas. By using this content and combining it with other data you can create new information products quickly and easily.</font></div><div style='font-family: \"Avenir Next W01\", \"Avenir Next W00\", \"Avenir Next\", Avenir, \"Helvetica Neue\", Helvetica, Arial, sans-serif;'><font color='#2f4f4f' size='3'><br /></font></div><div style='font-family: \"Avenir Next W01\", \"Avenir Next W00\", \"Avenir Next\", Avenir, \"Helvetica Neue\", Helvetica, Arial, sans-serif;'><font size='3'><font color='#2f4f4f' style=''>If you have any questions or comments about the content, please let us now  at </font><a href='mailto:livingatlas@eagle.co.nz.' style='color: rgb(0, 121, 193); text-decoration-line: none;' target='_blank' rel='nofollow ugc noopener noreferrer'>livingatlas@eagle.co.nz</a></font></div></div></div></div>",
			"keyword": [
				"eaglegis",
				"mature support",
				"retiring",
				"deprecated"
			],
			"issued": "2018-09-03T00:29:26.000Z",
			"modified": "2018-09-04T04:46:17.511Z",
			"publisher": {
				"name": "Eagle Technology Group Ltd"
			},
			"contactPoint": {
				"@type": "vcard:Contact",
				"fn": "eaglegis",
				"hasEmail": "mailto:ts@eaglegis.co.nz"
			},
			"accessLevel": "public",
			"spatial": "166.2620,-47.2230,-177.6196,-33.7735",
			"license": "https://creativecommons.org/licenses/by/4.0",
			"distribution": [
				{
					"@type": "dcat:Distribution",
					"title": "ArcGIS Hub Dataset",
					"format": "Web Page",
					"mediaType": "text/html",
					"accessURL": "https://www.pacificgeoportal.com/datasets/eaglegis::nz-regional-council-boundaries-2018-mature-support"
				},
				{
					"@type": "dcat:Distribution",
					"title": "ArcGIS GeoService",
					"format": "ArcGIS GeoServices REST API",
					"mediaType": "application/json",
					"accessURL": "https://services.arcgis.com/XTtANUDT8Va4DLwI/arcgis/rest/services/NZ_Regional_Council_2018_generalised/FeatureServer/0"
				},
				{
					"@type": "dcat:Distribution",
					"title": "CSV",
					"format": "CSV",
					"mediaType": "text/csv",
					"accessURL": "https://www.pacificgeoportal.com/api/download/v1/items/9880c31547c74b39bb0b2e1508bd191a/csv?layers=0"
				},
				{
					"@type": "dcat:Distribution",
					"title": "Shapefile",
					"format": "ZIP",
					"mediaType": "application/zip",
					"accessURL": "https://www.pacificgeoportal.com/api/download/v1/items/9880c31547c74b39bb0b2e1508bd191a/shapefile?layers=0"
				},
				{
					"@type": "dcat:Distribution",
					"title": "GeoJSON",
					"format": "GeoJSON",
					"mediaType": "application/vnd.geo+json",
					"accessURL": "https://www.pacificgeoportal.com/api/download/v1/items/9880c31547c74b39bb0b2e1508bd191a/geojson?layers=0"
				},
				{
					"@type": "dcat:Distribution",
					"title": "KML",
					"format": "KML",
					"mediaType": "application/vnd.google-earth.kml+xml",
					"accessURL": "https://www.pacificgeoportal.com/api/download/v1/items/9880c31547c74b39bb0b2e1508bd191a/kml?layers=0"
				},
				{
					"@type": "dcat:Distribution",
					"title": "File Geodatabase",
					"format": "ZIP",
					"mediaType": "application/zip",
					"accessURL": "https://www.pacificgeoportal.com/api/download/v1/items/9880c31547c74b39bb0b2e1508bd191a/filegdb?layers=0"
				},
				{
					"@type": "dcat:Distribution",
					"title": "Feature Collection",
					"format": "TXT",
					"mediaType": "text/plain",
					"accessURL": "https://www.pacificgeoportal.com/api/download/v1/items/9880c31547c74b39bb0b2e1508bd191a/featureCollection?layers=0"
				},
				{
					"@type": "dcat:Distribution",
					"title": "Excel",
					"format": "XLSX",
					"mediaType": "application/vnd.ms-excel",
					"accessURL": "https://www.pacificgeoportal.com/api/download/v1/items/9880c31547c74b39bb0b2e1508bd191a/excel?layers=0"
				},
				{
					"@type": "dcat:Distribution",
					"title": "GeoPackage",
					"format": "GPKG",
					"mediaType": "application/geopackage+sqlite3",
					"accessURL": "https://www.pacificgeoportal.com/api/download/v1/items/9880c31547c74b39bb0b2e1508bd191a/geoPackage?layers=0"
				},
				{
					"@type": "dcat:Distribution",
					"title": "SQLite Geodatabase",
					"format": "GDB",
					"mediaType": "application/geopackage+sqlite3",
					"accessURL": "https://www.pacificgeoportal.com/api/download/v1/items/9880c31547c74b39bb0b2e1508bd191a/sqlite?layers=0"
				}
			],
			"theme": [
				"geospatial"
			]
		},
		{
			"@type": "dcat:Dataset",
			"identifier": "https://www.arcgis.com/home/item.html?id=e9dab99cb4594af5a9a82f19420c8e47&sublayer=0",
			"landingPage": "https://www.pacificgeoportal.com/datasets/eaglegis::nz-meshblocks-2021-mature-support",
			"title": "NZ Meshblocks - 2021 (Mature Support)",
			"description": "<font size='3'><b><span style='color:firebrick;'>Important Note:</span></b><b> This item is in<span style='color:#C00000;'> mature support</span> as of January 2024 and will retire in January 2025.</b><b><span> When you need the most recent boundary layer please use <a href='https://www.arcgis.com/home/item.html?id=7fcb716dbf304397a8ee68e92d8fedae' rel='nofollow ugc'>this item</a>. When you need the boundaries for a specific year, please use <a href='https://www.arcgis.com/home/item.html?id=d350fe4ba9364ae89c783eb5a9f0290f' rel='nofollow ugc'>this item</a> and set a filter on the required year.</span></b><br /><br /></font><div><br /><div>Topicality: 01-01-2021</div><div><div style='font-size: 17px; font-family: \"Avenir Next W01\", \"Avenir Next W00\", \"Avenir Next\", Avenir, \"Helvetica Neue\", Helvetica, Arial, sans-serif !important;'><span style='font-size: medium;'>Projection: New Zealand Transverse Mercator (NZTM)</span><br /></div><div style='font-size: 17px; font-family: \"Avenir Next W01\", \"Avenir Next W00\", \"Avenir Next\", Avenir, \"Helvetica Neue\", Helvetica, Arial, sans-serif !important;'></div></div><div><br /></div>This layer is based on the dataset Meshblock 2021 (MB2021) from Stats NZ. Stats NZ maintains an annual meshblock pattern for collecting and producing\nstatistical data. This allows data to be compared over time. A meshblock is the\nsmallest geographic unit for which statistical data is collected and processed by\nStats NZ. A meshblock is defined by a geographic area, which can vary in size\nfrom part of a city block to a large area of rural land.<div><br /></div><div><font face='Avenir Next W01, Avenir Next W00, Avenir Next, Avenir, Helvetica Neue, Helvetica, Arial, sans-serif' size='3' style='font-family: \"Avenir Next W01\", \"Avenir Next W00\", \"Avenir Next\", Avenir, \"Helvetica Neue\", Helvetica, Arial, sans-serif;'>This layer shows the data for 2021. If you would like to use the layer that gets updated yearly with the latest boundary data, you can use <a href='https://www.arcgis.com/home/item.html?id=7fcb716dbf304397a8ee68e92d8fedae' target='_blank' rel='nofollow ugc noopener noreferrer'>this item</a>.<br /><br />All the boundary layers can be found <a href='https://www.arcgis.com/home/group.html?id=8047736c3e43467aa62241976851eff9' target='_blank' rel='nofollow ugc noopener noreferrer'>here</a>.<br /><br />All the boundary layers that are updated yearly can be found <a href='https://www.arcgis.com/home/group.html?id=b22e4f0012a8426dac21cd3d02f25c67' target='_blank' rel='nofollow ugc noopener noreferrer'>here</a>.<br /><br />The official dataset can be found on </font><a href='https://datafinder.stats.govt.nz/data/category/annual-boundaries/2021/' target='_blank' rel='nofollow ugc noopener noreferrer'>https://datafinder.stats.govt.nz</a><span style='font-family: \"Avenir Next W01\", \"Avenir Next W00\", \"Avenir Next\", Avenir, \"Helvetica Neue\", Helvetica, Arial, sans-serif; font-size: 17px;'>.</span></div><div><div style='font-family: \"Avenir Next W01\", \"Avenir Next W00\", \"Avenir Next\", Avenir, \"Helvetica Neue\", Helvetica, Arial, sans-serif; font-size: 17px;'><font size='3'><br /></font></div><div style='font-family: \"Avenir Next W01\", \"Avenir Next W00\", \"Avenir Next\", Avenir, \"Helvetica Neue\", Helvetica, Arial, sans-serif; font-size: 17px;'><font size='3'>This layer contains the following attributes (see data tab):</font></div><div style=''><ul><li>Meshblock number</li><li>Meshblock name</li><li>Total area in square kilometers</li><li>Total land area in square kilometers<br /></li></ul></div></div><div><span style='font-family: \"Avenir Next W01\", \"Avenir Next W00\", \"Avenir Next\", Avenir, \"Helvetica Neue\", Helvetica, Arial, sans-serif; font-size: 17px;'>The layer is further generalised by Eagle Technology for improved performance on the web, </span><span style='font-family: \"Avenir Next W01\", \"Avenir Next W00\", \"Avenir Next\", Avenir, \"Helvetica Neue\", Helvetica, Arial, sans-serif; font-size: medium;'>therefore it doesn't fully represent the official boundaries.</span><br /></div><div><span style='font-family: \"Avenir Next W01\", \"Avenir Next W00\", \"Avenir Next\", Avenir, \"Helvetica Neue\", Helvetica, Arial, sans-serif; font-size: medium;'><br /></span></div><div><div style='font-size: 17px; font-family: \"Avenir Next W01\", \"Avenir Next W00\", \"Avenir Next\", Avenir, \"Helvetica Neue\", Helvetica, Arial, sans-serif !important;'><font color='#2f4f4f' size='3'>This layer is offered by Eagle Technology (Official Esri Distributor). Eagle Technology offers services that can be used in the ArcGIS platform. The Content team at Eagle Technology updates the layers on a regular basis and regularly adds new content to the Living Atlas. By using this content and combining it with other data you can create new information products quickly and easily.</font></div><div style='font-size: 17px; font-family: \"Avenir Next W01\", \"Avenir Next W00\", \"Avenir Next\", Avenir, \"Helvetica Neue\", Helvetica, Arial, sans-serif !important;'><font color='#2f4f4f' size='3'><br /></font></div><div style='font-size: 17px; font-family: \"Avenir Next W01\", \"Avenir Next W00\", \"Avenir Next\", Avenir, \"Helvetica Neue\", Helvetica, Arial, sans-serif !important;'><font size='3'><font color='#2f4f4f'>If you have any questions or comments about the content, please let us now  at </font><a href='mailto:livingatlas@eagle.co.nz' style='color: rgb(0, 121, 193); text-decoration-line: none;' target='_blank' rel='nofollow ugc noopener noreferrer'>livingatlas@eagle.co.nz</a>.</font></div></div><div><span style='font-family: \"Avenir Next W01\", \"Avenir Next W00\", \"Avenir Next\", Avenir, \"Helvetica Neue\", Helvetica, Arial, sans-serif; font-size: medium;'><br /></span></div></div>",
			"keyword": [
				"eaglegis",
				"mature support",
				"retiring",
				"deprecated"
			],
			"issued": "2021-02-04T02:18:10.000Z",
			"modified": "2021-02-15T23:02:51.766Z",
			"publisher": {
				"name": "Eagle Technology Group Ltd"
			},
			"contactPoint": {
				"@type": "vcard:Contact",
				"fn": "eaglegis",
				"hasEmail": "mailto:ts@eaglegis.co.nz"
			},
			"accessLevel": "public",
			"spatial": "166.2620,-47.2230,-177.6190,-33.7734",
			"license": "https://creativecommons.org/licenses/by/4.0",
			"distribution": [
				{
					"@type": "dcat:Distribution",
					"title": "ArcGIS Hub Dataset",
					"format": "Web Page",
					"mediaType": "text/html",
					"accessURL": "https://www.pacificgeoportal.com/datasets/eaglegis::nz-meshblocks-2021-mature-support"
				},
				{
					"@type": "dcat:Distribution",
					"title": "ArcGIS GeoService",
					"format": "ArcGIS GeoServices REST API",
					"mediaType": "application/json",
					"accessURL": "https://services.arcgis.com/XTtANUDT8Va4DLwI/arcgis/rest/services/nz_meshblocks_2021/FeatureServer/0"
				},
				{
					"@type": "dcat:Distribution",
					"title": "CSV",
					"format": "CSV",
					"mediaType": "text/csv",
					"accessURL": "https://www.pacificgeoportal.com/api/download/v1/items/e9dab99cb4594af5a9a82f19420c8e47/csv?layers=0"
				},
				{
					"@type": "dcat:Distribution",
					"title": "Shapefile",
					"format": "ZIP",
					"mediaType": "application/zip",
					"accessURL": "https://www.pacificgeoportal.com/api/download/v1/items/e9dab99cb4594af5a9a82f19420c8e47/shapefile?layers=0"
				},
				{
					"@type": "dcat:Distribution",
					"title": "GeoJSON",
					"format": "GeoJSON",
					"mediaType": "application/vnd.geo+json",
					"accessURL": "https://www.pacificgeoportal.com/api/download/v1/items/e9dab99cb4594af5a9a82f19420c8e47/geojson?layers=0"
				},
				{
					"@type": "dcat:Distribution",
					"title": "KML",
					"format": "KML",
					"mediaType": "application/vnd.google-earth.kml+xml",
					"accessURL": "https://www.pacificgeoportal.com/api/download/v1/items/e9dab99cb4594af5a9a82f19420c8e47/kml?layers=0"
				},
				{
					"@type": "dcat:Distribution",
					"title": "File Geodatabase",
					"format": "ZIP",
					"mediaType": "application/zip",
					"accessURL": "https://www.pacificgeoportal.com/api/download/v1/items/e9dab99cb4594af5a9a82f19420c8e47/filegdb?layers=0"
				},
				{
					"@type": "dcat:Distribution",
					"title": "Feature Collection",
					"format": "TXT",
					"mediaType": "text/plain",
					"accessURL": "https://www.pacificgeoportal.com/api/download/v1/items/e9dab99cb4594af5a9a82f19420c8e47/featureCollection?layers=0"
				},
				{
					"@type": "dcat:Distribution",
					"title": "Excel",
					"format": "XLSX",
					"mediaType": "application/vnd.ms-excel",
					"accessURL": "https://www.pacificgeoportal.com/api/download/v1/items/e9dab99cb4594af5a9a82f19420c8e47/excel?layers=0"
				},
				{
					"@type": "dcat:Distribution",
					"title": "GeoPackage",
					"format": "GPKG",
					"mediaType": "application/geopackage+sqlite3",
					"accessURL": "https://www.pacificgeoportal.com/api/download/v1/items/e9dab99cb4594af5a9a82f19420c8e47/geoPackage?layers=0"
				},
				{
					"@type": "dcat:Distribution",
					"title": "SQLite Geodatabase",
					"format": "GDB",
					"mediaType": "application/geopackage+sqlite3",
					"accessURL": "https://www.pacificgeoportal.com/api/download/v1/items/e9dab99cb4594af5a9a82f19420c8e47/sqlite?layers=0"
				}
			],
			"theme": [
				"geospatial"
			]
		},
		{
			"@type": "dcat:Dataset",
			"identifier": "https://www.arcgis.com/home/item.html?id=17440f3f16d44a7c91ff2ca58e0e00fe&sublayer=0",
			"landingPage": "https://www.pacificgeoportal.com/datasets/eaglegis::nz-meshblock-boundaries-2020-mature-support",
			"title": "NZ Meshblock boundaries 2020 (Mature Support)",
			"description": "<font size='3'><b><span style='color:firebrick;'>Important Note:</span></b><b> This item is in<span style='color:#C00000;'> mature support</span> as of January 2024 and will retire in January 2025.</b><b><span> When you need the most recent boundary layer please use <a href='https://www.arcgis.com/home/item.html?id=7fcb716dbf304397a8ee68e92d8fedae' rel='nofollow ugc'>this item</a>. When you need the boundaries for a specific year, please use <a href='https://www.arcgis.com/home/item.html?id=d350fe4ba9364ae89c783eb5a9f0290f' rel='nofollow ugc'>this item</a> and set a filter on the required year.</span></b><br /><br /></font><div><br /><div>Topicality: 01-01-2020</div><div><div style='font-size: 17px; font-family: \"Avenir Next W01\", \"Avenir Next W00\", \"Avenir Next\", Avenir, \"Helvetica Neue\", Helvetica, Arial, sans-serif !important;'><span style='font-size: medium;'>Projection: New Zealand Transverse Mercator (NZTM)</span><br /></div><div style='font-size: 17px; font-family: \"Avenir Next W01\", \"Avenir Next W00\", \"Avenir Next\", Avenir, \"Helvetica Neue\", Helvetica, Arial, sans-serif !important;'></div></div><div><br /></div>This layer is based on the dataset Meshblock 2020 (MB2020) from Stats NZ. Stat NZ maintains an annual meshblock pattern for collecting and producing\nstatistical data. This allows data to be compared over time. A meshblock is the\nsmallest geographic unit for which statistical data is collected and processed by\nStats NZ. A meshblock is defined by a geographic area, which can vary in size\nfrom part of a city block to a large area of rural land.<div><br /></div><div><font face='Avenir Next W01, Avenir Next W00, Avenir Next, Avenir, Helvetica Neue, Helvetica, Arial, sans-serif' size='3' style='font-family: \"Avenir Next W01\", \"Avenir Next W00\", \"Avenir Next\", Avenir, \"Helvetica Neue\", Helvetica, Arial, sans-serif;'>The official dataset can be found on </font><a href='https://datafinder.stats.govt.nz/data/category/annual-boundaries/2020/' target='_blank' rel='nofollow ugc noopener noreferrer'>https://datafinder.stats.govt.nz</a><span style='font-family: \"Avenir Next W01\", \"Avenir Next W00\", \"Avenir Next\", Avenir, \"Helvetica Neue\", Helvetica, Arial, sans-serif; font-size: 17px;'>.</span></div><div><div style='font-family: \"Avenir Next W01\", \"Avenir Next W00\", \"Avenir Next\", Avenir, \"Helvetica Neue\", Helvetica, Arial, sans-serif; font-size: 17px;'><font size='3'><br /></font></div><div style='font-family: \"Avenir Next W01\", \"Avenir Next W00\", \"Avenir Next\", Avenir, \"Helvetica Neue\", Helvetica, Arial, sans-serif; font-size: 17px;'><font size='3'>This layer contains the following attributes (see data tab):</font></div><div style=''><ul><li>Meshblock number</li><li>Meshblock name</li><li>Total area in square kilometers</li><li>Total land area in square kilometers<br /></li></ul></div></div><div><span style='font-family: \"Avenir Next W01\", \"Avenir Next W00\", \"Avenir Next\", Avenir, \"Helvetica Neue\", Helvetica, Arial, sans-serif; font-size: 17px;'>The layer is further generalised by Eagle Technology for improved performance on the web, </span><span style='font-family: \"Avenir Next W01\", \"Avenir Next W00\", \"Avenir Next\", Avenir, \"Helvetica Neue\", Helvetica, Arial, sans-serif; font-size: medium;'>therefore it doesn't fully represent the official boundaries.</span><br /></div><div><span style='font-family: \"Avenir Next W01\", \"Avenir Next W00\", \"Avenir Next\", Avenir, \"Helvetica Neue\", Helvetica, Arial, sans-serif; font-size: medium;'><br /></span></div><div><div style='font-size: 17px; font-family: \"Avenir Next W01\", \"Avenir Next W00\", \"Avenir Next\", Avenir, \"Helvetica Neue\", Helvetica, Arial, sans-serif !important;'><font color='#2f4f4f' size='3'>This layer is offered by Eagle Technology (Official Esri Distributor). Eagle Technology offers services that can be used in the ArcGIS platform. The Content team at Eagle Technology updates the layers on a regular basis and regularly adds new content to the Living Atlas. By using this content and combining it with other data you can create new information products quickly and easily.</font></div><div style='font-size: 17px; font-family: \"Avenir Next W01\", \"Avenir Next W00\", \"Avenir Next\", Avenir, \"Helvetica Neue\", Helvetica, Arial, sans-serif !important;'><font color='#2f4f4f' size='3'><br /></font></div><div style='font-size: 17px; font-family: \"Avenir Next W01\", \"Avenir Next W00\", \"Avenir Next\", Avenir, \"Helvetica Neue\", Helvetica, Arial, sans-serif !important;'><font size='3'><font color='#2f4f4f'>If you have any questions or comments about the content, please let us now  at </font><a href='mailto:livingatlas@eagle.co.nz' style='color: rgb(0, 121, 193); text-decoration-line: none;' target='_blank' rel='nofollow ugc noopener noreferrer'>livingatlas@eagle.co.nz</a>.</font></div></div><div><span style='font-family: \"Avenir Next W01\", \"Avenir Next W00\", \"Avenir Next\", Avenir, \"Helvetica Neue\", Helvetica, Arial, sans-serif; font-size: medium;'><br /></span></div></div>",
			"keyword": [
				"eaglegis",
				"mature support",
				"retiring",
				"deprecated"
			],
			"issued": "2020-01-11T10:18:45.000Z",
			"modified": "2021-02-10T03:37:55.662Z",
			"publisher": {
				"name": "Eagle Technology Group Ltd"
			},
			"contactPoint": {
				"@type": "vcard:Contact",
				"fn": "eaglegis",
				"hasEmail": "mailto:ts@eaglegis.co.nz"
			},
			"accessLevel": "public",
			"spatial": "166.2620,-47.2230,-177.6190,-33.7734",
			"license": "https://creativecommons.org/licenses/by/4.0",
			"distribution": [
				{
					"@type": "dcat:Distribution",
					"title": "ArcGIS Hub Dataset",
					"format": "Web Page",
					"mediaType": "text/html",
					"accessURL": "https://www.pacificgeoportal.com/datasets/eaglegis::nz-meshblock-boundaries-2020-mature-support"
				},
				{
					"@type": "dcat:Distribution",
					"title": "ArcGIS GeoService",
					"format": "ArcGIS GeoServices REST API",
					"mediaType": "application/json",
					"accessURL": "https://services.arcgis.com/XTtANUDT8Va4DLwI/arcgis/rest/services/Meshblock_2020_Clipped_generalised/FeatureServer/0"
				},
				{
					"@type": "dcat:Distribution",
					"title": "CSV",
					"format": "CSV",
					"mediaType": "text/csv",
					"accessURL": "https://www.pacificgeoportal.com/api/download/v1/items/17440f3f16d44a7c91ff2ca58e0e00fe/csv?layers=0"
				},
				{
					"@type": "dcat:Distribution",
					"title": "Shapefile",
					"format": "ZIP",
					"mediaType": "application/zip",
					"accessURL": "https://www.pacificgeoportal.com/api/download/v1/items/17440f3f16d44a7c91ff2ca58e0e00fe/shapefile?layers=0"
				},
				{
					"@type": "dcat:Distribution",
					"title": "GeoJSON",
					"format": "GeoJSON",
					"mediaType": "application/vnd.geo+json",
					"accessURL": "https://www.pacificgeoportal.com/api/download/v1/items/17440f3f16d44a7c91ff2ca58e0e00fe/geojson?layers=0"
				},
				{
					"@type": "dcat:Distribution",
					"title": "KML",
					"format": "KML",
					"mediaType": "application/vnd.google-earth.kml+xml",
					"accessURL": "https://www.pacificgeoportal.com/api/download/v1/items/17440f3f16d44a7c91ff2ca58e0e00fe/kml?layers=0"
				},
				{
					"@type": "dcat:Distribution",
					"title": "File Geodatabase",
					"format": "ZIP",
					"mediaType": "application/zip",
					"accessURL": "https://www.pacificgeoportal.com/api/download/v1/items/17440f3f16d44a7c91ff2ca58e0e00fe/filegdb?layers=0"
				},
				{
					"@type": "dcat:Distribution",
					"title": "Feature Collection",
					"format": "TXT",
					"mediaType": "text/plain",
					"accessURL": "https://www.pacificgeoportal.com/api/download/v1/items/17440f3f16d44a7c91ff2ca58e0e00fe/featureCollection?layers=0"
				},
				{
					"@type": "dcat:Distribution",
					"title": "Excel",
					"format": "XLSX",
					"mediaType": "application/vnd.ms-excel",
					"accessURL": "https://www.pacificgeoportal.com/api/download/v1/items/17440f3f16d44a7c91ff2ca58e0e00fe/excel?layers=0"
				},
				{
					"@type": "dcat:Distribution",
					"title": "GeoPackage",
					"format": "GPKG",
					"mediaType": "application/geopackage+sqlite3",
					"accessURL": "https://www.pacificgeoportal.com/api/download/v1/items/17440f3f16d44a7c91ff2ca58e0e00fe/geoPackage?layers=0"
				},
				{
					"@type": "dcat:Distribution",
					"title": "SQLite Geodatabase",
					"format": "GDB",
					"mediaType": "application/geopackage+sqlite3",
					"accessURL": "https://www.pacificgeoportal.com/api/download/v1/items/17440f3f16d44a7c91ff2ca58e0e00fe/sqlite?layers=0"
				}
			],
			"theme": [
				"geospatial"
			]
		},
		{
			"@type": "dcat:Dataset",
			"identifier": "https://www.arcgis.com/home/item.html?id=246d2aaa88664108b5d04b5295a9e474&sublayer=0",
			"landingPage": "https://www.pacificgeoportal.com/datasets/eaglegis::nz-meshblock-boundaries-2019-mature-support",
			"title": "NZ Meshblock boundaries 2019 (Mature Support)",
			"description": "<font size='3'><b><span style='color:firebrick;'>Important Note:</span></b><b> This item is in<span style='color:#C00000;'> mature support</span> as of January 2024 and will retire in January 2025.</b><b><span> When you need the most recent boundary layer please use <a href='https://www.arcgis.com/home/item.html?id=7fcb716dbf304397a8ee68e92d8fedae' rel='nofollow ugc'>this item</a>. When you need the boundaries for a specific year, please use <a href='https://www.arcgis.com/home/item.html?id=d350fe4ba9364ae89c783eb5a9f0290f' rel='nofollow ugc'>this item</a> and set a filter on the required year.</span></b><br /><br /></font><div><br /><div>Topicality: 01-01-2019</div><div><div style='font-size: 17px; font-family: \"Avenir Next W01\", \"Avenir Next W00\", \"Avenir Next\", Avenir, \"Helvetica Neue\", Helvetica, Arial, sans-serif !important;'><span style='font-size: medium;'>Projection: New Zealand Transverse Mercator (NZTM)</span><br /></div><div style='font-size: 17px; font-family: \"Avenir Next W01\", \"Avenir Next W00\", \"Avenir Next\", Avenir, \"Helvetica Neue\", Helvetica, Arial, sans-serif !important;'></div></div><div><br /></div>This layer is based on the dataset Meshblock 2019 (MB2019) from Stats NZ. Stat NZ maintains an annual meshblock pattern for collecting and producing\nstatistical data. This allows data to be compared over time. A meshblock is the\nsmallest geographic unit for which statistical data is collected and processed by\nStats NZ. A meshblock is defined by a geographic area, which can vary in size\nfrom part of a city block to a large area of rural land.<div><br /></div><div><font face='Avenir Next W01, Avenir Next W00, Avenir Next, Avenir, Helvetica Neue, Helvetica, Arial, sans-serif' size='3' style='font-family: \"Avenir Next W01\", \"Avenir Next W00\", \"Avenir Next\", Avenir, \"Helvetica Neue\", Helvetica, Arial, sans-serif;'>The official dataset can be found on </font><a href='https://datafinder.stats.govt.nz/layer/98776-meshblock-2019-clipped-generalised/' target='_blank' rel='nofollow ugc noopener noreferrer'>https://datafinder.stats.govt.nz</a><span style='font-family: \"Avenir Next W01\", \"Avenir Next W00\", \"Avenir Next\", Avenir, \"Helvetica Neue\", Helvetica, Arial, sans-serif; font-size: 17px;'>.</span></div><div><div style='font-family: \"Avenir Next W01\", \"Avenir Next W00\", \"Avenir Next\", Avenir, \"Helvetica Neue\", Helvetica, Arial, sans-serif; font-size: 17px;'><font size='3'><br /></font></div><div style='font-family: \"Avenir Next W01\", \"Avenir Next W00\", \"Avenir Next\", Avenir, \"Helvetica Neue\", Helvetica, Arial, sans-serif; font-size: 17px;'><font size='3'>This layer contains the following attributes (see data tab):</font></div><div style=''><ul><li>Meshblock number</li><li>Meshblock name</li><li>Total area in square kilometers</li><li>Total land area in square kilometers<br /></li></ul></div></div><div><span style='font-family: \"Avenir Next W01\", \"Avenir Next W00\", \"Avenir Next\", Avenir, \"Helvetica Neue\", Helvetica, Arial, sans-serif; font-size: 17px;'>The layer is further generalised by Eagle Technology for improved performance on the web, </span><span style='font-family: \"Avenir Next W01\", \"Avenir Next W00\", \"Avenir Next\", Avenir, \"Helvetica Neue\", Helvetica, Arial, sans-serif; font-size: medium;'>therefore it doesn't fully represent the official boundaries.</span><br /></div><div><span style='font-family: \"Avenir Next W01\", \"Avenir Next W00\", \"Avenir Next\", Avenir, \"Helvetica Neue\", Helvetica, Arial, sans-serif; font-size: medium;'><br /></span></div><div><div style='font-size: 17px; font-family: \"Avenir Next W01\", \"Avenir Next W00\", \"Avenir Next\", Avenir, \"Helvetica Neue\", Helvetica, Arial, sans-serif !important;'><font color='#2f4f4f' size='3'>This layer is offered by Eagle Technology (Official Esri Distributor). Eagle Technology offers services that can be used in the ArcGIS platform. The Content team at Eagle Technology updates the layers on a regular basis and regularly adds new content to the Living Atlas. By using this content and combining it with other data you can create new information products quickly and easily.</font></div><div style='font-size: 17px; font-family: \"Avenir Next W01\", \"Avenir Next W00\", \"Avenir Next\", Avenir, \"Helvetica Neue\", Helvetica, Arial, sans-serif !important;'><font color='#2f4f4f' size='3'><br /></font></div><div style='font-size: 17px; font-family: \"Avenir Next W01\", \"Avenir Next W00\", \"Avenir Next\", Avenir, \"Helvetica Neue\", Helvetica, Arial, sans-serif !important;'><font size='3'><font color='#2f4f4f'>If you have any questions or comments about the content, please let us now  at </font><a href='mailto:livingatlas@eagle.co.nz.' style='color: rgb(0, 121, 193); text-decoration-line: none;' target='_blank' rel='nofollow ugc noopener noreferrer'>livingatlas@eagle.co.nz</a>.</font></div></div><div><span style='font-family: \"Avenir Next W01\", \"Avenir Next W00\", \"Avenir Next\", Avenir, \"Helvetica Neue\", Helvetica, Arial, sans-serif; font-size: medium;'><br /></span></div></div>",
			"keyword": [
				"eaglegis",
				"mature support",
				"retiring",
				"deprecated"
			],
			"issued": "2018-12-21T12:56:53.000Z",
			"modified": "2018-12-21T13:10:01.695Z",
			"publisher": {
				"name": "Eagle Technology Group Ltd"
			},
			"contactPoint": {
				"@type": "vcard:Contact",
				"fn": "eaglegis",
				"hasEmail": "mailto:ts@eaglegis.co.nz"
			},
			"accessLevel": "public",
			"spatial": "166.2620,-47.2230,-177.6196,-33.7735",
			"license": "https://creativecommons.org/licenses/by/4.0",
			"distribution": [
				{
					"@type": "dcat:Distribution",
					"title": "ArcGIS Hub Dataset",
					"format": "Web Page",
					"mediaType": "text/html",
					"accessURL": "https://www.pacificgeoportal.com/datasets/eaglegis::nz-meshblock-boundaries-2019-mature-support"
				},
				{
					"@type": "dcat:Distribution",
					"title": "ArcGIS GeoService",
					"format": "ArcGIS GeoServices REST API",
					"mediaType": "application/json",
					"accessURL": "https://services.arcgis.com/XTtANUDT8Va4DLwI/arcgis/rest/services/Meshblock_2019_Clipped_generalised/FeatureServer/0"
				},
				{
					"@type": "dcat:Distribution",
					"title": "CSV",
					"format": "CSV",
					"mediaType": "text/csv",
					"accessURL": "https://www.pacificgeoportal.com/api/download/v1/items/246d2aaa88664108b5d04b5295a9e474/csv?layers=0"
				},
				{
					"@type": "dcat:Distribution",
					"title": "Shapefile",
					"format": "ZIP",
					"mediaType": "application/zip",
					"accessURL": "https://www.pacificgeoportal.com/api/download/v1/items/246d2aaa88664108b5d04b5295a9e474/shapefile?layers=0"
				},
				{
					"@type": "dcat:Distribution",
					"title": "GeoJSON",
					"format": "GeoJSON",
					"mediaType": "application/vnd.geo+json",
					"accessURL": "https://www.pacificgeoportal.com/api/download/v1/items/246d2aaa88664108b5d04b5295a9e474/geojson?layers=0"
				},
				{
					"@type": "dcat:Distribution",
					"title": "KML",
					"format": "KML",
					"mediaType": "application/vnd.google-earth.kml+xml",
					"accessURL": "https://www.pacificgeoportal.com/api/download/v1/items/246d2aaa88664108b5d04b5295a9e474/kml?layers=0"
				}
			],
			"theme": [
				"geospatial"
			]
		},
		{
			"@type": "dcat:Dataset",
			"identifier": "https://www.arcgis.com/home/item.html?id=46a6badbb89942d7b4cd95a57a4e4a9c&sublayer=0",
			"landingPage": "https://www.pacificgeoportal.com/datasets/eaglegis::nz-meshblock-boundaries-2018-mature-support",
			"title": "NZ Meshblock boundaries 2018 (Mature Support)",
			"description": "<font size='3'><b><span style='color:firebrick;'>Important Note:</span></b><b> This item is in<span style='color:#C00000;'> mature support</span> as of January 2024 and will retire in January 2025.</b><b><span> When you need the most recent boundary layer please use <a href='https://www.arcgis.com/home/item.html?id=7fcb716dbf304397a8ee68e92d8fedae' rel='nofollow ugc'>this item</a>. When you need the boundaries for a specific year, please use <a href='https://www.arcgis.com/home/item.html?id=d350fe4ba9364ae89c783eb5a9f0290f' rel='nofollow ugc'>this item</a> and set a filter on the required year.</span></b><br /><br /></font><div><br /><div>Topicality: 01-01-2018</div><div><div style='font-size: 17px; font-family: \"Avenir Next W01\", \"Avenir Next W00\", \"Avenir Next\", Avenir, \"Helvetica Neue\", Helvetica, Arial, sans-serif !important;'><span style='font-size: medium;'>Projection: New Zealand Transverse Mercator (NZTM)</span><br /></div><div style='font-size: 17px; font-family: \"Avenir Next W01\", \"Avenir Next W00\", \"Avenir Next\", Avenir, \"Helvetica Neue\", Helvetica, Arial, sans-serif !important;'></div></div><div><br /></div>This layer is based on the dataset Meshblock 2018 (MB2018) from Stats NZ. Stat NZ maintains an annual meshblock pattern for collecting and producing\nstatistical data. This allows data to be compared over time. A meshblock is the\nsmallest geographic unit for which statistical data is collected and processed by\nStats NZ. A meshblock is defined by a geographic area, which can vary in size\nfrom part of a city block to a large area of rural land.<div><br /></div><div><font face='Avenir Next W01, Avenir Next W00, Avenir Next, Avenir, Helvetica Neue, Helvetica, Arial, sans-serif' size='3' style='font-family: \"Avenir Next W01\", \"Avenir Next W00\", \"Avenir Next\", Avenir, \"Helvetica Neue\", Helvetica, Arial, sans-serif;'>The official dataset can be found on </font><a href='https://datafinder.stats.govt.nz/layer/92198-meshblock-2018-clipped-generalised/' target='_blank' rel='nofollow ugc noopener noreferrer'>https://datafinder.stats.govt.nz</a><span style='font-family: \"Avenir Next W01\", \"Avenir Next W00\", \"Avenir Next\", Avenir, \"Helvetica Neue\", Helvetica, Arial, sans-serif; font-size: 17px;'>.</span></div><div><div style='font-family: \"Avenir Next W01\", \"Avenir Next W00\", \"Avenir Next\", Avenir, \"Helvetica Neue\", Helvetica, Arial, sans-serif; font-size: 17px;'><font size='3'><br /></font></div><div style='font-family: \"Avenir Next W01\", \"Avenir Next W00\", \"Avenir Next\", Avenir, \"Helvetica Neue\", Helvetica, Arial, sans-serif; font-size: 17px;'><font size='3'>This layer contains the following attributes (see data tab):</font></div><div style=''><ul><li>Meshblock number</li><li>Meshblock name</li><li>Total area in square kilometers</li><li>Total land area in square kilometers<br /></li></ul></div></div><div><span style='font-family: \"Avenir Next W01\", \"Avenir Next W00\", \"Avenir Next\", Avenir, \"Helvetica Neue\", Helvetica, Arial, sans-serif; font-size: 17px;'>The layer is further generalised by Eagle Technology for improved performance on the web, </span><span style='font-family: \"Avenir Next W01\", \"Avenir Next W00\", \"Avenir Next\", Avenir, \"Helvetica Neue\", Helvetica, Arial, sans-serif; font-size: medium;'>therefore it doesn't fully represent the official boundaries.</span><br /></div><div><span style='font-family: \"Avenir Next W01\", \"Avenir Next W00\", \"Avenir Next\", Avenir, \"Helvetica Neue\", Helvetica, Arial, sans-serif; font-size: medium;'><br /></span></div><div><div style='font-size: 17px; font-family: \"Avenir Next W01\", \"Avenir Next W00\", \"Avenir Next\", Avenir, \"Helvetica Neue\", Helvetica, Arial, sans-serif !important;'><font color='#2f4f4f' size='3'>This layer is offered by Eagle Technology (Official Esri Distributor). Eagle Technology offers services that can be used in the ArcGIS platform. The Content team at Eagle Technology updates the layers on a regular basis and regularly adds new content to the Living Atlas. By using this content and combining it with other data you can create new information products quickly and easily.</font></div><div style='font-size: 17px; font-family: \"Avenir Next W01\", \"Avenir Next W00\", \"Avenir Next\", Avenir, \"Helvetica Neue\", Helvetica, Arial, sans-serif !important;'><font color='#2f4f4f' size='3'><br /></font></div><div style='font-size: 17px; font-family: \"Avenir Next W01\", \"Avenir Next W00\", \"Avenir Next\", Avenir, \"Helvetica Neue\", Helvetica, Arial, sans-serif !important;'><font size='3'><font color='#2f4f4f'>If you have any questions or comments about the content, please let us now  at </font><a href='mailto:livingatlas@eagle.co.nz.' style='color: rgb(0, 121, 193); text-decoration-line: none;' target='_blank' rel='nofollow ugc noopener noreferrer'>livingatlas@eagle.co.nz</a>.</font></div></div><div><span style='font-family: \"Avenir Next W01\", \"Avenir Next W00\", \"Avenir Next\", Avenir, \"Helvetica Neue\", Helvetica, Arial, sans-serif; font-size: medium;'><br /></span></div></div>",
			"keyword": [
				"eaglegis",
				"mature support",
				"retiring",
				"deprecated"
			],
			"issued": "2018-09-04T04:03:12.000Z",
			"modified": "2018-11-04T23:15:26.818Z",
			"publisher": {
				"name": "Eagle Technology Group Ltd"
			},
			"contactPoint": {
				"@type": "vcard:Contact",
				"fn": "eaglegis",
				"hasEmail": "mailto:ts@eaglegis.co.nz"
			},
			"accessLevel": "public",
			"spatial": "166.2620,-47.2230,-177.6196,-33.7735",
			"license": "https://creativecommons.org/licenses/by/4.0",
			"distribution": [
				{
					"@type": "dcat:Distribution",
					"title": "ArcGIS Hub Dataset",
					"format": "Web Page",
					"mediaType": "text/html",
					"accessURL": "https://www.pacificgeoportal.com/datasets/eaglegis::nz-meshblock-boundaries-2018-mature-support"
				},
				{
					"@type": "dcat:Distribution",
					"title": "ArcGIS GeoService",
					"format": "ArcGIS GeoServices REST API",
					"mediaType": "application/json",
					"accessURL": "https://services.arcgis.com/XTtANUDT8Va4DLwI/arcgis/rest/services/NZ_Meshblock_boundaries_2018_generalised/FeatureServer/0"
				},
				{
					"@type": "dcat:Distribution",
					"title": "CSV",
					"format": "CSV",
					"mediaType": "text/csv",
					"accessURL": "https://www.pacificgeoportal.com/api/download/v1/items/46a6badbb89942d7b4cd95a57a4e4a9c/csv?layers=0"
				},
				{
					"@type": "dcat:Distribution",
					"title": "Shapefile",
					"format": "ZIP",
					"mediaType": "application/zip",
					"accessURL": "https://www.pacificgeoportal.com/api/download/v1/items/46a6badbb89942d7b4cd95a57a4e4a9c/shapefile?layers=0"
				},
				{
					"@type": "dcat:Distribution",
					"title": "GeoJSON",
					"format": "GeoJSON",
					"mediaType": "application/vnd.geo+json",
					"accessURL": "https://www.pacificgeoportal.com/api/download/v1/items/46a6badbb89942d7b4cd95a57a4e4a9c/geojson?layers=0"
				},
				{
					"@type": "dcat:Distribution",
					"title": "KML",
					"format": "KML",
					"mediaType": "application/vnd.google-earth.kml+xml",
					"accessURL": "https://www.pacificgeoportal.com/api/download/v1/items/46a6badbb89942d7b4cd95a57a4e4a9c/kml?layers=0"
				},
				{
					"@type": "dcat:Distribution",
					"title": "File Geodatabase",
					"format": "ZIP",
					"mediaType": "application/zip",
					"accessURL": "https://www.pacificgeoportal.com/api/download/v1/items/46a6badbb89942d7b4cd95a57a4e4a9c/filegdb?layers=0"
				},
				{
					"@type": "dcat:Distribution",
					"title": "Feature Collection",
					"format": "TXT",
					"mediaType": "text/plain",
					"accessURL": "https://www.pacificgeoportal.com/api/download/v1/items/46a6badbb89942d7b4cd95a57a4e4a9c/featureCollection?layers=0"
				},
				{
					"@type": "dcat:Distribution",
					"title": "Excel",
					"format": "XLSX",
					"mediaType": "application/vnd.ms-excel",
					"accessURL": "https://www.pacificgeoportal.com/api/download/v1/items/46a6badbb89942d7b4cd95a57a4e4a9c/excel?layers=0"
				},
				{
					"@type": "dcat:Distribution",
					"title": "GeoPackage",
					"format": "GPKG",
					"mediaType": "application/geopackage+sqlite3",
					"accessURL": "https://www.pacificgeoportal.com/api/download/v1/items/46a6badbb89942d7b4cd95a57a4e4a9c/geoPackage?layers=0"
				},
				{
					"@type": "dcat:Distribution",
					"title": "SQLite Geodatabase",
					"format": "GDB",
					"mediaType": "application/geopackage+sqlite3",
					"accessURL": "https://www.pacificgeoportal.com/api/download/v1/items/46a6badbb89942d7b4cd95a57a4e4a9c/sqlite?layers=0"
				}
			],
			"theme": [
				"geospatial"
			]
		},
		{
			"@type": "dcat:Dataset",
			"identifier": "https://www.arcgis.com/home/item.html?id=3a2916ede1154c518ce0d2b980d22ede&sublayer=0",
			"landingPage": "https://www.pacificgeoportal.com/datasets/eaglegis::nz-māori-constituencies-2021-mature-support",
			"title": "NZ Māori Constituencies - 2021 (Mature Support)",
			"description": "<font size='3'><b><span style='color:firebrick;'>Important Note:</span></b><b> This item is in<span style='color:#C00000;'> mature support</span> as of January 2024 and will retire in January 2025.</b><b><span> When you need the most recent boundary layer please use <a href='https://www.arcgis.com/home/item.html?id=c79cf92a933a44b8ba27ed833163202f' rel='nofollow ugc'>this item</a>. When you need the boundaries for a specific year, please use <a href='https://www.arcgis.com/home/item.html?id=8d442899956446188be600fbaa8ad6dc' rel='nofollow ugc'>this item</a> and set a filter on the required year.</span></b><br /><br /></font><div><br /><font size='3' style='font-family: \"Avenir Next W01\", \"Avenir Next W00\", \"Avenir Next\", Avenir, \"Helvetica Neue\", Helvetica, Arial, sans-serif !important;'>Topicality: 01-01-2021</font><div><font face='Avenir Next W01, Avenir Next W00, Avenir Next, Avenir, Helvetica Neue, Helvetica, Arial, sans-serif' size='3'>Projection: New Zealand Transverse Mercator (NZTM)<br /></font><div style='font-size: 17px; font-family: \"Avenir Next W01\", \"Avenir Next W00\", \"Avenir Next\", Avenir, \"Helvetica Neue\", Helvetica, Arial, sans-serif !important;'><font size='3'><br /></font></div><div><div style='font-size: 17px; font-family: \"Avenir Next W01\", \"Avenir Next W00\", \"Avenir Next\", Avenir, \"Helvetica Neue\", Helvetica, Arial, sans-serif !important;'><font face='Avenir Next W01, Avenir Next W00, Avenir Next, Avenir, Helvetica Neue, Helvetica, Arial, sans-serif'>This layer is based on the </font>definitive set of regional council Māori constituency boundaries for 2021 as defined by the regional councils and Local Government Commission but maintained by Stats NZ (the custodian).<font face='Avenir Next W01, Avenir Next W00, Avenir Next, Avenir, Helvetica Neue, Helvetica, Arial, sans-serif'> </font></div></div><div style='font-size: 17px; font-family: \"Avenir Next W01\", \"Avenir Next W00\", \"Avenir Next\", Avenir, \"Helvetica Neue\", Helvetica, Arial, sans-serif !important;'><font face='Avenir Next W01, Avenir Next W00, Avenir Next, Avenir, Helvetica Neue, Helvetica, Arial, sans-serif'><br /></font></div><div style='font-size: 17px; font-family: \"Avenir Next W01\", \"Avenir Next W00\", \"Avenir Next\", Avenir, \"Helvetica Neue\", Helvetica, Arial, sans-serif !important;'>Māori constituencies are established under the Local Electoral Act 2001 and\nresult from the division of a region for electoral purposes.<font face='Avenir Next W01, Avenir Next W00, Avenir Next, Avenir, Helvetica Neue, Helvetica, Arial, sans-serif'><br /></font></div><div style='font-size: 17px; font-family: \"Avenir Next W01\", \"Avenir Next W00\", \"Avenir Next\", Avenir, \"Helvetica Neue\", Helvetica, Arial, sans-serif !important;'><br /></div><div style='font-size: 17px; font-family: \"Avenir Next W01\", \"Avenir Next W00\", \"Avenir Next\", Avenir, \"Helvetica Neue\", Helvetica, Arial, sans-serif !important;'>Māori constituencies are divisions of regional council areas. They are created,\nbased on population, to be the voting areas within councils. Māori\nconstituencies are defined at meshblock level, and do not coincide with the\nstatistical area 1 (SA1) geography or the statistical area 2 (SA2) geography. </div><div style='font-size: 17px; font-family: \"Avenir Next W01\", \"Avenir Next W00\", \"Avenir Next\", Avenir, \"Helvetica Neue\", Helvetica, Arial, sans-serif !important;'><br /></div><div style='font-size: 17px; font-family: \"Avenir Next W01\", \"Avenir Next W00\", \"Avenir Next\", Avenir, \"Helvetica Neue\", Helvetica, Arial, sans-serif !important;'>If a regional council decides to have a Māori constituency, the constituencies\nwithin the council are known as general constituencies and Māori\nconstituencies. </div><div style='font-size: 17px; font-family: \"Avenir Next W01\", \"Avenir Next W00\", \"Avenir Next\", Avenir, \"Helvetica Neue\", Helvetica, Arial, sans-serif !important;'><br /></div><div style='font-size: 17px; font-family: \"Avenir Next W01\", \"Avenir Next W00\", \"Avenir Next\", Avenir, \"Helvetica Neue\", Helvetica, Arial, sans-serif !important;'>Classifications exist annually from 2005 to 2021. </div><div style='font-size: 17px; font-family: \"Avenir Next W01\", \"Avenir Next W00\", \"Avenir Next\", Avenir, \"Helvetica Neue\", Helvetica, Arial, sans-serif !important;'><br /></div><div style='font-size: 17px; font-family: \"Avenir Next W01\", \"Avenir Next W00\", \"Avenir Next\", Avenir, \"Helvetica Neue\", Helvetica, Arial, sans-serif !important;'>The boundaries of Māori constituencies may be reviewed before each three yearly\nlocal government election. Regional councils must review their\nrepresentation arrangements at least once every six years. The provisions for\nsuch reviews are contained in the Local Government Act 2002. </div><div style='font-size: 17px; font-family: \"Avenir Next W01\", \"Avenir Next W00\", \"Avenir Next\", Avenir, \"Helvetica Neue\", Helvetica, Arial, sans-serif !important;'><br /></div><div style='font-size: 17px; font-family: \"Avenir Next W01\", \"Avenir Next W00\", \"Avenir Next\", Avenir, \"Helvetica Neue\", Helvetica, Arial, sans-serif !important;'>Māori constituencies are numbered based on their corresponding regional\ncouncil. Each Māori constituency has a unique four-digit code. The first two\ndigits represent the regional council that the Māori constituency lies within. The\nlast two digits are sequential and represent the number of Māori constituencies\nwithin a regional council. For example, the Waikato Regional Council (03)\ncontains two Māori constituencies which are coded 0301 and 0302.<br /></div><div style='font-size: 17px; font-family: \"Avenir Next W01\", \"Avenir Next W00\", \"Avenir Next\", Avenir, \"Helvetica Neue\", Helvetica, Arial, sans-serif !important;'><br /></div><div style='font-size: 17px; font-family: \"Avenir Next W01\", \"Avenir Next W00\", \"Avenir Next\", Avenir, \"Helvetica Neue\", Helvetica, Arial, sans-serif !important;'><span style='font-size: medium;'>This layer shows the data for 2021. If you would like to use the layer that gets updated yearly with the latest boundary data, you can use <a href='https://www.arcgis.com/home/item.html?id=c79cf92a933a44b8ba27ed833163202f' target='_blank' rel='nofollow ugc noopener noreferrer'>this item</a>.<br /><br />All the boundary layers can be found <a href='https://www.arcgis.com/home/group.html?id=8047736c3e43467aa62241976851eff9' target='_blank' rel='nofollow ugc noopener noreferrer'>here</a>.<br /><br />All the boundary layers that are updated yearly can be found <a href='https://www.arcgis.com/home/group.html?id=b22e4f0012a8426dac21cd3d02f25c67' target='_blank' rel='nofollow ugc noopener noreferrer'>here</a>.<br /><br />The official dataset can be found on</span><font face='Avenir Next W01, Avenir Next W00, Avenir Next, Avenir, Helvetica Neue, Helvetica, Arial, sans-serif' size='3'> </font><a href='https://datafinder.stats.govt.nz/data/category/annual-boundaries/2021/' target='_blank' rel='nofollow ugc noopener noreferrer'>https://datafinder.stats.govt.nz</a>.<br /></div><div style='font-size: 17px; font-family: \"Avenir Next W01\", \"Avenir Next W00\", \"Avenir Next\", Avenir, \"Helvetica Neue\", Helvetica, Arial, sans-serif !important;'><div><br /></div><div><div><font size='3'>This layer contains the following attributes (see data tab):</font></div><div><ul><li>Māori Constituency code</li><li>Māori Constituency name</li><li>Total area in square kilometers</li><li>Total land area in square kilometers.</li></ul><div><span style='font-size: medium;'>The layer is further generalised by Eagle Technology for improved performance on the web, </span><span style='font-family: \"Avenir Next W01\", \"Avenir Next W00\", \"Avenir Next\", Avenir, \"Helvetica Neue\", sans-serif; font-size: medium;'>therefore it doesn't fully represent the official boundaries.</span><br /></div></div></div><div><font size='3'><br /></font></div><div><div><font color='#2f4f4f' size='3'>This layer is offered by Eagle Technology (Official Esri Distributor). Eagle Technology offers services that can be used in the ArcGIS platform. The Content team at Eagle Technology updates the layers on a regular basis and regularly adds new content to the Living Atlas. By using this content and combining it with other data you can create new information products quickly and easily.</font></div><div><font color='#2f4f4f' size='3'><br /></font></div><div><font size='3'><font color='#2f4f4f'>If you have any questions or comments about the content, please let us now  at </font><a href='mailto:livingatlas@eagle.co.nz' style='color: rgb(0, 121, 193); text-decoration-line: none;' target='_blank' rel='nofollow ugc noopener noreferrer'>livingatlas@eagle.co.nz</a></font></div></div></div></div></div>",
			"keyword": [
				"eaglegis",
				"mature support",
				"retiring",
				"deprecated"
			],
			"issued": "2021-02-04T02:17:45.000Z",
			"modified": "2021-02-15T23:02:39.148Z",
			"publisher": {
				"name": "Eagle Technology Group Ltd"
			},
			"contactPoint": {
				"@type": "vcard:Contact",
				"fn": "eaglegis",
				"hasEmail": "mailto:ts@eaglegis.co.nz"
			},
			"accessLevel": "public",
			"spatial": "166.2620,-47.2230,-177.6189,-33.7734",
			"license": "https://creativecommons.org/licenses/by/4.0",
			"distribution": [
				{
					"@type": "dcat:Distribution",
					"title": "ArcGIS Hub Dataset",
					"format": "Web Page",
					"mediaType": "text/html",
					"accessURL": "https://www.pacificgeoportal.com/datasets/eaglegis::nz-māori-constituencies-2021-mature-support"
				},
				{
					"@type": "dcat:Distribution",
					"title": "ArcGIS GeoService",
					"format": "ArcGIS GeoServices REST API",
					"mediaType": "application/json",
					"accessURL": "https://services.arcgis.com/XTtANUDT8Va4DLwI/arcgis/rest/services/nz_maori_constituencies_2021/FeatureServer/0"
				},
				{
					"@type": "dcat:Distribution",
					"title": "CSV",
					"format": "CSV",
					"mediaType": "text/csv",
					"accessURL": "https://www.pacificgeoportal.com/api/download/v1/items/3a2916ede1154c518ce0d2b980d22ede/csv?layers=0"
				},
				{
					"@type": "dcat:Distribution",
					"title": "Shapefile",
					"format": "ZIP",
					"mediaType": "application/zip",
					"accessURL": "https://www.pacificgeoportal.com/api/download/v1/items/3a2916ede1154c518ce0d2b980d22ede/shapefile?layers=0"
				},
				{
					"@type": "dcat:Distribution",
					"title": "GeoJSON",
					"format": "GeoJSON",
					"mediaType": "application/vnd.geo+json",
					"accessURL": "https://www.pacificgeoportal.com/api/download/v1/items/3a2916ede1154c518ce0d2b980d22ede/geojson?layers=0"
				},
				{
					"@type": "dcat:Distribution",
					"title": "KML",
					"format": "KML",
					"mediaType": "application/vnd.google-earth.kml+xml",
					"accessURL": "https://www.pacificgeoportal.com/api/download/v1/items/3a2916ede1154c518ce0d2b980d22ede/kml?layers=0"
				},
				{
					"@type": "dcat:Distribution",
					"title": "File Geodatabase",
					"format": "ZIP",
					"mediaType": "application/zip",
					"accessURL": "https://www.pacificgeoportal.com/api/download/v1/items/3a2916ede1154c518ce0d2b980d22ede/filegdb?layers=0"
				},
				{
					"@type": "dcat:Distribution",
					"title": "Feature Collection",
					"format": "TXT",
					"mediaType": "text/plain",
					"accessURL": "https://www.pacificgeoportal.com/api/download/v1/items/3a2916ede1154c518ce0d2b980d22ede/featureCollection?layers=0"
				},
				{
					"@type": "dcat:Distribution",
					"title": "Excel",
					"format": "XLSX",
					"mediaType": "application/vnd.ms-excel",
					"accessURL": "https://www.pacificgeoportal.com/api/download/v1/items/3a2916ede1154c518ce0d2b980d22ede/excel?layers=0"
				},
				{
					"@type": "dcat:Distribution",
					"title": "GeoPackage",
					"format": "GPKG",
					"mediaType": "application/geopackage+sqlite3",
					"accessURL": "https://www.pacificgeoportal.com/api/download/v1/items/3a2916ede1154c518ce0d2b980d22ede/geoPackage?layers=0"
				},
				{
					"@type": "dcat:Distribution",
					"title": "SQLite Geodatabase",
					"format": "GDB",
					"mediaType": "application/geopackage+sqlite3",
					"accessURL": "https://www.pacificgeoportal.com/api/download/v1/items/3a2916ede1154c518ce0d2b980d22ede/sqlite?layers=0"
				}
			],
			"theme": [
				"geospatial"
			]
		},
		{
			"@type": "dcat:Dataset",
			"identifier": "https://www.arcgis.com/home/item.html?id=44afde660b84432a99bd3087f716374a&sublayer=0",
			"landingPage": "https://www.pacificgeoportal.com/datasets/eaglegis::nz-māori-constituency-boundaries-2020-mature-support",
			"title": "NZ Māori Constituency boundaries 2020 (Mature Support)",
			"description": "<font size='3'><b><span style='color:firebrick;'>Important Note:</span></b><b> This item is in<span style='color:#C00000;'> mature support</span> as of January 2024 and will retire in January 2025.</b><b><span> When you need the most recent boundary layer please use <a href='https://www.arcgis.com/home/item.html?id=c79cf92a933a44b8ba27ed833163202f' rel='nofollow ugc'>this item</a>. When you need the boundaries for a specific year, please use <a href='https://www.arcgis.com/home/item.html?id=8d442899956446188be600fbaa8ad6dc' rel='nofollow ugc'>this item</a> and set a filter on the required year.</span></b><br /><br /></font><div><br /><font size='3' style='font-family: \"Avenir Next W01\", \"Avenir Next W00\", \"Avenir Next\", Avenir, \"Helvetica Neue\", Helvetica, Arial, sans-serif !important;'>Topicality: 01-01-2020</font><div><font face='Avenir Next W01, Avenir Next W00, Avenir Next, Avenir, Helvetica Neue, Helvetica, Arial, sans-serif' size='3'>Projection: New Zealand Transverse Mercator (NZTM)<br /></font><div style='font-size: 17px; font-family: \"Avenir Next W01\", \"Avenir Next W00\", \"Avenir Next\", Avenir, \"Helvetica Neue\", Helvetica, Arial, sans-serif !important;'><font size='3'><br /></font></div><div><div style='font-size: 17px; font-family: \"Avenir Next W01\", \"Avenir Next W00\", \"Avenir Next\", Avenir, \"Helvetica Neue\", Helvetica, Arial, sans-serif !important;'><font face='Avenir Next W01, Avenir Next W00, Avenir Next, Avenir, Helvetica Neue, Helvetica, Arial, sans-serif'>This layer is based on the </font>definitive set of regional council Māori constituency boundaries for 2020 as defined by the regional councils and Local Government Commission but maintained by Stats NZ (the custodian).<font face='Avenir Next W01, Avenir Next W00, Avenir Next, Avenir, Helvetica Neue, Helvetica, Arial, sans-serif'> </font></div></div><div style='font-size: 17px; font-family: \"Avenir Next W01\", \"Avenir Next W00\", \"Avenir Next\", Avenir, \"Helvetica Neue\", Helvetica, Arial, sans-serif !important;'><font face='Avenir Next W01, Avenir Next W00, Avenir Next, Avenir, Helvetica Neue, Helvetica, Arial, sans-serif'><br /></font></div><div style='font-size: 17px; font-family: \"Avenir Next W01\", \"Avenir Next W00\", \"Avenir Next\", Avenir, \"Helvetica Neue\", Helvetica, Arial, sans-serif !important;'>Māori constituencies are established under the Local Electoral Act 2001 and\nresult from the division of a region for electoral purposes.<font face='Avenir Next W01, Avenir Next W00, Avenir Next, Avenir, Helvetica Neue, Helvetica, Arial, sans-serif'><br /></font></div><div style='font-size: 17px; font-family: \"Avenir Next W01\", \"Avenir Next W00\", \"Avenir Next\", Avenir, \"Helvetica Neue\", Helvetica, Arial, sans-serif !important;'><br /></div><div style='font-size: 17px; font-family: \"Avenir Next W01\", \"Avenir Next W00\", \"Avenir Next\", Avenir, \"Helvetica Neue\", Helvetica, Arial, sans-serif !important;'>Māori constituencies are divisions of regional council areas. They are created,\nbased on population, to be the voting areas within councils. Māori\nconstituencies are defined at meshblock level, and do not coincide with the\nstatistical area 1 (SA1) geography or the statistical area 2 (SA2) geography. </div><div style='font-size: 17px; font-family: \"Avenir Next W01\", \"Avenir Next W00\", \"Avenir Next\", Avenir, \"Helvetica Neue\", Helvetica, Arial, sans-serif !important;'><br /></div><div style='font-size: 17px; font-family: \"Avenir Next W01\", \"Avenir Next W00\", \"Avenir Next\", Avenir, \"Helvetica Neue\", Helvetica, Arial, sans-serif !important;'>If a regional council decides to have a Māori constituency, the constituencies\nwithin the council are known as general constituencies and Māori\nconstituencies. </div><div style='font-size: 17px; font-family: \"Avenir Next W01\", \"Avenir Next W00\", \"Avenir Next\", Avenir, \"Helvetica Neue\", Helvetica, Arial, sans-serif !important;'><br /></div><div style='font-size: 17px; font-family: \"Avenir Next W01\", \"Avenir Next W00\", \"Avenir Next\", Avenir, \"Helvetica Neue\", Helvetica, Arial, sans-serif !important;'>Classifications exist annually from 2005 to 2020. </div><div style='font-size: 17px; font-family: \"Avenir Next W01\", \"Avenir Next W00\", \"Avenir Next\", Avenir, \"Helvetica Neue\", Helvetica, Arial, sans-serif !important;'><br /></div><div style='font-size: 17px; font-family: \"Avenir Next W01\", \"Avenir Next W00\", \"Avenir Next\", Avenir, \"Helvetica Neue\", Helvetica, Arial, sans-serif !important;'>The boundaries of Māori constituencies may be reviewed before each three yearly\nlocal government election. Regional councils must review their\nrepresentation arrangements at least once every six years. The provisions for\nsuch reviews are contained in the Local Government Act 2002. </div><div style='font-size: 17px; font-family: \"Avenir Next W01\", \"Avenir Next W00\", \"Avenir Next\", Avenir, \"Helvetica Neue\", Helvetica, Arial, sans-serif !important;'><br /></div><div style='font-size: 17px; font-family: \"Avenir Next W01\", \"Avenir Next W00\", \"Avenir Next\", Avenir, \"Helvetica Neue\", Helvetica, Arial, sans-serif !important;'>Māori constituencies are numbered based on their corresponding regional\ncouncil. Each Māori constituency has a unique four-digit code. The first two\ndigits represent the regional council that the Māori constituency lies within. The\nlast two digits are sequential and represent the number of Māori constituencies\nwithin a regional council. For example, the Waikato Regional Council (03)\ncontains two Māori constituencies which are coded 0301 and 0302.<br /></div><div style='font-size: 17px; font-family: \"Avenir Next W01\", \"Avenir Next W00\", \"Avenir Next\", Avenir, \"Helvetica Neue\", Helvetica, Arial, sans-serif !important;'><br /></div><div style='font-size: 17px; font-family: \"Avenir Next W01\", \"Avenir Next W00\", \"Avenir Next\", Avenir, \"Helvetica Neue\", Helvetica, Arial, sans-serif !important;'><span style='font-size: medium;'>The official dataset can be found on</span><font face='Avenir Next W01, Avenir Next W00, Avenir Next, Avenir, Helvetica Neue, Helvetica, Arial, sans-serif' size='3'> </font><a href='https://datafinder.stats.govt.nz/data/category/annual-boundaries/2020/' target='_blank' rel='nofollow ugc noopener noreferrer'>https://datafinder.stats.govt.nz</a>.<br /></div><div style='font-size: 17px; font-family: \"Avenir Next W01\", \"Avenir Next W00\", \"Avenir Next\", Avenir, \"Helvetica Neue\", Helvetica, Arial, sans-serif !important;'><div><br /></div><div><div><font size='3'>This layer contains the following attributes (see data tab):</font></div><div><ul><li>Māori Constituency code</li><li>Māori Constituency name</li><li>Total area in square kilometers</li><li>Total land area in square kilometers.</li></ul><div><span style='font-size: medium;'>The layer is further generalised by Eagle Technology for improved performance on the web, </span><span style='font-family: \"Avenir Next W01\", \"Avenir Next W00\", \"Avenir Next\", Avenir, \"Helvetica Neue\", sans-serif; font-size: medium;'>therefore it doesn't fully represent the official boundaries.</span><br /></div></div></div><div><font size='3'><br /></font></div><div><div><font color='#2f4f4f' size='3'>This layer is offered by Eagle Technology (Official Esri Distributor). Eagle Technology offers services that can be used in the ArcGIS platform. The Content team at Eagle Technology updates the layers on a regular basis and regularly adds new content to the Living Atlas. By using this content and combining it with other data you can create new information products quickly and easily.</font></div><div><font color='#2f4f4f' size='3'><br /></font></div><div><font size='3'><font color='#2f4f4f'>If you have any questions or comments about the content, please let us now  at </font><a href='mailto:livingatlas@eagle.co.nz' style='color: rgb(0, 121, 193); text-decoration-line: none;' target='_blank' rel='nofollow ugc noopener noreferrer'>livingatlas@eagle.co.nz</a></font></div></div></div></div></div>",
			"keyword": [
				"eaglegis",
				"mature support",
				"retiring",
				"deprecated"
			],
			"issued": "2020-01-11T10:18:07.000Z",
			"modified": "2021-02-10T03:37:34.576Z",
			"publisher": {
				"name": "Eagle Technology Group Ltd"
			},
			"contactPoint": {
				"@type": "vcard:Contact",
				"fn": "eaglegis",
				"hasEmail": "mailto:ts@eaglegis.co.nz"
			},
			"accessLevel": "public",
			"spatial": "166.2620,-47.2230,-177.6190,-33.7734",
			"license": "https://creativecommons.org/licenses/by/4.0",
			"distribution": [
				{
					"@type": "dcat:Distribution",
					"title": "ArcGIS Hub Dataset",
					"format": "Web Page",
					"mediaType": "text/html",
					"accessURL": "https://www.pacificgeoportal.com/datasets/eaglegis::nz-māori-constituency-boundaries-2020-mature-support"
				},
				{
					"@type": "dcat:Distribution",
					"title": "ArcGIS GeoService",
					"format": "ArcGIS GeoServices REST API",
					"mediaType": "application/json",
					"accessURL": "https://services.arcgis.com/XTtANUDT8Va4DLwI/arcgis/rest/services/Maori_Constituency_2020_Clipped_generalised/FeatureServer/0"
				},
				{
					"@type": "dcat:Distribution",
					"title": "CSV",
					"format": "CSV",
					"mediaType": "text/csv",
					"accessURL": "https://www.pacificgeoportal.com/api/download/v1/items/44afde660b84432a99bd3087f716374a/csv?layers=0"
				},
				{
					"@type": "dcat:Distribution",
					"title": "Shapefile",
					"format": "ZIP",
					"mediaType": "application/zip",
					"accessURL": "https://www.pacificgeoportal.com/api/download/v1/items/44afde660b84432a99bd3087f716374a/shapefile?layers=0"
				},
				{
					"@type": "dcat:Distribution",
					"title": "GeoJSON",
					"format": "GeoJSON",
					"mediaType": "application/vnd.geo+json",
					"accessURL": "https://www.pacificgeoportal.com/api/download/v1/items/44afde660b84432a99bd3087f716374a/geojson?layers=0"
				},
				{
					"@type": "dcat:Distribution",
					"title": "KML",
					"format": "KML",
					"mediaType": "application/vnd.google-earth.kml+xml",
					"accessURL": "https://www.pacificgeoportal.com/api/download/v1/items/44afde660b84432a99bd3087f716374a/kml?layers=0"
				},
				{
					"@type": "dcat:Distribution",
					"title": "File Geodatabase",
					"format": "ZIP",
					"mediaType": "application/zip",
					"accessURL": "https://www.pacificgeoportal.com/api/download/v1/items/44afde660b84432a99bd3087f716374a/filegdb?layers=0"
				},
				{
					"@type": "dcat:Distribution",
					"title": "Feature Collection",
					"format": "TXT",
					"mediaType": "text/plain",
					"accessURL": "https://www.pacificgeoportal.com/api/download/v1/items/44afde660b84432a99bd3087f716374a/featureCollection?layers=0"
				},
				{
					"@type": "dcat:Distribution",
					"title": "Excel",
					"format": "XLSX",
					"mediaType": "application/vnd.ms-excel",
					"accessURL": "https://www.pacificgeoportal.com/api/download/v1/items/44afde660b84432a99bd3087f716374a/excel?layers=0"
				},
				{
					"@type": "dcat:Distribution",
					"title": "GeoPackage",
					"format": "GPKG",
					"mediaType": "application/geopackage+sqlite3",
					"accessURL": "https://www.pacificgeoportal.com/api/download/v1/items/44afde660b84432a99bd3087f716374a/geoPackage?layers=0"
				},
				{
					"@type": "dcat:Distribution",
					"title": "SQLite Geodatabase",
					"format": "GDB",
					"mediaType": "application/geopackage+sqlite3",
					"accessURL": "https://www.pacificgeoportal.com/api/download/v1/items/44afde660b84432a99bd3087f716374a/sqlite?layers=0"
				}
			],
			"theme": [
				"geospatial"
			]
		},
		{
			"@type": "dcat:Dataset",
			"identifier": "https://www.arcgis.com/home/item.html?id=01ebc590436545a9997deb6806a353a8&sublayer=0",
			"landingPage": "https://www.pacificgeoportal.com/datasets/eaglegis::nz-māori-constituency-boundaries-2019-mature-support",
			"title": "NZ Māori Constituency boundaries 2019 (Mature Support)",
			"description": "<font size='3'><b><span style='color:firebrick;'>Important Note:</span></b><b> This item is in<span style='color:#C00000;'> mature support</span> as of January 2024 and will retire in January 2025.</b><b><span> When you need the most recent boundary layer please use <a href='https://www.arcgis.com/home/item.html?id=c79cf92a933a44b8ba27ed833163202f' rel='nofollow ugc'>this item</a>. When you need the boundaries for a specific year, please use <a href='https://www.arcgis.com/home/item.html?id=8d442899956446188be600fbaa8ad6dc' rel='nofollow ugc'>this item</a> and set a filter on the required year.</span></b><br /><br /></font><div><br /><font size='3' style='font-family: \"Avenir Next W01\", \"Avenir Next W00\", \"Avenir Next\", Avenir, \"Helvetica Neue\", Helvetica, Arial, sans-serif !important;'>Topicality: 01-01-2019</font><div><font face='Avenir Next W01, Avenir Next W00, Avenir Next, Avenir, Helvetica Neue, Helvetica, Arial, sans-serif' size='3'>Projection: New Zealand Transverse Mercator (NZTM)<br /></font><div style='font-size: 17px; font-family: \"Avenir Next W01\", \"Avenir Next W00\", \"Avenir Next\", Avenir, \"Helvetica Neue\", Helvetica, Arial, sans-serif !important;'><font size='3'><br /></font></div><div><div style='font-size: 17px; font-family: \"Avenir Next W01\", \"Avenir Next W00\", \"Avenir Next\", Avenir, \"Helvetica Neue\", Helvetica, Arial, sans-serif !important;'><font face='Avenir Next W01, Avenir Next W00, Avenir Next, Avenir, Helvetica Neue, Helvetica, Arial, sans-serif'>This layer is based on the </font>definitive set of regional council Māori constituency boundaries for 2019 as defined by the regional councils and Local Government Commission but maintained by Stats NZ (the custodian).<font face='Avenir Next W01, Avenir Next W00, Avenir Next, Avenir, Helvetica Neue, Helvetica, Arial, sans-serif'> </font></div></div><div style='font-size: 17px; font-family: \"Avenir Next W01\", \"Avenir Next W00\", \"Avenir Next\", Avenir, \"Helvetica Neue\", Helvetica, Arial, sans-serif !important;'><font face='Avenir Next W01, Avenir Next W00, Avenir Next, Avenir, Helvetica Neue, Helvetica, Arial, sans-serif'><br /></font></div><div style='font-size: 17px; font-family: \"Avenir Next W01\", \"Avenir Next W00\", \"Avenir Next\", Avenir, \"Helvetica Neue\", Helvetica, Arial, sans-serif !important;'>Māori constituencies are established under the Local Electoral Act 2001 and\nresult from the division of a region for electoral purposes.<font face='Avenir Next W01, Avenir Next W00, Avenir Next, Avenir, Helvetica Neue, Helvetica, Arial, sans-serif'><br /></font></div><div style='font-size: 17px; font-family: \"Avenir Next W01\", \"Avenir Next W00\", \"Avenir Next\", Avenir, \"Helvetica Neue\", Helvetica, Arial, sans-serif !important;'><br /></div><div style='font-size: 17px; font-family: \"Avenir Next W01\", \"Avenir Next W00\", \"Avenir Next\", Avenir, \"Helvetica Neue\", Helvetica, Arial, sans-serif !important;'>Māori constituencies are divisions of regional council areas. They are created,\nbased on population, to be the voting areas within councils. Māori\nconstituencies are defined at meshblock level, and do not coincide with the\nstatistical area 1 (SA1) geography or the statistical area 2 (SA2) geography. </div><div style='font-size: 17px; font-family: \"Avenir Next W01\", \"Avenir Next W00\", \"Avenir Next\", Avenir, \"Helvetica Neue\", Helvetica, Arial, sans-serif !important;'><br /></div><div style='font-size: 17px; font-family: \"Avenir Next W01\", \"Avenir Next W00\", \"Avenir Next\", Avenir, \"Helvetica Neue\", Helvetica, Arial, sans-serif !important;'>If a regional council decides to have a Māori constituency, the constituencies\nwithin the council are known as general constituencies and Māori\nconstituencies. </div><div style='font-size: 17px; font-family: \"Avenir Next W01\", \"Avenir Next W00\", \"Avenir Next\", Avenir, \"Helvetica Neue\", Helvetica, Arial, sans-serif !important;'><br /></div><div style='font-size: 17px; font-family: \"Avenir Next W01\", \"Avenir Next W00\", \"Avenir Next\", Avenir, \"Helvetica Neue\", Helvetica, Arial, sans-serif !important;'>Classifications exist annually from 2005 to 2019. </div><div style='font-size: 17px; font-family: \"Avenir Next W01\", \"Avenir Next W00\", \"Avenir Next\", Avenir, \"Helvetica Neue\", Helvetica, Arial, sans-serif !important;'><br /></div><div style='font-size: 17px; font-family: \"Avenir Next W01\", \"Avenir Next W00\", \"Avenir Next\", Avenir, \"Helvetica Neue\", Helvetica, Arial, sans-serif !important;'>The boundaries of Māori constituencies may be reviewed before each three yearly\nlocal government election. Regional councils must review their\nrepresentation arrangements at least once every six years. The provisions for\nsuch reviews are contained in the Local Government Act 2002. </div><div style='font-size: 17px; font-family: \"Avenir Next W01\", \"Avenir Next W00\", \"Avenir Next\", Avenir, \"Helvetica Neue\", Helvetica, Arial, sans-serif !important;'><br /></div><div style='font-size: 17px; font-family: \"Avenir Next W01\", \"Avenir Next W00\", \"Avenir Next\", Avenir, \"Helvetica Neue\", Helvetica, Arial, sans-serif !important;'>Māori constituencies are numbered based on their corresponding regional\ncouncil. Each Māori constituency has a unique four-digit code. The first two\ndigits represent the regional council that the Māori constituency lies within. The\nlast two digits are sequential and represent the number of Māori constituencies\nwithin a regional council. For example, the Waikato Regional Council (03)\ncontains two Māori constituencies which are coded 0301 and 0302.<br /></div><div style='font-size: 17px; font-family: \"Avenir Next W01\", \"Avenir Next W00\", \"Avenir Next\", Avenir, \"Helvetica Neue\", Helvetica, Arial, sans-serif !important;'><br /></div><div style='font-size: 17px; font-family: \"Avenir Next W01\", \"Avenir Next W00\", \"Avenir Next\", Avenir, \"Helvetica Neue\", Helvetica, Arial, sans-serif !important;'><span style='font-size: medium;'>The official dataset can be found on</span><font face='Avenir Next W01, Avenir Next W00, Avenir Next, Avenir, Helvetica Neue, Helvetica, Arial, sans-serif' size='3'> </font><a href='https://datafinder.stats.govt.nz/layer/98751-maori-constituency-2019-clipped-generalised/' target='_blank' rel='nofollow ugc noopener noreferrer'>https://datafinder.stats.govt.nz</a>.<br /></div><div style='font-size: 17px; font-family: \"Avenir Next W01\", \"Avenir Next W00\", \"Avenir Next\", Avenir, \"Helvetica Neue\", Helvetica, Arial, sans-serif !important;'><div><br /></div><div><div><font size='3'>This layer contains the following attributes (see data tab):</font></div><div><ul><li>Māori Constituency code</li><li>Māori Constituency name</li><li>Total area in square kilometers</li><li>Total land area in square kilometers.</li></ul><div><span style='font-size: medium;'>The layer is further generalised by Eagle Technology for improved performance on the web, </span><span style='font-family: \"Avenir Next W01\", \"Avenir Next W00\", \"Avenir Next\", Avenir, \"Helvetica Neue\", sans-serif; font-size: medium;'>therefore it doesn't fully represent the official boundaries.</span><br /></div></div></div><div><font size='3'><br /></font></div><div><div><font color='#2f4f4f' size='3'>This layer is offered by Eagle Technology (Official Esri Distributor). Eagle Technology offers services that can be used in the ArcGIS platform. The Content team at Eagle Technology updates the layers on a regular basis and regularly adds new content to the Living Atlas. By using this content and combining it with other data you can create new information products quickly and easily.</font></div><div><font color='#2f4f4f' size='3'><br /></font></div><div><font size='3'><font color='#2f4f4f'>If you have any questions or comments about the content, please let us now  at </font><a href='mailto:livingatlas@eagle.co.nz.' style='color: rgb(0, 121, 193); text-decoration-line: none;' target='_blank' rel='nofollow ugc noopener noreferrer'>livingatlas@eagle.co.nz</a></font></div></div></div></div></div>",
			"keyword": [
				"eaglegis",
				"mature support",
				"retiring",
				"deprecated"
			],
			"issued": "2018-12-21T12:56:01.000Z",
			"modified": "2020-01-13T02:17:21.596Z",
			"publisher": {
				"name": "Eagle Technology Group Ltd"
			},
			"contactPoint": {
				"@type": "vcard:Contact",
				"fn": "eaglegis",
				"hasEmail": "mailto:ts@eaglegis.co.nz"
			},
			"accessLevel": "public",
			"spatial": "166.2620,-47.2230,-177.6196,-33.7735",
			"license": "https://creativecommons.org/licenses/by/4.0",
			"distribution": [
				{
					"@type": "dcat:Distribution",
					"title": "ArcGIS Hub Dataset",
					"format": "Web Page",
					"mediaType": "text/html",
					"accessURL": "https://www.pacificgeoportal.com/datasets/eaglegis::nz-māori-constituency-boundaries-2019-mature-support"
				},
				{
					"@type": "dcat:Distribution",
					"title": "ArcGIS GeoService",
					"format": "ArcGIS GeoServices REST API",
					"mediaType": "application/json",
					"accessURL": "https://services.arcgis.com/XTtANUDT8Va4DLwI/arcgis/rest/services/Maori_Constituency_2019_generalised/FeatureServer/0"
				},
				{
					"@type": "dcat:Distribution",
					"title": "CSV",
					"format": "CSV",
					"mediaType": "text/csv",
					"accessURL": "https://www.pacificgeoportal.com/api/download/v1/items/01ebc590436545a9997deb6806a353a8/csv?layers=0"
				},
				{
					"@type": "dcat:Distribution",
					"title": "Shapefile",
					"format": "ZIP",
					"mediaType": "application/zip",
					"accessURL": "https://www.pacificgeoportal.com/api/download/v1/items/01ebc590436545a9997deb6806a353a8/shapefile?layers=0"
				},
				{
					"@type": "dcat:Distribution",
					"title": "GeoJSON",
					"format": "GeoJSON",
					"mediaType": "application/vnd.geo+json",
					"accessURL": "https://www.pacificgeoportal.com/api/download/v1/items/01ebc590436545a9997deb6806a353a8/geojson?layers=0"
				},
				{
					"@type": "dcat:Distribution",
					"title": "KML",
					"format": "KML",
					"mediaType": "application/vnd.google-earth.kml+xml",
					"accessURL": "https://www.pacificgeoportal.com/api/download/v1/items/01ebc590436545a9997deb6806a353a8/kml?layers=0"
				}
			],
			"theme": [
				"geospatial"
			]
		},
		{
			"@type": "dcat:Dataset",
			"identifier": "https://www.arcgis.com/home/item.html?id=8e6f99ffb1f546538f9d8c1a28e8db8c&sublayer=0",
			"landingPage": "https://www.pacificgeoportal.com/datasets/eaglegis::nz-māori-constituency-boundaries-2018-mature-support",
			"title": "NZ Māori Constituency boundaries 2018 (Mature Support)",
			"description": "<font size='3'><b><span style='color:firebrick;'>Important Note:</span></b><b> This item is in<span style='color:#C00000;'> mature support</span> as of January 2024 and will retire in January 2025.</b><b><span> When you need the most recent boundary layer please use <a href='https://www.arcgis.com/home/item.html?id=c79cf92a933a44b8ba27ed833163202f' rel='nofollow ugc'>this item</a>. When you need the boundaries for a specific year, please use <a href='https://www.arcgis.com/home/item.html?id=8d442899956446188be600fbaa8ad6dc' rel='nofollow ugc'>this item</a> and set a filter on the required year.</span></b><br /><br /></font><div><br /><font size='3' style='font-family: \"Avenir Next W01\", \"Avenir Next W00\", \"Avenir Next\", Avenir, \"Helvetica Neue\", Helvetica, Arial, sans-serif !important;'>Topicality: 01-01-2018</font><div><font face='Avenir Next W01, Avenir Next W00, Avenir Next, Avenir, Helvetica Neue, Helvetica, Arial, sans-serif' size='3'>Projection: New Zealand Transverse Mercator (NZTM)<br /></font><div style='font-size: 17px; font-family: \"Avenir Next W01\", \"Avenir Next W00\", \"Avenir Next\", Avenir, \"Helvetica Neue\", Helvetica, Arial, sans-serif !important;'><font size='3'><br /></font></div><div><div style='font-size: 17px; font-family: \"Avenir Next W01\", \"Avenir Next W00\", \"Avenir Next\", Avenir, \"Helvetica Neue\", Helvetica, Arial, sans-serif !important;'><font face='Avenir Next W01, Avenir Next W00, Avenir Next, Avenir, Helvetica Neue, Helvetica, Arial, sans-serif'>This layer is based on the </font>definitive set of regional council Māori constituency boundaries for 2018 as defined by the regional councils and Local Government Commission but maintained by Stats NZ (the custodian).<font face='Avenir Next W01, Avenir Next W00, Avenir Next, Avenir, Helvetica Neue, Helvetica, Arial, sans-serif'> </font></div></div><div style='font-size: 17px; font-family: \"Avenir Next W01\", \"Avenir Next W00\", \"Avenir Next\", Avenir, \"Helvetica Neue\", Helvetica, Arial, sans-serif !important;'><font face='Avenir Next W01, Avenir Next W00, Avenir Next, Avenir, Helvetica Neue, Helvetica, Arial, sans-serif'><br /></font></div><div style='font-size: 17px; font-family: \"Avenir Next W01\", \"Avenir Next W00\", \"Avenir Next\", Avenir, \"Helvetica Neue\", Helvetica, Arial, sans-serif !important;'>Māori constituencies are established under the Local Electoral Act 2001 and\nresult from the division of a region for electoral purposes.<font face='Avenir Next W01, Avenir Next W00, Avenir Next, Avenir, Helvetica Neue, Helvetica, Arial, sans-serif'><br /></font></div><div style='font-size: 17px; font-family: \"Avenir Next W01\", \"Avenir Next W00\", \"Avenir Next\", Avenir, \"Helvetica Neue\", Helvetica, Arial, sans-serif !important;'><br /></div><div style='font-size: 17px; font-family: \"Avenir Next W01\", \"Avenir Next W00\", \"Avenir Next\", Avenir, \"Helvetica Neue\", Helvetica, Arial, sans-serif !important;'>Māori constituencies are divisions of regional council areas. They are created,\nbased on population, to be the voting areas within councils. Māori\nconstituencies are defined at meshblock level, and do not coincide with the\nstatistical area 1 (SA1) geography or the statistical area 2 (SA2) geography. </div><div style='font-size: 17px; font-family: \"Avenir Next W01\", \"Avenir Next W00\", \"Avenir Next\", Avenir, \"Helvetica Neue\", Helvetica, Arial, sans-serif !important;'><br /></div><div style='font-size: 17px; font-family: \"Avenir Next W01\", \"Avenir Next W00\", \"Avenir Next\", Avenir, \"Helvetica Neue\", Helvetica, Arial, sans-serif !important;'>If a regional council decides to have a Māori constituency, the constituencies\nwithin the council are known as general constituencies and Māori\nconstituencies. </div><div style='font-size: 17px; font-family: \"Avenir Next W01\", \"Avenir Next W00\", \"Avenir Next\", Avenir, \"Helvetica Neue\", Helvetica, Arial, sans-serif !important;'><br /></div><div style='font-size: 17px; font-family: \"Avenir Next W01\", \"Avenir Next W00\", \"Avenir Next\", Avenir, \"Helvetica Neue\", Helvetica, Arial, sans-serif !important;'>Classifications exist annually from 2005 to 2018. </div><div style='font-size: 17px; font-family: \"Avenir Next W01\", \"Avenir Next W00\", \"Avenir Next\", Avenir, \"Helvetica Neue\", Helvetica, Arial, sans-serif !important;'><br /></div><div style='font-size: 17px; font-family: \"Avenir Next W01\", \"Avenir Next W00\", \"Avenir Next\", Avenir, \"Helvetica Neue\", Helvetica, Arial, sans-serif !important;'>The boundaries of Māori constituencies may be reviewed before each three yearly\nlocal government election. Regional councils must review their\nrepresentation arrangements at least once every six years. The provisions for\nsuch reviews are contained in the Local Government Act 2002. </div><div style='font-size: 17px; font-family: \"Avenir Next W01\", \"Avenir Next W00\", \"Avenir Next\", Avenir, \"Helvetica Neue\", Helvetica, Arial, sans-serif !important;'><br /></div><div style='font-size: 17px; font-family: \"Avenir Next W01\", \"Avenir Next W00\", \"Avenir Next\", Avenir, \"Helvetica Neue\", Helvetica, Arial, sans-serif !important;'>Māori constituencies are numbered based on their corresponding regional\ncouncil. Each Māori constituency has a unique four-digit code. The first two\ndigits represent the regional council that the Māori constituency lies within. The\nlast two digits are sequential and represent the number of Māori constituencies\nwithin a regional council. For example, the Waikato Regional Council (03)\ncontains two Māori constituencies which are coded 0301 and 0302.<br /></div><div style='font-size: 17px; font-family: \"Avenir Next W01\", \"Avenir Next W00\", \"Avenir Next\", Avenir, \"Helvetica Neue\", Helvetica, Arial, sans-serif !important;'><br /></div><div style='font-size: 17px; font-family: \"Avenir Next W01\", \"Avenir Next W00\", \"Avenir Next\", Avenir, \"Helvetica Neue\", Helvetica, Arial, sans-serif !important;'><span style='font-size: medium;'>The official dataset can be found on</span><font face='Avenir Next W01, Avenir Next W00, Avenir Next, Avenir, Helvetica Neue, Helvetica, Arial, sans-serif' size='3'> </font><a href='https://datafinder.stats.govt.nz/document/21421-anzlic-metadata-2018-maori-constituency/' target='_blank' rel='nofollow ugc noopener noreferrer'>https://datafinder.stats.govt.nz</a>.<br /></div><div style='font-size: 17px; font-family: \"Avenir Next W01\", \"Avenir Next W00\", \"Avenir Next\", Avenir, \"Helvetica Neue\", Helvetica, Arial, sans-serif !important;'><div><br /></div><div><div><font size='3'>This layer contains the following attributes (see data tab):</font></div><div><ul><li>Māori Constituency code</li><li>Māori Constituency name</li><li>Total area in square kilometers</li><li>Total land area in square kilometers.</li></ul><div><span style='font-size: medium;'>The layer is further generalised by Eagle Technology for improved performance on the web, </span><span style='font-family: \"Avenir Next W01\", \"Avenir Next W00\", \"Avenir Next\", Avenir, \"Helvetica Neue\", sans-serif; font-size: medium;'>therefore it doesn't fully represent the official boundaries.</span><br /></div></div></div><div><font size='3'><br /></font></div><div><div><font color='#2f4f4f' size='3'>This layer is offered by Eagle Technology (Official Esri Distributor). Eagle Technology offers services that can be used in the ArcGIS platform. The Content team at Eagle Technology updates the layers on a regular basis and regularly adds new content to the Living Atlas. By using this content and combining it with other data you can create new information products quickly and easily.</font></div><div><font color='#2f4f4f' size='3'><br /></font></div><div><font size='3'><font color='#2f4f4f'>If you have any questions or comments about the content, please let us now  at </font><a href='mailto:livingatlas@eagle.co.nz.' style='color: rgb(0, 121, 193); text-decoration-line: none;' target='_blank' rel='nofollow ugc noopener noreferrer'>livingatlas@eagle.co.nz</a></font></div></div></div></div></div>",
			"keyword": [
				"eaglegis",
				"mature support",
				"retiring",
				"deprecated"
			],
			"issued": "2018-09-14T01:57:41.000Z",
			"modified": "2018-09-14T03:14:56.677Z",
			"publisher": {
				"name": "Eagle Technology Group Ltd"
			},
			"contactPoint": {
				"@type": "vcard:Contact",
				"fn": "eaglegis",
				"hasEmail": "mailto:ts@eaglegis.co.nz"
			},
			"accessLevel": "public",
			"spatial": "166.2620,-47.2230,-177.6196,-33.7735",
			"license": "https://creativecommons.org/licenses/by/4.0",
			"distribution": [
				{
					"@type": "dcat:Distribution",
					"title": "ArcGIS Hub Dataset",
					"format": "Web Page",
					"mediaType": "text/html",
					"accessURL": "https://www.pacificgeoportal.com/datasets/eaglegis::nz-māori-constituency-boundaries-2018-mature-support"
				},
				{
					"@type": "dcat:Distribution",
					"title": "ArcGIS GeoService",
					"format": "ArcGIS GeoServices REST API",
					"mediaType": "application/json",
					"accessURL": "https://services.arcgis.com/XTtANUDT8Va4DLwI/arcgis/rest/services/NZ_Maori_Constituency_boundaries_2018_generalised/FeatureServer/0"
				},
				{
					"@type": "dcat:Distribution",
					"title": "CSV",
					"format": "CSV",
					"mediaType": "text/csv",
					"accessURL": "https://www.pacificgeoportal.com/api/download/v1/items/8e6f99ffb1f546538f9d8c1a28e8db8c/csv?layers=0"
				},
				{
					"@type": "dcat:Distribution",
					"title": "Shapefile",
					"format": "ZIP",
					"mediaType": "application/zip",
					"accessURL": "https://www.pacificgeoportal.com/api/download/v1/items/8e6f99ffb1f546538f9d8c1a28e8db8c/shapefile?layers=0"
				},
				{
					"@type": "dcat:Distribution",
					"title": "GeoJSON",
					"format": "GeoJSON",
					"mediaType": "application/vnd.geo+json",
					"accessURL": "https://www.pacificgeoportal.com/api/download/v1/items/8e6f99ffb1f546538f9d8c1a28e8db8c/geojson?layers=0"
				},
				{
					"@type": "dcat:Distribution",
					"title": "KML",
					"format": "KML",
					"mediaType": "application/vnd.google-earth.kml+xml",
					"accessURL": "https://www.pacificgeoportal.com/api/download/v1/items/8e6f99ffb1f546538f9d8c1a28e8db8c/kml?layers=0"
				}
			],
			"theme": [
				"geospatial"
			]
		},
		{
			"@type": "dcat:Dataset",
			"identifier": "https://www.arcgis.com/home/item.html?id=d751fda4037a47e7b151a2ae8b8c901a&sublayer=0",
			"landingPage": "https://www.pacificgeoportal.com/datasets/eaglegis::nz-constituencies-2021-mature-support",
			"title": "NZ Constituencies - 2021 (Mature Support)",
			"description": "<font size='3'><b><span style='color:firebrick;'>Important Note:</span></b><b> This item is in<span style='color:#C00000;'> mature support</span> as of January 2024 and will retire in January 2025.</b><b><span> When you need the most recent boundary layer please use <a href='https://www.arcgis.com/home/item.html?id=6712602ebaa54b60a421fe7ac73eb7aa' rel='nofollow ugc'>this item</a>. When you need the boundaries for a specific year, please use <a href='https://www.arcgis.com/home/item.html?id=5f373fde10f8442f81c4a3ef8a47961e' rel='nofollow ugc'>this item</a> and set a filter on the required year.</span></b><br /><br /></font><div><br /><font size='3' style='font-family: \"Avenir Next W01\", \"Avenir Next W00\", \"Avenir Next\", Avenir, \"Helvetica Neue\", Helvetica, Arial, sans-serif !important;'>Topicality: 01-01-2021</font><div><font size='3'><span style='font-family: \"Avenir Next W01\", \"Avenir Next W00\", \"Avenir Next\", Avenir, \"Helvetica Neue\", Helvetica, Arial, sans-serif;'>Projection: New Zealand Transverse Mercator (NZTM)</span><font face='Avenir Next W01, Avenir Next W00, Avenir Next, Avenir, Helvetica Neue, Helvetica, Arial, sans-serif'><br /></font></font><div style='font-family: \"Avenir Next W01\", \"Avenir Next W00\", \"Avenir Next\", Avenir, \"Helvetica Neue\", Helvetica, Arial, sans-serif !important;'><font size='3'><br /></font></div><div style=''><div style='font-family: \"Avenir Next W01\", \"Avenir Next W00\", \"Avenir Next\", Avenir, \"Helvetica Neue\", Helvetica, Arial, sans-serif !important;'><font size='3'><font face='Avenir Next W01, Avenir Next W00, Avenir Next, Avenir, Helvetica Neue, Helvetica, Arial, sans-serif'>This layer is based on the </font>definitive set of regional council constituency boundaries for\n2021 as defined by the regional councils and Local Government Commission\nbut maintained by Stats NZ (the custodian).<font face='Avenir Next W01, Avenir Next W00, Avenir Next, Avenir, Helvetica Neue, Helvetica, Arial, sans-serif'> </font></font></div><div style=''><font face='Avenir Next W01, Avenir Next W00, Avenir Next, Avenir, Helvetica Neue, Helvetica, Arial, sans-serif' size='3'><div style=''><br /></div><div style=''><div>Constituencies are established under the Local Electoral Act 2001 and result from the division of a region for electoral purposes. If a regional council decides to have a Māori constituency, the constituencies within the council are known as general constituencies and Māori constituencies.  </div><div> </div><div>Constituencies are divisions of regional council areas. They are defined at meshblock level, and do not coincide with the statistical area 1 (SA1) geography or the statistical area 2 (SA2) geography. They are created, based on population, to be the voting areas within councils. Constituencies are required to reflect communities of interest. Their boundaries, so far as is practicable, coincide with those of territorial authorities or wards. The boundaries of constituencies may be reviewed before each three-yearly local government election. Regional councils must review their representation arrangements at least once every six years. The provisions for such reviews are in the Local Government Act 2002. </div><div> </div><div>Constituencies are numbered based on their corresponding regional council. Each constituency has a unique four-digit code. The first two digits represent the regional council that the constituency lies within. The last two digits are sequential and represent the number of constituencies within a regional council. For example, the West Coast Regional Council (12) contains three constituencies, which are coded 1201, 1202, and 1203.</div></div></font></div><div style='font-family: \"Avenir Next W01\", \"Avenir Next W00\", \"Avenir Next\", Avenir, \"Helvetica Neue\", Helvetica, Arial, sans-serif !important;'><font face='Avenir Next W01, Avenir Next W00, Avenir Next, Avenir, Helvetica Neue, Helvetica, Arial, sans-serif' size='3'><br /></font></div><div style='font-family: \"Avenir Next W01\", \"Avenir Next W00\", \"Avenir Next\", Avenir, \"Helvetica Neue\", Helvetica, Arial, sans-serif !important;'><font size='3'>This layer shows the data for 2021. If you would like to use the layer that gets updated yearly with the latest boundary data, you can use <a href='https://www.arcgis.com/home/item.html?id=6712602ebaa54b60a421fe7ac73eb7aa' target='_blank' rel='nofollow ugc noopener noreferrer'>this item</a>.<br /><br />All the boundary layers can be found <a href='https://www.arcgis.com/home/group.html?id=8047736c3e43467aa62241976851eff9' target='_blank' rel='nofollow ugc noopener noreferrer'>here</a>.<br /><br />All the boundary layers that are updated yearly can be found <a href='https://www.arcgis.com/home/group.html?id=b22e4f0012a8426dac21cd3d02f25c67' target='_blank' rel='nofollow ugc noopener noreferrer'>here</a>.<br /><br />The official dataset can be found on<font face='Avenir Next W01, Avenir Next W00, Avenir Next, Avenir, Helvetica Neue, Helvetica, Arial, sans-serif'> </font></font><a href='https://datafinder.stats.govt.nz/data/category/annual-boundaries/2021/' target='_blank' rel='nofollow ugc noopener noreferrer'>https://datafinder.stats.govt.nz</a><font size='3'>.</font></div><div style='font-family: \"Avenir Next W01\", \"Avenir Next W00\", \"Avenir Next\", Avenir, \"Helvetica Neue\", Helvetica, Arial, sans-serif !important;'><br /></div><div style='font-family: \"Avenir Next W01\", \"Avenir Next W00\", \"Avenir Next\", Avenir, \"Helvetica Neue\", Helvetica, Arial, sans-serif !important;'><div><font size='3'>This layer contains the following attributes (see data tab):</font></div><div><ul><li><font size='3'>Constituency code</font></li><li><font size='3'>Constituency name</font></li><li><font size='3'>Total area in square kilometers</font></li><li><font size='3'>Total land area in square kilometers.</font></li></ul><div><font size='3'>The layer is further generalised by Eagle Technology for improved performance on the web, <span style='font-family: \"Avenir Next W01\", \"Avenir Next W00\", \"Avenir Next\", Avenir, \"Helvetica Neue\", sans-serif;'>therefore it doesn't fully represent the official boundaries.</span><br /></font></div></div></div><div style='font-family: \"Avenir Next W01\", \"Avenir Next W00\", \"Avenir Next\", Avenir, \"Helvetica Neue\", Helvetica, Arial, sans-serif !important;'><font size='3'><br /></font></div><div style='font-family: \"Avenir Next W01\", \"Avenir Next W00\", \"Avenir Next\", Avenir, \"Helvetica Neue\", Helvetica, Arial, sans-serif !important;'><div style=''><font color='#2f4f4f' size='3'>This layer is offered by Eagle Technology (Official Esri Distributor). Eagle Technology offers services that can be used in the ArcGIS platform. The Content team at Eagle Technology updates the layers on a regular basis and regularly adds new content to the Living Atlas. By using this content and combining it with other data you can create new information products quickly and easily.</font></div><div style=''><font color='#2f4f4f' size='3'><br /></font></div><div style=''><font size='3'><font color='#2f4f4f' style=''>If you have any questions or comments about the content, please let us now  at </font><a href='mailto:livingatlas@eagle.co.nz' style='color: rgb(0, 121, 193); text-decoration-line: none;' target='_blank' rel='nofollow ugc noopener noreferrer'>livingatlas@eagle.co.nz</a></font></div></div></div></div></div>",
			"keyword": [
				"eaglegis",
				"mature support",
				"retiring",
				"deprecated"
			],
			"issued": "2021-02-04T02:17:10.000Z",
			"modified": "2021-02-15T23:02:24.874Z",
			"publisher": {
				"name": "Eagle Technology Group Ltd"
			},
			"contactPoint": {
				"@type": "vcard:Contact",
				"fn": "eaglegis",
				"hasEmail": "mailto:ts@eaglegis.co.nz"
			},
			"accessLevel": "public",
			"spatial": "166.2620,-47.2230,-177.6189,-33.7734",
			"license": "https://creativecommons.org/licenses/by/4.0",
			"distribution": [
				{
					"@type": "dcat:Distribution",
					"title": "ArcGIS Hub Dataset",
					"format": "Web Page",
					"mediaType": "text/html",
					"accessURL": "https://www.pacificgeoportal.com/datasets/eaglegis::nz-constituencies-2021-mature-support"
				},
				{
					"@type": "dcat:Distribution",
					"title": "ArcGIS GeoService",
					"format": "ArcGIS GeoServices REST API",
					"mediaType": "application/json",
					"accessURL": "https://services.arcgis.com/XTtANUDT8Va4DLwI/arcgis/rest/services/nz_constituencies_2021/FeatureServer/0"
				},
				{
					"@type": "dcat:Distribution",
					"title": "CSV",
					"format": "CSV",
					"mediaType": "text/csv",
					"accessURL": "https://www.pacificgeoportal.com/api/download/v1/items/d751fda4037a47e7b151a2ae8b8c901a/csv?layers=0"
				},
				{
					"@type": "dcat:Distribution",
					"title": "Shapefile",
					"format": "ZIP",
					"mediaType": "application/zip",
					"accessURL": "https://www.pacificgeoportal.com/api/download/v1/items/d751fda4037a47e7b151a2ae8b8c901a/shapefile?layers=0"
				},
				{
					"@type": "dcat:Distribution",
					"title": "GeoJSON",
					"format": "GeoJSON",
					"mediaType": "application/vnd.geo+json",
					"accessURL": "https://www.pacificgeoportal.com/api/download/v1/items/d751fda4037a47e7b151a2ae8b8c901a/geojson?layers=0"
				},
				{
					"@type": "dcat:Distribution",
					"title": "KML",
					"format": "KML",
					"mediaType": "application/vnd.google-earth.kml+xml",
					"accessURL": "https://www.pacificgeoportal.com/api/download/v1/items/d751fda4037a47e7b151a2ae8b8c901a/kml?layers=0"
				},
				{
					"@type": "dcat:Distribution",
					"title": "File Geodatabase",
					"format": "ZIP",
					"mediaType": "application/zip",
					"accessURL": "https://www.pacificgeoportal.com/api/download/v1/items/d751fda4037a47e7b151a2ae8b8c901a/filegdb?layers=0"
				},
				{
					"@type": "dcat:Distribution",
					"title": "Feature Collection",
					"format": "TXT",
					"mediaType": "text/plain",
					"accessURL": "https://www.pacificgeoportal.com/api/download/v1/items/d751fda4037a47e7b151a2ae8b8c901a/featureCollection?layers=0"
				},
				{
					"@type": "dcat:Distribution",
					"title": "Excel",
					"format": "XLSX",
					"mediaType": "application/vnd.ms-excel",
					"accessURL": "https://www.pacificgeoportal.com/api/download/v1/items/d751fda4037a47e7b151a2ae8b8c901a/excel?layers=0"
				},
				{
					"@type": "dcat:Distribution",
					"title": "GeoPackage",
					"format": "GPKG",
					"mediaType": "application/geopackage+sqlite3",
					"accessURL": "https://www.pacificgeoportal.com/api/download/v1/items/d751fda4037a47e7b151a2ae8b8c901a/geoPackage?layers=0"
				},
				{
					"@type": "dcat:Distribution",
					"title": "SQLite Geodatabase",
					"format": "GDB",
					"mediaType": "application/geopackage+sqlite3",
					"accessURL": "https://www.pacificgeoportal.com/api/download/v1/items/d751fda4037a47e7b151a2ae8b8c901a/sqlite?layers=0"
				}
			],
			"theme": [
				"geospatial"
			]
		},
		{
			"@type": "dcat:Dataset",
			"identifier": "https://www.arcgis.com/home/item.html?id=c1898172f86b4a3c980fe0c6b9a5d75a&sublayer=0",
			"landingPage": "https://www.pacificgeoportal.com/datasets/eaglegis::nz-constituency-boundaries-2020-mature-support",
			"title": "NZ Constituency boundaries 2020 (Mature Support)",
			"description": "<font size='3'><b><span style='color:firebrick;'>Important Note:</span></b><b> This item is in<span style='color:#C00000;'> mature support</span> as of January 2024 and will retire in January 2025.</b><b><span> When you need the most recent boundary layer please use <a href='https://www.arcgis.com/home/item.html?id=6712602ebaa54b60a421fe7ac73eb7aa' rel='nofollow ugc'>this item</a>. When you need the boundaries for a specific year, please use <a href='https://www.arcgis.com/home/item.html?id=5f373fde10f8442f81c4a3ef8a47961e' rel='nofollow ugc'>this item</a> and set a filter on the required year.</span></b><br /><br /></font><div><br /><font size='3' style='font-family: \"Avenir Next W01\", \"Avenir Next W00\", \"Avenir Next\", Avenir, \"Helvetica Neue\", Helvetica, Arial, sans-serif !important;'>Topicality: 01-01-2020</font><div><font size='3'><span style='font-family: \"Avenir Next W01\", \"Avenir Next W00\", \"Avenir Next\", Avenir, \"Helvetica Neue\", Helvetica, Arial, sans-serif;'>Projection: New Zealand Transverse Mercator (NZTM)</span><font face='Avenir Next W01, Avenir Next W00, Avenir Next, Avenir, Helvetica Neue, Helvetica, Arial, sans-serif'><br /></font></font><div style='font-family: \"Avenir Next W01\", \"Avenir Next W00\", \"Avenir Next\", Avenir, \"Helvetica Neue\", Helvetica, Arial, sans-serif !important;'><font size='3'><br /></font></div><div style=''><div style='font-family: \"Avenir Next W01\", \"Avenir Next W00\", \"Avenir Next\", Avenir, \"Helvetica Neue\", Helvetica, Arial, sans-serif !important;'><font size='3'><font face='Avenir Next W01, Avenir Next W00, Avenir Next, Avenir, Helvetica Neue, Helvetica, Arial, sans-serif'>This layer is based on the </font>definitive set of regional council constituency boundaries for\n2020 as defined by the regional councils and Local Government Commission\nbut maintained by Stats NZ (the custodian).<font face='Avenir Next W01, Avenir Next W00, Avenir Next, Avenir, Helvetica Neue, Helvetica, Arial, sans-serif'> </font></font></div><div style=''><font face='Avenir Next W01, Avenir Next W00, Avenir Next, Avenir, Helvetica Neue, Helvetica, Arial, sans-serif' size='3'><div style=''><br /></div><div style=''><div>Constituencies are established under the Local Electoral Act 2001 and result from the division of a region for electoral purposes. If a regional council decides to have a Māori constituency, the constituencies within the council are known as general constituencies and Māori constituencies.  </div><div> </div><div>Constituencies are divisions of regional council areas. They are defined at meshblock level, and do not coincide with the statistical area 1 (SA1) geography or the statistical area 2 (SA2) geography. They are created, based on population, to be the voting areas within councils. Constituencies are required to reflect communities of interest. Their boundaries, so far as is practicable, coincide with those of territorial authorities or wards. The boundaries of constituencies may be reviewed before each three-yearly local government election. Regional councils must review their representation arrangements at least once every six years. The provisions for such reviews are in the Local Government Act 2002. </div><div> </div><div>Constituencies are numbered based on their corresponding regional council. Each constituency has a unique four-digit code. The first two digits represent the regional council that the constituency lies within. The last two digits are sequential and represent the number of constituencies within a regional council. For example, the West Coast Regional Council (12) contains three constituencies, which are coded 1201, 1202, and 1203.</div></div></font></div><div style='font-family: \"Avenir Next W01\", \"Avenir Next W00\", \"Avenir Next\", Avenir, \"Helvetica Neue\", Helvetica, Arial, sans-serif !important;'><font face='Avenir Next W01, Avenir Next W00, Avenir Next, Avenir, Helvetica Neue, Helvetica, Arial, sans-serif' size='3'><br /></font></div><div style='font-family: \"Avenir Next W01\", \"Avenir Next W00\", \"Avenir Next\", Avenir, \"Helvetica Neue\", Helvetica, Arial, sans-serif !important;'><font size='3'>The official dataset can be found on<font face='Avenir Next W01, Avenir Next W00, Avenir Next, Avenir, Helvetica Neue, Helvetica, Arial, sans-serif'> </font></font><a href='https://datafinder.stats.govt.nz/data/category/annual-boundaries/2020/' target='_blank' rel='nofollow ugc noopener noreferrer'>https://datafinder.stats.govt.nz</a><font size='3'>.</font></div><div style='font-family: \"Avenir Next W01\", \"Avenir Next W00\", \"Avenir Next\", Avenir, \"Helvetica Neue\", Helvetica, Arial, sans-serif !important;'><br /></div><div style='font-family: \"Avenir Next W01\", \"Avenir Next W00\", \"Avenir Next\", Avenir, \"Helvetica Neue\", Helvetica, Arial, sans-serif !important;'><div><font size='3'>This layer contains the following attributes (see data tab):</font></div><div><ul><li><font size='3'>Constituency code</font></li><li><font size='3'>Constituency name</font></li><li><font size='3'>Total area in square kilometers</font></li><li><font size='3'>Total land area in square kilometers.</font></li></ul><div><font size='3'>The layer is further generalised by Eagle Technology for improved performance on the web, <span style='font-family: \"Avenir Next W01\", \"Avenir Next W00\", \"Avenir Next\", Avenir, \"Helvetica Neue\", sans-serif;'>therefore it doesn't fully represent the official boundaries.</span><br /></font></div></div></div><div style='font-family: \"Avenir Next W01\", \"Avenir Next W00\", \"Avenir Next\", Avenir, \"Helvetica Neue\", Helvetica, Arial, sans-serif !important;'><font size='3'><br /></font></div><div style='font-family: \"Avenir Next W01\", \"Avenir Next W00\", \"Avenir Next\", Avenir, \"Helvetica Neue\", Helvetica, Arial, sans-serif !important;'><div style=''><font color='#2f4f4f' size='3'>This layer is offered by Eagle Technology (Official Esri Distributor). Eagle Technology offers services that can be used in the ArcGIS platform. The Content team at Eagle Technology updates the layers on a regular basis and regularly adds new content to the Living Atlas. By using this content and combining it with other data you can create new information products quickly and easily.</font></div><div style=''><font color='#2f4f4f' size='3'><br /></font></div><div style=''><font size='3'><font color='#2f4f4f' style=''>If you have any questions or comments about the content, please let us now  at </font><a href='mailto:livingatlas@eagle.co.nz' style='color: rgb(0, 121, 193); text-decoration-line: none;' target='_blank' rel='nofollow ugc noopener noreferrer'>livingatlas@eagle.co.nz</a></font></div></div></div></div></div>",
			"keyword": [
				"eaglegis",
				"mature support",
				"retiring",
				"deprecated"
			],
			"issued": "2020-01-11T10:17:33.000Z",
			"modified": "2021-02-10T03:37:14.227Z",
			"publisher": {
				"name": "Eagle Technology Group Ltd"
			},
			"contactPoint": {
				"@type": "vcard:Contact",
				"fn": "eaglegis",
				"hasEmail": "mailto:ts@eaglegis.co.nz"
			},
			"accessLevel": "public",
			"spatial": "166.2620,-47.2230,-177.6190,-33.7734",
			"license": "https://creativecommons.org/licenses/by/4.0",
			"distribution": [
				{
					"@type": "dcat:Distribution",
					"title": "ArcGIS Hub Dataset",
					"format": "Web Page",
					"mediaType": "text/html",
					"accessURL": "https://www.pacificgeoportal.com/datasets/eaglegis::nz-constituency-boundaries-2020-mature-support"
				},
				{
					"@type": "dcat:Distribution",
					"title": "ArcGIS GeoService",
					"format": "ArcGIS GeoServices REST API",
					"mediaType": "application/json",
					"accessURL": "https://services.arcgis.com/XTtANUDT8Va4DLwI/arcgis/rest/services/Constituency_2020_Clipped_generalised/FeatureServer/0"
				},
				{
					"@type": "dcat:Distribution",
					"title": "CSV",
					"format": "CSV",
					"mediaType": "text/csv",
					"accessURL": "https://www.pacificgeoportal.com/api/download/v1/items/c1898172f86b4a3c980fe0c6b9a5d75a/csv?layers=0"
				},
				{
					"@type": "dcat:Distribution",
					"title": "Shapefile",
					"format": "ZIP",
					"mediaType": "application/zip",
					"accessURL": "https://www.pacificgeoportal.com/api/download/v1/items/c1898172f86b4a3c980fe0c6b9a5d75a/shapefile?layers=0"
				},
				{
					"@type": "dcat:Distribution",
					"title": "GeoJSON",
					"format": "GeoJSON",
					"mediaType": "application/vnd.geo+json",
					"accessURL": "https://www.pacificgeoportal.com/api/download/v1/items/c1898172f86b4a3c980fe0c6b9a5d75a/geojson?layers=0"
				},
				{
					"@type": "dcat:Distribution",
					"title": "KML",
					"format": "KML",
					"mediaType": "application/vnd.google-earth.kml+xml",
					"accessURL": "https://www.pacificgeoportal.com/api/download/v1/items/c1898172f86b4a3c980fe0c6b9a5d75a/kml?layers=0"
				},
				{
					"@type": "dcat:Distribution",
					"title": "File Geodatabase",
					"format": "ZIP",
					"mediaType": "application/zip",
					"accessURL": "https://www.pacificgeoportal.com/api/download/v1/items/c1898172f86b4a3c980fe0c6b9a5d75a/filegdb?layers=0"
				},
				{
					"@type": "dcat:Distribution",
					"title": "Feature Collection",
					"format": "TXT",
					"mediaType": "text/plain",
					"accessURL": "https://www.pacificgeoportal.com/api/download/v1/items/c1898172f86b4a3c980fe0c6b9a5d75a/featureCollection?layers=0"
				},
				{
					"@type": "dcat:Distribution",
					"title": "Excel",
					"format": "XLSX",
					"mediaType": "application/vnd.ms-excel",
					"accessURL": "https://www.pacificgeoportal.com/api/download/v1/items/c1898172f86b4a3c980fe0c6b9a5d75a/excel?layers=0"
				},
				{
					"@type": "dcat:Distribution",
					"title": "GeoPackage",
					"format": "GPKG",
					"mediaType": "application/geopackage+sqlite3",
					"accessURL": "https://www.pacificgeoportal.com/api/download/v1/items/c1898172f86b4a3c980fe0c6b9a5d75a/geoPackage?layers=0"
				},
				{
					"@type": "dcat:Distribution",
					"title": "SQLite Geodatabase",
					"format": "GDB",
					"mediaType": "application/geopackage+sqlite3",
					"accessURL": "https://www.pacificgeoportal.com/api/download/v1/items/c1898172f86b4a3c980fe0c6b9a5d75a/sqlite?layers=0"
				}
			],
			"theme": [
				"geospatial"
			]
		},
		{
			"@type": "dcat:Dataset",
			"identifier": "https://www.arcgis.com/home/item.html?id=2bdc59381da7488bac7434d5f646ef04&sublayer=0",
			"landingPage": "https://www.pacificgeoportal.com/datasets/eaglegis::nz-constituency-boundaries-2019-mature-support",
			"title": "NZ Constituency boundaries 2019 (Mature Support)",
			"description": "<font size='3'><b><span style='color:firebrick;'>Important Note:</span></b><b> This item is in<span style='color:#C00000;'> mature support</span> as of January 2024 and will retire in January 2025.</b><b><span> When you need the most recent boundary layer please use <a href='https://www.arcgis.com/home/item.html?id=6712602ebaa54b60a421fe7ac73eb7aa' rel='nofollow ugc'>this item</a>. When you need the boundaries for a specific year, please use <a href='https://www.arcgis.com/home/item.html?id=5f373fde10f8442f81c4a3ef8a47961e' rel='nofollow ugc'>this item</a> and set a filter on the required year.</span></b><br /><br /></font><div><br /><font size='3' style='font-family: \"Avenir Next W01\", \"Avenir Next W00\", \"Avenir Next\", Avenir, \"Helvetica Neue\", Helvetica, Arial, sans-serif !important;'>Topicality: 01-01-2019</font><div><font size='3'><span style='font-family: \"Avenir Next W01\", \"Avenir Next W00\", \"Avenir Next\", Avenir, \"Helvetica Neue\", Helvetica, Arial, sans-serif;'>Projection: New Zealand Transverse Mercator (NZTM)</span><font face='Avenir Next W01, Avenir Next W00, Avenir Next, Avenir, Helvetica Neue, Helvetica, Arial, sans-serif'><br /></font></font><div style='font-family: \"Avenir Next W01\", \"Avenir Next W00\", \"Avenir Next\", Avenir, \"Helvetica Neue\", Helvetica, Arial, sans-serif !important;'><font size='3'><br /></font></div><div style=''><div style='font-family: \"Avenir Next W01\", \"Avenir Next W00\", \"Avenir Next\", Avenir, \"Helvetica Neue\", Helvetica, Arial, sans-serif !important;'><font size='3'><font face='Avenir Next W01, Avenir Next W00, Avenir Next, Avenir, Helvetica Neue, Helvetica, Arial, sans-serif'>This layer is based on the </font>definitive set of regional council constituency boundaries for\n2019 as defined by the regional councils and Local Government Commission\nbut maintained by Stats NZ (the custodian).<font face='Avenir Next W01, Avenir Next W00, Avenir Next, Avenir, Helvetica Neue, Helvetica, Arial, sans-serif'> </font></font></div><div style=''><font face='Avenir Next W01, Avenir Next W00, Avenir Next, Avenir, Helvetica Neue, Helvetica, Arial, sans-serif' size='3'><div style=''><br /></div><div style=''><div>Constituencies are established under the Local Electoral Act 2001 and result from the division of a region for electoral purposes. If a regional council decides to have a Māori constituency, the constituencies within the council are known as general constituencies and Māori constituencies.  </div><div> </div><div>Constituencies are divisions of regional council areas. They are defined at meshblock level, and do not coincide with the statistical area 1 (SA1) geography or the statistical area 2 (SA2) geography. They are created, based on population, to be the voting areas within councils. Constituencies are required to reflect communities of interest. Their boundaries, so far as is practicable, coincide with those of territorial authorities or wards. The boundaries of constituencies may be reviewed before each three-yearly local government election. Regional councils must review their representation arrangements at least once every six years. The provisions for such reviews are in the Local Government Act 2002. </div><div> </div><div>Constituencies are numbered based on their corresponding regional council. Each constituency has a unique four-digit code. The first two digits represent the regional council that the constituency lies within. The last two digits are sequential and represent the number of constituencies within a regional council. For example, the West Coast Regional Council (12) contains three constituencies, which are coded 1201, 1202, and 1203.</div></div></font></div><div style='font-family: \"Avenir Next W01\", \"Avenir Next W00\", \"Avenir Next\", Avenir, \"Helvetica Neue\", Helvetica, Arial, sans-serif !important;'><font face='Avenir Next W01, Avenir Next W00, Avenir Next, Avenir, Helvetica Neue, Helvetica, Arial, sans-serif' size='3'><br /></font></div><div style='font-family: \"Avenir Next W01\", \"Avenir Next W00\", \"Avenir Next\", Avenir, \"Helvetica Neue\", Helvetica, Arial, sans-serif !important;'><font size='3'>The official dataset can be found on<font face='Avenir Next W01, Avenir Next W00, Avenir Next, Avenir, Helvetica Neue, Helvetica, Arial, sans-serif'> </font></font><a href='https://datafinder.stats.govt.nz/layer/98747-constituency-2019-clipped-generalised/' target='_blank' rel='nofollow ugc noopener noreferrer'>https://datafinder.stats.govt.nz</a><font size='3'>.</font></div><div style='font-family: \"Avenir Next W01\", \"Avenir Next W00\", \"Avenir Next\", Avenir, \"Helvetica Neue\", Helvetica, Arial, sans-serif !important;'><br /></div><div style='font-family: \"Avenir Next W01\", \"Avenir Next W00\", \"Avenir Next\", Avenir, \"Helvetica Neue\", Helvetica, Arial, sans-serif !important;'><div><font size='3'>This layer contains the following attributes (see data tab):</font></div><div><ul><li><font size='3'>Constituency code</font></li><li><font size='3'>Constituency name</font></li><li><font size='3'>Total area in square kilometers</font></li><li><font size='3'>Total land area in square kilometers.</font></li></ul><div><font size='3'>The layer is further generalised by Eagle Technology for improved performance on the web, <span style='font-family: \"Avenir Next W01\", \"Avenir Next W00\", \"Avenir Next\", Avenir, \"Helvetica Neue\", sans-serif;'>therefore it doesn't fully represent the official boundaries.</span><br /></font></div></div></div><div style='font-family: \"Avenir Next W01\", \"Avenir Next W00\", \"Avenir Next\", Avenir, \"Helvetica Neue\", Helvetica, Arial, sans-serif !important;'><font size='3'><br /></font></div><div style='font-family: \"Avenir Next W01\", \"Avenir Next W00\", \"Avenir Next\", Avenir, \"Helvetica Neue\", Helvetica, Arial, sans-serif !important;'><div style=''><font color='#2f4f4f' size='3'>This layer is offered by Eagle Technology (Official Esri Distributor). Eagle Technology offers services that can be used in the ArcGIS platform. The Content team at Eagle Technology updates the layers on a regular basis and regularly adds new content to the Living Atlas. By using this content and combining it with other data you can create new information products quickly and easily.</font></div><div style=''><font color='#2f4f4f' size='3'><br /></font></div><div style=''><font size='3'><font color='#2f4f4f' style=''>If you have any questions or comments about the content, please let us now  at </font><a href='mailto:livingatlas@eagle.co.nz.' style='color: rgb(0, 121, 193); text-decoration-line: none;' target='_blank' rel='nofollow ugc noopener noreferrer'>livingatlas@eagle.co.nz</a></font></div></div></div></div></div>",
			"keyword": [
				"eaglegis",
				"mature support",
				"retiring",
				"deprecated"
			],
			"issued": "2018-12-21T12:55:20.000Z",
			"modified": "2020-01-13T02:17:43.937Z",
			"publisher": {
				"name": "Eagle Technology Group Ltd"
			},
			"contactPoint": {
				"@type": "vcard:Contact",
				"fn": "eaglegis",
				"hasEmail": "mailto:ts@eaglegis.co.nz"
			},
			"accessLevel": "public",
			"spatial": "166.2620,-47.2230,-177.6196,-33.7735",
			"license": "https://creativecommons.org/licenses/by/4.0",
			"distribution": [
				{
					"@type": "dcat:Distribution",
					"title": "ArcGIS Hub Dataset",
					"format": "Web Page",
					"mediaType": "text/html",
					"accessURL": "https://www.pacificgeoportal.com/datasets/eaglegis::nz-constituency-boundaries-2019-mature-support"
				},
				{
					"@type": "dcat:Distribution",
					"title": "ArcGIS GeoService",
					"format": "ArcGIS GeoServices REST API",
					"mediaType": "application/json",
					"accessURL": "https://services.arcgis.com/XTtANUDT8Va4DLwI/arcgis/rest/services/Constituency_2019_generalised/FeatureServer/0"
				},
				{
					"@type": "dcat:Distribution",
					"title": "CSV",
					"format": "CSV",
					"mediaType": "text/csv",
					"accessURL": "https://www.pacificgeoportal.com/api/download/v1/items/2bdc59381da7488bac7434d5f646ef04/csv?layers=0"
				},
				{
					"@type": "dcat:Distribution",
					"title": "Shapefile",
					"format": "ZIP",
					"mediaType": "application/zip",
					"accessURL": "https://www.pacificgeoportal.com/api/download/v1/items/2bdc59381da7488bac7434d5f646ef04/shapefile?layers=0"
				},
				{
					"@type": "dcat:Distribution",
					"title": "GeoJSON",
					"format": "GeoJSON",
					"mediaType": "application/vnd.geo+json",
					"accessURL": "https://www.pacificgeoportal.com/api/download/v1/items/2bdc59381da7488bac7434d5f646ef04/geojson?layers=0"
				},
				{
					"@type": "dcat:Distribution",
					"title": "KML",
					"format": "KML",
					"mediaType": "application/vnd.google-earth.kml+xml",
					"accessURL": "https://www.pacificgeoportal.com/api/download/v1/items/2bdc59381da7488bac7434d5f646ef04/kml?layers=0"
				}
			],
			"theme": [
				"geospatial"
			]
		},
		{
			"@type": "dcat:Dataset",
			"identifier": "https://www.arcgis.com/home/item.html?id=1902654223dd44d3a1e163a384532730&sublayer=0",
			"landingPage": "https://www.pacificgeoportal.com/datasets/eaglegis::nz-constituency-boundaries-2018-mature-support",
			"title": "NZ Constituency boundaries 2018 (Mature Support)",
			"description": "<font size='3'><b><span style='color:firebrick;'>Important Note:</span></b><b> This item is in<span style='color:#C00000;'> mature support</span> as of January 2024 and will retire in January 2025.</b><b><span> When you need the most recent boundary layer please use <a href='https://www.arcgis.com/home/item.html?id=6712602ebaa54b60a421fe7ac73eb7aa' rel='nofollow ugc'>this item</a>. When you need the boundaries for a specific year, please use <a href='https://www.arcgis.com/home/item.html?id=5f373fde10f8442f81c4a3ef8a47961e' rel='nofollow ugc'>this item</a> and set a filter on the required year.</span></b><br /><br /></font><div><br /><font size='3' style='font-family: \"Avenir Next W01\", \"Avenir Next W00\", \"Avenir Next\", Avenir, \"Helvetica Neue\", Helvetica, Arial, sans-serif !important;'>Topicality: 01-01-2018</font><div><font size='3'><span style='font-family: \"Avenir Next W01\", \"Avenir Next W00\", \"Avenir Next\", Avenir, \"Helvetica Neue\", Helvetica, Arial, sans-serif;'>Projection: New Zealand Transverse Mercator (NZTM)</span><font face='Avenir Next W01, Avenir Next W00, Avenir Next, Avenir, Helvetica Neue, Helvetica, Arial, sans-serif'><br /></font></font><div style='font-family: \"Avenir Next W01\", \"Avenir Next W00\", \"Avenir Next\", Avenir, \"Helvetica Neue\", Helvetica, Arial, sans-serif !important;'><font size='3'><br /></font></div><div style=''><div style='font-family: \"Avenir Next W01\", \"Avenir Next W00\", \"Avenir Next\", Avenir, \"Helvetica Neue\", Helvetica, Arial, sans-serif !important;'><font size='3'><font face='Avenir Next W01, Avenir Next W00, Avenir Next, Avenir, Helvetica Neue, Helvetica, Arial, sans-serif'>This layer is based on the </font>definitive set of regional council constituency boundaries for\n2018 as defined by the regional councils and Local Government Commission\nbut maintained by Stats NZ (the custodian).<font face='Avenir Next W01, Avenir Next W00, Avenir Next, Avenir, Helvetica Neue, Helvetica, Arial, sans-serif'> </font></font></div><div style=''><font face='Avenir Next W01, Avenir Next W00, Avenir Next, Avenir, Helvetica Neue, Helvetica, Arial, sans-serif' size='3'><div style=''><br /></div><div style=''><div>Constituencies are established under the Local Electoral Act 2001 and result from the division of a region for electoral purposes. If a regional council decides to have a Māori constituency, the constituencies within the council are known as general constituencies and Māori constituencies.  </div><div> </div><div>Constituencies are divisions of regional council areas. They are defined at meshblock level, and do not coincide with the statistical area 1 (SA1) geography or the statistical area 2 (SA2) geography. They are created, based on population, to be the voting areas within councils. Constituencies are required to reflect communities of interest. Their boundaries, so far as is practicable, coincide with those of territorial authorities or wards. The boundaries of constituencies may be reviewed before each three-yearly local government election. Regional councils must review their representation arrangements at least once every six years. The provisions for such reviews are in the Local Government Act 2002. </div><div> </div><div>Constituencies are numbered based on their corresponding regional council. Each constituency has a unique four-digit code. The first two digits represent the regional council that the constituency lies within. The last two digits are sequential and represent the number of constituencies within a regional council. For example, the West Coast Regional Council (12) contains three constituencies, which are coded 1201, 1202, and 1203.</div></div></font></div><div style='font-family: \"Avenir Next W01\", \"Avenir Next W00\", \"Avenir Next\", Avenir, \"Helvetica Neue\", Helvetica, Arial, sans-serif !important;'><font face='Avenir Next W01, Avenir Next W00, Avenir Next, Avenir, Helvetica Neue, Helvetica, Arial, sans-serif' size='3'><br /></font></div><div style='font-family: \"Avenir Next W01\", \"Avenir Next W00\", \"Avenir Next\", Avenir, \"Helvetica Neue\", Helvetica, Arial, sans-serif !important;'><font size='3'>The official dataset can be found on<font face='Avenir Next W01, Avenir Next W00, Avenir Next, Avenir, Helvetica Neue, Helvetica, Arial, sans-serif'> </font><a href='https://datafinder.stats.govt.nz/layer/92196-constituency-2018-clipped-generalised/' target='_blank' rel='nofollow ugc noopener noreferrer'>https://datafinder.stats.govt.nz</a>.</font></div><div style='font-family: \"Avenir Next W01\", \"Avenir Next W00\", \"Avenir Next\", Avenir, \"Helvetica Neue\", Helvetica, Arial, sans-serif !important;'><br /></div><div style='font-family: \"Avenir Next W01\", \"Avenir Next W00\", \"Avenir Next\", Avenir, \"Helvetica Neue\", Helvetica, Arial, sans-serif !important;'><div><font size='3'>This layer contains the following attributes (see data tab):</font></div><div><ul><li><font size='3'>Constituency code</font></li><li><font size='3'>Constituency name</font></li><li><font size='3'>Total area in square kilometers</font></li><li><font size='3'>Total land area in square kilometers.</font></li></ul><div><font size='3'>The layer is further generalised by Eagle Technology for improved performance on the web, <span style='font-family: \"Avenir Next W01\", \"Avenir Next W00\", \"Avenir Next\", Avenir, \"Helvetica Neue\", sans-serif;'>therefore it doesn't fully represent the official boundaries.</span><br /></font></div></div></div><div style='font-family: \"Avenir Next W01\", \"Avenir Next W00\", \"Avenir Next\", Avenir, \"Helvetica Neue\", Helvetica, Arial, sans-serif !important;'><font size='3'><br /></font></div><div style='font-family: \"Avenir Next W01\", \"Avenir Next W00\", \"Avenir Next\", Avenir, \"Helvetica Neue\", Helvetica, Arial, sans-serif !important;'><div style=''><font color='#2f4f4f' size='3'>This layer is offered by Eagle Technology (Official Esri Distributor). Eagle Technology offers services that can be used in the ArcGIS platform. The Content team at Eagle Technology updates the layers on a regular basis and regularly adds new content to the Living Atlas. By using this content and combining it with other data you can create new information products quickly and easily.</font></div><div style=''><font color='#2f4f4f' size='3'><br /></font></div><div style=''><font size='3'><font color='#2f4f4f' style=''>If you have any questions or comments about the content, please let us now  at </font><a href='mailto:livingatlas@eagle.co.nz.' style='color: rgb(0, 121, 193); text-decoration-line: none;' target='_blank' rel='nofollow ugc noopener noreferrer'>livingatlas@eagle.co.nz</a></font></div></div></div></div></div>",
			"keyword": [
				"eaglegis",
				"mature support",
				"retiring",
				"deprecated"
			],
			"issued": "2018-09-14T01:56:36.000Z",
			"modified": "2019-02-13T01:34:56.558Z",
			"publisher": {
				"name": "Eagle Technology Group Ltd"
			},
			"contactPoint": {
				"@type": "vcard:Contact",
				"fn": "eaglegis",
				"hasEmail": "mailto:ts@eaglegis.co.nz"
			},
			"accessLevel": "public",
			"spatial": "166.2620,-47.2230,-177.6196,-33.7735",
			"license": "https://creativecommons.org/licenses/by/4.0",
			"distribution": [
				{
					"@type": "dcat:Distribution",
					"title": "ArcGIS Hub Dataset",
					"format": "Web Page",
					"mediaType": "text/html",
					"accessURL": "https://www.pacificgeoportal.com/datasets/eaglegis::nz-constituency-boundaries-2018-mature-support"
				},
				{
					"@type": "dcat:Distribution",
					"title": "ArcGIS GeoService",
					"format": "ArcGIS GeoServices REST API",
					"mediaType": "application/json",
					"accessURL": "https://services.arcgis.com/XTtANUDT8Va4DLwI/arcgis/rest/services/NZ_Constituency_boundaries_2018_generalised/FeatureServer/0"
				},
				{
					"@type": "dcat:Distribution",
					"title": "CSV",
					"format": "CSV",
					"mediaType": "text/csv",
					"accessURL": "https://www.pacificgeoportal.com/api/download/v1/items/1902654223dd44d3a1e163a384532730/csv?layers=0"
				},
				{
					"@type": "dcat:Distribution",
					"title": "Shapefile",
					"format": "ZIP",
					"mediaType": "application/zip",
					"accessURL": "https://www.pacificgeoportal.com/api/download/v1/items/1902654223dd44d3a1e163a384532730/shapefile?layers=0"
				},
				{
					"@type": "dcat:Distribution",
					"title": "GeoJSON",
					"format": "GeoJSON",
					"mediaType": "application/vnd.geo+json",
					"accessURL": "https://www.pacificgeoportal.com/api/download/v1/items/1902654223dd44d3a1e163a384532730/geojson?layers=0"
				},
				{
					"@type": "dcat:Distribution",
					"title": "KML",
					"format": "KML",
					"mediaType": "application/vnd.google-earth.kml+xml",
					"accessURL": "https://www.pacificgeoportal.com/api/download/v1/items/1902654223dd44d3a1e163a384532730/kml?layers=0"
				},
				{
					"@type": "dcat:Distribution",
					"title": "File Geodatabase",
					"format": "ZIP",
					"mediaType": "application/zip",
					"accessURL": "https://www.pacificgeoportal.com/api/download/v1/items/1902654223dd44d3a1e163a384532730/filegdb?layers=0"
				},
				{
					"@type": "dcat:Distribution",
					"title": "Feature Collection",
					"format": "TXT",
					"mediaType": "text/plain",
					"accessURL": "https://www.pacificgeoportal.com/api/download/v1/items/1902654223dd44d3a1e163a384532730/featureCollection?layers=0"
				},
				{
					"@type": "dcat:Distribution",
					"title": "Excel",
					"format": "XLSX",
					"mediaType": "application/vnd.ms-excel",
					"accessURL": "https://www.pacificgeoportal.com/api/download/v1/items/1902654223dd44d3a1e163a384532730/excel?layers=0"
				},
				{
					"@type": "dcat:Distribution",
					"title": "GeoPackage",
					"format": "GPKG",
					"mediaType": "application/geopackage+sqlite3",
					"accessURL": "https://www.pacificgeoportal.com/api/download/v1/items/1902654223dd44d3a1e163a384532730/geoPackage?layers=0"
				},
				{
					"@type": "dcat:Distribution",
					"title": "SQLite Geodatabase",
					"format": "GDB",
					"mediaType": "application/geopackage+sqlite3",
					"accessURL": "https://www.pacificgeoportal.com/api/download/v1/items/1902654223dd44d3a1e163a384532730/sqlite?layers=0"
				}
			],
			"theme": [
				"geospatial"
			]
		},
		{
			"@type": "dcat:Dataset",
			"identifier": "https://www.arcgis.com/home/item.html?id=47d2311499524322971dd871eb1b4a47&sublayer=0",
			"landingPage": "https://www.pacificgeoportal.com/datasets/eaglegis::nz-community-board-boundaries-2020-mature-support",
			"title": "NZ Community Board boundaries 2020 (Mature Support)",
			"description": "<font size='3'><b><span style='color:firebrick;'>Important Note:</span></b><b> This item is in<span style='color:#C00000;'> mature support</span> as of January 2024 and will retire in January 2025.</b><b><span> When you need the most recent boundary layer please use <a href='https://www.arcgis.com/home/item.html?id=f67d663afaab470982b63d0f37db0f30' rel='nofollow ugc'>this item</a>. When you need the boundaries for a specific year, please use <a href='https://www.arcgis.com/home/item.html?id=a855671b0d884afb91be42331f469138' rel='nofollow ugc'>this item</a> and set a filter on the required year.</span></b><br /><br /></font><div><br /><font size='3' style='font-family: \"Avenir Next W01\", \"Avenir Next W00\", \"Avenir Next\", Avenir, \"Helvetica Neue\", Helvetica, Arial, sans-serif !important;'>Topicality: 01-01-2020</font><div><div style='font-size: 17px; font-family: \"Avenir Next W01\", \"Avenir Next W00\", \"Avenir Next\", Avenir, \"Helvetica Neue\", Helvetica, Arial, sans-serif !important;'><span style='font-size: medium;'>Projection: New Zealand Transverse Mercator (NZTM)</span><br /></div><div style='font-size: 17px; font-family: \"Avenir Next W01\", \"Avenir Next W00\", \"Avenir Next\", Avenir, \"Helvetica Neue\", Helvetica, Arial, sans-serif !important;'></div><div style='font-family: \"Avenir Next W01\", \"Avenir Next W00\", \"Avenir Next\", Avenir, \"Helvetica Neue\", Helvetica, Arial, sans-serif !important;'><font size='3'><br /></font></div><div><div><font size='3'><font face='Avenir Next W01, Avenir Next W00, Avenir Next, Avenir, Helvetica Neue, Helvetica, Arial, sans-serif'>This layer is based on the dataset CB2020 (clipped)  retrieved from Stat NZ. It contains the </font>definitive set of Community Board boundaries as at 1 January 2020, clipped to the coastline.This clipped and generalized version has been created for map creation/cartographic purposes and does not fully represent the official full extent boundaries.</font></div><div><font face='Avenir Next W01, Avenir Next W00, Avenir Next, Avenir, Helvetica Neue, Helvetica, Arial, sans-serif' size='3'><br /></font></div><div><span style='font-family: \"Avenir Next W01\", \"Avenir Next W00\", \"Avenir Next\", Avenir, \"Helvetica Neue\", Helvetica, Arial, sans-serif; font-size: medium;'>The official dataset can be found on</span><font face='Avenir Next W01, Avenir Next W00, Avenir Next, Avenir, Helvetica Neue, Helvetica, Arial, sans-serif' size='3'> </font><a href='https://datafinder.stats.govt.nz/data/category/annual-boundaries/2020/' target='_blank' rel='nofollow ugc noopener noreferrer'>https://datafinder.stats.govt.nz</a>.</div><div><font face='Avenir Next W01, Avenir Next W00, Avenir Next, Avenir, Helvetica Neue, Helvetica, Arial, sans-serif' size='3'><br /></font></div><div><font size='3'><span style='font-family: \"Avenir Next W01\", \"Avenir Next W00\", \"Avenir Next\", Avenir, \"Helvetica Neue\", Helvetica, Arial, sans-serif;'>This layer contains the following attributes (see data tab):</span></font></div><div><ul><li>Community Board number</li><li>Community Board name</li><li>Total area in square kilometers</li><li>Total land area in square kilometers.</li></ul>The layer is further generalised by Eagle Technology for improved performance on the web, <span style='font-size: medium; font-family: \"Avenir Next W01\", \"Avenir Next W00\", \"Avenir Next\", Avenir, \"Helvetica Neue\", sans-serif;'>therefore it doesn't fully represent the official boundaries.</span><br /></div><div style='font-family: \"Avenir Next W01\", \"Avenir Next W00\", \"Avenir Next\", Avenir, \"Helvetica Neue\", Helvetica, Arial, sans-serif !important;'><font size='3'><br /></font></div><div><div style='font-family: \"Avenir Next W01\", \"Avenir Next W00\", \"Avenir Next\", Avenir, \"Helvetica Neue\", Helvetica, Arial, sans-serif !important;'><font color='#2f4f4f' size='3'>This layer is offered by Eagle Technology (Official Esri Distributor). Eagle Technology offers services that can be used in the ArcGIS platform. The Content team at Eagle Technology updates the layers on a regular basis and regularly adds new content to the Living Atlas. By using this content and combining it with other data you can create new information products quickly and easily.</font></div><div style='font-family: \"Avenir Next W01\", \"Avenir Next W00\", \"Avenir Next\", Avenir, \"Helvetica Neue\", Helvetica, Arial, sans-serif !important;'><font color='#2f4f4f' size='3'><br /></font></div><div style='font-family: \"Avenir Next W01\", \"Avenir Next W00\", \"Avenir Next\", Avenir, \"Helvetica Neue\", Helvetica, Arial, sans-serif !important;'><font size='3'><font color='#2f4f4f'>If you have any questions or comments about the content, please let us now  at </font><a href='mailto:livingatlas@eagle.co.nz' style='color: rgb(0, 121, 193); text-decoration-line: none;' target='_blank' rel='nofollow ugc noopener noreferrer'>livingatlas@eagle.co.nz</a></font></div></div></div></div></div>",
			"keyword": [
				"eaglegis",
				"mature support",
				"retiring",
				"deprecated"
			],
			"issued": "2020-01-11T10:16:47.000Z",
			"modified": "2021-02-10T04:00:41.247Z",
			"publisher": {
				"name": "Eagle Technology Group Ltd"
			},
			"contactPoint": {
				"@type": "vcard:Contact",
				"fn": "eaglegis",
				"hasEmail": "mailto:ts@eaglegis.co.nz"
			},
			"accessLevel": "public",
			"spatial": "166.2620,-47.2230,-177.6190,-33.7734",
			"license": "https://creativecommons.org/licenses/by/4.0",
			"distribution": [
				{
					"@type": "dcat:Distribution",
					"title": "ArcGIS Hub Dataset",
					"format": "Web Page",
					"mediaType": "text/html",
					"accessURL": "https://www.pacificgeoportal.com/datasets/eaglegis::nz-community-board-boundaries-2020-mature-support"
				},
				{
					"@type": "dcat:Distribution",
					"title": "ArcGIS GeoService",
					"format": "ArcGIS GeoServices REST API",
					"mediaType": "application/json",
					"accessURL": "https://services.arcgis.com/XTtANUDT8Va4DLwI/arcgis/rest/services/Community_Board_2020_Clipped_generalised/FeatureServer/0"
				},
				{
					"@type": "dcat:Distribution",
					"title": "CSV",
					"format": "CSV",
					"mediaType": "text/csv",
					"accessURL": "https://www.pacificgeoportal.com/api/download/v1/items/47d2311499524322971dd871eb1b4a47/csv?layers=0"
				},
				{
					"@type": "dcat:Distribution",
					"title": "Shapefile",
					"format": "ZIP",
					"mediaType": "application/zip",
					"accessURL": "https://www.pacificgeoportal.com/api/download/v1/items/47d2311499524322971dd871eb1b4a47/shapefile?layers=0"
				},
				{
					"@type": "dcat:Distribution",
					"title": "GeoJSON",
					"format": "GeoJSON",
					"mediaType": "application/vnd.geo+json",
					"accessURL": "https://www.pacificgeoportal.com/api/download/v1/items/47d2311499524322971dd871eb1b4a47/geojson?layers=0"
				},
				{
					"@type": "dcat:Distribution",
					"title": "KML",
					"format": "KML",
					"mediaType": "application/vnd.google-earth.kml+xml",
					"accessURL": "https://www.pacificgeoportal.com/api/download/v1/items/47d2311499524322971dd871eb1b4a47/kml?layers=0"
				},
				{
					"@type": "dcat:Distribution",
					"title": "File Geodatabase",
					"format": "ZIP",
					"mediaType": "application/zip",
					"accessURL": "https://www.pacificgeoportal.com/api/download/v1/items/47d2311499524322971dd871eb1b4a47/filegdb?layers=0"
				},
				{
					"@type": "dcat:Distribution",
					"title": "Feature Collection",
					"format": "TXT",
					"mediaType": "text/plain",
					"accessURL": "https://www.pacificgeoportal.com/api/download/v1/items/47d2311499524322971dd871eb1b4a47/featureCollection?layers=0"
				},
				{
					"@type": "dcat:Distribution",
					"title": "Excel",
					"format": "XLSX",
					"mediaType": "application/vnd.ms-excel",
					"accessURL": "https://www.pacificgeoportal.com/api/download/v1/items/47d2311499524322971dd871eb1b4a47/excel?layers=0"
				},
				{
					"@type": "dcat:Distribution",
					"title": "GeoPackage",
					"format": "GPKG",
					"mediaType": "application/geopackage+sqlite3",
					"accessURL": "https://www.pacificgeoportal.com/api/download/v1/items/47d2311499524322971dd871eb1b4a47/geoPackage?layers=0"
				},
				{
					"@type": "dcat:Distribution",
					"title": "SQLite Geodatabase",
					"format": "GDB",
					"mediaType": "application/geopackage+sqlite3",
					"accessURL": "https://www.pacificgeoportal.com/api/download/v1/items/47d2311499524322971dd871eb1b4a47/sqlite?layers=0"
				}
			],
			"theme": [
				"geospatial"
			]
		},
		{
			"@type": "dcat:Dataset",
			"identifier": "https://www.arcgis.com/home/item.html?id=c340588a49d743c993707b7d4cc0559b&sublayer=0",
			"landingPage": "https://www.pacificgeoportal.com/datasets/eaglegis::nz-community-board-boundaries-2019-mature-support",
			"title": "NZ Community Board boundaries 2019 (Mature Support)",
			"description": "<font size='3'><b><span style='color:firebrick;'>Important Note:</span></b><b> This item is in<span style='color:#C00000;'> mature support</span> as of January 2024 and will retire in January 2025.</b><b><span> When you need the most recent boundary layer please use <a href='https://www.arcgis.com/home/item.html?id=f67d663afaab470982b63d0f37db0f30' rel='nofollow ugc'>this item</a>. When you need the boundaries for a specific year, please use <a href='https://www.arcgis.com/home/item.html?id=a855671b0d884afb91be42331f469138' rel='nofollow ugc'>this item</a> and set a filter on the required year.</span></b><br /><br /></font><div><br /><font size='3' style='font-family: \"Avenir Next W01\", \"Avenir Next W00\", \"Avenir Next\", Avenir, \"Helvetica Neue\", Helvetica, Arial, sans-serif !important;'>Topicality: 01-01-2019</font><div><div style='font-size: 17px; font-family: \"Avenir Next W01\", \"Avenir Next W00\", \"Avenir Next\", Avenir, \"Helvetica Neue\", Helvetica, Arial, sans-serif !important;'><span style='font-size: medium;'>Projection: New Zealand Transverse Mercator (NZTM)</span><br /></div><div style='font-size: 17px; font-family: \"Avenir Next W01\", \"Avenir Next W00\", \"Avenir Next\", Avenir, \"Helvetica Neue\", Helvetica, Arial, sans-serif !important;'></div><div style='font-family: \"Avenir Next W01\", \"Avenir Next W00\", \"Avenir Next\", Avenir, \"Helvetica Neue\", Helvetica, Arial, sans-serif !important;'><font size='3'><br /></font></div><div><div><font size='3'><font face='Avenir Next W01, Avenir Next W00, Avenir Next, Avenir, Helvetica Neue, Helvetica, Arial, sans-serif'>This layer is based on the dataset CB2019 (clipped)  retrieved from Stat NZ. It contains the </font>definitive set of Community Board boundaries as at 1 January 2019, clipped to the coastline.This clipped and generalized version has been created for map creation/cartographic purposes and does not fully represent the official full extent boundaries.</font></div><div><font face='Avenir Next W01, Avenir Next W00, Avenir Next, Avenir, Helvetica Neue, Helvetica, Arial, sans-serif' size='3'><br /></font></div><div><span style='font-family: \"Avenir Next W01\", \"Avenir Next W00\", \"Avenir Next\", Avenir, \"Helvetica Neue\", Helvetica, Arial, sans-serif; font-size: medium;'>The official dataset can be found on</span><font face='Avenir Next W01, Avenir Next W00, Avenir Next, Avenir, Helvetica Neue, Helvetica, Arial, sans-serif' size='3'> </font><a href='https://datafinder.stats.govt.nz/layer/98745-community-board-2019-clipped-generalised/' target='_blank' rel='nofollow ugc noopener noreferrer'>https://datafinder.stats.govt.nz</a>.</div><div><font face='Avenir Next W01, Avenir Next W00, Avenir Next, Avenir, Helvetica Neue, Helvetica, Arial, sans-serif' size='3'><br /></font></div><div><font size='3'><span style='font-family: \"Avenir Next W01\", \"Avenir Next W00\", \"Avenir Next\", Avenir, \"Helvetica Neue\", Helvetica, Arial, sans-serif;'>This layer contains the following attributes (see data tab):</span></font></div><div><ul><li>Community Board number</li><li>Community Board name</li><li>Total area in square kilometers</li><li>Total land area in square kilometers.</li></ul>The layer is further generalised by Eagle Technology for improved performance on the web, <span style='font-size: medium; font-family: \"Avenir Next W01\", \"Avenir Next W00\", \"Avenir Next\", Avenir, \"Helvetica Neue\", sans-serif;'>therefore it doesn't fully represent the official boundaries.</span><br /></div><div style='font-family: \"Avenir Next W01\", \"Avenir Next W00\", \"Avenir Next\", Avenir, \"Helvetica Neue\", Helvetica, Arial, sans-serif !important;'><font size='3'><br /></font></div><div><div style='font-family: \"Avenir Next W01\", \"Avenir Next W00\", \"Avenir Next\", Avenir, \"Helvetica Neue\", Helvetica, Arial, sans-serif !important;'><font color='#2f4f4f' size='3'>This layer is offered by Eagle Technology (Official Esri Distributor). Eagle Technology offers services that can be used in the ArcGIS platform. The Content team at Eagle Technology updates the layers on a regular basis and regularly adds new content to the Living Atlas. By using this content and combining it with other data you can create new information products quickly and easily.</font></div><div style='font-family: \"Avenir Next W01\", \"Avenir Next W00\", \"Avenir Next\", Avenir, \"Helvetica Neue\", Helvetica, Arial, sans-serif !important;'><font color='#2f4f4f' size='3'><br /></font></div><div style='font-family: \"Avenir Next W01\", \"Avenir Next W00\", \"Avenir Next\", Avenir, \"Helvetica Neue\", Helvetica, Arial, sans-serif !important;'><font size='3'><font color='#2f4f4f'>If you have any questions or comments about the content, please let us now  at </font><a href='mailto:livingatlas@eagle.co.nz.' style='color: rgb(0, 121, 193); text-decoration-line: none;' target='_blank' rel='nofollow ugc noopener noreferrer'>livingatlas@eagle.co.nz</a></font></div></div></div></div></div>",
			"keyword": [
				"eaglegis",
				"mature support",
				"retiring",
				"deprecated"
			],
			"issued": "2018-12-21T12:54:43.000Z",
			"modified": "2018-12-21T13:11:52.290Z",
			"publisher": {
				"name": "Eagle Technology Group Ltd"
			},
			"contactPoint": {
				"@type": "vcard:Contact",
				"fn": "eaglegis",
				"hasEmail": "mailto:ts@eaglegis.co.nz"
			},
			"accessLevel": "public",
			"spatial": "166.2620,-47.2230,-177.6196,-33.7735",
			"license": "https://creativecommons.org/licenses/by/4.0",
			"distribution": [
				{
					"@type": "dcat:Distribution",
					"title": "ArcGIS Hub Dataset",
					"format": "Web Page",
					"mediaType": "text/html",
					"accessURL": "https://www.pacificgeoportal.com/datasets/eaglegis::nz-community-board-boundaries-2019-mature-support"
				},
				{
					"@type": "dcat:Distribution",
					"title": "ArcGIS GeoService",
					"format": "ArcGIS GeoServices REST API",
					"mediaType": "application/json",
					"accessURL": "https://services.arcgis.com/XTtANUDT8Va4DLwI/arcgis/rest/services/Community_Board_2019_Clipped_generalised/FeatureServer/0"
				},
				{
					"@type": "dcat:Distribution",
					"title": "CSV",
					"format": "CSV",
					"mediaType": "text/csv",
					"accessURL": "https://www.pacificgeoportal.com/api/download/v1/items/c340588a49d743c993707b7d4cc0559b/csv?layers=0"
				},
				{
					"@type": "dcat:Distribution",
					"title": "Shapefile",
					"format": "ZIP",
					"mediaType": "application/zip",
					"accessURL": "https://www.pacificgeoportal.com/api/download/v1/items/c340588a49d743c993707b7d4cc0559b/shapefile?layers=0"
				},
				{
					"@type": "dcat:Distribution",
					"title": "GeoJSON",
					"format": "GeoJSON",
					"mediaType": "application/vnd.geo+json",
					"accessURL": "https://www.pacificgeoportal.com/api/download/v1/items/c340588a49d743c993707b7d4cc0559b/geojson?layers=0"
				},
				{
					"@type": "dcat:Distribution",
					"title": "KML",
					"format": "KML",
					"mediaType": "application/vnd.google-earth.kml+xml",
					"accessURL": "https://www.pacificgeoportal.com/api/download/v1/items/c340588a49d743c993707b7d4cc0559b/kml?layers=0"
				}
			],
			"theme": [
				"geospatial"
			]
		},
		{
			"@type": "dcat:Dataset",
			"identifier": "https://www.arcgis.com/home/item.html?id=2e6827bb25b24dfba82c3149c8a48095&sublayer=0",
			"landingPage": "https://www.pacificgeoportal.com/datasets/eaglegis::nz-community-board-boundaries-2018-mature-support",
			"title": "NZ Community Board boundaries 2018 (Mature Support)",
			"description": "<font size='3'><b><span style='color:firebrick;'>Important Note:</span></b><b> This item is in<span style='color:#C00000;'> mature support</span> as of January 2024 and will retire in January 2025.</b><b><span> When you need the most recent boundary layer please use <a href='https://www.arcgis.com/home/item.html?id=f67d663afaab470982b63d0f37db0f30' rel='nofollow ugc'>this item</a>. When you need the boundaries for a specific year, please use <a href='https://www.arcgis.com/home/item.html?id=a855671b0d884afb91be42331f469138' rel='nofollow ugc'>this item</a> and set a filter on the required year.</span></b><br /><br /></font><div><br /><font size='3' style='font-family: \"Avenir Next W01\", \"Avenir Next W00\", \"Avenir Next\", Avenir, \"Helvetica Neue\", Helvetica, Arial, sans-serif !important;'>Topicality: 01-01-2018</font><div><div style='font-size: 17px; font-family: \"Avenir Next W01\", \"Avenir Next W00\", \"Avenir Next\", Avenir, \"Helvetica Neue\", Helvetica, Arial, sans-serif !important;'><span style='font-size: medium;'>Projection: New Zealand Transverse Mercator (NZTM)</span><br /></div><div style='font-size: 17px; font-family: \"Avenir Next W01\", \"Avenir Next W00\", \"Avenir Next\", Avenir, \"Helvetica Neue\", Helvetica, Arial, sans-serif !important;'></div><div style='font-family: \"Avenir Next W01\", \"Avenir Next W00\", \"Avenir Next\", Avenir, \"Helvetica Neue\", Helvetica, Arial, sans-serif !important;'><font size='3'><br /></font></div><div><div><font size='3'><font face='Avenir Next W01, Avenir Next W00, Avenir Next, Avenir, Helvetica Neue, Helvetica, Arial, sans-serif'>This layer is based on the dataset CB2018 (clipped)  retrieved from Stat NZ. It contains the </font>definitive set of Community Board boundaries as at 1 January 2018, clipped to the coastline.This clipped and generalized version has been created for map creation/cartographic purposes and does not fully represent the official full extent boundaries.</font></div><div><font face='Avenir Next W01, Avenir Next W00, Avenir Next, Avenir, Helvetica Neue, Helvetica, Arial, sans-serif' size='3'><br /></font></div><div><span style='font-family: \"Avenir Next W01\", \"Avenir Next W00\", \"Avenir Next\", Avenir, \"Helvetica Neue\", Helvetica, Arial, sans-serif; font-size: medium;'>The official dataset can be found on</span><font face='Avenir Next W01, Avenir Next W00, Avenir Next, Avenir, Helvetica Neue, Helvetica, Arial, sans-serif' size='3'> </font><a href='https://datafinder.stats.govt.nz/layer/92194-community-board-2018-clipped-generalised/' target='_blank' rel='nofollow ugc noopener noreferrer'>https://datafinder.stats.govt.nz</a>.</div><div><font face='Avenir Next W01, Avenir Next W00, Avenir Next, Avenir, Helvetica Neue, Helvetica, Arial, sans-serif' size='3'><br /></font></div><div><font size='3'><span style='font-family: \"Avenir Next W01\", \"Avenir Next W00\", \"Avenir Next\", Avenir, \"Helvetica Neue\", Helvetica, Arial, sans-serif;'>This layer contains the following attributes (see data tab):</span></font></div><div><ul><li>Community Board number</li><li>Community Board name</li><li>Territorial Authority name</li><li>Territorial Authority code </li><li>Total area in square kilometers</li><li>Total land area in square kilometers.</li></ul>The layer is further generalised by Eagle Technology for improved performance on the web, <span style='font-size: medium; font-family: \"Avenir Next W01\", \"Avenir Next W00\", \"Avenir Next\", Avenir, \"Helvetica Neue\", sans-serif;'>therefore it doesn't fully represent the official boundaries.</span><br /></div><div style='font-family: \"Avenir Next W01\", \"Avenir Next W00\", \"Avenir Next\", Avenir, \"Helvetica Neue\", Helvetica, Arial, sans-serif !important;'><font size='3'><br /></font></div><div><div style='font-family: \"Avenir Next W01\", \"Avenir Next W00\", \"Avenir Next\", Avenir, \"Helvetica Neue\", Helvetica, Arial, sans-serif !important;'><font color='#2f4f4f' size='3'>This layer is offered by Eagle Technology (Official Esri Distributor). Eagle Technology offers services that can be used in the ArcGIS platform. The Content team at Eagle Technology updates the layers on a regular basis and regularly adds new content to the Living Atlas. By using this content and combining it with other data you can create new information products quickly and easily.</font></div><div style='font-family: \"Avenir Next W01\", \"Avenir Next W00\", \"Avenir Next\", Avenir, \"Helvetica Neue\", Helvetica, Arial, sans-serif !important;'><font color='#2f4f4f' size='3'><br /></font></div><div style='font-family: \"Avenir Next W01\", \"Avenir Next W00\", \"Avenir Next\", Avenir, \"Helvetica Neue\", Helvetica, Arial, sans-serif !important;'><font size='3'><font color='#2f4f4f'>If you have any questions or comments about the content, please let us now  at </font><a href='mailto:livingatlas@eagle.co.nz.' style='color: rgb(0, 121, 193); text-decoration-line: none;' target='_blank' rel='nofollow ugc noopener noreferrer'>livingatlas@eagle.co.nz</a></font></div></div></div></div></div>",
			"keyword": [
				"eaglegis",
				"mature support",
				"retiring",
				"deprecated"
			],
			"issued": "2018-09-05T04:58:55.000Z",
			"modified": "2018-09-05T23:31:11.945Z",
			"publisher": {
				"name": "Eagle Technology Group Ltd"
			},
			"contactPoint": {
				"@type": "vcard:Contact",
				"fn": "eaglegis",
				"hasEmail": "mailto:ts@eaglegis.co.nz"
			},
			"accessLevel": "public",
			"spatial": "166.2620,-47.2230,-177.6196,-33.7735",
			"license": "https://creativecommons.org/licenses/by/4.0",
			"distribution": [
				{
					"@type": "dcat:Distribution",
					"title": "ArcGIS Hub Dataset",
					"format": "Web Page",
					"mediaType": "text/html",
					"accessURL": "https://www.pacificgeoportal.com/datasets/eaglegis::nz-community-board-boundaries-2018-mature-support"
				},
				{
					"@type": "dcat:Distribution",
					"title": "ArcGIS GeoService",
					"format": "ArcGIS GeoServices REST API",
					"mediaType": "application/json",
					"accessURL": "https://services.arcgis.com/XTtANUDT8Va4DLwI/arcgis/rest/services/NZ_Community_Board_boundaries_2018_generalised/FeatureServer/0"
				},
				{
					"@type": "dcat:Distribution",
					"title": "CSV",
					"format": "CSV",
					"mediaType": "text/csv",
					"accessURL": "https://www.pacificgeoportal.com/api/download/v1/items/2e6827bb25b24dfba82c3149c8a48095/csv?layers=0"
				},
				{
					"@type": "dcat:Distribution",
					"title": "Shapefile",
					"format": "ZIP",
					"mediaType": "application/zip",
					"accessURL": "https://www.pacificgeoportal.com/api/download/v1/items/2e6827bb25b24dfba82c3149c8a48095/shapefile?layers=0"
				},
				{
					"@type": "dcat:Distribution",
					"title": "GeoJSON",
					"format": "GeoJSON",
					"mediaType": "application/vnd.geo+json",
					"accessURL": "https://www.pacificgeoportal.com/api/download/v1/items/2e6827bb25b24dfba82c3149c8a48095/geojson?layers=0"
				},
				{
					"@type": "dcat:Distribution",
					"title": "KML",
					"format": "KML",
					"mediaType": "application/vnd.google-earth.kml+xml",
					"accessURL": "https://www.pacificgeoportal.com/api/download/v1/items/2e6827bb25b24dfba82c3149c8a48095/kml?layers=0"
				},
				{
					"@type": "dcat:Distribution",
					"title": "File Geodatabase",
					"format": "ZIP",
					"mediaType": "application/zip",
					"accessURL": "https://www.pacificgeoportal.com/api/download/v1/items/2e6827bb25b24dfba82c3149c8a48095/filegdb?layers=0"
				},
				{
					"@type": "dcat:Distribution",
					"title": "Feature Collection",
					"format": "TXT",
					"mediaType": "text/plain",
					"accessURL": "https://www.pacificgeoportal.com/api/download/v1/items/2e6827bb25b24dfba82c3149c8a48095/featureCollection?layers=0"
				},
				{
					"@type": "dcat:Distribution",
					"title": "Excel",
					"format": "XLSX",
					"mediaType": "application/vnd.ms-excel",
					"accessURL": "https://www.pacificgeoportal.com/api/download/v1/items/2e6827bb25b24dfba82c3149c8a48095/excel?layers=0"
				},
				{
					"@type": "dcat:Distribution",
					"title": "GeoPackage",
					"format": "GPKG",
					"mediaType": "application/geopackage+sqlite3",
					"accessURL": "https://www.pacificgeoportal.com/api/download/v1/items/2e6827bb25b24dfba82c3149c8a48095/geoPackage?layers=0"
				},
				{
					"@type": "dcat:Distribution",
					"title": "SQLite Geodatabase",
					"format": "GDB",
					"mediaType": "application/geopackage+sqlite3",
					"accessURL": "https://www.pacificgeoportal.com/api/download/v1/items/2e6827bb25b24dfba82c3149c8a48095/sqlite?layers=0"
				}
			],
			"theme": [
				"geospatial"
			]
		},
		{
			"@type": "dcat:Dataset",
			"identifier": "https://www.arcgis.com/home/item.html?id=7c7152d6d0ab4a6a8176b2464efd71bd&sublayer=0",
			"landingPage": "https://www.pacificgeoportal.com/datasets/eaglegis::nz-territorial-authorities-2021-mature-support",
			"title": "NZ Territorial Authorities - 2021 (Mature Support)",
			"description": "<font size='3'><b><span style='color:firebrick;'>Important Note:</span></b><b> This item is in<span style='color:#C00000;'> mature support</span> as of January 2024 and will retire in January 2025.</b><b><span> When you need the most recent boundary layer please use <a href='https://www.arcgis.com/home/item.html?id=288ba59f0f5b424e80082ce668de7a8d' rel='nofollow ugc'>this item</a>. When you need the boundaries for a specific year, please use <a href='https://www.arcgis.com/home/item.html?id=a4d7a13b12f84376b9c5b2ec25f50ad2' rel='nofollow ugc'>this item</a> and set a filter on the required year.</span></b><br /><br /></font><div><br /><div><font size='3' style='font-family:\"Avenir Next W01\", \"Avenir Next W00\", \"Avenir Next\", Avenir, \"Helvetica Neue\", Helvetica, Arial, sans-serif !important;'>Topicality: 01-01-2021</font></div><div><font size='3' style='font-family:\"Avenir Next W01\", \"Avenir Next W00\", \"Avenir Next\", Avenir, \"Helvetica Neue\", Helvetica, Arial, sans-serif !important;'><font style='font-family:\"Avenir Next W01\", \"Avenir Next W00\", \"Avenir Next\", Avenir, \"Helvetica Neue\", Helvetica, Arial, sans-serif !important; font-size:17px;'><span style='font-size:17px;'>Projection: New Zealand Transverse Mercator (NZTM)</span></font></font></div><div style='font-family:\"Avenir Next W01\", \"Avenir Next W00\", \"Avenir Next\", Avenir, \"Helvetica Neue\", Helvetica, Arial, sans-serif !important;'><font size='3'><br /></font></div><div style=''><div style=''><font size='3'><font>This layer is based on the dataset TA2021_V1_00_Clipped  retrieved from Stats NZ. It contains the </font>major released version of the annually released territorial authority boundaries as at 1 January 2021, clipped to the coastline.This clipped version contains 67 territorial authorities and has been created for map creation/cartographic purposes and does not fully represent the official full extent boundaries.</font></div><div style=''><font size='3'><br /></font></div><div style=''><span style='font-family:\"Avenir Next W01\", \"Avenir Next W00\", \"Avenir Next\", Avenir, \"Helvetica Neue\", Helvetica, Arial, sans-serif; font-size:medium;'>This layer shows the data for 2021. If you would like to use the layer that gets updated yearly with the latest boundary data, you can use <a href='https://www.arcgis.com/home/item.html?id=288ba59f0f5b424e80082ce668de7a8d' target='_blank' rel='nofollow ugc noopener noreferrer'>this item</a>.<br /><br />All the boundary layers can be found <a href='https://www.arcgis.com/home/group.html?id=8047736c3e43467aa62241976851eff9' target='_blank' rel='nofollow ugc noopener noreferrer'>here</a>.<br /><br />All the boundary layers that are updated yearly can be found <a href='https://www.arcgis.com/home/group.html?id=b22e4f0012a8426dac21cd3d02f25c67' target='_blank' rel='nofollow ugc noopener noreferrer'>here</a>.<br /><br />The official dataset can be found on</span><font size='3'> </font><a href='https://datafinder.stats.govt.nz/data/category/annual-boundaries/2021/' target='_blank' rel='nofollow ugc noopener noreferrer'>https://datafinder.stats.govt.nz</a>.</div><div style=''><font size='3'><br /></font></div><div style=''><font size='3'><span style='font-family:\"Avenir Next W01\", \"Avenir Next W00\", \"Avenir Next\", Avenir, \"Helvetica Neue\", Helvetica, Arial, sans-serif;'>This layer contains the Territorial Authority name and code and the total area and the total land area in square kilometers. The layer is further generalised by Eagle Technology for improved performance on the web, </span><span style='font-family:\"Avenir Next W01\", \"Avenir Next W00\", \"Avenir Next\", Avenir, \"Helvetica Neue\", sans-serif;'>therefore it doesn't fully represent the official boundaries.</span><br /></font></div><div style='font-family:\"Avenir Next W01\", \"Avenir Next W00\", \"Avenir Next\", Avenir, \"Helvetica Neue\", Helvetica, Arial, sans-serif !important;'><font size='3'><br /></font></div><div style=''><div style='font-family:\"Avenir Next W01\", \"Avenir Next W00\", \"Avenir Next\", Avenir, \"Helvetica Neue\", Helvetica, Arial, sans-serif !important;'><font color='#2f4f4f' size='3'>This layer is offered by Eagle Technology (Official Esri Distributor). Eagle Technology offers services that can be used in the ArcGIS platform. The Content team at Eagle Technology updates the layers on a regular basis and regularly adds new content to the Living Atlas. By using this content and combining it with other data you can create new information products quickly and easily.</font></div><div style='font-family:\"Avenir Next W01\", \"Avenir Next W00\", \"Avenir Next\", Avenir, \"Helvetica Neue\", Helvetica, Arial, sans-serif !important;'><font color='#2f4f4f' size='3'><br /></font></div><div style='font-family:\"Avenir Next W01\", \"Avenir Next W00\", \"Avenir Next\", Avenir, \"Helvetica Neue\", Helvetica, Arial, sans-serif !important;'><font size='3'><font color='#2f4f4f' style=''>If you have any questions or comments about the content, please let us now  at </font><a href='mailto:livingatlas@eagle.co.nz' style='color:rgb(0, 121, 193); text-decoration-line:none;' target='_blank' rel='nofollow ugc noopener noreferrer'>livingatlas@eagle.co.nz</a></font></div></div></div></div>",
			"keyword": [
				"eaglegis",
				"mature support",
				"retiring",
				"deprecated"
			],
			"issued": "2021-02-04T02:16:16.000Z",
			"modified": "2021-02-15T23:01:57.040Z",
			"publisher": {
				"name": "Eagle Technology Group Ltd"
			},
			"contactPoint": {
				"@type": "vcard:Contact",
				"fn": "eaglegis",
				"hasEmail": "mailto:ts@eaglegis.co.nz"
			},
			"accessLevel": "public",
			"spatial": "166.2620,-47.2230,-177.6189,-33.7734",
			"license": "https://creativecommons.org/licenses/by/4.0",
			"distribution": [
				{
					"@type": "dcat:Distribution",
					"title": "ArcGIS Hub Dataset",
					"format": "Web Page",
					"mediaType": "text/html",
					"accessURL": "https://www.pacificgeoportal.com/datasets/eaglegis::nz-territorial-authorities-2021-mature-support"
				},
				{
					"@type": "dcat:Distribution",
					"title": "ArcGIS GeoService",
					"format": "ArcGIS GeoServices REST API",
					"mediaType": "application/json",
					"accessURL": "https://services.arcgis.com/XTtANUDT8Va4DLwI/arcgis/rest/services/nz_territorial_authorities_2021/FeatureServer/0"
				},
				{
					"@type": "dcat:Distribution",
					"title": "CSV",
					"format": "CSV",
					"mediaType": "text/csv",
					"accessURL": "https://www.pacificgeoportal.com/api/download/v1/items/7c7152d6d0ab4a6a8176b2464efd71bd/csv?layers=0"
				},
				{
					"@type": "dcat:Distribution",
					"title": "Shapefile",
					"format": "ZIP",
					"mediaType": "application/zip",
					"accessURL": "https://www.pacificgeoportal.com/api/download/v1/items/7c7152d6d0ab4a6a8176b2464efd71bd/shapefile?layers=0"
				},
				{
					"@type": "dcat:Distribution",
					"title": "GeoJSON",
					"format": "GeoJSON",
					"mediaType": "application/vnd.geo+json",
					"accessURL": "https://www.pacificgeoportal.com/api/download/v1/items/7c7152d6d0ab4a6a8176b2464efd71bd/geojson?layers=0"
				},
				{
					"@type": "dcat:Distribution",
					"title": "KML",
					"format": "KML",
					"mediaType": "application/vnd.google-earth.kml+xml",
					"accessURL": "https://www.pacificgeoportal.com/api/download/v1/items/7c7152d6d0ab4a6a8176b2464efd71bd/kml?layers=0"
				},
				{
					"@type": "dcat:Distribution",
					"title": "File Geodatabase",
					"format": "ZIP",
					"mediaType": "application/zip",
					"accessURL": "https://www.pacificgeoportal.com/api/download/v1/items/7c7152d6d0ab4a6a8176b2464efd71bd/filegdb?layers=0"
				},
				{
					"@type": "dcat:Distribution",
					"title": "Feature Collection",
					"format": "TXT",
					"mediaType": "text/plain",
					"accessURL": "https://www.pacificgeoportal.com/api/download/v1/items/7c7152d6d0ab4a6a8176b2464efd71bd/featureCollection?layers=0"
				},
				{
					"@type": "dcat:Distribution",
					"title": "Excel",
					"format": "XLSX",
					"mediaType": "application/vnd.ms-excel",
					"accessURL": "https://www.pacificgeoportal.com/api/download/v1/items/7c7152d6d0ab4a6a8176b2464efd71bd/excel?layers=0"
				},
				{
					"@type": "dcat:Distribution",
					"title": "GeoPackage",
					"format": "GPKG",
					"mediaType": "application/geopackage+sqlite3",
					"accessURL": "https://www.pacificgeoportal.com/api/download/v1/items/7c7152d6d0ab4a6a8176b2464efd71bd/geoPackage?layers=0"
				},
				{
					"@type": "dcat:Distribution",
					"title": "SQLite Geodatabase",
					"format": "GDB",
					"mediaType": "application/geopackage+sqlite3",
					"accessURL": "https://www.pacificgeoportal.com/api/download/v1/items/7c7152d6d0ab4a6a8176b2464efd71bd/sqlite?layers=0"
				}
			],
			"theme": [
				"geospatial"
			]
		},
		{
			"@type": "dcat:Dataset",
			"identifier": "https://www.arcgis.com/home/item.html?id=b95e3429cc40434aa5dc21f9d3e00778&sublayer=0",
			"landingPage": "https://www.pacificgeoportal.com/datasets/eaglegis::nz-territorial-authority-boundaries-2020-mature-support",
			"title": "NZ Territorial Authority boundaries 2020 (Mature Support)",
			"description": "<font size='3'><b><span style='color:firebrick;'>Important Note:</span></b><b> This item is in<span style='color:#C00000;'> mature support</span> as of January 2024 and will retire in January 2025.</b><b><span> When you need the most recent boundary layer please use <a href='https://www.arcgis.com/home/item.html?id=288ba59f0f5b424e80082ce668de7a8d' rel='nofollow ugc'>this item</a>. When you need the boundaries for a specific year, please use <a href='https://www.arcgis.com/home/item.html?id=a4d7a13b12f84376b9c5b2ec25f50ad2' rel='nofollow ugc'>this item</a> and set a filter on the required year.</span></b><br /><br /></font><div><br /><div><font size='3' style='font-family:\"Avenir Next W01\", \"Avenir Next W00\", \"Avenir Next\", Avenir, \"Helvetica Neue\", Helvetica, Arial, sans-serif !important;'>Topicality: 01-01-2020</font></div><div><font size='3' style='font-family:\"Avenir Next W01\", \"Avenir Next W00\", \"Avenir Next\", Avenir, \"Helvetica Neue\", Helvetica, Arial, sans-serif !important;'><font style='font-family:\"Avenir Next W01\", \"Avenir Next W00\", \"Avenir Next\", Avenir, \"Helvetica Neue\", Helvetica, Arial, sans-serif !important; font-size:17px;'><span style='font-size:17px;'>Projection: New Zealand Transverse Mercator (NZTM)</span></font></font></div><div style='font-family:\"Avenir Next W01\", \"Avenir Next W00\", \"Avenir Next\", Avenir, \"Helvetica Neue\", Helvetica, Arial, sans-serif !important;'><font size='3'><br /></font></div><div style=''><div style=''><font size='3'><font>This layer is based on the dataset TA2020_V1_00_Clipped  retrieved from Stat NZ. It contains the </font>major released version of the annually released territorial authority boundaries as at 1 January 2020, clipped to the coastline.This clipped version contains 67 territorial authorities and has been created for map creation/cartographic purposes and does not fully represent the official full extent boundaries.</font></div><div style=''><font size='3'><br /></font></div><div style=''><span style='font-family:\"Avenir Next W01\", \"Avenir Next W00\", \"Avenir Next\", Avenir, \"Helvetica Neue\", Helvetica, Arial, sans-serif; font-size:medium;'>The official dataset can be found on</span><font size='3'> </font><a href='https://datafinder.stats.govt.nz/data/category/annual-boundaries/2020/' target='_blank' rel='nofollow ugc noopener noreferrer'>https://datafinder.stats.govt.nz</a>.</div><div style=''><font size='3'><br /></font></div><div style=''><font size='3'><span style='font-family:\"Avenir Next W01\", \"Avenir Next W00\", \"Avenir Next\", Avenir, \"Helvetica Neue\", Helvetica, Arial, sans-serif;'>This layer contains the Territorial Authority name and code and the total area and the total land area in square kilometers. The layer is further generalised by Eagle Technology for improved performance on the web, </span><span style='font-family:\"Avenir Next W01\", \"Avenir Next W00\", \"Avenir Next\", Avenir, \"Helvetica Neue\", sans-serif;'>therefore it doesn't fully represent the official boundaries.</span><br /></font></div><div style='font-family:\"Avenir Next W01\", \"Avenir Next W00\", \"Avenir Next\", Avenir, \"Helvetica Neue\", Helvetica, Arial, sans-serif !important;'><font size='3'><br /></font></div><div style=''><div style='font-family:\"Avenir Next W01\", \"Avenir Next W00\", \"Avenir Next\", Avenir, \"Helvetica Neue\", Helvetica, Arial, sans-serif !important;'><font color='#2f4f4f' size='3'>This layer is offered by Eagle Technology (Official Esri Distributor). Eagle Technology offers services that can be used in the ArcGIS platform. The Content team at Eagle Technology updates the layers on a regular basis and regularly adds new content to the Living Atlas. By using this content and combining it with other data you can create new information products quickly and easily.</font></div><div style='font-family:\"Avenir Next W01\", \"Avenir Next W00\", \"Avenir Next\", Avenir, \"Helvetica Neue\", Helvetica, Arial, sans-serif !important;'><font color='#2f4f4f' size='3'><br /></font></div><div style='font-family:\"Avenir Next W01\", \"Avenir Next W00\", \"Avenir Next\", Avenir, \"Helvetica Neue\", Helvetica, Arial, sans-serif !important;'><font size='3'><font color='#2f4f4f' style=''>If you have any questions or comments about the content, please let us now  at </font><a href='mailto:livingatlas@eagle.co.nz' style='color:rgb(0, 121, 193); text-decoration-line:none;' target='_blank' rel='nofollow ugc noopener noreferrer'>livingatlas@eagle.co.nz</a></font></div></div></div></div>",
			"keyword": [
				"eaglegis",
				"mature support",
				"retiring",
				"deprecated"
			],
			"issued": "2020-01-11T10:16:13.000Z",
			"modified": "2022-01-23T03:48:04.458Z",
			"publisher": {
				"name": "Eagle Technology Group Ltd"
			},
			"contactPoint": {
				"@type": "vcard:Contact",
				"fn": "eaglegis",
				"hasEmail": "mailto:ts@eaglegis.co.nz"
			},
			"accessLevel": "public",
			"spatial": "166.2620,-47.2230,-177.6190,-33.7734",
			"license": "https://creativecommons.org/licenses/by/4.0",
			"distribution": [
				{
					"@type": "dcat:Distribution",
					"title": "ArcGIS Hub Dataset",
					"format": "Web Page",
					"mediaType": "text/html",
					"accessURL": "https://www.pacificgeoportal.com/datasets/eaglegis::nz-territorial-authority-boundaries-2020-mature-support"
				},
				{
					"@type": "dcat:Distribution",
					"title": "ArcGIS GeoService",
					"format": "ArcGIS GeoServices REST API",
					"mediaType": "application/json",
					"accessURL": "https://services.arcgis.com/XTtANUDT8Va4DLwI/arcgis/rest/services/Territorial_Authority_2020_Clipped_generalised/FeatureServer/0"
				},
				{
					"@type": "dcat:Distribution",
					"title": "CSV",
					"format": "CSV",
					"mediaType": "text/csv",
					"accessURL": "https://www.pacificgeoportal.com/api/download/v1/items/b95e3429cc40434aa5dc21f9d3e00778/csv?layers=0"
				},
				{
					"@type": "dcat:Distribution",
					"title": "Shapefile",
					"format": "ZIP",
					"mediaType": "application/zip",
					"accessURL": "https://www.pacificgeoportal.com/api/download/v1/items/b95e3429cc40434aa5dc21f9d3e00778/shapefile?layers=0"
				},
				{
					"@type": "dcat:Distribution",
					"title": "GeoJSON",
					"format": "GeoJSON",
					"mediaType": "application/vnd.geo+json",
					"accessURL": "https://www.pacificgeoportal.com/api/download/v1/items/b95e3429cc40434aa5dc21f9d3e00778/geojson?layers=0"
				},
				{
					"@type": "dcat:Distribution",
					"title": "KML",
					"format": "KML",
					"mediaType": "application/vnd.google-earth.kml+xml",
					"accessURL": "https://www.pacificgeoportal.com/api/download/v1/items/b95e3429cc40434aa5dc21f9d3e00778/kml?layers=0"
				},
				{
					"@type": "dcat:Distribution",
					"title": "File Geodatabase",
					"format": "ZIP",
					"mediaType": "application/zip",
					"accessURL": "https://www.pacificgeoportal.com/api/download/v1/items/b95e3429cc40434aa5dc21f9d3e00778/filegdb?layers=0"
				},
				{
					"@type": "dcat:Distribution",
					"title": "Feature Collection",
					"format": "TXT",
					"mediaType": "text/plain",
					"accessURL": "https://www.pacificgeoportal.com/api/download/v1/items/b95e3429cc40434aa5dc21f9d3e00778/featureCollection?layers=0"
				},
				{
					"@type": "dcat:Distribution",
					"title": "Excel",
					"format": "XLSX",
					"mediaType": "application/vnd.ms-excel",
					"accessURL": "https://www.pacificgeoportal.com/api/download/v1/items/b95e3429cc40434aa5dc21f9d3e00778/excel?layers=0"
				},
				{
					"@type": "dcat:Distribution",
					"title": "GeoPackage",
					"format": "GPKG",
					"mediaType": "application/geopackage+sqlite3",
					"accessURL": "https://www.pacificgeoportal.com/api/download/v1/items/b95e3429cc40434aa5dc21f9d3e00778/geoPackage?layers=0"
				},
				{
					"@type": "dcat:Distribution",
					"title": "SQLite Geodatabase",
					"format": "GDB",
					"mediaType": "application/geopackage+sqlite3",
					"accessURL": "https://www.pacificgeoportal.com/api/download/v1/items/b95e3429cc40434aa5dc21f9d3e00778/sqlite?layers=0"
				}
			],
			"theme": [
				"geospatial"
			]
		},
		{
			"@type": "dcat:Dataset",
			"identifier": "https://www.arcgis.com/home/item.html?id=2168cc8b019d4c7684d5923a4380a3c3&sublayer=0",
			"landingPage": "https://www.pacificgeoportal.com/datasets/eaglegis::nz-territorial-authority-boundaries-2019-mature-support",
			"title": "NZ Territorial Authority boundaries 2019 (Mature Support)",
			"description": "<font size='3'><b><span style='color:firebrick;'>Important Note:</span></b><b> This item is in<span style='color:#C00000;'> mature support</span> as of January 2024 and will retire in January 2025.</b><b><span> When you need the most recent boundary layer please use <a href='https://www.arcgis.com/home/item.html?id=288ba59f0f5b424e80082ce668de7a8d' rel='nofollow ugc'>this item</a>. When you need the boundaries for a specific year, please use <a href='https://www.arcgis.com/home/item.html?id=a4d7a13b12f84376b9c5b2ec25f50ad2' rel='nofollow ugc'>this item</a> and set a filter on the required year.</span></b><br /><br /></font><div><br /><div><font size='3' style='font-family:\"Avenir Next W01\", \"Avenir Next W00\", \"Avenir Next\", Avenir, \"Helvetica Neue\", Helvetica, Arial, sans-serif !important;'>Topicality: 01-01-2019</font></div><div><font size='3' style='font-family:\"Avenir Next W01\", \"Avenir Next W00\", \"Avenir Next\", Avenir, \"Helvetica Neue\", Helvetica, Arial, sans-serif !important;'><font style='font-family:\"Avenir Next W01\", \"Avenir Next W00\", \"Avenir Next\", Avenir, \"Helvetica Neue\", Helvetica, Arial, sans-serif !important; font-size:17px;'><span style='font-size:17px;'>Projection: New Zealand Transverse Mercator (NZTM)</span></font></font></div><div style='font-family:\"Avenir Next W01\", \"Avenir Next W00\", \"Avenir Next\", Avenir, \"Helvetica Neue\", Helvetica, Arial, sans-serif !important;'><font size='3'><br /></font></div><div style=''><div style=''><font size='3'><font>This layer is based on the dataset TA2019_V1_00_Clipped  retrieved from Stat NZ. It contains the </font>major released version of the annually released territorial authority boundaries as at 1 January 2019, clipped to the coastline.This clipped version contains 67 territorial authorities and has been created for map creation/cartographic purposes and does not fully represent the official full extent boundaries.</font></div><div style=''><font size='3'><br /></font></div><div style=''><span style='font-family:\"Avenir Next W01\", \"Avenir Next W00\", \"Avenir Next\", Avenir, \"Helvetica Neue\", Helvetica, Arial, sans-serif; font-size:medium;'>The official dataset can be found on</span><font size='3'> </font><a href='https://datafinder.stats.govt.nz/layer/98753-territorial-authority-2019-clipped-generalised/' target='_blank' rel='nofollow ugc noopener noreferrer'>https://datafinder.stats.govt.nz</a>.</div><div style=''><font size='3'><br /></font></div><div style=''><font size='3'><span style='font-family:\"Avenir Next W01\", \"Avenir Next W00\", \"Avenir Next\", Avenir, \"Helvetica Neue\", Helvetica, Arial, sans-serif;'>This layer contains the Territorial Authority name and code and the total area and the total land area in square kilometers. The layer is further generalised by Eagle Technology for improved performance on the web, </span><span style='font-family:\"Avenir Next W01\", \"Avenir Next W00\", \"Avenir Next\", Avenir, \"Helvetica Neue\", sans-serif;'>therefore it doesn't fully represent the official boundaries.</span><br /></font></div><div style='font-family:\"Avenir Next W01\", \"Avenir Next W00\", \"Avenir Next\", Avenir, \"Helvetica Neue\", Helvetica, Arial, sans-serif !important;'><font size='3'><br /></font></div><div style=''><div style='font-family:\"Avenir Next W01\", \"Avenir Next W00\", \"Avenir Next\", Avenir, \"Helvetica Neue\", Helvetica, Arial, sans-serif !important;'><font color='#2f4f4f' size='3'>This layer is offered by Eagle Technology (Official Esri Distributor). Eagle Technology offers services that can be used in the ArcGIS platform. The Content team at Eagle Technology updates the layers on a regular basis and regularly adds new content to the Living Atlas. By using this content and combining it with other data you can create new information products quickly and easily.</font></div><div style='font-family:\"Avenir Next W01\", \"Avenir Next W00\", \"Avenir Next\", Avenir, \"Helvetica Neue\", Helvetica, Arial, sans-serif !important;'><font color='#2f4f4f' size='3'><br /></font></div><div style='font-family:\"Avenir Next W01\", \"Avenir Next W00\", \"Avenir Next\", Avenir, \"Helvetica Neue\", Helvetica, Arial, sans-serif !important;'><font size='3'><font color='#2f4f4f' style=''>If you have any questions or comments about the content, please let us now  at </font><a href='mailto:livingatlas@eagle.co.nz.' style='color:rgb(0, 121, 193); text-decoration-line:none;' target='_blank' rel='nofollow ugc noopener noreferrer'>livingatlas@eagle.co.nz</a></font></div></div></div></div>",
			"keyword": [
				"eaglegis",
				"mature support",
				"retiring",
				"deprecated"
			],
			"issued": "2018-12-21T13:02:02.000Z",
			"modified": "2018-12-21T13:06:58.873Z",
			"publisher": {
				"name": "Eagle Technology Group Ltd"
			},
			"contactPoint": {
				"@type": "vcard:Contact",
				"fn": "eaglegis",
				"hasEmail": "mailto:ts@eaglegis.co.nz"
			},
			"accessLevel": "public",
			"spatial": "166.2620,-47.2230,-177.6196,-33.7735",
			"license": "https://creativecommons.org/licenses/by/4.0",
			"distribution": [
				{
					"@type": "dcat:Distribution",
					"title": "ArcGIS Hub Dataset",
					"format": "Web Page",
					"mediaType": "text/html",
					"accessURL": "https://www.pacificgeoportal.com/datasets/eaglegis::nz-territorial-authority-boundaries-2019-mature-support"
				},
				{
					"@type": "dcat:Distribution",
					"title": "ArcGIS GeoService",
					"format": "ArcGIS GeoServices REST API",
					"mediaType": "application/json",
					"accessURL": "https://services.arcgis.com/XTtANUDT8Va4DLwI/arcgis/rest/services/Territorial_Authority_2019_Clipped_generalised/FeatureServer/0"
				},
				{
					"@type": "dcat:Distribution",
					"title": "CSV",
					"format": "CSV",
					"mediaType": "text/csv",
					"accessURL": "https://www.pacificgeoportal.com/api/download/v1/items/2168cc8b019d4c7684d5923a4380a3c3/csv?layers=0"
				},
				{
					"@type": "dcat:Distribution",
					"title": "Shapefile",
					"format": "ZIP",
					"mediaType": "application/zip",
					"accessURL": "https://www.pacificgeoportal.com/api/download/v1/items/2168cc8b019d4c7684d5923a4380a3c3/shapefile?layers=0"
				},
				{
					"@type": "dcat:Distribution",
					"title": "GeoJSON",
					"format": "GeoJSON",
					"mediaType": "application/vnd.geo+json",
					"accessURL": "https://www.pacificgeoportal.com/api/download/v1/items/2168cc8b019d4c7684d5923a4380a3c3/geojson?layers=0"
				},
				{
					"@type": "dcat:Distribution",
					"title": "KML",
					"format": "KML",
					"mediaType": "application/vnd.google-earth.kml+xml",
					"accessURL": "https://www.pacificgeoportal.com/api/download/v1/items/2168cc8b019d4c7684d5923a4380a3c3/kml?layers=0"
				}
			],
			"theme": [
				"geospatial"
			]
		},
		{
			"@type": "dcat:Dataset",
			"identifier": "https://www.arcgis.com/home/item.html?id=869cb845310049f78005564c888654fe&sublayer=0",
			"landingPage": "https://www.pacificgeoportal.com/datasets/eaglegis::nz-territorial-authority-boundaries-2018-mature-support",
			"title": "NZ Territorial Authority boundaries 2018 (Mature Support)",
			"description": "<font size='3'><b><span style='color:firebrick;'>Important Note:</span></b><b> This item is in<span style='color:#C00000;'> mature support</span> as of January 2024 and will retire in January 2025.</b><b><span> When you need the most recent boundary layer please use <a href='https://www.arcgis.com/home/item.html?id=288ba59f0f5b424e80082ce668de7a8d' rel='nofollow ugc'>this item</a>. When you need the boundaries for a specific year, please use <a href='https://www.arcgis.com/home/item.html?id=a4d7a13b12f84376b9c5b2ec25f50ad2' rel='nofollow ugc'>this item</a> and set a filter on the required year.</span></b><br /><br /></font><div><font size='3' style='font-family: \"Avenir Next W01\", \"Avenir Next W00\", \"Avenir Next\", Avenir, \"Helvetica Neue\", Helvetica, Arial, sans-serif !important;'>Topicality: 01-01-2018</font><div style='font-family: \"Avenir Next W01\", \"Avenir Next W00\", \"Avenir Next\", Avenir, \"Helvetica Neue\", Helvetica, Arial, sans-serif !important;'><font size='3'><br /></font></div><div style=''><div style=''><font size='3'><font face='Avenir Next W01, Avenir Next W00, Avenir Next, Avenir, Helvetica Neue, Helvetica, Arial, sans-serif'>This layer is based on the dataset TA2018_V1_00_Clipped  retrieved from Stat NZ. It contains the </font>major released version of the annually released territorial authority boundaries as at 1 January 2018, clipped to the coastline.This clipped version contains 67 territorial authorities and has been created for map creation/cartographic purposes and does not fully represent the official full extent boundaries.</font></div><div style=''><font face='Avenir Next W01, Avenir Next W00, Avenir Next, Avenir, Helvetica Neue, Helvetica, Arial, sans-serif' size='3'><br /></font></div><div style=''><span style='font-family: \"Avenir Next W01\", \"Avenir Next W00\", \"Avenir Next\", Avenir, \"Helvetica Neue\", Helvetica, Arial, sans-serif; font-size: medium;'>The official dataset can be found on</span><font face='Avenir Next W01, Avenir Next W00, Avenir Next, Avenir, Helvetica Neue, Helvetica, Arial, sans-serif' size='3'> </font><a href='https://datafinder.stats.govt.nz/layer/92215-territorial-authority-2018-clipped-generalised/' target='_blank' rel='nofollow ugc noopener noreferrer'>https://datafinder.stats.govt.nz</a>.</div><div style=''><font face='Avenir Next W01, Avenir Next W00, Avenir Next, Avenir, Helvetica Neue, Helvetica, Arial, sans-serif' size='3'><br /></font></div><div style=''><font size='3'><span style='font-family: \"Avenir Next W01\", \"Avenir Next W00\", \"Avenir Next\", Avenir, \"Helvetica Neue\", Helvetica, Arial, sans-serif;'>This layer contains the Territorial Authority name and code and the total area and the total land area in square kilometers. The layer is further generalised by Eagle Technology for improved performance on the web, </span><span style='font-family: \"Avenir Next W01\", \"Avenir Next W00\", \"Avenir Next\", Avenir, \"Helvetica Neue\", sans-serif;'>therefore it doesn't fully represent the official boundaries.</span><br /></font></div><div style='font-family: \"Avenir Next W01\", \"Avenir Next W00\", \"Avenir Next\", Avenir, \"Helvetica Neue\", Helvetica, Arial, sans-serif !important;'><font size='3'><br /></font></div><div style=''><div style='font-family: \"Avenir Next W01\", \"Avenir Next W00\", \"Avenir Next\", Avenir, \"Helvetica Neue\", Helvetica, Arial, sans-serif !important;'><font color='#2f4f4f' size='3'>This layer is offered by Eagle Technology (Official Esri Distributor). Eagle Technology offers services that can be used in the ArcGIS platform. The Content team at Eagle Technology updates the layers on a regular basis and regularly adds new content to the Living Atlas. By using this content and combining it with other data you can create new information products quickly and easily.</font></div><div style='font-family: \"Avenir Next W01\", \"Avenir Next W00\", \"Avenir Next\", Avenir, \"Helvetica Neue\", Helvetica, Arial, sans-serif !important;'><font color='#2f4f4f' size='3'><br /></font></div><div style='font-family: \"Avenir Next W01\", \"Avenir Next W00\", \"Avenir Next\", Avenir, \"Helvetica Neue\", Helvetica, Arial, sans-serif !important;'><font size='3'><font color='#2f4f4f' style=''>If you have any questions or comments about the content, please let us now  at </font><a href='mailto:livingatlas@eagle.co.nz.' style='color: rgb(0, 121, 193); text-decoration-line: none;' target='_blank' rel='nofollow ugc noopener noreferrer'>livingatlas@eagle.co.nz</a></font></div></div></div></div>",
			"keyword": [
				"eaglegis",
				"mature support",
				"retiring",
				"deprecated"
			],
			"issued": "2018-09-03T00:58:37.000Z",
			"modified": "2018-09-04T04:46:15.491Z",
			"publisher": {
				"name": "Eagle Technology Group Ltd"
			},
			"contactPoint": {
				"@type": "vcard:Contact",
				"fn": "eaglegis",
				"hasEmail": "mailto:ts@eaglegis.co.nz"
			},
			"accessLevel": "public",
			"spatial": "166.2620,-47.2230,-177.6196,-33.7735",
			"license": "https://creativecommons.org/licenses/by/4.0",
			"distribution": [
				{
					"@type": "dcat:Distribution",
					"title": "ArcGIS Hub Dataset",
					"format": "Web Page",
					"mediaType": "text/html",
					"accessURL": "https://www.pacificgeoportal.com/datasets/eaglegis::nz-territorial-authority-boundaries-2018-mature-support"
				},
				{
					"@type": "dcat:Distribution",
					"title": "ArcGIS GeoService",
					"format": "ArcGIS GeoServices REST API",
					"mediaType": "application/json",
					"accessURL": "https://services.arcgis.com/XTtANUDT8Va4DLwI/arcgis/rest/services/NZ_Territorial_Authority_boundaries_2018_generalised/FeatureServer/0"
				},
				{
					"@type": "dcat:Distribution",
					"title": "CSV",
					"format": "CSV",
					"mediaType": "text/csv",
					"accessURL": "https://www.pacificgeoportal.com/api/download/v1/items/869cb845310049f78005564c888654fe/csv?layers=0"
				},
				{
					"@type": "dcat:Distribution",
					"title": "Shapefile",
					"format": "ZIP",
					"mediaType": "application/zip",
					"accessURL": "https://www.pacificgeoportal.com/api/download/v1/items/869cb845310049f78005564c888654fe/shapefile?layers=0"
				},
				{
					"@type": "dcat:Distribution",
					"title": "GeoJSON",
					"format": "GeoJSON",
					"mediaType": "application/vnd.geo+json",
					"accessURL": "https://www.pacificgeoportal.com/api/download/v1/items/869cb845310049f78005564c888654fe/geojson?layers=0"
				},
				{
					"@type": "dcat:Distribution",
					"title": "KML",
					"format": "KML",
					"mediaType": "application/vnd.google-earth.kml+xml",
					"accessURL": "https://www.pacificgeoportal.com/api/download/v1/items/869cb845310049f78005564c888654fe/kml?layers=0"
				},
				{
					"@type": "dcat:Distribution",
					"title": "File Geodatabase",
					"format": "ZIP",
					"mediaType": "application/zip",
					"accessURL": "https://www.pacificgeoportal.com/api/download/v1/items/869cb845310049f78005564c888654fe/filegdb?layers=0"
				},
				{
					"@type": "dcat:Distribution",
					"title": "Feature Collection",
					"format": "TXT",
					"mediaType": "text/plain",
					"accessURL": "https://www.pacificgeoportal.com/api/download/v1/items/869cb845310049f78005564c888654fe/featureCollection?layers=0"
				},
				{
					"@type": "dcat:Distribution",
					"title": "Excel",
					"format": "XLSX",
					"mediaType": "application/vnd.ms-excel",
					"accessURL": "https://www.pacificgeoportal.com/api/download/v1/items/869cb845310049f78005564c888654fe/excel?layers=0"
				},
				{
					"@type": "dcat:Distribution",
					"title": "GeoPackage",
					"format": "GPKG",
					"mediaType": "application/geopackage+sqlite3",
					"accessURL": "https://www.pacificgeoportal.com/api/download/v1/items/869cb845310049f78005564c888654fe/geoPackage?layers=0"
				},
				{
					"@type": "dcat:Distribution",
					"title": "SQLite Geodatabase",
					"format": "GDB",
					"mediaType": "application/geopackage+sqlite3",
					"accessURL": "https://www.pacificgeoportal.com/api/download/v1/items/869cb845310049f78005564c888654fe/sqlite?layers=0"
				}
			],
			"theme": [
				"geospatial"
			]
		},
		{
			"@type": "dcat:Dataset",
			"identifier": "https://www.arcgis.com/home/item.html?id=5f9fc891976c4873b0016c795b05cef2&sublayer=0",
			"landingPage": "https://www.pacificgeoportal.com/datasets/eaglegis::nz-wards-2021-mature-support",
			"title": "NZ Wards - 2021 (Mature Support)",
			"description": "<font size='3'><b><span style='color:firebrick;'>Important Note:</span></b><b> This item is in<span style='color:#C00000;'> mature support</span> as of January 2024 and will retire in January 2025.</b><b><span> When you need the most recent boundary layer please use <a href='https://www.arcgis.com/home/item.html?id=030d32f649c94ab8959215951c03fbca' rel='nofollow ugc'>this item</a>. When you need the boundaries for a specific year, please use <a href='https://www.arcgis.com/home/item.html?id=31b3469be5c4445c93f11e7ec02d78a6' rel='nofollow ugc'>this item</a> and set a filter on the required year.</span></b><br /><br /></font><div><font size='3' style='font-family: \"Avenir Next W01\", \"Avenir Next W00\", \"Avenir Next\", Avenir, \"Helvetica Neue\", Helvetica, Arial, sans-serif !important;'>Topicality: 01-01-2021</font><div style=''><font face='Avenir Next W01, Avenir Next W00, Avenir Next, Avenir, Helvetica Neue, Helvetica, Arial, sans-serif' style='font-family: \"Avenir Next W01\", \"Avenir Next W00\", \"Avenir Next\", Avenir, \"Helvetica Neue\", Helvetica, Arial, sans-serif !important; font-size: 17px;'><span style='font-size: 17px;'>Projection: New Zealand Transverse Mercator (NZTM)</span><br /></font><div style='font-family: \"Avenir Next W01\", \"Avenir Next W00\", \"Avenir Next\", Avenir, \"Helvetica Neue\", Helvetica, Arial, sans-serif !important; font-size: 17px;'><font size='3'><br /></font></div><div style='font-family: \"Avenir Next W01\", \"Avenir Next W00\", \"Avenir Next\", Avenir, \"Helvetica Neue\", Helvetica, Arial, sans-serif !important; font-size: 17px;'><font size='3'><font face='Avenir Next W01, Avenir Next W00, Avenir Next, Avenir, Helvetica Neue, Helvetica, Arial, sans-serif'>This layer is based on the </font>definitive set of </font><span style='font-family: \"Avenir Next W01\", \"Avenir Next W00\", \"Avenir Next\", Avenir, \"Helvetica Neue\", sans-serif;'>Ward boundaries</span><font size='3'> for 2021 as defined by the regional councils and Local Government Commission but maintained by Stats NZ (the custodian).</font></div><div style='font-family: \"Avenir Next W01\", \"Avenir Next W00\", \"Avenir Next\", Avenir, \"Helvetica Neue\", Helvetica, Arial, sans-serif !important; font-size: 17px;'><font size='3'><br /></font></div><div style=''><font size='3' style=''><font face='Avenir Next W01, Avenir Next W00, Avenir Next, Avenir, Helvetica Neue, Helvetica, Arial, sans-serif'>Wards were originally set up within any territorial authority with a population of at least 20,000. Wards are defined under the Local Electoral Act 2001 and result from dividing a territorial authority for electoral purposes. The ward system was designed to allow for the recognition of communities within a territorial authority and to increase community involvement in the local government system.</font><br /></font></div><div style=''><font size='3' style=''><font face='Avenir Next W01, Avenir Next W00, Avenir Next, Avenir, Helvetica Neue, Helvetica, Arial, sans-serif'><br /></font></font></div><div style=''><font size='3' style=''><font face='Avenir Next W01, Avenir Next W00, Avenir Next, Avenir, Helvetica Neue, Helvetica, Arial, sans-serif'>Territorial authorities can now choose whether they would like to maintain electoral wards. As a result, the number of wards has steadily decreased since they were first created in 1989. Ward boundaries are reviewed in the year before the three-yearly local government elections.</font><br /></font></div><div style=''><font size='3' style=''><font face='Avenir Next W01, Avenir Next W00, Avenir Next, Avenir, Helvetica Neue, Helvetica, Arial, sans-serif'><br /></font></font></div><div style=''><font size='3' style='font-family: \"Avenir Next W01\", \"Avenir Next W00\", \"Avenir Next\", Avenir, \"Helvetica Neue\", Helvetica, Arial, sans-serif;'>This layer shows the data for 2021. If you would like to use the layer that gets updated yearly with the latest boundary data, you can use <a href='https://www.arcgis.com/home/item.html?id=030d32f649c94ab8959215951c03fbca' target='_blank' rel='nofollow ugc noopener noreferrer'>this item</a>.<br /><br />All the boundary layers can be found <a href='https://www.arcgis.com/home/group.html?id=8047736c3e43467aa62241976851eff9' target='_blank' rel='nofollow ugc noopener noreferrer'>here</a>.<br /><br />All the boundary layers that are updated yearly can be found <a href='https://www.arcgis.com/home/group.html?id=b22e4f0012a8426dac21cd3d02f25c67' target='_blank' rel='nofollow ugc noopener noreferrer'>here</a>.<br /><br />The official dataset can be found on<font face='Avenir Next W01, Avenir Next W00, Avenir Next, Avenir, Helvetica Neue, Helvetica, Arial, sans-serif'> </font></font><a href='https://datafinder.stats.govt.nz/data/category/annual-boundaries/2021/' target='_blank' rel='nofollow ugc noopener noreferrer'>https://datafinder.stats.govt.nz.</a><br /></div><div style=''><div style='font-family: \"Avenir Next W01\", \"Avenir Next W00\", \"Avenir Next\", Avenir, \"Helvetica Neue\", Helvetica, Arial, sans-serif; font-size: 17px;'><br /></div></div><div style=''><div style='font-family: \"Avenir Next W01\", \"Avenir Next W00\", \"Avenir Next\", Avenir, \"Helvetica Neue\", Helvetica, Arial, sans-serif; font-size: 17px;'><div><font size='3'>This layer contains the following attributes (see data tab):</font></div><div><ul><li><font size='3'>Ward code</font></li><li><font size='3'>Ward name</font></li><li><font size='3'>Total area in square kilometers</font></li><li><font size='3'>Total land area in square kilometers.</font></li></ul><div><font size='3'>The layer is further generalised by Eagle Technology for improved performance on the web, <span style='font-family: \"Avenir Next W01\", \"Avenir Next W00\", \"Avenir Next\", Avenir, \"Helvetica Neue\", sans-serif;'>therefore it doesn't fully represent the official boundaries.</span><br /></font></div></div></div><div style='font-family: \"Avenir Next W01\", \"Avenir Next W00\", \"Avenir Next\", Avenir, \"Helvetica Neue\", Helvetica, Arial, sans-serif; font-size: 17px;'><font size='3'><br /></font></div><div style='font-family: \"Avenir Next W01\", \"Avenir Next W00\", \"Avenir Next\", Avenir, \"Helvetica Neue\", Helvetica, Arial, sans-serif; font-size: 17px;'><div><font color='#2f4f4f' size='3'>This layer is offered by Eagle Technology (Official Esri Distributor). Eagle Technology offers services that can be used in the ArcGIS platform. The Content team at Eagle Technology updates the layers on a regular basis and regularly adds new content to the Living Atlas. By using this content and combining it with other data you can create new information products quickly and easily.</font></div><div><font color='#2f4f4f' size='3'><br /></font></div><div><font size='3'><font color='#2f4f4f'>If you have any questions or comments about the content, please let us now  at </font><a href='mailto:livingatlas@eagle.co.nz' style='color: rgb(0, 121, 193); text-decoration-line: none;' target='_blank' rel='nofollow ugc noopener noreferrer'>livingatlas@eagle.co.nz</a></font></div></div></div></div></div>",
			"keyword": [
				"eaglegis",
				"mature support",
				"retiring",
				"deprecated"
			],
			"issued": "2021-02-04T02:15:52.000Z",
			"modified": "2021-02-15T23:01:42.194Z",
			"publisher": {
				"name": "Eagle Technology Group Ltd"
			},
			"contactPoint": {
				"@type": "vcard:Contact",
				"fn": "eaglegis",
				"hasEmail": "mailto:ts@eaglegis.co.nz"
			},
			"accessLevel": "public",
			"spatial": "166.2620,-47.2230,-177.6189,-33.7734",
			"license": "https://creativecommons.org/licenses/by/4.0",
			"distribution": [
				{
					"@type": "dcat:Distribution",
					"title": "ArcGIS Hub Dataset",
					"format": "Web Page",
					"mediaType": "text/html",
					"accessURL": "https://www.pacificgeoportal.com/datasets/eaglegis::nz-wards-2021-mature-support"
				},
				{
					"@type": "dcat:Distribution",
					"title": "ArcGIS GeoService",
					"format": "ArcGIS GeoServices REST API",
					"mediaType": "application/json",
					"accessURL": "https://services.arcgis.com/XTtANUDT8Va4DLwI/arcgis/rest/services/nz_wards_2021/FeatureServer/0"
				},
				{
					"@type": "dcat:Distribution",
					"title": "CSV",
					"format": "CSV",
					"mediaType": "text/csv",
					"accessURL": "https://www.pacificgeoportal.com/api/download/v1/items/5f9fc891976c4873b0016c795b05cef2/csv?layers=0"
				},
				{
					"@type": "dcat:Distribution",
					"title": "Shapefile",
					"format": "ZIP",
					"mediaType": "application/zip",
					"accessURL": "https://www.pacificgeoportal.com/api/download/v1/items/5f9fc891976c4873b0016c795b05cef2/shapefile?layers=0"
				},
				{
					"@type": "dcat:Distribution",
					"title": "GeoJSON",
					"format": "GeoJSON",
					"mediaType": "application/vnd.geo+json",
					"accessURL": "https://www.pacificgeoportal.com/api/download/v1/items/5f9fc891976c4873b0016c795b05cef2/geojson?layers=0"
				},
				{
					"@type": "dcat:Distribution",
					"title": "KML",
					"format": "KML",
					"mediaType": "application/vnd.google-earth.kml+xml",
					"accessURL": "https://www.pacificgeoportal.com/api/download/v1/items/5f9fc891976c4873b0016c795b05cef2/kml?layers=0"
				},
				{
					"@type": "dcat:Distribution",
					"title": "File Geodatabase",
					"format": "ZIP",
					"mediaType": "application/zip",
					"accessURL": "https://www.pacificgeoportal.com/api/download/v1/items/5f9fc891976c4873b0016c795b05cef2/filegdb?layers=0"
				},
				{
					"@type": "dcat:Distribution",
					"title": "Feature Collection",
					"format": "TXT",
					"mediaType": "text/plain",
					"accessURL": "https://www.pacificgeoportal.com/api/download/v1/items/5f9fc891976c4873b0016c795b05cef2/featureCollection?layers=0"
				},
				{
					"@type": "dcat:Distribution",
					"title": "Excel",
					"format": "XLSX",
					"mediaType": "application/vnd.ms-excel",
					"accessURL": "https://www.pacificgeoportal.com/api/download/v1/items/5f9fc891976c4873b0016c795b05cef2/excel?layers=0"
				},
				{
					"@type": "dcat:Distribution",
					"title": "GeoPackage",
					"format": "GPKG",
					"mediaType": "application/geopackage+sqlite3",
					"accessURL": "https://www.pacificgeoportal.com/api/download/v1/items/5f9fc891976c4873b0016c795b05cef2/geoPackage?layers=0"
				},
				{
					"@type": "dcat:Distribution",
					"title": "SQLite Geodatabase",
					"format": "GDB",
					"mediaType": "application/geopackage+sqlite3",
					"accessURL": "https://www.pacificgeoportal.com/api/download/v1/items/5f9fc891976c4873b0016c795b05cef2/sqlite?layers=0"
				}
			],
			"theme": [
				"geospatial"
			]
		},
		{
			"@type": "dcat:Dataset",
			"identifier": "https://www.arcgis.com/home/item.html?id=f6eddd7f8e6a476c9828d259f5339111&sublayer=0",
			"landingPage": "https://www.pacificgeoportal.com/datasets/eaglegis::nz-ward-boundaries-2020-mature-support",
			"title": "NZ Ward boundaries 2020 (Mature Support)",
			"description": "<font size='3'><b><span style='color:firebrick;'>Important Note:</span></b><b> This item is in<span style='color:#C00000;'> mature support</span> as of January 2024 and will retire in January 2025.</b><b><span> When you need the most recent boundary layer please use <a href='https://www.arcgis.com/home/item.html?id=030d32f649c94ab8959215951c03fbca' rel='nofollow ugc'>this item</a>. When you need the boundaries for a specific year, please use <a href='https://www.arcgis.com/home/item.html?id=31b3469be5c4445c93f11e7ec02d78a6' rel='nofollow ugc'>this item</a> and set a filter on the required year.</span></b><br /><br /></font><div><font size='3' style='font-family: \"Avenir Next W01\", \"Avenir Next W00\", \"Avenir Next\", Avenir, \"Helvetica Neue\", Helvetica, Arial, sans-serif !important;'>Topicality: 01-01-2020</font><div style=''><font face='Avenir Next W01, Avenir Next W00, Avenir Next, Avenir, Helvetica Neue, Helvetica, Arial, sans-serif' style='font-family: \"Avenir Next W01\", \"Avenir Next W00\", \"Avenir Next\", Avenir, \"Helvetica Neue\", Helvetica, Arial, sans-serif !important; font-size: 17px;'><span style='font-size: 17px;'>Projection: New Zealand Transverse Mercator (NZTM)</span><br /></font><div style='font-family: \"Avenir Next W01\", \"Avenir Next W00\", \"Avenir Next\", Avenir, \"Helvetica Neue\", Helvetica, Arial, sans-serif !important; font-size: 17px;'><font size='3'><br /></font></div><div style='font-family: \"Avenir Next W01\", \"Avenir Next W00\", \"Avenir Next\", Avenir, \"Helvetica Neue\", Helvetica, Arial, sans-serif !important; font-size: 17px;'><font size='3'><font face='Avenir Next W01, Avenir Next W00, Avenir Next, Avenir, Helvetica Neue, Helvetica, Arial, sans-serif'>This layer is based on the </font>definitive set of </font><span style='font-family: \"Avenir Next W01\", \"Avenir Next W00\", \"Avenir Next\", Avenir, \"Helvetica Neue\", sans-serif;'>Ward boundaries</span><font size='3'> for 2020 as defined by the regional councils and Local Government Commission but maintained by Stats NZ (the custodian).</font></div><div style='font-family: \"Avenir Next W01\", \"Avenir Next W00\", \"Avenir Next\", Avenir, \"Helvetica Neue\", Helvetica, Arial, sans-serif !important; font-size: 17px;'><font size='3'><br /></font></div><div style=''><font size='3' style=''><font face='Avenir Next W01, Avenir Next W00, Avenir Next, Avenir, Helvetica Neue, Helvetica, Arial, sans-serif'>Wards were originally set up within any territorial authority with a population of at least 20,000. Wards are defined under the Local Electoral Act 2001 and result from dividing a territorial authority for electoral purposes. The ward system was designed to allow for the recognition of communities within a territorial authority and to increase community involvement in the local government system.</font><br /></font></div><div style=''><font size='3' style=''><font face='Avenir Next W01, Avenir Next W00, Avenir Next, Avenir, Helvetica Neue, Helvetica, Arial, sans-serif'><br /></font></font></div><div style=''><font size='3' style=''><font face='Avenir Next W01, Avenir Next W00, Avenir Next, Avenir, Helvetica Neue, Helvetica, Arial, sans-serif'>Territorial authorities can now choose whether they would like to maintain electoral wards. As a result, the number of wards has steadily decreased since they were first created in 1989. Ward boundaries are reviewed in the year before the three-yearly local government elections.</font><br /></font></div><div style=''><font size='3' style=''><font face='Avenir Next W01, Avenir Next W00, Avenir Next, Avenir, Helvetica Neue, Helvetica, Arial, sans-serif'><br /></font></font></div><div style=''><font size='3' style='font-family: \"Avenir Next W01\", \"Avenir Next W00\", \"Avenir Next\", Avenir, \"Helvetica Neue\", Helvetica, Arial, sans-serif;'>The official dataset can be found on<font face='Avenir Next W01, Avenir Next W00, Avenir Next, Avenir, Helvetica Neue, Helvetica, Arial, sans-serif'> </font></font><a href='https://datafinder.stats.govt.nz/data/category/annual-boundaries/2020/' target='_blank' rel='nofollow ugc noopener noreferrer'>https://datafinder.stats.govt.nz.</a><br /></div><div style=''><div style='font-family: \"Avenir Next W01\", \"Avenir Next W00\", \"Avenir Next\", Avenir, \"Helvetica Neue\", Helvetica, Arial, sans-serif; font-size: 17px;'><br /></div></div><div style=''><div style='font-family: \"Avenir Next W01\", \"Avenir Next W00\", \"Avenir Next\", Avenir, \"Helvetica Neue\", Helvetica, Arial, sans-serif; font-size: 17px;'><div><font size='3'>This layer contains the following attributes (see data tab):</font></div><div><ul><li><font size='3'>Ward code</font></li><li><font size='3'>Ward name</font></li><li><font size='3'>Total area in square kilometers</font></li><li><font size='3'>Total land area in square kilometers.</font></li></ul><div><font size='3'>The layer is further generalised by Eagle Technology for improved performance on the web, <span style='font-family: \"Avenir Next W01\", \"Avenir Next W00\", \"Avenir Next\", Avenir, \"Helvetica Neue\", sans-serif;'>therefore it doesn't fully represent the official boundaries.</span><br /></font></div></div></div><div style='font-family: \"Avenir Next W01\", \"Avenir Next W00\", \"Avenir Next\", Avenir, \"Helvetica Neue\", Helvetica, Arial, sans-serif; font-size: 17px;'><font size='3'><br /></font></div><div style='font-family: \"Avenir Next W01\", \"Avenir Next W00\", \"Avenir Next\", Avenir, \"Helvetica Neue\", Helvetica, Arial, sans-serif; font-size: 17px;'><div><font color='#2f4f4f' size='3'>This layer is offered by Eagle Technology (Official Esri Distributor). Eagle Technology offers services that can be used in the ArcGIS platform. The Content team at Eagle Technology updates the layers on a regular basis and regularly adds new content to the Living Atlas. By using this content and combining it with other data you can create new information products quickly and easily.</font></div><div><font color='#2f4f4f' size='3'><br /></font></div><div><font size='3'><font color='#2f4f4f'>If you have any questions or comments about the content, please let us now  at </font><a href='mailto:livingatlas@eagle.co.nz' style='color: rgb(0, 121, 193); text-decoration-line: none;' target='_blank' rel='nofollow ugc noopener noreferrer'>livingatlas@eagle.co.nz</a></font></div></div></div></div></div>",
			"keyword": [
				"eaglegis",
				"mature support",
				"retiring",
				"deprecated"
			],
			"issued": "2020-01-11T10:15:39.000Z",
			"modified": "2021-02-10T03:36:12.392Z",
			"publisher": {
				"name": "Eagle Technology Group Ltd"
			},
			"contactPoint": {
				"@type": "vcard:Contact",
				"fn": "eaglegis",
				"hasEmail": "mailto:ts@eaglegis.co.nz"
			},
			"accessLevel": "public",
			"spatial": "166.2620,-47.2230,-177.6190,-33.7734",
			"license": "https://creativecommons.org/licenses/by/4.0",
			"distribution": [
				{
					"@type": "dcat:Distribution",
					"title": "ArcGIS Hub Dataset",
					"format": "Web Page",
					"mediaType": "text/html",
					"accessURL": "https://www.pacificgeoportal.com/datasets/eaglegis::nz-ward-boundaries-2020-mature-support"
				},
				{
					"@type": "dcat:Distribution",
					"title": "ArcGIS GeoService",
					"format": "ArcGIS GeoServices REST API",
					"mediaType": "application/json",
					"accessURL": "https://services.arcgis.com/XTtANUDT8Va4DLwI/arcgis/rest/services/Ward_2020_Clipped_generalised/FeatureServer/0"
				},
				{
					"@type": "dcat:Distribution",
					"title": "CSV",
					"format": "CSV",
					"mediaType": "text/csv",
					"accessURL": "https://www.pacificgeoportal.com/api/download/v1/items/f6eddd7f8e6a476c9828d259f5339111/csv?layers=0"
				},
				{
					"@type": "dcat:Distribution",
					"title": "Shapefile",
					"format": "ZIP",
					"mediaType": "application/zip",
					"accessURL": "https://www.pacificgeoportal.com/api/download/v1/items/f6eddd7f8e6a476c9828d259f5339111/shapefile?layers=0"
				},
				{
					"@type": "dcat:Distribution",
					"title": "GeoJSON",
					"format": "GeoJSON",
					"mediaType": "application/vnd.geo+json",
					"accessURL": "https://www.pacificgeoportal.com/api/download/v1/items/f6eddd7f8e6a476c9828d259f5339111/geojson?layers=0"
				},
				{
					"@type": "dcat:Distribution",
					"title": "KML",
					"format": "KML",
					"mediaType": "application/vnd.google-earth.kml+xml",
					"accessURL": "https://www.pacificgeoportal.com/api/download/v1/items/f6eddd7f8e6a476c9828d259f5339111/kml?layers=0"
				},
				{
					"@type": "dcat:Distribution",
					"title": "File Geodatabase",
					"format": "ZIP",
					"mediaType": "application/zip",
					"accessURL": "https://www.pacificgeoportal.com/api/download/v1/items/f6eddd7f8e6a476c9828d259f5339111/filegdb?layers=0"
				},
				{
					"@type": "dcat:Distribution",
					"title": "Feature Collection",
					"format": "TXT",
					"mediaType": "text/plain",
					"accessURL": "https://www.pacificgeoportal.com/api/download/v1/items/f6eddd7f8e6a476c9828d259f5339111/featureCollection?layers=0"
				},
				{
					"@type": "dcat:Distribution",
					"title": "Excel",
					"format": "XLSX",
					"mediaType": "application/vnd.ms-excel",
					"accessURL": "https://www.pacificgeoportal.com/api/download/v1/items/f6eddd7f8e6a476c9828d259f5339111/excel?layers=0"
				},
				{
					"@type": "dcat:Distribution",
					"title": "GeoPackage",
					"format": "GPKG",
					"mediaType": "application/geopackage+sqlite3",
					"accessURL": "https://www.pacificgeoportal.com/api/download/v1/items/f6eddd7f8e6a476c9828d259f5339111/geoPackage?layers=0"
				},
				{
					"@type": "dcat:Distribution",
					"title": "SQLite Geodatabase",
					"format": "GDB",
					"mediaType": "application/geopackage+sqlite3",
					"accessURL": "https://www.pacificgeoportal.com/api/download/v1/items/f6eddd7f8e6a476c9828d259f5339111/sqlite?layers=0"
				}
			],
			"theme": [
				"geospatial"
			]
		},
		{
			"@type": "dcat:Dataset",
			"identifier": "https://www.arcgis.com/home/item.html?id=3a4b6cc2c1c74fbb8ddbe25df28e410c&sublayer=1",
			"landingPage": "https://www.pacificgeoportal.com/datasets/NIWA::watersheds",
			"title": "Watersheds",
			"description": "<div><span style='font-weight:bold;'>REC2 (River Environment Classification, v2.<span>5</span><span>) - June 2019 [Hosted Feature Layer]<br /></span></span></div><div><span style='font-weight:bold;'>This service depicts rivers as lines and catchments as polygons</span><br /><span style='font-weight:bold;'><span></span></span></div><div><span style='font-weight:bold;'><span></span></span></div><div style='text-align:Left; font-size:12pt;'><div><p><span>    The River Environment Classification (REC) is a database of catchment spatial attributes, summarised for every segment in New Zealand's network of rivers. The attributes were compiled for the purposes of river classification, while the river network description has been used to underpin models.    Typically, models (e.g. CLUES and TopNet) would use the dendritic (branched) linkages of REC river segments to perform their calculations. Since its release and use over the last decade, some errors in the location and connectivity of these linkages have been identified. The current revision corrects those errors, and updates a number of spatial attributes with the latest data.    REC2 provides a re-cut framework of rivers for modelling and classification.</span></p><p><span> It is built on a newer version of the 30m digital elevation model, in which the original 20m contours were supplemented with, for example, more spot elevation data and a better coastline contour. Boundary errors were minimised by processing contiguous areas (such as the whole of the North Island) together, which wasn't possible when it was originally created.</span></p><p><span>Major updates include the revision of catchment land use information, by overlaying with the land cover database (LCDB3, current as at 2008), and the update of river and rainfall statistics with data from 1960-2006.    The river network and associated attributes have been assembled within an ArcGIS geodatabase. Topological connectivity has been established to allow upstream and downstream tracing within the network. <br /></span></p><p><span>REC2 can be downloaded or streamed and used directly in ArcMap.</span><a href='https://niwa.maps.arcgis.com/home/item.html?id=5a07a0b45d504e4db4f79753663430b6' target='_blank' rel='nofollow ugc noopener noreferrer'><span style='color:rgb(76, 76, 76);'> (</span>A file geodatabase version for ArcGIS of REC2 can be downloaded as a \nzip file and used directly for analyses in ArcMap from here</a>)</p><p><span></span></p><p>This layer is using Esri's ArcGIS Online Optimizations for fast rendering.<br /></p><p><br /><span><span style='font-weight:bold;'>This is REC2 (Version 5) , June 2019</span> - a publicly available dataset from NIWA Taihoro Nukurangi.</span></p><p><span>NIWA acknowledges funding from the MBIE SSIF towards the preparation of REC v2.</span><span>5</span></p><p><span><span style='font-weight:bold;'>Coordinate Reference System: NZTM (New Zealand Transverse Mercator, EPSG: 2193)</span><br /></span></p><p>Geometric Representation of Rivers: Lines</p><p><span style='font-weight:bold;'>Extent (Bounding Box): </span><br /><span>\n \n \n \n  <span style='font-style:italic;'>Top(Latitude)</span>\n  -33.9534<span style='font-style:italic;'>Bottom(Latitude)</span>\n  -47.4867\n \n \n  <span style='font-style:italic;'>Left (Longitude)</span>\n  166.2634\n \n \n  <span style='font-style:italic;'>Right (Longitude)</span>\n  178.9733\n \n</span></p><p><span><br /></span></p><p><span>\n \n \n \n \n  <span style='text-decoration:underline;'>Riverlines table</span>\n  Attributes\n  associated directly with network:\n \n \n  <br />\n  <br /></span><span>\n \n \n  <span style='font-weight:bold;'>Field\n  Type\n  Description </span></span><br /><span></span></p><p><span> \n \n  <span style='font-weight:bold;'>Catarea\n<span style='font-style:italic;'>  </span></span><span style='font-style:italic;'>Real\n  </span>Watershed area in m2 <br /></span></p><p><span><span style='font-weight:bold;'>CUM_Area<span> </span>\n<span style='font-style:italic;'>  </span></span><span style='font-style:italic;'>Real\n  </span>Area upstream of a reach (and\n  including this reach area) in m2. <br /></span></p><p><span><span style='font-weight:bold;'>Nzsegment\n<span style='font-style:italic;'>  </span></span><span style='font-style:italic;'>Integer\n  </span>Reach identifier to be used with\n  REC2 (supercedes nzreach in REC1).\n \n \n  <br /></span></p><p><span><span style='font-weight:bold;'>Lengthdown\n<span style='font-style:italic;'>  </span></span><span style='font-style:italic;'>Real\n  </span>The distance to coast from any\n  reach to its outlet reach, where the river drains (m). <br /></span></p><p><span><span style='font-weight:bold;'>Headwater\n<span style='font-style:italic;'>  </span></span><span style='font-style:italic;'>Integer\n  </span>Number (0) denoting whether a\n  stream is a “source” (headwater) stream. Non-zero for non-headwater streams. <br /></span></p><p><span> \n \n  <span style='font-weight:bold;'>Hydseq\n<span style='font-style:italic;'>  </span></span><span style='font-style:italic;'>Integer\n  </span>A unique number denoting the\n  hydrological processing order of a river segment relative to others in the\n  network.</span></p><p><span>\n \n \n  <span style='font-weight:bold;'>StreamOrder\n<span style='font-style:italic;'>  </span></span><span style='font-style:italic;'>Integer\n  </span>A number describing the Strahler\n  order a reach in a network of reaches. <br /></span></p><p><span> \n \n  <span style='font-weight:bold;'>euclid_dist\n<span style='font-style:italic;'>  </span></span><span style='font-style:italic;'>Real\n  </span>The straight line distance of a\n  reach from the reach “inlet” to its “outlet”. <br /></span></p><p><span><span style='font-weight:bold;'>upElev\n<span style='font-style:italic;'>  </span></span><span style='font-style:italic;'>Real\n  </span>Height (asl) of the upstream end\n  of a reach section in a watershed (m). <br /></span></p><p><span><span style='font-weight:bold;'>downElev\n<span style='font-style:italic;'>  </span></span><span style='font-style:italic;'>Real\n  </span>Height (asl) of the downstream\n  end of a reach section in a watershed (m). <br /></span></p><p><span> \n \n  <span style='font-weight:bold;'>upcoordX\n<span style='font-style:italic;'>  </span></span><span style='font-style:italic;'>Real\n  </span>Easting of the upstream end of a\n  river segment in m (NZTM2000). <br /></span></p><p><span><span style='font-weight:bold;'>upcoordY\n<span style='font-style:italic;'>  </span></span><span style='font-style:italic;'>Real\n  </span>Northing of the upstream end of\n  a river segment in m (NZTM2000). <br /></span></p><p><span><span style='font-weight:bold;'>downcoordX\n<span style='font-style:italic;'>  </span></span><span style='font-style:italic;'>Real\n  </span>Easting of the downstream end of\n  a river segment in m (NZTM2000). <br /></span></p><p><span> \n \n  <span style='font-weight:bold;'>downcoordY\n<span style='font-style:italic;'>  </span></span><span style='font-style:italic;'>Real\n  </span>Northing of the downstream end\n  of a river segment in m (NZTM2000). <br /></span></p><p><span><span style='font-weight:bold;'>sinuosity\n<span style='font-style:italic;'>  </span></span><span style='font-style:italic;'>Real\n  </span>Actual distance divided by the\n  straight line distance giving the degree of curvature of the stream <br /></span></p><p><span><span style='font-weight:bold;'>nzreach_re\n<span style='font-style:italic;'>  </span></span><span style='font-style:italic;'>Integer\n  </span>The REC1 identifiying number for\n  <font>the corresponding\\closest reach </font><font>from\n  REC1 (can be used to retrieve the REC management classes)</font> <br /></span></p><p><span><span style='font-weight:bold;'>headw_dist\n<span style='font-style:italic;'>  </span></span><span style='font-style:italic;'>Integer\n  </span>Distance of the furthermost\n  “source” or headwater reach from any reach (m). <br /></span></p><p><span><span style='font-weight:bold;'>Shape_leng\n<span style='font-style:italic;'>  </span></span><span style='font-style:italic;'>Real\n  </span>The length of the reach (vector)\n  as calculated by ArcGIS.</span></p><p><br /><span>\n  <span style='font-weight:bold;'>Segslpmean</span>\n  <span style='font-style:italic;'>Real</span>\n  Mean segment slope along length\n  of reach.\n   \n</span></p><p><span><span style='font-weight:bold;'>LID\n<span style='font-style:italic;'>  </span></span><span style='font-style:italic;'>Integer\n  </span>Lake Identifier number(LID) of\n  overlapping lake.\n \n \n   \n   \n    <br /></span></p><p><span><span style='font-weight:bold;'>Reachtype\n<span style='font-style:italic;'>  </span></span><span style='font-style:italic;'>Integer\n  </span>A value of 2 is assigned if the\n  segment is an outlet to the lake, otherwise 0 or null. <br /></span></p><p><span><span style='font-weight:bold;'>nextdownid\n<span style='font-style:italic;'>  </span></span><span style='font-style:italic;'>integer\n  </span>segment number of the most\n  downstream reach\n \n</span></p></div></div>_________________________________________________________________________________________________________________<br /><br /><font size='3'><b>Item Page Created:</b> 2019-06-13 00:29  <br /><b>Item Page Last Modified:</b> 2025-04-05 16:27<br />Owner: NIWA_OpenData</font><br /><br /><b><font size='5'>River Lines</font></b><br /><b>No data edit dates available</b><br /><b>Fields:</b> OBJECTID_1,HydroID,NextDownID,CATAREA,CUM_AREA,nzsegment,Enabled,LENGTHDOWN,Headwater,Hydseq,StreamOrde,euclid_dis,upElev,downElev,upcoordX,downcoordX,downcoordY,upcoordY,sinuosity,nzreach_re,headw_dist,segslpmean,LID,reachtype,FROM_NODE,TO_NODE,Shape_Leng,FLOWDIR<br /><br /><b><font size='5'>Watersheds</font></b><br /><b>No data edit dates available</b><br /><b>Fields:</b> OBJECTID_1,HydroID,nzsegment,nzreach_rec1,Area<br />",
			"keyword": [
				"REC",
				"REC2",
				"NIWA",
				"hydro",
				"model",
				"river",
				"watershed",
				"environment",
				"classification",
				"NZ",
				"New Zealand",
				"River",
				"freshwater",
				"autometadata",
				"CC_Land_and_Water",
				"Proj_OPENDATA"
			],
			"issued": "2019-06-13T00:29:53.000Z",
			"modified": "2022-11-02T06:25:02.728Z",
			"publisher": {
				"name": "NIWA"
			},
			"contactPoint": {
				"@type": "vcard:Contact",
				"fn": "NIWA_OpenData",
				"hasEmail": "mailto:enquiries@niwa.co.nz"
			},
			"accessLevel": "public",
			"spatial": "166.2634,-47.2188,178.3141,-34.2808",
			"license": "https://creativecommons.org/licenses/by-nc/4.0",
			"distribution": [
				{
					"@type": "dcat:Distribution",
					"title": "ArcGIS Hub Dataset",
					"format": "Web Page",
					"mediaType": "text/html",
					"accessURL": "https://www.pacificgeoportal.com/datasets/NIWA::watersheds"
				},
				{
					"@type": "dcat:Distribution",
					"title": "ArcGIS GeoService",
					"format": "ArcGIS GeoServices REST API",
					"mediaType": "application/json",
					"accessURL": "https://services3.arcgis.com/fp1tibNcN9mbExhG/arcgis/rest/services/REC2_Layers/FeatureServer/1"
				},
				{
					"@type": "dcat:Distribution",
					"title": "CSV",
					"format": "CSV",
					"mediaType": "text/csv",
					"accessURL": "https://www.pacificgeoportal.com/api/download/v1/items/3a4b6cc2c1c74fbb8ddbe25df28e410c/csv?layers=1"
				},
				{
					"@type": "dcat:Distribution",
					"title": "Shapefile",
					"format": "ZIP",
					"mediaType": "application/zip",
					"accessURL": "https://www.pacificgeoportal.com/api/download/v1/items/3a4b6cc2c1c74fbb8ddbe25df28e410c/shapefile?layers=1"
				},
				{
					"@type": "dcat:Distribution",
					"title": "GeoJSON",
					"format": "GeoJSON",
					"mediaType": "application/vnd.geo+json",
					"accessURL": "https://www.pacificgeoportal.com/api/download/v1/items/3a4b6cc2c1c74fbb8ddbe25df28e410c/geojson?layers=1"
				},
				{
					"@type": "dcat:Distribution",
					"title": "KML",
					"format": "KML",
					"mediaType": "application/vnd.google-earth.kml+xml",
					"accessURL": "https://www.pacificgeoportal.com/api/download/v1/items/3a4b6cc2c1c74fbb8ddbe25df28e410c/kml?layers=1"
				},
				{
					"@type": "dcat:Distribution",
					"title": "File Geodatabase",
					"format": "ZIP",
					"mediaType": "application/zip",
					"accessURL": "https://www.pacificgeoportal.com/api/download/v1/items/3a4b6cc2c1c74fbb8ddbe25df28e410c/filegdb?layers=1"
				},
				{
					"@type": "dcat:Distribution",
					"title": "Feature Collection",
					"format": "TXT",
					"mediaType": "text/plain",
					"accessURL": "https://www.pacificgeoportal.com/api/download/v1/items/3a4b6cc2c1c74fbb8ddbe25df28e410c/featureCollection?layers=1"
				},
				{
					"@type": "dcat:Distribution",
					"title": "Excel",
					"format": "XLSX",
					"mediaType": "application/vnd.ms-excel",
					"accessURL": "https://www.pacificgeoportal.com/api/download/v1/items/3a4b6cc2c1c74fbb8ddbe25df28e410c/excel?layers=1"
				},
				{
					"@type": "dcat:Distribution",
					"title": "GeoPackage",
					"format": "GPKG",
					"mediaType": "application/geopackage+sqlite3",
					"accessURL": "https://www.pacificgeoportal.com/api/download/v1/items/3a4b6cc2c1c74fbb8ddbe25df28e410c/geoPackage?layers=1"
				},
				{
					"@type": "dcat:Distribution",
					"title": "SQLite Geodatabase",
					"format": "GDB",
					"mediaType": "application/geopackage+sqlite3",
					"accessURL": "https://www.pacificgeoportal.com/api/download/v1/items/3a4b6cc2c1c74fbb8ddbe25df28e410c/sqlite?layers=1"
				}
			],
			"theme": [
				"geospatial"
			]
		},
		{
			"@type": "dcat:Dataset",
			"identifier": "https://www.arcgis.com/home/item.html?id=28d23ad94c2a4846b7634f4cdbba178f",
			"landingPage": "https://www.pacificgeoportal.com/maps/NIWA::nz-large-river-catchments",
			"title": "NZ Large River Catchments",
			"description": "<div style='text-align:Left;'><div><p style='text-align:center;'><span style='background-color:#ffff00;'>Earth Sciences New Zealand can no longer maintain this feature layer nor the underlying hosting infrastructure and a <strong>hosted vector tile layer has been created as a replacement</strong> for simple visualisation tasks. To access the vector tile layer, you can click “Open in Map Viewer” (Add this layer as the basemap </span><a target='_blank' href='https://niwa.maps.arcgis.com/home/item.html?id=f5e9b17de4794f1d8d2d8cd7b7375b54' rel='nofollow ugc noopener noreferrer'><span style='background-color:#ffff00;'>https://niwa.maps.arcgis.com/home/item.html?id=f5e9b17de4794f1d8d2d8cd7b7375b54</span></a><span style='background-color:#ffff00;'>. You can then add another basemap and move this one to the top - then you have the basemap of your choice plus the catchment information layers)&nbsp;</span></p><p style='text-align:center;'>[THIS PAGE IS ONLY KEPT FOR REFERENCE]</p><p>&nbsp;</p><p><span>This layer is based on the New Zealand River Environment Classification REC2 V5 and describes the larger catchments of New Zealand that are a Strahler order five and greater. It also has the associated names that belong to the parent sea draining catchment. It was originally derived by dissolving local Strahler Order 1 watersheds.</span></p><p><br />&nbsp;</p><div><strong>REC2 (River Environment Classification, v2.</strong><span><strong>5) - June 2019 [Hosted Feature Layer]</strong></span><br />&nbsp;</div><div><strong>This service depicts rivers as lines and catchments as polygons</strong><br />&nbsp;</div><div>&nbsp;</div><p><span>The River Environment Classification (REC) is a database of catchment spatial attributes, summarised for every segment in New Zealand's network of rivers. The attributes were compiled for the purposes of river classification, while the river network description has been used to underpin models. Typically, models (e.g. CLUES and TopNet) would use the dendritic (branched) linkages of REC river segments to perform their calculations. Since its release and use over the last decade, some errors in the location and connectivity of these linkages have been identified. The current revision corrects those errors, and updates a number of spatial attributes with the latest data. REC2 provides a re-cut framework of rivers for modelling and classification.</span></p><p><span>It is built on a newer version of the 30m digital elevation model, in which the original 20m contours were supplemented with, for example, more spot elevation data and a better coastline contour. Boundary errors were minimised by processing contiguous areas (such as the whole of the North Island) together, which wasn't possible when it was originally created.</span></p><p><span>Major updates include the revision of catchment land use information, by overlaying with the land cover database (LCDB3, current as at 2008), and the update of river and rainfall statistics with data from 1960-2006. The river network and associated attributes have been assembled within an ArcGIS geodatabase. Topological connectivity has been established to allow upstream and downstream tracing within the network.&nbsp;</span><br />&nbsp;</p><p><span>REC2 can be downloaded or streamed and used directly in ArcMap.</span><a target='_blank' href='https://niwa.maps.arcgis.com/home/item.html?id=5a07a0b45d504e4db4f79753663430b6' rel='nofollow ugc noopener noreferrer'><span style='color:rgb(76,76,76);'> (</span>A file geodatabase version for ArcGIS of REC2 can be downloaded as a zip file and used directly for analyses in ArcMap from here</a>)</p><p><br /><span><strong>This is REC2 (Version 5) , June 2019</strong> - a publicly available dataset from NIWA Taihoro Nukurangi.</span></p><p><span>NIWA acknowledges funding from the MBIE SSIF towards the preparation of REC v2.5</span></p><p><span><strong>Coordinate Reference System: NZTM (New Zealand Transverse Mercator, EPSG: 2193)</strong></span><br />&nbsp;</p><p>Geometric Representation of Rivers: Lines</p><p><strong>Extent (Bounding Box):&nbsp;</strong><br /><i><span>Top(Latitude)</span></i><span> -33.9534</span><i><span>Bottom(Latitude)</span></i><span> -47.4867 </span><i><span>Left (Longitude)</span></i><span> 166.2634 </span><i><span>Right (Longitude)</span></i><span> 178.9733</span></p><p><br /><br />&nbsp;</p><p>&nbsp;</p></div></div><p>_________________________________________________________________________________________________________________<br /><br /><span style='font-size:medium;'><strong>Item Page Created:</strong> 2021-10-05 03:41&nbsp;</span><br /><span style='font-size:medium;'><strong>Item Page Last Modified:</strong> 2025-08-21 09:14</span><br /><span style='font-size:medium;'>Owner: NIWA_OpenData</span><br /><br /><span style='font-size:x-large;'><strong>DN2_large_odr6_catch</strong></span><br /><strong>No data edit dates available</strong><br /><strong>Fields:</strong> Shape,FID_1,diss,FID_2,HydroID,CATAREA,CUM_AREA,nzsegment,StreamOrde,upElev,downElev,upcoordX_1,downcoor_1,downcoor_2,upcoordY_1,RivName,Distance,ord_diff,Distance_1,Shape_Length,Shape_Area<br />&nbsp;</p>",
			"keyword": [
				"NZ",
				"River",
				"Catchment",
				"Large",
				"New Zealand",
				"autometadata",
				"freshwater",
				"Proj_OPENDATA",
				"CC_Land_and_Water"
			],
			"issued": "2021-10-05T03:41:30.000Z",
			"modified": "2026-10-13T02:28:56.000Z",
			"publisher": {
				"name": "National Institute of Water and Atmospheric Research"
			},
			"contactPoint": {
				"@type": "vcard:Contact",
				"fn": "NIWA_OpenData",
				"hasEmail": "mailto:enquiries@niwa.co.nz"
			},
			"accessLevel": "public",
			"spatial": "166.2634,-47.4867,178.9733,-33.9534",
			"license": "https://creativecommons.org/licenses/by-nc/4.0",
			"distribution": [
				{
					"@type": "dcat:Distribution",
					"title": "ArcGIS Hub Dataset",
					"format": "Web Page",
					"mediaType": "text/html",
					"accessURL": "https://www.pacificgeoportal.com/maps/NIWA::nz-large-river-catchments"
				},
				{
					"@type": "dcat:Distribution",
					"title": "ArcGIS GeoService",
					"format": "ArcGIS GeoServices REST API",
					"mediaType": "application/json",
					"accessURL": "https://tiles.arcgis.com/tiles/fp1tibNcN9mbExhG/arcgis/rest/services/Large_Catchments_NZBasemap_vector_webMerc_/VectorTileServer"
				}
			],
			"theme": [
				"geospatial"
			]
		},
		{
			"@type": "dcat:Dataset",
			"identifier": "https://www.arcgis.com/home/item.html?id=425b75839f204640b0ea1abcae101f62&sublayer=0",
			"landingPage": "https://www.pacificgeoportal.com/datasets/NIWA::nz-regional-river-names-rec2-layer",
			"title": "NZ Regional River Names (REC2) Layer",
			"description": "<div style='text-align:Left;'><div><div><div>\n            </div><div>\n          <div>\n            \n          </div>\n        </div>\n\n        <div>\n          <div>\n    <div>\n        </div></div></div>\n            \n            <p>\n              <span style='text-decoration:underline;'><span>NZ Regional River Names (based on REC2) Layer can be used to display rivers in New Zealand and their names.</span></span></p><p style='margin:0 0 11 0;'><span><span>The\n River Environment Classification (REC) is a database of catchment \nspatial attributes, summarised for every segment in New Zealand's \nnetwork of rivers. The attributes were compiled for the purposes of \nriver classification. Examples where the REC can be used include, \ncatchment rainfall calculations, catchment river flows, flood \nforecasting, land use and catchment associations.</span></span></p><p style='margin:0 0 6 0;'><span style='font-weight:bold;'>Creation</span></p><ol><li><span>The REC was originally created using  hydrological networking tools and a digital elevation model.</span></li><li><span>River names have been attached where available.<br /></span></li></ol></div></div></div><div><span style='font-weight:bold;'>REC2 (River Environment Classification, v2.<span>5</span><span>) - June 2019 [Hosted Feature Layer]<br /></span></span></div><div><span style='font-weight:bold;'>This service depicts rivers as lines</span></div><div><br /></div><div><span>The River Environment Classification (REC) is a database of \ncatchment spatial attributes, summarised for every segment in New \nZealand's network of rivers. The attributes were compiled for the \npurposes of river classification, while the river network description \nhas been used to underpin models.    Typically, models (e.g. CLUES and \nTopNet) would use the dendritic (branched) linkages of REC river \nsegments to perform their calculations. Since its release and use over \nthe last decade, some errors in the location and connectivity of these \nlinkages have been identified. The current revision corrects those \nerrors, and updates a number of spatial attributes with the latest data.\n    REC2 provides a re-cut framework of rivers for modelling and \nclassification.</span></div><p><span> It is built on a newer version of \nthe 30m digital elevation model, in which the original 20m contours were\n supplemented with, for example, more spot elevation data and a better \ncoastline contour. Boundary errors were minimised by processing \ncontiguous areas (such as the whole of the North Island) together, which\n wasn't possible when it was originally created.</span></p><p><span>Major\n updates include the revision of catchment land use information, by \noverlaying with the land cover database (LCDB3, current as at 2008), and\n the update of river and rainfall statistics with data from 1960-2006.  \n  The river network and associated attributes have been assembled within\n an ArcGIS geodatabase. Topological connectivity has been established to\n allow upstream and downstream tracing within the network. <br /></span></p><p><span>REC2 can be downloaded or streamed and used directly in ArcMap.</span><a href='https://niwa.maps.arcgis.com/home/item.html?id=5a07a0b45d504e4db4f79753663430b6' target='_blank' rel='nofollow ugc noopener noreferrer'><span style='color:rgb(76, 76, 76);'> (</span>A file geodatabase version for ArcGIS of REC2 can be downloaded as a \nzip file and used directly for analyses in ArcMap from here</a>)</p><p><span><br /></span></p><p><br /><span><span style='font-weight:bold;'>This is based on REC2 (Version 5) , June 2019</span> - a publicly available dataset from NIWA Taihoro Nukurangi.</span></p><p><span>NIWA acknowledges funding from the MBIE SSIF towards the preparation of REC v2.</span><span>5</span></p><p><span><span style='font-weight:bold;'>Coordinate Reference System: NZTM (New Zealand Transverse Mercator, EPSG: 2193)</span><br /></span></p><p>Geometric Representation of Rivers: Lines</p><p><span style='font-weight:bold;'>Extent (Bounding Box): </span><br /><span>\n \n \n \n  <span style='font-style:italic;'>Top(Latitude)</span>\n  -33.9534<span style='font-style:italic;'>Bottom(Latitude)</span>\n  -47.4867\n \n \n  <span style='font-style:italic;'>Left (Longitude)</span>\n  166.2634\n \n \n  <span style='font-style:italic;'>Right (Longitude)</span>\n  178.9733\n \n</span></p>_________________________________________________________________________________________________________________<br /><br /><font size='3'><b>Item Page Created:</b> 2022-01-19 03:16  <br /><b>Item Page Last Modified:</b> 2025-04-05 16:14<br />Owner: NIWA_OpenData</font><br /><br /><b><font size='5'>NZ Rivers and Names</font></b><br /><b>No data edit dates available</b><br /><b>Fields:</b> CATAREA,CUM_AREA,nzsegment,LENGTHDOWN,Headwater,StreamOrde,upElev,downElev,headw_dist,segslpmean,LID,reachtype,FROM_NODE,TO_NODE,Shape_Leng,RivName<br />",
			"keyword": [
				"River",
				"River Environment Classification",
				"REC2",
				"Regional",
				"Names",
				"NZ",
				"New Zealand",
				"autometadata",
				"CC_Weather_Climate_Hazards",
				"Proj_OPENDATA"
			],
			"issued": "2022-01-19T03:16:47.000Z",
			"modified": "2022-11-02T06:27:48.334Z",
			"publisher": {
				"name": "NIWA"
			},
			"contactPoint": {
				"@type": "vcard:Contact",
				"fn": "NIWA_OpenData",
				"hasEmail": "mailto:enquiries@niwa.co.nz"
			},
			"accessLevel": "public",
			"spatial": "166.2638,-47.2168,178.3115,-34.2856",
			"license": "https://creativecommons.org/licenses/by-nc/4.0",
			"distribution": [
				{
					"@type": "dcat:Distribution",
					"title": "ArcGIS Hub Dataset",
					"format": "Web Page",
					"mediaType": "text/html",
					"accessURL": "https://www.pacificgeoportal.com/datasets/NIWA::nz-regional-river-names-rec2-layer"
				},
				{
					"@type": "dcat:Distribution",
					"title": "ArcGIS GeoService",
					"format": "ArcGIS GeoServices REST API",
					"mediaType": "application/json",
					"accessURL": "https://services3.arcgis.com/fp1tibNcN9mbExhG/arcgis/rest/services/NZ_Rivers_and_Names_WFL1/FeatureServer/0"
				},
				{
					"@type": "dcat:Distribution",
					"title": "CSV",
					"format": "CSV",
					"mediaType": "text/csv",
					"accessURL": "https://www.pacificgeoportal.com/api/download/v1/items/425b75839f204640b0ea1abcae101f62/csv?layers=0"
				},
				{
					"@type": "dcat:Distribution",
					"title": "Shapefile",
					"format": "ZIP",
					"mediaType": "application/zip",
					"accessURL": "https://www.pacificgeoportal.com/api/download/v1/items/425b75839f204640b0ea1abcae101f62/shapefile?layers=0"
				},
				{
					"@type": "dcat:Distribution",
					"title": "GeoJSON",
					"format": "GeoJSON",
					"mediaType": "application/vnd.geo+json",
					"accessURL": "https://www.pacificgeoportal.com/api/download/v1/items/425b75839f204640b0ea1abcae101f62/geojson?layers=0"
				},
				{
					"@type": "dcat:Distribution",
					"title": "KML",
					"format": "KML",
					"mediaType": "application/vnd.google-earth.kml+xml",
					"accessURL": "https://www.pacificgeoportal.com/api/download/v1/items/425b75839f204640b0ea1abcae101f62/kml?layers=0"
				}
			],
			"theme": [
				"geospatial"
			]
		},
		{
			"@type": "dcat:Dataset",
			"identifier": "https://www.arcgis.com/home/item.html?id=9210aae85722443682a6c0adca14ff90&sublayer=0",
			"landingPage": "https://www.pacificgeoportal.com/datasets/NIWA::nz-local-river-names-rec2-layer",
			"title": "NZ Local River Names (REC2) Layer",
			"description": "<div style='text-align:Left;'><div><div><div>\n            </div><div>\n          <div>\n            \n          </div>\n        </div>\n\n        <div>\n          <div>\n    <div>\n        </div></div></div>\n            \n            <p>\n              <span style='text-decoration:underline;'><span>NZ Local River Names (based on REC2) Layer can be used to display New Zealand rivers and their names.</span></span></p><p style='margin:0 0 11 0;'><span><span>The\n River Environment Classification (REC) is a database of catchment \nspatial attributes, summarised for every segment in New Zealand's \nnetwork of rivers. The attributes were compiled for the purposes of \nriver classification. Examples where the REC can be used include, \ncatchment rainfall calculations, catchment river flows, flood \nforecasting, land use and catchment associations.</span></span></p><p style='margin:0 0 6 0;'><span style='font-weight:bold;'>Creation</span></p><ol><li><span>The REC was originally created using  hydrological networking tools and a digital elevation model.</span></li><li><span>River names have been attached where available.</span></li></ol></div></div></div><div><span style='font-weight:bold;'>REC2 (River Environment Classification, v2.<span>5</span><span>) - June 2019 [Hosted Feature Layer]<br /></span></span></div><div><span style='font-weight:bold;'>This service depicts rivers as lines</span><span><br /></span></div><div><span><br /></span></div><div><span>The River Environment Classification (REC) is a database of \ncatchment spatial attributes, summarised for every segment in New \nZealand's network of rivers. The attributes were compiled for the \npurposes of river classification, while the river network description \nhas been used to underpin models.    Typically, models (e.g. CLUES and \nTopNet) would use the dendritic (branched) linkages of REC river \nsegments to perform their calculations. Since its release and use over \nthe last decade, some errors in the location and connectivity of these \nlinkages have been identified. The current revision corrects those \nerrors, and updates a number of spatial attributes with the latest data.\n    REC2 provides a re-cut framework of rivers for modelling and \nclassification.</span></div><p><span> It is built on a newer version of \nthe 30m digital elevation model, in which the original 20m contours were\n supplemented with, for example, more spot elevation data and a better \ncoastline contour. Boundary errors were minimised by processing \ncontiguous areas (such as the whole of the North Island) together, which\n wasn't possible when it was originally created.</span></p><p><span>Major\n updates include the revision of catchment land use information, by \noverlaying with the land cover database (LCDB3, current as at 2008), and\n the update of river and rainfall statistics with data from 1960-2006.  \n  The river network and associated attributes have been assembled within\n an ArcGIS geodatabase. Topological connectivity has been established to\n allow upstream and downstream tracing within the network. <br /></span></p><p><span>REC2 can be downloaded or streamed and used directly in ArcMap.</span><a href='https://niwa.maps.arcgis.com/home/item.html?id=5a07a0b45d504e4db4f79753663430b6' target='_blank' rel='nofollow ugc noopener noreferrer'><span style='color:rgb(76, 76, 76);'> (</span>A file geodatabase version for ArcGIS of REC2 can be downloaded as a \nzip file and used directly for analyses in ArcMap from here</a>)</p><p><br /><span><span style='font-weight:bold;'>This is based on REC2 (Version 5) , June 2019</span> - a publicly available dataset from NIWA Taihoro Nukurangi.</span></p><p><span>NIWA acknowledges funding from the MBIE SSIF towards the preparation of REC v2.</span><span>5</span></p><p><span><span style='font-weight:bold;'>Coordinate Reference System: NZTM (New Zealand Transverse Mercator, EPSG: 2193)</span><br /></span></p><p>Geometric Representation of Rivers: Lines</p><p><span style='font-weight:bold;'>Extent (Bounding Box): </span><br /><span>\n \n \n \n  <span style='font-style:italic;'>Top(Latitude)</span>\n  -33.9534<span style='font-style:italic;'>Bottom(Latitude)</span>\n  -47.4867\n \n \n  <span style='font-style:italic;'>Left (Longitude)</span>\n  166.2634\n \n \n  <span style='font-style:italic;'>Right (Longitude)</span>\n  178.9733\n \n</span></p>_________________________________________________________________________________________________________________<br /><br /><font size='3'><b>Item Page Created:</b> 2022-01-19 03:43  <br /><b>Item Page Last Modified:</b> 2025-04-05 18:03<br />Owner: NIWA_OpenData</font><br /><br /><b><font size='5'>NZ Rivers and Names</font></b><br /><b>No data edit dates available</b><br /><b>Fields:</b> CATAREA,CUM_AREA,nzsegment,LENGTHDOWN,Headwater,StreamOrde,upElev,downElev,headw_dist,segslpmean,LID,reachtype,FROM_NODE,TO_NODE,Shape_Leng,RivName<br />",
			"keyword": [
				"River",
				"River Environment Classification",
				"REC2",
				"Names",
				"NZ",
				"New Zealand",
				"autometadata",
				"freshwater",
				"CC_Weather_Climate_Hazards",
				"Proj_OPENDATA"
			],
			"issued": "2022-01-19T03:43:25.000Z",
			"modified": "2022-11-02T06:27:48.334Z",
			"publisher": {
				"name": "National Institute of Water and Atmospheric Research"
			},
			"contactPoint": {
				"@type": "vcard:Contact",
				"fn": "NIWA_OpenData",
				"hasEmail": "mailto:enquiries@niwa.co.nz"
			},
			"accessLevel": "public",
			"spatial": "166.2638,-47.2168,178.3115,-34.2856",
			"license": "https://creativecommons.org/licenses/by-nc/4.0",
			"distribution": [
				{
					"@type": "dcat:Distribution",
					"title": "ArcGIS Hub Dataset",
					"format": "Web Page",
					"mediaType": "text/html",
					"accessURL": "https://www.pacificgeoportal.com/datasets/NIWA::nz-local-river-names-rec2-layer"
				},
				{
					"@type": "dcat:Distribution",
					"title": "ArcGIS GeoService",
					"format": "ArcGIS GeoServices REST API",
					"mediaType": "application/json",
					"accessURL": "https://services3.arcgis.com/fp1tibNcN9mbExhG/arcgis/rest/services/NZ_Rivers_and_Names_WFL1/FeatureServer/0"
				},
				{
					"@type": "dcat:Distribution",
					"title": "CSV",
					"format": "CSV",
					"mediaType": "text/csv",
					"accessURL": "https://www.pacificgeoportal.com/api/download/v1/items/9210aae85722443682a6c0adca14ff90/csv?layers=0"
				},
				{
					"@type": "dcat:Distribution",
					"title": "Shapefile",
					"format": "ZIP",
					"mediaType": "application/zip",
					"accessURL": "https://www.pacificgeoportal.com/api/download/v1/items/9210aae85722443682a6c0adca14ff90/shapefile?layers=0"
				},
				{
					"@type": "dcat:Distribution",
					"title": "GeoJSON",
					"format": "GeoJSON",
					"mediaType": "application/vnd.geo+json",
					"accessURL": "https://www.pacificgeoportal.com/api/download/v1/items/9210aae85722443682a6c0adca14ff90/geojson?layers=0"
				},
				{
					"@type": "dcat:Distribution",
					"title": "KML",
					"format": "KML",
					"mediaType": "application/vnd.google-earth.kml+xml",
					"accessURL": "https://www.pacificgeoportal.com/api/download/v1/items/9210aae85722443682a6c0adca14ff90/kml?layers=0"
				}
			],
			"theme": [
				"geospatial"
			]
		},
		{
			"@type": "dcat:Dataset",
			"identifier": "https://www.arcgis.com/home/item.html?id=9104c9b367f14e76ac48af3725d68dac",
			"landingPage": "https://www.pacificgeoportal.com/maps/NIWA::new-zealand-marine-environment-classification-feature-layers",
			"title": "New Zealand Marine Environment Classification Feature Layers",
			"description": "<div><span>The \nMarine Environment Classification (MEC), a GIS-based environmental \nclassification of the marine environment of the New Zealand region, is \nan ecosystem-based spatial framework designed for marine management \npurposes. <br /></span></div><div><span><br /></span></div><div><span>Developed by NIWA with support from the Ministry for the Environment \n(MfE), Department of Conservation and Ministry of Fisheries, and with \ncontributions from several other stakeholders, the MEC provides a \nspatial framework for inventories of marine resources, environmental \neffects assessments, policy development and design of protected area \nnetworks. <br /></span></div><div><br /><p><span style='text-decoration:underline;'>Two levels of spatial resolution are available within the MEC</span>. A \nbroad scale classification covers the entire EEZ at a nominal spatial \nresolution of 1 km, whereas the finer scale classification of the \nHauraki Gulf region has a nominal spatial resolution of 200 m.</p>\n<p>Several spatially-explicit data layers describing the physical \nenvironment define the MEC. A physically-based classification was chosen\n because data on these physical variables were available or could be \nmodelled, and because the pattern of the physical environment is a \nreasonable surrogate for biological pattern, particularly at larger \nspatial scales. Classes within the classification were defined using \nmultivariate clustering methods. These produce hierarchal \nclassifications that enable the user to delineate environmental \nvariation at different levels of detail and associated spatial scales.</p>\n<p>Large biological datasets were used to tune the classification, so \nthat the physically-based classes maximised discrimination of variation \nin biological composition at various levels of classification detail. \nThus, the MEC provides a general classification that is relevant to most\n groups of marine organisms (fishes, invertebrates and chlorophyll) and \nto ecologically important abiotic variables (e.g., temperature, \nnutrients).</p><p>An <a href='https://environment.govt.nz/publications/the-new-zealand-marine-environment-classification-overview/' target='_blank' rel='nofollow ugc noopener noreferrer'>overview report describing the MEC</a>\n is available as a PDF file (External Link). The overview report covers the conceptual \nbasis for the MEC and results of testing the classification:</p>\n<ul><li><a href='https://environment.govt.nz/publications/the-new-zealand-marine-environment-classification-overview/' target='_blank' rel='nofollow ugc noopener noreferrer'>MEC Overview</a> (PDF 2.7 MB)</li></ul><p><br /></p><span></span></div><div><span>See here for a longer description: <span><a href='https://www.niwa.co.nz/coasts-and-oceans/our-services/marine-environment-classification' target='_blank' rel='nofollow ugc noopener noreferrer'>https://www.niwa.co.nz/coasts-and-oceans/our-services/marine-environment-classification</a></span></span></div>_________________________________________________________________________________________________________________<br /><br /><font size='3'><b>Item Page Created:</b> 2018-11-12 22:47  <br /><b>Item Page Last Modified:</b> 2025-04-05 20:20<br />Owner: NIWA_OpenData</font><br /><br /><b><font size='5'>Exclusive Economic Zone (EEZ)</font></b><br /><b>No data edit dates available</b><br /><b>Fields:</b> FID,ENTITY,LAYER,ELEVATION,THICKNESS,COLOR<br /><br /><b><font size='5'>MEC EEZ 40 class</font></b><br /><b>No data edit dates available</b><br /><b>Fields:</b> FID,GRP__40,COUNT_<br /><br /><b><font size='5'>MEC EEZ 20 class</font></b><br /><b>No data edit dates available</b><br /><b>Fields:</b> FID,GRP__20,COUNT_<br /><br /><b><font size='5'>MEC EEZ 10 class</font></b><br /><b>No data edit dates available</b><br /><b>Fields:</b> FID,GRP__10,COUNT_<br /><br /><b><font size='5'>MEC EEZ 05 class</font></b><br /><b>No data edit dates available</b><br /><b>Fields:</b> FID,GRP___5,COUNT_<br /><br /><b><font size='5'>Coastline</font></b><br /><b>No data edit dates available</b><br /><b>Fields:</b> FID,NZCOAST_ID,SHAPE_LENG<br />",
			"keyword": [
				"MEC",
				"MfE",
				"NIWA",
				"Marine Environment",
				"Classification",
				"EEZ",
				"NZ",
				"ArcGIS",
				"Service Definition",
				".sd",
				"Model",
				"autometadata",
				"CC_Oceans_and_Fisheries",
				"Proj_OPENDATA"
			],
			"issued": "2018-11-12T22:47:03.000Z",
			"modified": "2026-10-13T02:26:29.000Z",
			"publisher": {
				"name": "National Institute of Water and Atmospheric Research"
			},
			"contactPoint": {
				"@type": "vcard:Contact",
				"fn": "NIWA_OpenData",
				"hasEmail": "mailto:enquiries@niwa.co.nz"
			},
			"accessLevel": "public",
			"spatial": "-180.0000,-56.3804,180.0000,-23.9509",
			"license": "https://creativecommons.org/licenses/by-nc-sa/4.0",
			"distribution": [
				{
					"@type": "dcat:Distribution",
					"title": "ArcGIS Hub Dataset",
					"format": "Web Page",
					"mediaType": "text/html",
					"accessURL": "https://www.pacificgeoportal.com/maps/NIWA::new-zealand-marine-environment-classification-feature-layers"
				},
				{
					"@type": "dcat:Distribution",
					"title": "ArcGIS GeoService",
					"format": "ArcGIS GeoServices REST API",
					"mediaType": "application/json",
					"accessURL": "https://services3.arcgis.com/fp1tibNcN9mbExhG/arcgis/rest/services/New_Zealand_Marine_Environment_Classification_WFL1/FeatureServer"
				}
			],
			"theme": [
				"geospatial"
			]
		},
		{
			"@type": "dcat:Dataset",
			"identifier": "https://www.arcgis.com/home/item.html?id=9104c9b367f14e76ac48af3725d68dac&sublayer=0",
			"landingPage": "https://www.pacificgeoportal.com/datasets/NIWA::exclusive-economic-zone-eez",
			"title": "Exclusive Economic Zone (EEZ)",
			"description": "<div><span>The \nMarine Environment Classification (MEC), a GIS-based environmental \nclassification of the marine environment of the New Zealand region, is \nan ecosystem-based spatial framework designed for marine management \npurposes. <br /></span></div><div><span><br /></span></div><div><span>Developed by NIWA with support from the Ministry for the Environment \n(MfE), Department of Conservation and Ministry of Fisheries, and with \ncontributions from several other stakeholders, the MEC provides a \nspatial framework for inventories of marine resources, environmental \neffects assessments, policy development and design of protected area \nnetworks. <br /></span></div><div><br /><p><span style='text-decoration:underline;'>Two levels of spatial resolution are available within the MEC</span>. A \nbroad scale classification covers the entire EEZ at a nominal spatial \nresolution of 1 km, whereas the finer scale classification of the \nHauraki Gulf region has a nominal spatial resolution of 200 m.</p>\n<p>Several spatially-explicit data layers describing the physical \nenvironment define the MEC. A physically-based classification was chosen\n because data on these physical variables were available or could be \nmodelled, and because the pattern of the physical environment is a \nreasonable surrogate for biological pattern, particularly at larger \nspatial scales. Classes within the classification were defined using \nmultivariate clustering methods. These produce hierarchal \nclassifications that enable the user to delineate environmental \nvariation at different levels of detail and associated spatial scales.</p>\n<p>Large biological datasets were used to tune the classification, so \nthat the physically-based classes maximised discrimination of variation \nin biological composition at various levels of classification detail. \nThus, the MEC provides a general classification that is relevant to most\n groups of marine organisms (fishes, invertebrates and chlorophyll) and \nto ecologically important abiotic variables (e.g., temperature, \nnutrients).</p><p>An <a href='https://environment.govt.nz/publications/the-new-zealand-marine-environment-classification-overview/' target='_blank' rel='nofollow ugc noopener noreferrer'>overview report describing the MEC</a>\n is available as a PDF file (External Link). The overview report covers the conceptual \nbasis for the MEC and results of testing the classification:</p>\n<ul><li><a href='https://environment.govt.nz/publications/the-new-zealand-marine-environment-classification-overview/' target='_blank' rel='nofollow ugc noopener noreferrer'>MEC Overview</a> (PDF 2.7 MB)</li></ul><p><br /></p><span></span></div><div><span>See here for a longer description: <span><a href='https://www.niwa.co.nz/coasts-and-oceans/our-services/marine-environment-classification' target='_blank' rel='nofollow ugc noopener noreferrer'>https://www.niwa.co.nz/coasts-and-oceans/our-services/marine-environment-classification</a></span></span></div>_________________________________________________________________________________________________________________<br /><br /><font size='3'><b>Item Page Created:</b> 2018-11-12 22:47  <br /><b>Item Page Last Modified:</b> 2025-04-05 20:20<br />Owner: NIWA_OpenData</font><br /><br /><b><font size='5'>Exclusive Economic Zone (EEZ)</font></b><br /><b>No data edit dates available</b><br /><b>Fields:</b> FID,ENTITY,LAYER,ELEVATION,THICKNESS,COLOR<br /><br /><b><font size='5'>MEC EEZ 40 class</font></b><br /><b>No data edit dates available</b><br /><b>Fields:</b> FID,GRP__40,COUNT_<br /><br /><b><font size='5'>MEC EEZ 20 class</font></b><br /><b>No data edit dates available</b><br /><b>Fields:</b> FID,GRP__20,COUNT_<br /><br /><b><font size='5'>MEC EEZ 10 class</font></b><br /><b>No data edit dates available</b><br /><b>Fields:</b> FID,GRP__10,COUNT_<br /><br /><b><font size='5'>MEC EEZ 05 class</font></b><br /><b>No data edit dates available</b><br /><b>Fields:</b> FID,GRP___5,COUNT_<br /><br /><b><font size='5'>Coastline</font></b><br /><b>No data edit dates available</b><br /><b>Fields:</b> FID,NZCOAST_ID,SHAPE_LENG<br />",
			"keyword": [
				"MEC",
				"MfE",
				"NIWA",
				"Marine Environment",
				"Classification",
				"EEZ",
				"NZ",
				"ArcGIS",
				"Service Definition",
				".sd",
				"Model",
				"autometadata",
				"CC_Oceans_and_Fisheries",
				"Proj_OPENDATA"
			],
			"issued": "2018-11-12T22:47:03.000Z",
			"modified": "2018-11-14T22:23:54.528Z",
			"publisher": {
				"name": "National Institute of Water and Atmospheric Research"
			},
			"contactPoint": {
				"@type": "vcard:Contact",
				"fn": "NIWA_OpenData",
				"hasEmail": "mailto:enquiries@niwa.co.nz"
			},
			"accessLevel": "public",
			"spatial": "-180.0000,-55.9727,180.0000,-25.8883",
			"license": "https://creativecommons.org/licenses/by-nc-sa/4.0",
			"distribution": [
				{
					"@type": "dcat:Distribution",
					"title": "ArcGIS Hub Dataset",
					"format": "Web Page",
					"mediaType": "text/html",
					"accessURL": "https://www.pacificgeoportal.com/datasets/NIWA::exclusive-economic-zone-eez"
				},
				{
					"@type": "dcat:Distribution",
					"title": "ArcGIS GeoService",
					"format": "ArcGIS GeoServices REST API",
					"mediaType": "application/json",
					"accessURL": "https://services3.arcgis.com/fp1tibNcN9mbExhG/arcgis/rest/services/New_Zealand_Marine_Environment_Classification_WFL1/FeatureServer/0"
				},
				{
					"@type": "dcat:Distribution",
					"title": "CSV",
					"format": "CSV",
					"mediaType": "text/csv",
					"accessURL": "https://www.pacificgeoportal.com/api/download/v1/items/9104c9b367f14e76ac48af3725d68dac/csv?layers=0"
				},
				{
					"@type": "dcat:Distribution",
					"title": "Shapefile",
					"format": "ZIP",
					"mediaType": "application/zip",
					"accessURL": "https://www.pacificgeoportal.com/api/download/v1/items/9104c9b367f14e76ac48af3725d68dac/shapefile?layers=0"
				},
				{
					"@type": "dcat:Distribution",
					"title": "GeoJSON",
					"format": "GeoJSON",
					"mediaType": "application/vnd.geo+json",
					"accessURL": "https://www.pacificgeoportal.com/api/download/v1/items/9104c9b367f14e76ac48af3725d68dac/geojson?layers=0"
				},
				{
					"@type": "dcat:Distribution",
					"title": "KML",
					"format": "KML",
					"mediaType": "application/vnd.google-earth.kml+xml",
					"accessURL": "https://www.pacificgeoportal.com/api/download/v1/items/9104c9b367f14e76ac48af3725d68dac/kml?layers=0"
				},
				{
					"@type": "dcat:Distribution",
					"title": "File Geodatabase",
					"format": "ZIP",
					"mediaType": "application/zip",
					"accessURL": "https://www.pacificgeoportal.com/api/download/v1/items/9104c9b367f14e76ac48af3725d68dac/filegdb?layers=0"
				},
				{
					"@type": "dcat:Distribution",
					"title": "Feature Collection",
					"format": "TXT",
					"mediaType": "text/plain",
					"accessURL": "https://www.pacificgeoportal.com/api/download/v1/items/9104c9b367f14e76ac48af3725d68dac/featureCollection?layers=0"
				},
				{
					"@type": "dcat:Distribution",
					"title": "Excel",
					"format": "XLSX",
					"mediaType": "application/vnd.ms-excel",
					"accessURL": "https://www.pacificgeoportal.com/api/download/v1/items/9104c9b367f14e76ac48af3725d68dac/excel?layers=0"
				},
				{
					"@type": "dcat:Distribution",
					"title": "GeoPackage",
					"format": "GPKG",
					"mediaType": "application/geopackage+sqlite3",
					"accessURL": "https://www.pacificgeoportal.com/api/download/v1/items/9104c9b367f14e76ac48af3725d68dac/geoPackage?layers=0"
				},
				{
					"@type": "dcat:Distribution",
					"title": "SQLite Geodatabase",
					"format": "GDB",
					"mediaType": "application/geopackage+sqlite3",
					"accessURL": "https://www.pacificgeoportal.com/api/download/v1/items/9104c9b367f14e76ac48af3725d68dac/sqlite?layers=0"
				}
			],
			"theme": [
				"geospatial"
			]
		},
		{
			"@type": "dcat:Dataset",
			"identifier": "https://www.arcgis.com/home/item.html?id=9104c9b367f14e76ac48af3725d68dac&sublayer=1",
			"landingPage": "https://www.pacificgeoportal.com/datasets/NIWA::mec-eez-40-class",
			"title": "MEC EEZ 40 class",
			"description": "<div><span>The \nMarine Environment Classification (MEC), a GIS-based environmental \nclassification of the marine environment of the New Zealand region, is \nan ecosystem-based spatial framework designed for marine management \npurposes. <br /></span></div><div><span><br /></span></div><div><span>Developed by NIWA with support from the Ministry for the Environment \n(MfE), Department of Conservation and Ministry of Fisheries, and with \ncontributions from several other stakeholders, the MEC provides a \nspatial framework for inventories of marine resources, environmental \neffects assessments, policy development and design of protected area \nnetworks. <br /></span></div><div><br /><p><span style='text-decoration:underline;'>Two levels of spatial resolution are available within the MEC</span>. A \nbroad scale classification covers the entire EEZ at a nominal spatial \nresolution of 1 km, whereas the finer scale classification of the \nHauraki Gulf region has a nominal spatial resolution of 200 m.</p>\n<p>Several spatially-explicit data layers describing the physical \nenvironment define the MEC. A physically-based classification was chosen\n because data on these physical variables were available or could be \nmodelled, and because the pattern of the physical environment is a \nreasonable surrogate for biological pattern, particularly at larger \nspatial scales. Classes within the classification were defined using \nmultivariate clustering methods. These produce hierarchal \nclassifications that enable the user to delineate environmental \nvariation at different levels of detail and associated spatial scales.</p>\n<p>Large biological datasets were used to tune the classification, so \nthat the physically-based classes maximised discrimination of variation \nin biological composition at various levels of classification detail. \nThus, the MEC provides a general classification that is relevant to most\n groups of marine organisms (fishes, invertebrates and chlorophyll) and \nto ecologically important abiotic variables (e.g., temperature, \nnutrients).</p><p>An <a href='https://environment.govt.nz/publications/the-new-zealand-marine-environment-classification-overview/' target='_blank' rel='nofollow ugc noopener noreferrer'>overview report describing the MEC</a>\n is available as a PDF file (External Link). The overview report covers the conceptual \nbasis for the MEC and results of testing the classification:</p>\n<ul><li><a href='https://environment.govt.nz/publications/the-new-zealand-marine-environment-classification-overview/' target='_blank' rel='nofollow ugc noopener noreferrer'>MEC Overview</a> (PDF 2.7 MB)</li></ul><p><br /></p><span></span></div><div><span>See here for a longer description: <span><a href='https://www.niwa.co.nz/coasts-and-oceans/our-services/marine-environment-classification' target='_blank' rel='nofollow ugc noopener noreferrer'>https://www.niwa.co.nz/coasts-and-oceans/our-services/marine-environment-classification</a></span></span></div>_________________________________________________________________________________________________________________<br /><br /><font size='3'><b>Item Page Created:</b> 2018-11-12 22:47  <br /><b>Item Page Last Modified:</b> 2025-04-05 20:20<br />Owner: NIWA_OpenData</font><br /><br /><b><font size='5'>Exclusive Economic Zone (EEZ)</font></b><br /><b>No data edit dates available</b><br /><b>Fields:</b> FID,ENTITY,LAYER,ELEVATION,THICKNESS,COLOR<br /><br /><b><font size='5'>MEC EEZ 40 class</font></b><br /><b>No data edit dates available</b><br /><b>Fields:</b> FID,GRP__40,COUNT_<br /><br /><b><font size='5'>MEC EEZ 20 class</font></b><br /><b>No data edit dates available</b><br /><b>Fields:</b> FID,GRP__20,COUNT_<br /><br /><b><font size='5'>MEC EEZ 10 class</font></b><br /><b>No data edit dates available</b><br /><b>Fields:</b> FID,GRP__10,COUNT_<br /><br /><b><font size='5'>MEC EEZ 05 class</font></b><br /><b>No data edit dates available</b><br /><b>Fields:</b> FID,GRP___5,COUNT_<br /><br /><b><font size='5'>Coastline</font></b><br /><b>No data edit dates available</b><br /><b>Fields:</b> FID,NZCOAST_ID,SHAPE_LENG<br />",
			"keyword": [
				"MEC",
				"MfE",
				"NIWA",
				"Marine Environment",
				"Classification",
				"EEZ",
				"NZ",
				"ArcGIS",
				"Service Definition",
				".sd",
				"Model",
				"autometadata",
				"CC_Oceans_and_Fisheries",
				"Proj_OPENDATA"
			],
			"issued": "2018-11-12T22:47:03.000Z",
			"modified": "2018-11-12T23:12:48.255Z",
			"publisher": {
				"name": "National Institute of Water and Atmospheric Research"
			},
			"contactPoint": {
				"@type": "vcard:Contact",
				"fn": "NIWA_OpenData",
				"hasEmail": "mailto:enquiries@niwa.co.nz"
			},
			"accessLevel": "public",
			"spatial": "-180.0000,-56.3804,180.0000,-23.9509",
			"license": "https://creativecommons.org/licenses/by-nc-sa/4.0",
			"distribution": [
				{
					"@type": "dcat:Distribution",
					"title": "ArcGIS Hub Dataset",
					"format": "Web Page",
					"mediaType": "text/html",
					"accessURL": "https://www.pacificgeoportal.com/datasets/NIWA::mec-eez-40-class"
				},
				{
					"@type": "dcat:Distribution",
					"title": "ArcGIS GeoService",
					"format": "ArcGIS GeoServices REST API",
					"mediaType": "application/json",
					"accessURL": "https://services3.arcgis.com/fp1tibNcN9mbExhG/arcgis/rest/services/New_Zealand_Marine_Environment_Classification_WFL1/FeatureServer/1"
				},
				{
					"@type": "dcat:Distribution",
					"title": "CSV",
					"format": "CSV",
					"mediaType": "text/csv",
					"accessURL": "https://www.pacificgeoportal.com/api/download/v1/items/9104c9b367f14e76ac48af3725d68dac/csv?layers=1"
				},
				{
					"@type": "dcat:Distribution",
					"title": "Shapefile",
					"format": "ZIP",
					"mediaType": "application/zip",
					"accessURL": "https://www.pacificgeoportal.com/api/download/v1/items/9104c9b367f14e76ac48af3725d68dac/shapefile?layers=1"
				},
				{
					"@type": "dcat:Distribution",
					"title": "GeoJSON",
					"format": "GeoJSON",
					"mediaType": "application/vnd.geo+json",
					"accessURL": "https://www.pacificgeoportal.com/api/download/v1/items/9104c9b367f14e76ac48af3725d68dac/geojson?layers=1"
				},
				{
					"@type": "dcat:Distribution",
					"title": "KML",
					"format": "KML",
					"mediaType": "application/vnd.google-earth.kml+xml",
					"accessURL": "https://www.pacificgeoportal.com/api/download/v1/items/9104c9b367f14e76ac48af3725d68dac/kml?layers=1"
				},
				{
					"@type": "dcat:Distribution",
					"title": "File Geodatabase",
					"format": "ZIP",
					"mediaType": "application/zip",
					"accessURL": "https://www.pacificgeoportal.com/api/download/v1/items/9104c9b367f14e76ac48af3725d68dac/filegdb?layers=1"
				},
				{
					"@type": "dcat:Distribution",
					"title": "Feature Collection",
					"format": "TXT",
					"mediaType": "text/plain",
					"accessURL": "https://www.pacificgeoportal.com/api/download/v1/items/9104c9b367f14e76ac48af3725d68dac/featureCollection?layers=1"
				},
				{
					"@type": "dcat:Distribution",
					"title": "Excel",
					"format": "XLSX",
					"mediaType": "application/vnd.ms-excel",
					"accessURL": "https://www.pacificgeoportal.com/api/download/v1/items/9104c9b367f14e76ac48af3725d68dac/excel?layers=1"
				},
				{
					"@type": "dcat:Distribution",
					"title": "GeoPackage",
					"format": "GPKG",
					"mediaType": "application/geopackage+sqlite3",
					"accessURL": "https://www.pacificgeoportal.com/api/download/v1/items/9104c9b367f14e76ac48af3725d68dac/geoPackage?layers=1"
				},
				{
					"@type": "dcat:Distribution",
					"title": "SQLite Geodatabase",
					"format": "GDB",
					"mediaType": "application/geopackage+sqlite3",
					"accessURL": "https://www.pacificgeoportal.com/api/download/v1/items/9104c9b367f14e76ac48af3725d68dac/sqlite?layers=1"
				}
			],
			"theme": [
				"geospatial"
			]
		},
		{
			"@type": "dcat:Dataset",
			"identifier": "https://www.arcgis.com/home/item.html?id=9104c9b367f14e76ac48af3725d68dac&sublayer=2",
			"landingPage": "https://www.pacificgeoportal.com/datasets/NIWA::mec-eez-20-class",
			"title": "MEC EEZ 20 class",
			"description": "<div><span>The \nMarine Environment Classification (MEC), a GIS-based environmental \nclassification of the marine environment of the New Zealand region, is \nan ecosystem-based spatial framework designed for marine management \npurposes. <br /></span></div><div><span><br /></span></div><div><span>Developed by NIWA with support from the Ministry for the Environment \n(MfE), Department of Conservation and Ministry of Fisheries, and with \ncontributions from several other stakeholders, the MEC provides a \nspatial framework for inventories of marine resources, environmental \neffects assessments, policy development and design of protected area \nnetworks. <br /></span></div><div><br /><p><span style='text-decoration:underline;'>Two levels of spatial resolution are available within the MEC</span>. A \nbroad scale classification covers the entire EEZ at a nominal spatial \nresolution of 1 km, whereas the finer scale classification of the \nHauraki Gulf region has a nominal spatial resolution of 200 m.</p>\n<p>Several spatially-explicit data layers describing the physical \nenvironment define the MEC. A physically-based classification was chosen\n because data on these physical variables were available or could be \nmodelled, and because the pattern of the physical environment is a \nreasonable surrogate for biological pattern, particularly at larger \nspatial scales. Classes within the classification were defined using \nmultivariate clustering methods. These produce hierarchal \nclassifications that enable the user to delineate environmental \nvariation at different levels of detail and associated spatial scales.</p>\n<p>Large biological datasets were used to tune the classification, so \nthat the physically-based classes maximised discrimination of variation \nin biological composition at various levels of classification detail. \nThus, the MEC provides a general classification that is relevant to most\n groups of marine organisms (fishes, invertebrates and chlorophyll) and \nto ecologically important abiotic variables (e.g., temperature, \nnutrients).</p><p>An <a href='https://environment.govt.nz/publications/the-new-zealand-marine-environment-classification-overview/' target='_blank' rel='nofollow ugc noopener noreferrer'>overview report describing the MEC</a>\n is available as a PDF file (External Link). The overview report covers the conceptual \nbasis for the MEC and results of testing the classification:</p>\n<ul><li><a href='https://environment.govt.nz/publications/the-new-zealand-marine-environment-classification-overview/' target='_blank' rel='nofollow ugc noopener noreferrer'>MEC Overview</a> (PDF 2.7 MB)</li></ul><p><br /></p><span></span></div><div><span>See here for a longer description: <span><a href='https://www.niwa.co.nz/coasts-and-oceans/our-services/marine-environment-classification' target='_blank' rel='nofollow ugc noopener noreferrer'>https://www.niwa.co.nz/coasts-and-oceans/our-services/marine-environment-classification</a></span></span></div>_________________________________________________________________________________________________________________<br /><br /><font size='3'><b>Item Page Created:</b> 2018-11-12 22:47  <br /><b>Item Page Last Modified:</b> 2025-04-05 20:20<br />Owner: NIWA_OpenData</font><br /><br /><b><font size='5'>Exclusive Economic Zone (EEZ)</font></b><br /><b>No data edit dates available</b><br /><b>Fields:</b> FID,ENTITY,LAYER,ELEVATION,THICKNESS,COLOR<br /><br /><b><font size='5'>MEC EEZ 40 class</font></b><br /><b>No data edit dates available</b><br /><b>Fields:</b> FID,GRP__40,COUNT_<br /><br /><b><font size='5'>MEC EEZ 20 class</font></b><br /><b>No data edit dates available</b><br /><b>Fields:</b> FID,GRP__20,COUNT_<br /><br /><b><font size='5'>MEC EEZ 10 class</font></b><br /><b>No data edit dates available</b><br /><b>Fields:</b> FID,GRP__10,COUNT_<br /><br /><b><font size='5'>MEC EEZ 05 class</font></b><br /><b>No data edit dates available</b><br /><b>Fields:</b> FID,GRP___5,COUNT_<br /><br /><b><font size='5'>Coastline</font></b><br /><b>No data edit dates available</b><br /><b>Fields:</b> FID,NZCOAST_ID,SHAPE_LENG<br />",
			"keyword": [
				"MEC",
				"MfE",
				"NIWA",
				"Marine Environment",
				"Classification",
				"EEZ",
				"NZ",
				"ArcGIS",
				"Service Definition",
				".sd",
				"Model",
				"autometadata",
				"CC_Oceans_and_Fisheries",
				"Proj_OPENDATA"
			],
			"issued": "2018-11-12T22:47:03.000Z",
			"modified": "2018-11-12T23:12:28.149Z",
			"publisher": {
				"name": "National Institute of Water and Atmospheric Research"
			},
			"contactPoint": {
				"@type": "vcard:Contact",
				"fn": "NIWA_OpenData",
				"hasEmail": "mailto:enquiries@niwa.co.nz"
			},
			"accessLevel": "public",
			"spatial": "-180.0000,-56.3804,180.0000,-23.9509",
			"license": "https://creativecommons.org/licenses/by-nc-sa/4.0",
			"distribution": [
				{
					"@type": "dcat:Distribution",
					"title": "ArcGIS Hub Dataset",
					"format": "Web Page",
					"mediaType": "text/html",
					"accessURL": "https://www.pacificgeoportal.com/datasets/NIWA::mec-eez-20-class"
				},
				{
					"@type": "dcat:Distribution",
					"title": "ArcGIS GeoService",
					"format": "ArcGIS GeoServices REST API",
					"mediaType": "application/json",
					"accessURL": "https://services3.arcgis.com/fp1tibNcN9mbExhG/arcgis/rest/services/New_Zealand_Marine_Environment_Classification_WFL1/FeatureServer/2"
				},
				{
					"@type": "dcat:Distribution",
					"title": "CSV",
					"format": "CSV",
					"mediaType": "text/csv",
					"accessURL": "https://www.pacificgeoportal.com/api/download/v1/items/9104c9b367f14e76ac48af3725d68dac/csv?layers=2"
				},
				{
					"@type": "dcat:Distribution",
					"title": "Shapefile",
					"format": "ZIP",
					"mediaType": "application/zip",
					"accessURL": "https://www.pacificgeoportal.com/api/download/v1/items/9104c9b367f14e76ac48af3725d68dac/shapefile?layers=2"
				},
				{
					"@type": "dcat:Distribution",
					"title": "GeoJSON",
					"format": "GeoJSON",
					"mediaType": "application/vnd.geo+json",
					"accessURL": "https://www.pacificgeoportal.com/api/download/v1/items/9104c9b367f14e76ac48af3725d68dac/geojson?layers=2"
				},
				{
					"@type": "dcat:Distribution",
					"title": "KML",
					"format": "KML",
					"mediaType": "application/vnd.google-earth.kml+xml",
					"accessURL": "https://www.pacificgeoportal.com/api/download/v1/items/9104c9b367f14e76ac48af3725d68dac/kml?layers=2"
				},
				{
					"@type": "dcat:Distribution",
					"title": "File Geodatabase",
					"format": "ZIP",
					"mediaType": "application/zip",
					"accessURL": "https://www.pacificgeoportal.com/api/download/v1/items/9104c9b367f14e76ac48af3725d68dac/filegdb?layers=2"
				},
				{
					"@type": "dcat:Distribution",
					"title": "Feature Collection",
					"format": "TXT",
					"mediaType": "text/plain",
					"accessURL": "https://www.pacificgeoportal.com/api/download/v1/items/9104c9b367f14e76ac48af3725d68dac/featureCollection?layers=2"
				},
				{
					"@type": "dcat:Distribution",
					"title": "Excel",
					"format": "XLSX",
					"mediaType": "application/vnd.ms-excel",
					"accessURL": "https://www.pacificgeoportal.com/api/download/v1/items/9104c9b367f14e76ac48af3725d68dac/excel?layers=2"
				},
				{
					"@type": "dcat:Distribution",
					"title": "GeoPackage",
					"format": "GPKG",
					"mediaType": "application/geopackage+sqlite3",
					"accessURL": "https://www.pacificgeoportal.com/api/download/v1/items/9104c9b367f14e76ac48af3725d68dac/geoPackage?layers=2"
				},
				{
					"@type": "dcat:Distribution",
					"title": "SQLite Geodatabase",
					"format": "GDB",
					"mediaType": "application/geopackage+sqlite3",
					"accessURL": "https://www.pacificgeoportal.com/api/download/v1/items/9104c9b367f14e76ac48af3725d68dac/sqlite?layers=2"
				}
			],
			"theme": [
				"geospatial"
			]
		},
		{
			"@type": "dcat:Dataset",
			"identifier": "https://www.arcgis.com/home/item.html?id=9104c9b367f14e76ac48af3725d68dac&sublayer=3",
			"landingPage": "https://www.pacificgeoportal.com/datasets/NIWA::mec-eez-10-class",
			"title": "MEC EEZ 10 class",
			"description": "<div><span>The \nMarine Environment Classification (MEC), a GIS-based environmental \nclassification of the marine environment of the New Zealand region, is \nan ecosystem-based spatial framework designed for marine management \npurposes. <br /></span></div><div><span><br /></span></div><div><span>Developed by NIWA with support from the Ministry for the Environment \n(MfE), Department of Conservation and Ministry of Fisheries, and with \ncontributions from several other stakeholders, the MEC provides a \nspatial framework for inventories of marine resources, environmental \neffects assessments, policy development and design of protected area \nnetworks. <br /></span></div><div><br /><p><span style='text-decoration:underline;'>Two levels of spatial resolution are available within the MEC</span>. A \nbroad scale classification covers the entire EEZ at a nominal spatial \nresolution of 1 km, whereas the finer scale classification of the \nHauraki Gulf region has a nominal spatial resolution of 200 m.</p>\n<p>Several spatially-explicit data layers describing the physical \nenvironment define the MEC. A physically-based classification was chosen\n because data on these physical variables were available or could be \nmodelled, and because the pattern of the physical environment is a \nreasonable surrogate for biological pattern, particularly at larger \nspatial scales. Classes within the classification were defined using \nmultivariate clustering methods. These produce hierarchal \nclassifications that enable the user to delineate environmental \nvariation at different levels of detail and associated spatial scales.</p>\n<p>Large biological datasets were used to tune the classification, so \nthat the physically-based classes maximised discrimination of variation \nin biological composition at various levels of classification detail. \nThus, the MEC provides a general classification that is relevant to most\n groups of marine organisms (fishes, invertebrates and chlorophyll) and \nto ecologically important abiotic variables (e.g., temperature, \nnutrients).</p><p>An <a href='https://environment.govt.nz/publications/the-new-zealand-marine-environment-classification-overview/' target='_blank' rel='nofollow ugc noopener noreferrer'>overview report describing the MEC</a>\n is available as a PDF file (External Link). The overview report covers the conceptual \nbasis for the MEC and results of testing the classification:</p>\n<ul><li><a href='https://environment.govt.nz/publications/the-new-zealand-marine-environment-classification-overview/' target='_blank' rel='nofollow ugc noopener noreferrer'>MEC Overview</a> (PDF 2.7 MB)</li></ul><p><br /></p><span></span></div><div><span>See here for a longer description: <span><a href='https://www.niwa.co.nz/coasts-and-oceans/our-services/marine-environment-classification' target='_blank' rel='nofollow ugc noopener noreferrer'>https://www.niwa.co.nz/coasts-and-oceans/our-services/marine-environment-classification</a></span></span></div>_________________________________________________________________________________________________________________<br /><br /><font size='3'><b>Item Page Created:</b> 2018-11-12 22:47  <br /><b>Item Page Last Modified:</b> 2025-04-05 20:20<br />Owner: NIWA_OpenData</font><br /><br /><b><font size='5'>Exclusive Economic Zone (EEZ)</font></b><br /><b>No data edit dates available</b><br /><b>Fields:</b> FID,ENTITY,LAYER,ELEVATION,THICKNESS,COLOR<br /><br /><b><font size='5'>MEC EEZ 40 class</font></b><br /><b>No data edit dates available</b><br /><b>Fields:</b> FID,GRP__40,COUNT_<br /><br /><b><font size='5'>MEC EEZ 20 class</font></b><br /><b>No data edit dates available</b><br /><b>Fields:</b> FID,GRP__20,COUNT_<br /><br /><b><font size='5'>MEC EEZ 10 class</font></b><br /><b>No data edit dates available</b><br /><b>Fields:</b> FID,GRP__10,COUNT_<br /><br /><b><font size='5'>MEC EEZ 05 class</font></b><br /><b>No data edit dates available</b><br /><b>Fields:</b> FID,GRP___5,COUNT_<br /><br /><b><font size='5'>Coastline</font></b><br /><b>No data edit dates available</b><br /><b>Fields:</b> FID,NZCOAST_ID,SHAPE_LENG<br />",
			"keyword": [
				"MEC",
				"MfE",
				"NIWA",
				"Marine Environment",
				"Classification",
				"EEZ",
				"NZ",
				"ArcGIS",
				"Service Definition",
				".sd",
				"Model",
				"autometadata",
				"CC_Oceans_and_Fisheries",
				"Proj_OPENDATA"
			],
			"issued": "2018-11-12T22:47:03.000Z",
			"modified": "2018-11-12T23:12:02.776Z",
			"publisher": {
				"name": "National Institute of Water and Atmospheric Research"
			},
			"contactPoint": {
				"@type": "vcard:Contact",
				"fn": "NIWA_OpenData",
				"hasEmail": "mailto:enquiries@niwa.co.nz"
			},
			"accessLevel": "public",
			"spatial": "-180.0000,-56.3804,180.0000,-23.9509",
			"license": "https://creativecommons.org/licenses/by-nc-sa/4.0",
			"distribution": [
				{
					"@type": "dcat:Distribution",
					"title": "ArcGIS Hub Dataset",
					"format": "Web Page",
					"mediaType": "text/html",
					"accessURL": "https://www.pacificgeoportal.com/datasets/NIWA::mec-eez-10-class"
				},
				{
					"@type": "dcat:Distribution",
					"title": "ArcGIS GeoService",
					"format": "ArcGIS GeoServices REST API",
					"mediaType": "application/json",
					"accessURL": "https://services3.arcgis.com/fp1tibNcN9mbExhG/arcgis/rest/services/New_Zealand_Marine_Environment_Classification_WFL1/FeatureServer/3"
				},
				{
					"@type": "dcat:Distribution",
					"title": "CSV",
					"format": "CSV",
					"mediaType": "text/csv",
					"accessURL": "https://www.pacificgeoportal.com/api/download/v1/items/9104c9b367f14e76ac48af3725d68dac/csv?layers=3"
				},
				{
					"@type": "dcat:Distribution",
					"title": "Shapefile",
					"format": "ZIP",
					"mediaType": "application/zip",
					"accessURL": "https://www.pacificgeoportal.com/api/download/v1/items/9104c9b367f14e76ac48af3725d68dac/shapefile?layers=3"
				},
				{
					"@type": "dcat:Distribution",
					"title": "GeoJSON",
					"format": "GeoJSON",
					"mediaType": "application/vnd.geo+json",
					"accessURL": "https://www.pacificgeoportal.com/api/download/v1/items/9104c9b367f14e76ac48af3725d68dac/geojson?layers=3"
				},
				{
					"@type": "dcat:Distribution",
					"title": "KML",
					"format": "KML",
					"mediaType": "application/vnd.google-earth.kml+xml",
					"accessURL": "https://www.pacificgeoportal.com/api/download/v1/items/9104c9b367f14e76ac48af3725d68dac/kml?layers=3"
				},
				{
					"@type": "dcat:Distribution",
					"title": "File Geodatabase",
					"format": "ZIP",
					"mediaType": "application/zip",
					"accessURL": "https://www.pacificgeoportal.com/api/download/v1/items/9104c9b367f14e76ac48af3725d68dac/filegdb?layers=3"
				},
				{
					"@type": "dcat:Distribution",
					"title": "Feature Collection",
					"format": "TXT",
					"mediaType": "text/plain",
					"accessURL": "https://www.pacificgeoportal.com/api/download/v1/items/9104c9b367f14e76ac48af3725d68dac/featureCollection?layers=3"
				},
				{
					"@type": "dcat:Distribution",
					"title": "Excel",
					"format": "XLSX",
					"mediaType": "application/vnd.ms-excel",
					"accessURL": "https://www.pacificgeoportal.com/api/download/v1/items/9104c9b367f14e76ac48af3725d68dac/excel?layers=3"
				},
				{
					"@type": "dcat:Distribution",
					"title": "GeoPackage",
					"format": "GPKG",
					"mediaType": "application/geopackage+sqlite3",
					"accessURL": "https://www.pacificgeoportal.com/api/download/v1/items/9104c9b367f14e76ac48af3725d68dac/geoPackage?layers=3"
				},
				{
					"@type": "dcat:Distribution",
					"title": "SQLite Geodatabase",
					"format": "GDB",
					"mediaType": "application/geopackage+sqlite3",
					"accessURL": "https://www.pacificgeoportal.com/api/download/v1/items/9104c9b367f14e76ac48af3725d68dac/sqlite?layers=3"
				}
			],
			"theme": [
				"geospatial"
			]
		},
		{
			"@type": "dcat:Dataset",
			"identifier": "https://www.arcgis.com/home/item.html?id=9104c9b367f14e76ac48af3725d68dac&sublayer=4",
			"landingPage": "https://www.pacificgeoportal.com/datasets/NIWA::mec-eez-05-class",
			"title": "MEC EEZ 05 class",
			"description": "<div><span>The \nMarine Environment Classification (MEC), a GIS-based environmental \nclassification of the marine environment of the New Zealand region, is \nan ecosystem-based spatial framework designed for marine management \npurposes. <br /></span></div><div><span><br /></span></div><div><span>Developed by NIWA with support from the Ministry for the Environment \n(MfE), Department of Conservation and Ministry of Fisheries, and with \ncontributions from several other stakeholders, the MEC provides a \nspatial framework for inventories of marine resources, environmental \neffects assessments, policy development and design of protected area \nnetworks. <br /></span></div><div><br /><p><span style='text-decoration:underline;'>Two levels of spatial resolution are available within the MEC</span>. A \nbroad scale classification covers the entire EEZ at a nominal spatial \nresolution of 1 km, whereas the finer scale classification of the \nHauraki Gulf region has a nominal spatial resolution of 200 m.</p>\n<p>Several spatially-explicit data layers describing the physical \nenvironment define the MEC. A physically-based classification was chosen\n because data on these physical variables were available or could be \nmodelled, and because the pattern of the physical environment is a \nreasonable surrogate for biological pattern, particularly at larger \nspatial scales. Classes within the classification were defined using \nmultivariate clustering methods. These produce hierarchal \nclassifications that enable the user to delineate environmental \nvariation at different levels of detail and associated spatial scales.</p>\n<p>Large biological datasets were used to tune the classification, so \nthat the physically-based classes maximised discrimination of variation \nin biological composition at various levels of classification detail. \nThus, the MEC provides a general classification that is relevant to most\n groups of marine organisms (fishes, invertebrates and chlorophyll) and \nto ecologically important abiotic variables (e.g., temperature, \nnutrients).</p><p>An <a href='https://environment.govt.nz/publications/the-new-zealand-marine-environment-classification-overview/' target='_blank' rel='nofollow ugc noopener noreferrer'>overview report describing the MEC</a>\n is available as a PDF file (External Link). The overview report covers the conceptual \nbasis for the MEC and results of testing the classification:</p>\n<ul><li><a href='https://environment.govt.nz/publications/the-new-zealand-marine-environment-classification-overview/' target='_blank' rel='nofollow ugc noopener noreferrer'>MEC Overview</a> (PDF 2.7 MB)</li></ul><p><br /></p><span></span></div><div><span>See here for a longer description: <span><a href='https://www.niwa.co.nz/coasts-and-oceans/our-services/marine-environment-classification' target='_blank' rel='nofollow ugc noopener noreferrer'>https://www.niwa.co.nz/coasts-and-oceans/our-services/marine-environment-classification</a></span></span></div>_________________________________________________________________________________________________________________<br /><br /><font size='3'><b>Item Page Created:</b> 2018-11-12 22:47  <br /><b>Item Page Last Modified:</b> 2025-04-05 20:20<br />Owner: NIWA_OpenData</font><br /><br /><b><font size='5'>Exclusive Economic Zone (EEZ)</font></b><br /><b>No data edit dates available</b><br /><b>Fields:</b> FID,ENTITY,LAYER,ELEVATION,THICKNESS,COLOR<br /><br /><b><font size='5'>MEC EEZ 40 class</font></b><br /><b>No data edit dates available</b><br /><b>Fields:</b> FID,GRP__40,COUNT_<br /><br /><b><font size='5'>MEC EEZ 20 class</font></b><br /><b>No data edit dates available</b><br /><b>Fields:</b> FID,GRP__20,COUNT_<br /><br /><b><font size='5'>MEC EEZ 10 class</font></b><br /><b>No data edit dates available</b><br /><b>Fields:</b> FID,GRP__10,COUNT_<br /><br /><b><font size='5'>MEC EEZ 05 class</font></b><br /><b>No data edit dates available</b><br /><b>Fields:</b> FID,GRP___5,COUNT_<br /><br /><b><font size='5'>Coastline</font></b><br /><b>No data edit dates available</b><br /><b>Fields:</b> FID,NZCOAST_ID,SHAPE_LENG<br />",
			"keyword": [
				"MEC",
				"MfE",
				"NIWA",
				"Marine Environment",
				"Classification",
				"EEZ",
				"NZ",
				"ArcGIS",
				"Service Definition",
				".sd",
				"Model",
				"autometadata",
				"CC_Oceans_and_Fisheries",
				"Proj_OPENDATA"
			],
			"issued": "2018-11-12T22:47:03.000Z",
			"modified": "2018-11-12T23:11:37.596Z",
			"publisher": {
				"name": "National Institute of Water and Atmospheric Research"
			},
			"contactPoint": {
				"@type": "vcard:Contact",
				"fn": "NIWA_OpenData",
				"hasEmail": "mailto:enquiries@niwa.co.nz"
			},
			"accessLevel": "public",
			"spatial": "-180.0000,-56.3804,180.0000,-23.9509",
			"license": "https://creativecommons.org/licenses/by-nc-sa/4.0",
			"distribution": [
				{
					"@type": "dcat:Distribution",
					"title": "ArcGIS Hub Dataset",
					"format": "Web Page",
					"mediaType": "text/html",
					"accessURL": "https://www.pacificgeoportal.com/datasets/NIWA::mec-eez-05-class"
				},
				{
					"@type": "dcat:Distribution",
					"title": "ArcGIS GeoService",
					"format": "ArcGIS GeoServices REST API",
					"mediaType": "application/json",
					"accessURL": "https://services3.arcgis.com/fp1tibNcN9mbExhG/arcgis/rest/services/New_Zealand_Marine_Environment_Classification_WFL1/FeatureServer/4"
				},
				{
					"@type": "dcat:Distribution",
					"title": "CSV",
					"format": "CSV",
					"mediaType": "text/csv",
					"accessURL": "https://www.pacificgeoportal.com/api/download/v1/items/9104c9b367f14e76ac48af3725d68dac/csv?layers=4"
				},
				{
					"@type": "dcat:Distribution",
					"title": "Shapefile",
					"format": "ZIP",
					"mediaType": "application/zip",
					"accessURL": "https://www.pacificgeoportal.com/api/download/v1/items/9104c9b367f14e76ac48af3725d68dac/shapefile?layers=4"
				},
				{
					"@type": "dcat:Distribution",
					"title": "GeoJSON",
					"format": "GeoJSON",
					"mediaType": "application/vnd.geo+json",
					"accessURL": "https://www.pacificgeoportal.com/api/download/v1/items/9104c9b367f14e76ac48af3725d68dac/geojson?layers=4"
				},
				{
					"@type": "dcat:Distribution",
					"title": "KML",
					"format": "KML",
					"mediaType": "application/vnd.google-earth.kml+xml",
					"accessURL": "https://www.pacificgeoportal.com/api/download/v1/items/9104c9b367f14e76ac48af3725d68dac/kml?layers=4"
				},
				{
					"@type": "dcat:Distribution",
					"title": "File Geodatabase",
					"format": "ZIP",
					"mediaType": "application/zip",
					"accessURL": "https://www.pacificgeoportal.com/api/download/v1/items/9104c9b367f14e76ac48af3725d68dac/filegdb?layers=4"
				},
				{
					"@type": "dcat:Distribution",
					"title": "Feature Collection",
					"format": "TXT",
					"mediaType": "text/plain",
					"accessURL": "https://www.pacificgeoportal.com/api/download/v1/items/9104c9b367f14e76ac48af3725d68dac/featureCollection?layers=4"
				},
				{
					"@type": "dcat:Distribution",
					"title": "Excel",
					"format": "XLSX",
					"mediaType": "application/vnd.ms-excel",
					"accessURL": "https://www.pacificgeoportal.com/api/download/v1/items/9104c9b367f14e76ac48af3725d68dac/excel?layers=4"
				},
				{
					"@type": "dcat:Distribution",
					"title": "GeoPackage",
					"format": "GPKG",
					"mediaType": "application/geopackage+sqlite3",
					"accessURL": "https://www.pacificgeoportal.com/api/download/v1/items/9104c9b367f14e76ac48af3725d68dac/geoPackage?layers=4"
				},
				{
					"@type": "dcat:Distribution",
					"title": "SQLite Geodatabase",
					"format": "GDB",
					"mediaType": "application/geopackage+sqlite3",
					"accessURL": "https://www.pacificgeoportal.com/api/download/v1/items/9104c9b367f14e76ac48af3725d68dac/sqlite?layers=4"
				}
			],
			"theme": [
				"geospatial"
			]
		},
		{
			"@type": "dcat:Dataset",
			"identifier": "https://www.arcgis.com/home/item.html?id=9104c9b367f14e76ac48af3725d68dac&sublayer=5",
			"landingPage": "https://www.pacificgeoportal.com/datasets/NIWA::coastline",
			"title": "Coastline",
			"description": "<div><span>The \nMarine Environment Classification (MEC), a GIS-based environmental \nclassification of the marine environment of the New Zealand region, is \nan ecosystem-based spatial framework designed for marine management \npurposes. <br /></span></div><div><span><br /></span></div><div><span>Developed by NIWA with support from the Ministry for the Environment \n(MfE), Department of Conservation and Ministry of Fisheries, and with \ncontributions from several other stakeholders, the MEC provides a \nspatial framework for inventories of marine resources, environmental \neffects assessments, policy development and design of protected area \nnetworks. <br /></span></div><div><br /><p><span style='text-decoration:underline;'>Two levels of spatial resolution are available within the MEC</span>. A \nbroad scale classification covers the entire EEZ at a nominal spatial \nresolution of 1 km, whereas the finer scale classification of the \nHauraki Gulf region has a nominal spatial resolution of 200 m.</p>\n<p>Several spatially-explicit data layers describing the physical \nenvironment define the MEC. A physically-based classification was chosen\n because data on these physical variables were available or could be \nmodelled, and because the pattern of the physical environment is a \nreasonable surrogate for biological pattern, particularly at larger \nspatial scales. Classes within the classification were defined using \nmultivariate clustering methods. These produce hierarchal \nclassifications that enable the user to delineate environmental \nvariation at different levels of detail and associated spatial scales.</p>\n<p>Large biological datasets were used to tune the classification, so \nthat the physically-based classes maximised discrimination of variation \nin biological composition at various levels of classification detail. \nThus, the MEC provides a general classification that is relevant to most\n groups of marine organisms (fishes, invertebrates and chlorophyll) and \nto ecologically important abiotic variables (e.g., temperature, \nnutrients).</p><p>An <a href='https://environment.govt.nz/publications/the-new-zealand-marine-environment-classification-overview/' target='_blank' rel='nofollow ugc noopener noreferrer'>overview report describing the MEC</a>\n is available as a PDF file (External Link). The overview report covers the conceptual \nbasis for the MEC and results of testing the classification:</p>\n<ul><li><a href='https://environment.govt.nz/publications/the-new-zealand-marine-environment-classification-overview/' target='_blank' rel='nofollow ugc noopener noreferrer'>MEC Overview</a> (PDF 2.7 MB)</li></ul><p><br /></p><span></span></div><div><span>See here for a longer description: <span><a href='https://www.niwa.co.nz/coasts-and-oceans/our-services/marine-environment-classification' target='_blank' rel='nofollow ugc noopener noreferrer'>https://www.niwa.co.nz/coasts-and-oceans/our-services/marine-environment-classification</a></span></span></div>_________________________________________________________________________________________________________________<br /><br /><font size='3'><b>Item Page Created:</b> 2018-11-12 22:47  <br /><b>Item Page Last Modified:</b> 2025-04-05 20:20<br />Owner: NIWA_OpenData</font><br /><br /><b><font size='5'>Exclusive Economic Zone (EEZ)</font></b><br /><b>No data edit dates available</b><br /><b>Fields:</b> FID,ENTITY,LAYER,ELEVATION,THICKNESS,COLOR<br /><br /><b><font size='5'>MEC EEZ 40 class</font></b><br /><b>No data edit dates available</b><br /><b>Fields:</b> FID,GRP__40,COUNT_<br /><br /><b><font size='5'>MEC EEZ 20 class</font></b><br /><b>No data edit dates available</b><br /><b>Fields:</b> FID,GRP__20,COUNT_<br /><br /><b><font size='5'>MEC EEZ 10 class</font></b><br /><b>No data edit dates available</b><br /><b>Fields:</b> FID,GRP__10,COUNT_<br /><br /><b><font size='5'>MEC EEZ 05 class</font></b><br /><b>No data edit dates available</b><br /><b>Fields:</b> FID,GRP___5,COUNT_<br /><br /><b><font size='5'>Coastline</font></b><br /><b>No data edit dates available</b><br /><b>Fields:</b> FID,NZCOAST_ID,SHAPE_LENG<br />",
			"keyword": [
				"MEC",
				"MfE",
				"NIWA",
				"Marine Environment",
				"Classification",
				"EEZ",
				"NZ",
				"ArcGIS",
				"Service Definition",
				".sd",
				"Model",
				"autometadata",
				"CC_Oceans_and_Fisheries",
				"Proj_OPENDATA"
			],
			"issued": "2018-11-12T22:47:03.000Z",
			"modified": "2018-11-12T23:04:04.553Z",
			"publisher": {
				"name": "National Institute of Water and Atmospheric Research"
			},
			"contactPoint": {
				"@type": "vcard:Contact",
				"fn": "NIWA_OpenData",
				"hasEmail": "mailto:enquiries@niwa.co.nz"
			},
			"accessLevel": "public",
			"spatial": "-180.0000,-52.6209,180.0000,-29.2314",
			"license": "https://creativecommons.org/licenses/by-nc-sa/4.0",
			"distribution": [
				{
					"@type": "dcat:Distribution",
					"title": "ArcGIS Hub Dataset",
					"format": "Web Page",
					"mediaType": "text/html",
					"accessURL": "https://www.pacificgeoportal.com/datasets/NIWA::coastline"
				},
				{
					"@type": "dcat:Distribution",
					"title": "ArcGIS GeoService",
					"format": "ArcGIS GeoServices REST API",
					"mediaType": "application/json",
					"accessURL": "https://services3.arcgis.com/fp1tibNcN9mbExhG/arcgis/rest/services/New_Zealand_Marine_Environment_Classification_WFL1/FeatureServer/5"
				},
				{
					"@type": "dcat:Distribution",
					"title": "CSV",
					"format": "CSV",
					"mediaType": "text/csv",
					"accessURL": "https://www.pacificgeoportal.com/api/download/v1/items/9104c9b367f14e76ac48af3725d68dac/csv?layers=5"
				},
				{
					"@type": "dcat:Distribution",
					"title": "Shapefile",
					"format": "ZIP",
					"mediaType": "application/zip",
					"accessURL": "https://www.pacificgeoportal.com/api/download/v1/items/9104c9b367f14e76ac48af3725d68dac/shapefile?layers=5"
				},
				{
					"@type": "dcat:Distribution",
					"title": "GeoJSON",
					"format": "GeoJSON",
					"mediaType": "application/vnd.geo+json",
					"accessURL": "https://www.pacificgeoportal.com/api/download/v1/items/9104c9b367f14e76ac48af3725d68dac/geojson?layers=5"
				},
				{
					"@type": "dcat:Distribution",
					"title": "KML",
					"format": "KML",
					"mediaType": "application/vnd.google-earth.kml+xml",
					"accessURL": "https://www.pacificgeoportal.com/api/download/v1/items/9104c9b367f14e76ac48af3725d68dac/kml?layers=5"
				},
				{
					"@type": "dcat:Distribution",
					"title": "File Geodatabase",
					"format": "ZIP",
					"mediaType": "application/zip",
					"accessURL": "https://www.pacificgeoportal.com/api/download/v1/items/9104c9b367f14e76ac48af3725d68dac/filegdb?layers=5"
				},
				{
					"@type": "dcat:Distribution",
					"title": "Feature Collection",
					"format": "TXT",
					"mediaType": "text/plain",
					"accessURL": "https://www.pacificgeoportal.com/api/download/v1/items/9104c9b367f14e76ac48af3725d68dac/featureCollection?layers=5"
				},
				{
					"@type": "dcat:Distribution",
					"title": "Excel",
					"format": "XLSX",
					"mediaType": "application/vnd.ms-excel",
					"accessURL": "https://www.pacificgeoportal.com/api/download/v1/items/9104c9b367f14e76ac48af3725d68dac/excel?layers=5"
				},
				{
					"@type": "dcat:Distribution",
					"title": "GeoPackage",
					"format": "GPKG",
					"mediaType": "application/geopackage+sqlite3",
					"accessURL": "https://www.pacificgeoportal.com/api/download/v1/items/9104c9b367f14e76ac48af3725d68dac/geoPackage?layers=5"
				},
				{
					"@type": "dcat:Distribution",
					"title": "SQLite Geodatabase",
					"format": "GDB",
					"mediaType": "application/geopackage+sqlite3",
					"accessURL": "https://www.pacificgeoportal.com/api/download/v1/items/9104c9b367f14e76ac48af3725d68dac/sqlite?layers=5"
				}
			],
			"theme": [
				"geospatial"
			]
		},
		{
			"@type": "dcat:Dataset",
			"identifier": "https://www.arcgis.com/home/item.html?id=ca1c91e1106d4ee497cf9bb222a94f67&sublayer=0",
			"landingPage": "https://www.pacificgeoportal.com/datasets/NIWA::marine-biological-observation-data-from-coastal-and-offshore-surveys-around-new-zealand-mbis-nz",
			"title": "Marine biological observation data from coastal and offshore surveys around New Zealand MBIS NZ",
			"description": "Occurrence details of New Zealand marine fauna and flora from around the coastline and offshore. Information is assimilated from a variety of sources including unpublished data sets and digitised from journal articles. Where the source is from a published paper the source paper citation is listed at the record level.<br /><br />Data was then assimilated from digital and non digital sources (such as journal publications, reports, work sheets) into a central dataset.<br /><br />Marine species occurrence data collated from research events along the coast and in New Zealand waters.<br /><br />Biological data was sampled in-situ using a variety of equipment such as  trawls, pots, grabs, dredges, and beach surveys.<br /><br />The scientific names have been mapped to the World Register of Marine Species (WoRMS), using the online taxon match tool.<br />All sampling locations have been plotted on a map to perform a visual check. The most important check would be to see if all sampling locations are (1) in the marine and/or brackish environment and (2) within the described sampling area.<br /><br /><span style='font-weight:bold;'>Citation:  SWPRON (2014).</span> Marine biological observation data from coastal and offshore surveys around New Zealand. Southwestern Pacific OBIS, National Institute of Water and Atmospheric Research (NIWA), Wellington, New Zealand, 5707 records. <br /><br /><span style='font-weight:bold;'>Online:</span>  <a href='https://nzobisipt.niwa.co.nz/resource?r=mbis_nz' target='_blank' rel='nofollow ugc noopener noreferrer'>https://nzobisipt.niwa.co.nz/resource?r=mbis_nz</a>  Released on April 17, 2015._________________________________________________________________________________________________________________<br /><br /><font size='3'><b>Item Page Created:</b> 2016-06-09 02:01  <br /><b>Item Page Last Modified:</b> 2025-04-05 20:45<br />Owner: NIWA_OpenData</font><br /><br /><b><font size='5'>MBIS_NZ</font></b><br /><b>No data edit dates available</b><br /><b>Fields:</b> id,modified,language,bibliographicCitation,references_,institutionCode,collectionCode,ownerInstitutionCode,basisOfRecord,dynamicProperties,catalogNumber,occurrenceRemarks,individualCount,sex,lifeStage,occurrenceStatus,associatedTaxa,eventID,samplingProtocol,eventDate,startDayOfYear,year,month,day,fieldNumber,waterBody,country,stateProvince,county,locality,minimumDepthInMeters,maximumDepthInMeters,decimalLatitude,decimalLongitude,geodeticDatum,coordinateUncertaintyInMeters,footprintWKT,identifiedBy,typeStatus,scientificNameID,scientificName,kingdom,phylum,class,order_,family,genus,subgenus,specificEpithet,infraspecificEpithet,scientificNameAuthorship,FID<br />",
			"keyword": [
				"OBIS",
				"Occurence",
				"ocean",
				"autometadata",
				"coastoceans",
				"observation",
				"CC_Weather_Climate_Hazards",
				"Proj_OPENDATA"
			],
			"issued": "2016-06-09T02:01:45.000Z",
			"modified": "2023-11-06T00:00:00.000Z",
			"publisher": {
				"name": "National Institute of Water and Atmospheric Research"
			},
			"contactPoint": {
				"@type": "vcard:Contact",
				"fn": "NIWA_OpenData",
				"hasEmail": "mailto:enquiries@niwa.co.nz"
			},
			"accessLevel": "public",
			"spatial": "-179.5559,-75.5333,179.9600,-22.2667",
			"license": "https://creativecommons.org/licenses/by/4.0",
			"distribution": [
				{
					"@type": "dcat:Distribution",
					"title": "ArcGIS Hub Dataset",
					"format": "Web Page",
					"mediaType": "text/html",
					"accessURL": "https://www.pacificgeoportal.com/datasets/NIWA::marine-biological-observation-data-from-coastal-and-offshore-surveys-around-new-zealand-mbis-nz"
				},
				{
					"@type": "dcat:Distribution",
					"title": "ArcGIS GeoService",
					"format": "ArcGIS GeoServices REST API",
					"mediaType": "application/json",
					"accessURL": "https://services3.arcgis.com/fp1tibNcN9mbExhG/arcgis/rest/services/MBIS_NZ/FeatureServer/0"
				},
				{
					"@type": "dcat:Distribution",
					"title": "CSV",
					"format": "CSV",
					"mediaType": "text/csv",
					"accessURL": "https://www.pacificgeoportal.com/api/download/v1/items/ca1c91e1106d4ee497cf9bb222a94f67/csv?layers=0"
				},
				{
					"@type": "dcat:Distribution",
					"title": "Shapefile",
					"format": "ZIP",
					"mediaType": "application/zip",
					"accessURL": "https://www.pacificgeoportal.com/api/download/v1/items/ca1c91e1106d4ee497cf9bb222a94f67/shapefile?layers=0"
				},
				{
					"@type": "dcat:Distribution",
					"title": "GeoJSON",
					"format": "GeoJSON",
					"mediaType": "application/vnd.geo+json",
					"accessURL": "https://www.pacificgeoportal.com/api/download/v1/items/ca1c91e1106d4ee497cf9bb222a94f67/geojson?layers=0"
				},
				{
					"@type": "dcat:Distribution",
					"title": "KML",
					"format": "KML",
					"mediaType": "application/vnd.google-earth.kml+xml",
					"accessURL": "https://www.pacificgeoportal.com/api/download/v1/items/ca1c91e1106d4ee497cf9bb222a94f67/kml?layers=0"
				},
				{
					"@type": "dcat:Distribution",
					"title": "File Geodatabase",
					"format": "ZIP",
					"mediaType": "application/zip",
					"accessURL": "https://www.pacificgeoportal.com/api/download/v1/items/ca1c91e1106d4ee497cf9bb222a94f67/filegdb?layers=0"
				},
				{
					"@type": "dcat:Distribution",
					"title": "Feature Collection",
					"format": "TXT",
					"mediaType": "text/plain",
					"accessURL": "https://www.pacificgeoportal.com/api/download/v1/items/ca1c91e1106d4ee497cf9bb222a94f67/featureCollection?layers=0"
				},
				{
					"@type": "dcat:Distribution",
					"title": "Excel",
					"format": "XLSX",
					"mediaType": "application/vnd.ms-excel",
					"accessURL": "https://www.pacificgeoportal.com/api/download/v1/items/ca1c91e1106d4ee497cf9bb222a94f67/excel?layers=0"
				},
				{
					"@type": "dcat:Distribution",
					"title": "GeoPackage",
					"format": "GPKG",
					"mediaType": "application/geopackage+sqlite3",
					"accessURL": "https://www.pacificgeoportal.com/api/download/v1/items/ca1c91e1106d4ee497cf9bb222a94f67/geoPackage?layers=0"
				},
				{
					"@type": "dcat:Distribution",
					"title": "SQLite Geodatabase",
					"format": "GDB",
					"mediaType": "application/geopackage+sqlite3",
					"accessURL": "https://www.pacificgeoportal.com/api/download/v1/items/ca1c91e1106d4ee497cf9bb222a94f67/sqlite?layers=0"
				}
			],
			"theme": [
				"geospatial"
			]
		},
		{
			"@type": "dcat:Dataset",
			"identifier": "https://www.arcgis.com/home/item.html?id=7759fbaecd4649dea39c4ac2b07fc4ab&sublayer=0",
			"landingPage": "https://www.pacificgeoportal.com/datasets/eaglegis::nz-regional-councils-current",
			"title": "NZ Regional Councils - Current",
			"description": "<div><font size='3'>Topicality: 01-01-2025</font></div><div><font size='3'>Projection: New Zealand Transverse Mercator (NZTM)</font></div><div><font size='3'><br /></font></div><div><div><font size='3'>This layer contains the latest set of regional council boundaries as defined by regional councils and/or Local Government Commission, and maintained by Stats NZ (the custodian).</font><font size='3'><br /></font></div><div><font size='3'><br /></font></div><div><font size='3'>The regional council is the top tier of local government in New \nZealand. Regional councils are defined under schedule 2, part 1 of the \nLocal Government Act 2002. They were established in November 1989 after \nthe abolition of the 22 local government regions. Regional council \nboundaries must coincide with meshblock boundaries under schedule 3, \nclause 17 of the Local Government Act 2002.</font><font size='3'><br /></font></div><div><font size='3'><br /></font></div><div><font size='3'>Regional council boundaries are based largely on water catchments, \nsuch as rivers, lakes, and harbours. The seaward boundary of the regions\n is the 12 mile (19.3km) New Zealand territorial limit. In determining \nregions, consideration was also given to regional communities of \ninterest, natural resource management, land use planning, and \nenvironmental matters.</font></div></div><div><ul><li><font face='Avenir Next W01, Avenir Next W00, Avenir Next, Avenir, Helvetica Neue, Helvetica, Arial, sans-serif' size='3'>This layer gets updated yearly with the latest boundary data.</font></li><li><font face='Avenir Next W01, Avenir Next W00, Avenir Next, Avenir, Helvetica Neue, Helvetica, Arial, sans-serif' size='3'><font style='font-family:&quot;Avenir Next W01&quot;, &quot;Avenir Next W00&quot;, &quot;Avenir Next&quot;, Avenir, &quot;Helvetica Neue&quot;, Helvetica, Arial, sans-serif;'>A layer with the full archive of the data for all the available years is available </font></font><a href='https://www.arcgis.com/home/item.html?id=6ee62a063ce74133af0c7476363ed03e' target='_blank' rel='nofollow ugc noopener noreferrer'>here.</a></li><li><font face='Avenir Next W01, Avenir Next W00, Avenir Next, Avenir, Helvetica Neue, Helvetica, Arial, sans-serif' size='3'>For information about the fields in this dataset go to the Data tab.</font></li></ul></div><div><font face='Avenir Next W01, Avenir Next W00, Avenir Next, Avenir, Helvetica Neue, Helvetica, Arial, sans-serif' size='3'><div>The layer is further generalised by Eagle Technology for improved performance on the web, <span style='font-family:&quot;Avenir Next W01&quot;, &quot;Avenir Next W00&quot;, &quot;Avenir Next&quot;, Avenir, &quot;Helvetica Neue&quot;, sans-serif;'>therefore it doesn't fully represent the official boundaries.</span></div><div><font style='font-family:&quot;Avenir Next W01&quot;, &quot;Avenir Next W00&quot;, &quot;Avenir Next&quot;, Avenir, &quot;Helvetica Neue&quot;, Helvetica, Arial, sans-serif;'><br /></font></div><div><font style='font-family:&quot;Avenir Next W01&quot;, &quot;Avenir Next W00&quot;, &quot;Avenir Next&quot;, Avenir, &quot;Helvetica Neue&quot;, Helvetica, Arial, sans-serif;'>The official dataset can be found on<font face='Avenir Next W01, Avenir Next W00, Avenir Next, Avenir, Helvetica Neue, Helvetica, Arial, sans-serif'> </font></font><a href='https://datafinder.stats.govt.nz/data/category/annual-boundaries/' target='_blank' rel='nofollow ugc noopener noreferrer'>https://datafinder.stats.govt.nz.</a></div></font><div><font size='3'><br /></font></div><div><div style='font-family:&quot;Avenir Next W01&quot;, &quot;Avenir Next W00&quot;, &quot;Avenir Next&quot;, Avenir, &quot;Helvetica Neue&quot;, Helvetica, Arial, sans-serif;'><font color='#2f4f4f' size='3'>This layer is offered by Eagle Technology (Official Esri Distributor). Eagle Technology offers services that can be used in the ArcGIS platform. The Content team at Eagle Technology updates the layers on a regular basis and regularly adds new content to the Living Atlas. By using this content and combining it with other data you can create new information products quickly and easily.</font></div><div style='font-family:&quot;Avenir Next W01&quot;, &quot;Avenir Next W00&quot;, &quot;Avenir Next&quot;, Avenir, &quot;Helvetica Neue&quot;, Helvetica, Arial, sans-serif;'><font color='#2f4f4f' size='3'><br /></font></div><div style='font-family:&quot;Avenir Next W01&quot;, &quot;Avenir Next W00&quot;, &quot;Avenir Next&quot;, Avenir, &quot;Helvetica Neue&quot;, Helvetica, Arial, sans-serif;'><font color='#2f4f4f' size='3'>If you have any questions or comments about the content, please let us now  at </font><font size='3'><a href='mailto:livingatlas@eagle.co.nz' style='color:rgb(0, 121, 193); text-decoration-line:none;' target='_blank' rel='nofollow ugc noopener noreferrer'>livingatlas@eagle.co.nz</a></font></div></div></div>",
			"keyword": [
				"Boundary",
				"Boundaries",
				"New zealand",
				"Statistics New Zealand",
				"StatsNZ",
				"Eagle technology",
				"Nz",
				"Content",
				"Kiwi",
				"eaglegis"
			],
			"issued": "2021-02-04T01:05:34.000Z",
			"modified": "2025-12-19T00:26:04.662Z",
			"publisher": {
				"name": "Eagle Technology Group Ltd"
			},
			"contactPoint": {
				"@type": "vcard:Contact",
				"fn": "eaglegis",
				"hasEmail": "mailto:ts@eaglegis.co.nz"
			},
			"accessLevel": "public",
			"spatial": "166.2620,-47.2230,-177.6374,-33.6045",
			"license": "https://creativecommons.org/licenses/by/4.0",
			"distribution": [
				{
					"@type": "dcat:Distribution",
					"title": "ArcGIS Hub Dataset",
					"format": "Web Page",
					"mediaType": "text/html",
					"accessURL": "https://www.pacificgeoportal.com/datasets/eaglegis::nz-regional-councils-current"
				},
				{
					"@type": "dcat:Distribution",
					"title": "ArcGIS GeoService",
					"format": "ArcGIS GeoServices REST API",
					"mediaType": "application/json",
					"accessURL": "https://services.arcgis.com/XTtANUDT8Va4DLwI/arcgis/rest/services/nz_regional_councils/FeatureServer/0"
				},
				{
					"@type": "dcat:Distribution",
					"title": "CSV",
					"format": "CSV",
					"mediaType": "text/csv",
					"accessURL": "https://www.pacificgeoportal.com/api/download/v1/items/7759fbaecd4649dea39c4ac2b07fc4ab/csv?layers=0"
				},
				{
					"@type": "dcat:Distribution",
					"title": "Shapefile",
					"format": "ZIP",
					"mediaType": "application/zip",
					"accessURL": "https://www.pacificgeoportal.com/api/download/v1/items/7759fbaecd4649dea39c4ac2b07fc4ab/shapefile?layers=0"
				},
				{
					"@type": "dcat:Distribution",
					"title": "GeoJSON",
					"format": "GeoJSON",
					"mediaType": "application/vnd.geo+json",
					"accessURL": "https://www.pacificgeoportal.com/api/download/v1/items/7759fbaecd4649dea39c4ac2b07fc4ab/geojson?layers=0"
				},
				{
					"@type": "dcat:Distribution",
					"title": "KML",
					"format": "KML",
					"mediaType": "application/vnd.google-earth.kml+xml",
					"accessURL": "https://www.pacificgeoportal.com/api/download/v1/items/7759fbaecd4649dea39c4ac2b07fc4ab/kml?layers=0"
				},
				{
					"@type": "dcat:Distribution",
					"title": "File Geodatabase",
					"format": "ZIP",
					"mediaType": "application/zip",
					"accessURL": "https://www.pacificgeoportal.com/api/download/v1/items/7759fbaecd4649dea39c4ac2b07fc4ab/filegdb?layers=0"
				},
				{
					"@type": "dcat:Distribution",
					"title": "Feature Collection",
					"format": "TXT",
					"mediaType": "text/plain",
					"accessURL": "https://www.pacificgeoportal.com/api/download/v1/items/7759fbaecd4649dea39c4ac2b07fc4ab/featureCollection?layers=0"
				},
				{
					"@type": "dcat:Distribution",
					"title": "Excel",
					"format": "XLSX",
					"mediaType": "application/vnd.ms-excel",
					"accessURL": "https://www.pacificgeoportal.com/api/download/v1/items/7759fbaecd4649dea39c4ac2b07fc4ab/excel?layers=0"
				},
				{
					"@type": "dcat:Distribution",
					"title": "GeoPackage",
					"format": "GPKG",
					"mediaType": "application/geopackage+sqlite3",
					"accessURL": "https://www.pacificgeoportal.com/api/download/v1/items/7759fbaecd4649dea39c4ac2b07fc4ab/geoPackage?layers=0"
				},
				{
					"@type": "dcat:Distribution",
					"title": "SQLite Geodatabase",
					"format": "GDB",
					"mediaType": "application/geopackage+sqlite3",
					"accessURL": "https://www.pacificgeoportal.com/api/download/v1/items/7759fbaecd4649dea39c4ac2b07fc4ab/sqlite?layers=0"
				}
			],
			"theme": [
				"geospatial"
			]
		},
		{
			"@type": "dcat:Dataset",
			"identifier": "https://www.arcgis.com/home/item.html?id=68b8459ed4224c3fac82bb3bda7dad36",
			"landingPage": "https://www.pacificgeoportal.com/maps/eaglegis::nz-dark-grey-canvas-vector-1",
			"title": "NZ Dark Grey Canvas (Vector)",
			"description": "<p><strong>Last updated</strong><br />&nbsp;</p><div>See the basemap item details&nbsp;<a target='_blank' href='https://www.arcgis.com/home/item.html?id=7aaf5b68b31b426faf8870ca7fbf1583' rel='nofollow ugc noopener noreferrer'>here</a>.&nbsp;</div><div>&nbsp;</div><div><p><strong>Projection</strong><br />New Zealand Transverse Mercator 2000 (NZTM2000).<br /><br />This vector tile layer provides a detailed basemap for New Zealand in the NZ Transverse Mercator projection. The style is based on the classic Esri Dark Gray Canvas style. This vector tile layer provides unique capabilities for customization and high-resolution display.<br /><br />This map includes highways, major roads, minor roads, railways, water features, cities, parks, landmarks, building footprints, and administrative boundaries for added context.<br /><br />&nbsp;</p><div><strong>Data sources</strong></div><div><ul><li>Land Information New Zealand<ul><li>Buildings, Parcels, Place Names, Water-bodies, Vegetation, Protected Areas, Airports, Railways &amp; Islands.</li></ul></li><li>Statistics New Zealand<ul><li>Administrative Boundaries &amp; Urban Areas</li></ul></li><li>National Institute of Water &amp; Atmospheric Research (NIWA)<ul><li>River Environment Classification</li></ul></li><li>© OpenStreetMap Contributors<ul><li>Road Centrelines, Buildings, Landuse Types, Areas of Interest and Points of Interest.</li></ul></li><li>Natural Earth<ul><li>Bathymetry &amp; Marine Labels</li></ul></li></ul></div><p>This map is offered by Eagle Technology (Official Esri Distributor). Eagle Technology offers layers and maps that can be used in the ArcGIS platform. The Content team at Eagle Technology updates the layers on a regular basis and regularly adds new content to the Living Atlas. By using this content and combining it with other data you can create new information products quickly and easily.<br /><br />If you have any questions or remarks about the content, please let us now at&nbsp;<a href='mailto:livingatlas@eagle.co.nz' target='_blank' rel='nofollow ugc noopener noreferrer'>livingatlas@eagle.co.nz</a><br /><br /><strong>Customize this Map</strong><br />&nbsp;</p><div>Because this map is delivered as a vector tile layer, users can customize the map to change its content and symbology, including fonts. Users are able to turn on and off layers and change symbols for layers.</div><div>&nbsp;</div><div>An easy way to change the style of this map is to use the Vector Basemap Style Editor:</div><div><a target='_blank' href='https://developers.arcgis.com/vector-tile-style-editor/' rel='nofollow ugc noopener noreferrer'>https://developers.arcgis.com/vector-tile-style-editor/</a></div></div>",
			"keyword": [
				"canvas",
				"community",
				"basemap",
				"NZ",
				"New Zealand",
				"Map",
				"Basemap",
				"Background",
				"Layer",
				"dark",
				"grey",
				"gray",
				"content",
				"living atlas",
				"basemaps",
				"esri_basemap",
				"esri_basemaps",
				"detailed",
				"digital map",
				"Linz",
				"current",
				"open data",
				"data sets",
				"kiwi",
				"vector",
				"vector tiles",
				"topo",
				"topo nz",
				"Eagle",
				"Eagle Technology",
				"NZTM",
				"Aotearoa",
				"eaglegis"
			],
			"issued": "2020-02-24T02:22:36.000Z",
			"modified": "2026-10-10T00:56:48.000Z",
			"publisher": {
				"name": "Eagle Technology Group Ltd"
			},
			"contactPoint": {
				"@type": "vcard:Contact",
				"fn": "eaglegis",
				"hasEmail": "mailto:ts@eaglegis.co.nz"
			},
			"accessLevel": "public",
			"spatial": "154.9133,-48.0942,180.0000,-32.7865",
			"license": "https://creativecommons.org/licenses/by/4.0",
			"distribution": [
				{
					"@type": "dcat:Distribution",
					"title": "ArcGIS Hub Dataset",
					"format": "Web Page",
					"mediaType": "text/html",
					"accessURL": "https://www.pacificgeoportal.com/maps/eaglegis::nz-dark-grey-canvas-vector-1"
				}
			],
			"theme": [
				"geospatial"
			]
		},
		{
			"@type": "dcat:Dataset",
			"identifier": "https://www.arcgis.com/home/item.html?id=cc81667709da4f6d9f356dca831ecf88",
			"landingPage": "https://www.pacificgeoportal.com/maps/eaglegis::nz-topographic-relief-vector-1",
			"title": "NZ Topographic Relief (Vector)",
			"description": "<p><strong>Last updated</strong><br />&nbsp;</p><div>See the vector basemap item details&nbsp;<a target='_blank' href='https://www.arcgis.com/home/item.html?id=734c12e9904b4a8086d2dff8582a93a1' rel='nofollow ugc noopener noreferrer'>here</a>.</div><div>See the hillshade item details <a target='_blank' href='https://www.arcgis.com/home/item.html?id=38c860f8dbd24820b2a59ccc9a3dabdb' rel='nofollow ugc noopener noreferrer'>here</a>.</div><p><br />&nbsp;</p><div><p><strong>Projection</strong><br />New Zealand Transverse Mercator 2000 (NZTM2000).<br /><br />This vector tile layer provides a detailed basemap for New Zealand in the NZ Transverse Mercator projection. The style is based on the classic Esri Topographic style. This vector tile layer provides unique capabilities for customization and high-resolution display.<br /><br />This map includes highways, major roads, minor roads, railways, water features, cities, parks, landmarks, building footprints, and administrative boundaries for added context.<br /><br />This map uses the <a target='_blank' href='https://www.arcgis.com/home/item.html?id=38c860f8dbd24820b2a59ccc9a3dabdb' rel='nofollow ugc noopener noreferrer'>NZ Hillshade layer</a>.<br /><br />&nbsp;</p><div><div><strong>Data sources</strong></div></div><div><div><ul><li>Land Information New Zealand<ul><li>Buildings, Parcels, Place Names, Water-bodies, Vegetation, Protected Areas, Airports, Railways &amp; Islands.</li></ul></li><li>Statistics New Zealand<ul><li>Administrative Boundaries &amp; Urban Areas</li></ul></li><li>National Institute of Water &amp; Atmospheric Research (NIWA)<ul><li>River Environment Classification</li></ul></li><li>© OpenStreetMap Contributors<ul><li>Road Centrelines, Buildings, Landuse Types, Areas of Interest and Points of Interest.</li></ul></li><li>Natural Earth<ul><li>Bathymetry &amp; Marine Labels</li></ul></li></ul></div></div><p>This map is offered by Eagle Technology (Official Esri Distributor). Eagle Technology offers layers and maps that can be used in the ArcGIS platform. The Content team at Eagle Technology updates the layers on a regular basis and regularly adds new content to the Living Atlas. By using this content and combining it with other data you can create new information products quickly and easily.<br /><br />If you have any questions or remarks about the content, please let us now at <a href='mailto:livingatlas@eagle.co.nz' target='_blank' rel='nofollow ugc noopener noreferrer'>livingatlas@eagle.co.nz</a><br /><br /><strong>Customize this Map</strong><br />&nbsp;</p><div>Because this map is delivered as a vector tile layer, users can customize the map to change its content and symbology, including fonts. Users are able to turn on and off layers and change symbols for layers.</div><div>&nbsp;</div><div>An easy way to change the style of this map is to use the Vector Basemap Style Editor:</div><div><a target='_blank' href='https://developers.arcgis.com/vector-tile-style-editor/' rel='nofollow ugc noopener noreferrer'>https://developers.arcgis.com/vector-tile-style-editor/</a></div></div>",
			"keyword": [
				"topographic",
				"relief",
				"hillshade",
				"community",
				"basemap",
				"NZ",
				"New Zealand",
				"Map",
				"Basemap",
				"Background",
				"Layer",
				"topography",
				"content",
				"living atlas",
				"basemaps",
				"esri_basemap",
				"esri_basemaps",
				"detailed",
				"digital map",
				"Linz",
				"current",
				"open data",
				"data sets",
				"kiwi",
				"vector",
				"vector tiles",
				"topo",
				"topo nz",
				"Eagle",
				"Eagle Technology",
				"NZTM",
				"Aotearoa",
				"eaglegis"
			],
			"issued": "2019-11-12T02:58:38.000Z",
			"modified": "2026-10-10T00:51:13.000Z",
			"publisher": {
				"name": "Eagle Technology Group Ltd"
			},
			"contactPoint": {
				"@type": "vcard:Contact",
				"fn": "eaglegis",
				"hasEmail": "mailto:ts@eaglegis.co.nz"
			},
			"accessLevel": "public",
			"spatial": "146.6403,-50.3810,180.0000,-29.6994",
			"license": "https://creativecommons.org/licenses/by/4.0",
			"distribution": [
				{
					"@type": "dcat:Distribution",
					"title": "ArcGIS Hub Dataset",
					"format": "Web Page",
					"mediaType": "text/html",
					"accessURL": "https://www.pacificgeoportal.com/maps/eaglegis::nz-topographic-relief-vector-1"
				}
			],
			"theme": [
				"geospatial"
			]
		},
		{
			"@type": "dcat:Dataset",
			"identifier": "https://www.arcgis.com/home/item.html?id=b8663956ce2a4e8d9631977ac9571ffc",
			"landingPage": "https://www.pacificgeoportal.com/maps/eaglegis::nz-navigation-vector-1",
			"title": "NZ Navigation (Vector)",
			"description": "<p><strong>Last updated</strong><br />&nbsp;</p><div>See the basemap item details&nbsp;<a target='_blank' href='https://www.arcgis.com/home/item.html?id=b052dff3628e4203856079a07d7d814c' rel='nofollow ugc noopener noreferrer'>here</a>.</div><div>&nbsp;</div><div><p><strong>Projection</strong><br />New Zealand Transverse Mercator 2000 (NZTM2000).<br /><br />This vector tile layer provides a detailed basemap for New Zealand in the NZ Transverse Mercator projection. The style is based on the classic Esri World Navigation style. This vector tile layer provides unique capabilities for customization and high-resolution display.<br /><br />This map includes highways, major roads, minor roads, railways, water features, cities, parks, landmarks, building footprints, and administrative boundaries for added context.<br /><br />&nbsp;</p><div><strong>Data sources</strong></div><div><ul><li>Land Information New Zealand<ul><li>Buildings, Parcels, Place Names, Water-bodies, Vegetation, Protected Areas, Airports, Railways &amp; Islands.</li></ul></li><li>Statistics New Zealand<ul><li>Administrative Boundaries &amp; Urban Areas</li></ul></li><li>National Institute of Water &amp; Atmospheric Research (NIWA)<ul><li>River Environment Classification</li></ul></li><li>© OpenStreetMap Contributors<ul><li>Road Centrelines, Buildings, Landuse Types, Areas of Interest and Points of Interest.</li></ul></li><li>Natural Earth<ul><li>Bathymetry &amp; Marine Labels</li></ul></li></ul></div><p>This map is offered by Eagle Technology (Official Esri Distributor). Eagle Technology offers layers and maps that can be used in the ArcGIS platform. The Content team at Eagle Technology updates the layers on a regular basis and regularly adds new content to the Living Atlas. By using this content and combining it with other data you can create new information products quickly and easily.<br /><br />If you have any questions or remarks about the content, please let us now at&nbsp;<a href='mailto:livingatlas@eagle.co.nz' target='_blank' rel='nofollow ugc noopener noreferrer'>livingatlas@eagle.co.nz</a><br /><br /><strong>Customize this Map</strong><br />&nbsp;</p><div>Because this map is delivered as a vector tile layer, users can customize the map to change its content and symbology, including fonts. Users are able to turn on and off layers and change symbols for layers.</div><div>&nbsp;</div><div>An easy way to change the style of this map is to use the Vector Basemap Style Editor:</div><div><a target='_blank' href='https://developers.arcgis.com/vector-tile-style-editor/' rel='nofollow ugc noopener noreferrer'>https://developers.arcgis.com/vector-tile-style-editor/</a></div></div>",
			"keyword": [
				"navigation",
				"community",
				"basemap",
				"NZ",
				"New Zealand",
				"Map",
				"Basemap",
				"Background",
				"Layer",
				"light",
				"content",
				"living atlas",
				"basemaps",
				"esri_basemap",
				"esri_basemaps",
				"detailed",
				"digital map",
				"Linz",
				"current",
				"open data",
				"data sets",
				"kiwi",
				"vector",
				"vector tiles",
				"topo",
				"topo nz",
				"Eagle",
				"Eagle Technology",
				"NZTM",
				"Aotearoa",
				"eaglegis"
			],
			"issued": "2020-02-24T02:24:49.000Z",
			"modified": "2026-10-10T00:51:06.000Z",
			"publisher": {
				"name": "Eagle Technology Group Ltd"
			},
			"contactPoint": {
				"@type": "vcard:Contact",
				"fn": "eaglegis",
				"hasEmail": "mailto:ts@eaglegis.co.nz"
			},
			"accessLevel": "public",
			"spatial": "163.8527,-47.6571,179.5732,-34.0089",
			"license": "https://creativecommons.org/licenses/by/4.0",
			"distribution": [
				{
					"@type": "dcat:Distribution",
					"title": "ArcGIS Hub Dataset",
					"format": "Web Page",
					"mediaType": "text/html",
					"accessURL": "https://www.pacificgeoportal.com/maps/eaglegis::nz-navigation-vector-1"
				}
			],
			"theme": [
				"geospatial"
			]
		},
		{
			"@type": "dcat:Dataset",
			"identifier": "https://www.arcgis.com/home/item.html?id=7dc5e3488b8042538dd4c774aa5ad31e",
			"landingPage": "https://www.pacificgeoportal.com/maps/eaglegis::nz-topographic-vector-1",
			"title": "NZ Topographic (Vector)",
			"description": "<div><div style='font-family:&quot;Avenir Next W01&quot;, &quot;Avenir Next W00&quot;, &quot;Avenir Next&quot;, Avenir, &quot;Helvetica Neue&quot;, sans-serif;'><span style='font-family:&quot;Avenir Next&quot;, Avenir, &quot;Helvetica Neue&quot;, Helvetica, Arial, sans-serif;'><strong>Last updated</strong></span><br /><span style='font-family:&quot;Avenir Next&quot;, Avenir, &quot;Helvetica Neue&quot;, Helvetica, Arial, sans-serif;'>See the basemap item details&nbsp;</span><a target='_blank' href='https://www.arcgis.com/home/item.html?id=e1ef3b88c1b84d23ba479c03c7938cf5' rel='nofollow ugc noopener noreferrer'>here</a><span style='font-family:&quot;Avenir Next&quot;, Avenir, &quot;Helvetica Neue&quot;, Helvetica, Arial, sans-serif;'>.</span><br /><br />&nbsp;</div><div style='font-family:&quot;Avenir Next W01&quot;, &quot;Avenir Next W00&quot;, &quot;Avenir Next&quot;, Avenir, &quot;Helvetica Neue&quot;, sans-serif;'><p><span style='font-family:&quot;Avenir Next&quot;, Avenir, &quot;Helvetica Neue&quot;, Helvetica, Arial, sans-serif;'><strong>Projection</strong></span><br /><span style='font-family:&quot;Avenir Next&quot;, Avenir, &quot;Helvetica Neue&quot;, Helvetica, Arial, sans-serif;'>New Zealand Transverse Mercator 2000 (NZTM2000).</span><br /><br /><span style='font-family:&quot;Avenir Next&quot;, Avenir, &quot;Helvetica Neue&quot;, Helvetica, Arial, sans-serif;'>This vector tile layer provides a detailed basemap for New Zealand in the NZ Transverse Mercator projection. The style is based on the classic Esri Topographic style. This vector tile layer provides unique capabilities for customization and high-resolution display.</span><br /><br /><span style='font-family:&quot;Avenir Next&quot;, Avenir, &quot;Helvetica Neue&quot;, Helvetica, Arial, sans-serif;'>This map includes highways, major roads, minor roads, railways, water features, cities, parks, landmarks, building footprints, and administrative boundaries for added context.</span><br /><br />&nbsp;</p><div style='font-family:&quot;Avenir Next&quot;, Avenir, &quot;Helvetica Neue&quot;, Helvetica, Arial, sans-serif;'><strong>Data sources</strong></div><div style='font-family:&quot;Avenir Next&quot;, Avenir, &quot;Helvetica Neue&quot;, Helvetica, Arial, sans-serif;'><ul><li>Land Information New Zealand<ul><li>Buildings, Parcels, Place Names, Water-bodies, Vegetation, Protected Areas, Airports, Railways &amp; Islands.</li></ul></li><li>Statistics New Zealand<ul><li>Administrative Boundaries &amp; Urban Areas</li></ul></li><li>National Institute of Water &amp; Atmospheric Research (NIWA)<ul><li>River Environment Classification</li></ul></li><li>© OpenStreetMap Contributors<ul><li>Road Centrelines, Buildings, Landuse Types, Areas of Interest and Points of Interest.</li></ul></li><li>Natural Earth<ul><li>Bathymetry &amp; Marine Labels</li></ul></li></ul></div><p><span style='font-family:&quot;Avenir Next&quot;, Avenir, &quot;Helvetica Neue&quot;, Helvetica, Arial, sans-serif;'>This map is offered by Eagle Technology (Official Esri Distributor). Eagle Technology offers layers and maps that can be used in the ArcGIS platform. The Content team at Eagle Technology updates the layers on a regular basis and regularly adds new content to the Living Atlas. By using this content and combining it with other data you can create new information products quickly and easily.</span><br /><br /><span style='font-family:&quot;Avenir Next&quot;, Avenir, &quot;Helvetica Neue&quot;, Helvetica, Arial, sans-serif;'>If you have any questions or remarks about the content, please let us now at&nbsp;</span><a style='font-family:&quot;Avenir Next&quot;, Avenir, &quot;Helvetica Neue&quot;, Helvetica, Arial, sans-serif;' href='mailto:livingatlas@eagle.co.nz' target='_blank' rel='nofollow ugc noopener noreferrer'>livingatlas@eagle.co.nz</a><br /><br /><span style='font-family:&quot;Avenir Next&quot;, Avenir, &quot;Helvetica Neue&quot;, Helvetica, Arial, sans-serif;'><strong>Customize this Map</strong></span><br />&nbsp;</p><div style='font-family:&quot;Avenir Next&quot;, Avenir, &quot;Helvetica Neue&quot;, Helvetica, Arial, sans-serif;'>Because this map is delivered as a vector tile layer, users can customize the map to change its content and symbology, including fonts. Users are able to turn on and off layers and change symbols for layers.</div><div style='font-family:&quot;Avenir Next&quot;, Avenir, &quot;Helvetica Neue&quot;, Helvetica, Arial, sans-serif;'>&nbsp;</div><div style='font-family:&quot;Avenir Next&quot;, Avenir, &quot;Helvetica Neue&quot;, Helvetica, Arial, sans-serif;'>An easy way to change the style of this map is to use the Vector Basemap Style Editor:</div><div style='font-family:&quot;Avenir Next&quot;, Avenir, &quot;Helvetica Neue&quot;, Helvetica, Arial, sans-serif;'><a target='_blank' href='https://developers.arcgis.com/vector-tile-style-editor/' rel='nofollow ugc noopener noreferrer'>https://developers.arcgis.com/vector-tile-style-editor/</a></div></div></div>",
			"keyword": [
				"topographic",
				"relief",
				"hillshade",
				"community",
				"basemap",
				"NZ",
				"New Zealand",
				"Map",
				"Basemap",
				"Background",
				"Layer",
				"topography",
				"content",
				"living atlas",
				"basemaps",
				"esri_basemap",
				"esri_basemaps",
				"detailed",
				"digital map",
				"Linz",
				"current",
				"open data",
				"data sets",
				"kiwi",
				"vector",
				"vector tiles",
				"eaglegis"
			],
			"issued": "2019-11-12T02:56:14.000Z",
			"modified": "2026-10-10T00:50:56.000Z",
			"publisher": {
				"name": "Eagle Technology Group Ltd"
			},
			"contactPoint": {
				"@type": "vcard:Contact",
				"fn": "eaglegis",
				"hasEmail": "mailto:ts@eaglegis.co.nz"
			},
			"accessLevel": "public",
			"spatial": "135.9300,-58.9419,180.0000,-18.5962",
			"license": "https://creativecommons.org/licenses/by/4.0",
			"distribution": [
				{
					"@type": "dcat:Distribution",
					"title": "ArcGIS Hub Dataset",
					"format": "Web Page",
					"mediaType": "text/html",
					"accessURL": "https://www.pacificgeoportal.com/maps/eaglegis::nz-topographic-vector-1"
				}
			],
			"theme": [
				"geospatial"
			]
		},
		{
			"@type": "dcat:Dataset",
			"identifier": "https://www.arcgis.com/home/item.html?id=2ef6847aa63948238da7df02970ea859",
			"landingPage": "https://www.pacificgeoportal.com/maps/eaglegis::nz-light-grey-canvas-vector-1",
			"title": "NZ Light Grey Canvas (Vector)",
			"description": "<p><strong>Last updated</strong><br />See the basemap item details&nbsp;<a target='_blank' href='https://www.arcgis.com/home/item.html?id=fed71141e42a45c49dabb30a4c2903e1' rel='nofollow ugc noopener noreferrer'>here</a>.<br /><br />&nbsp;</p><div><p><strong>Projection</strong><br />New Zealand Transverse Mercator 2000 (NZTM2000).<br /><br />This vector tile layer provides a detailed basemap for New Zealand in the NZ Transverse Mercator projection. The style is based on the classic Esri Light Gray Canvas style. This vector tile layer provides unique capabilities for customization and high-resolution display.<br /><br />This map includes highways, major roads, minor roads, railways, water features, cities, parks, landmarks, building footprints, and administrative boundaries for added context.<br /><br />&nbsp;</p><div><strong>Data sources</strong></div><div><ul><li>Land Information New Zealand<ul><li>Buildings, Parcels, Place Names, Water-bodies, Vegetation, Protected Areas, Airports, Railways &amp; Islands.</li></ul></li><li>Statistics New Zealand<ul><li>Administrative Boundaries &amp; Urban Areas</li></ul></li><li>National Institute of Water &amp; Atmospheric Research (NIWA)<ul><li>River Environment Classification</li></ul></li><li>© OpenStreetMap Contributors<ul><li>Road Centrelines, Buildings, Landuse Types, Areas of Interest and Points of Interest.</li></ul></li><li>Natural Earth<ul><li>Bathymetry &amp; Marine Labels</li></ul></li></ul></div><p>This map is offered by Eagle Technology (Official Esri Distributor). Eagle Technology offers layers and maps that can be used in the ArcGIS platform. The Content team at Eagle Technology updates the layers on a regular basis and regularly adds new content to the Living Atlas. By using this content and combining it with other data you can create new information products quickly and easily.<br /><br />If you have any questions or remarks about the content, please let us now at&nbsp;<a href='mailto:livingatlas@eagle.co.nz' target='_blank' rel='nofollow ugc noopener noreferrer'>livingatlas@eagle.co.nz</a><br /><br /><strong>Customize this Map</strong><br />&nbsp;</p><div>Because this map is delivered as a vector tile layer, users can customize the map to change its content and symbology, including fonts. Users are able to turn on and off layers and change symbols for layers.</div><div>&nbsp;</div><div>An easy way to change the style of this map is to use the Vector Basemap Style Editor:</div><div><a target='_blank' href='https://developers.arcgis.com/vector-tile-style-editor/' rel='nofollow ugc noopener noreferrer'>https://developers.arcgis.com/vector-tile-style-editor/</a></div></div>",
			"keyword": [
				"canvas",
				"community",
				"basemap",
				"NZ",
				"New Zealand",
				"Map",
				"Basemap",
				"Background",
				"Layer",
				"light",
				"grey",
				"gray",
				"content",
				"living atlas",
				"basemaps",
				"esri_basemap",
				"esri_basemaps",
				"detailed",
				"digital map",
				"Linz",
				"current",
				"open data",
				"data sets",
				"kiwi",
				"vector",
				"vector tiles",
				"topo",
				"topo nz",
				"Eagle",
				"Eagle Technology",
				"NZTM",
				"Aotearoa",
				"eaglegis"
			],
			"issued": "2020-02-24T02:23:49.000Z",
			"modified": "2026-10-10T00:50:01.000Z",
			"publisher": {
				"name": "Eagle Technology Group Ltd"
			},
			"contactPoint": {
				"@type": "vcard:Contact",
				"fn": "eaglegis",
				"hasEmail": "mailto:ts@eaglegis.co.nz"
			},
			"accessLevel": "public",
			"spatial": "163.8527,-47.6571,179.5732,-34.0089",
			"license": "https://creativecommons.org/licenses/by/4.0",
			"distribution": [
				{
					"@type": "dcat:Distribution",
					"title": "ArcGIS Hub Dataset",
					"format": "Web Page",
					"mediaType": "text/html",
					"accessURL": "https://www.pacificgeoportal.com/maps/eaglegis::nz-light-grey-canvas-vector-1"
				}
			],
			"theme": [
				"geospatial"
			]
		},
		{
			"@type": "dcat:Dataset",
			"identifier": "https://www.arcgis.com/home/item.html?id=00e8532979224167aff1a82e58c6c471&sublayer=0",
			"landingPage": "https://www.pacificgeoportal.com/datasets/eaglegis::nz-geology-2",
			"title": "NZ Geology",
			"description": "<p><strong>Last updated</strong></p><p style='background-color:rgb(255, 255, 255); border:0px solid currentcolor; box-sizing:border-box; color:rgb(74, 74, 74); font-family:&quot;Avenir Next&quot;, Avenir, &quot;Helvetica Neue&quot;, sans-serif; font-size:16px; font-style:normal; font-variant-caps:normal; font-variant-ligatures:normal; font-weight:400; letter-spacing:normal; margin:0px 0px 1rem; text-align:start; text-decoration-color:initial; text-decoration-style:initial; text-indent:0px; text-transform:none; word-spacing:0px;'>Source data was created and published in 2023</p><p style='background-color:rgb(255, 255, 255); border:0px solid currentcolor; box-sizing:border-box; color:rgb(74, 74, 74); font-family:&quot;Avenir Next&quot;, Avenir, &quot;Helvetica Neue&quot;, sans-serif; font-size:16px; font-style:normal; font-variant-caps:normal; font-variant-ligatures:normal; font-weight:400; letter-spacing:normal; margin:0px 0px 1rem; text-align:start; text-decoration-color:initial; text-decoration-style:initial; text-indent:0px; text-transform:none; word-spacing:0px;'><br /><strong>Projection</strong><br />New Zealand Transverse Mercator 2000 (NZTM2000).<br /><br /><strong>Scale/zoom levels</strong><br />&nbsp;</p><div style='margin-left:40px;'><span style='font-size:medium;'><u>Available scale levels</u></span><br />&nbsp;</div><div style='margin-left:40px;'><span style='font-size:medium;'>Level 0 - 23 (1:591,657,527 - 1:70)</span></div><div style='margin-left:40px;'><br />&nbsp;</div><div style='margin-left:40px;'><span style='font-size:medium;'><u>Cached scale levels</u></span></div><div style='margin-left:40px;'><span style='font-size:medium;'>Level 0 to level 15 (1:591,657,527 - 1:18,055)</span></div><div style='margin-left:40px;'><br />&nbsp;</div><div style='margin-left:40px;'><span style='font-size:medium;'><u>Resampled scale levels</u></span><br />&nbsp;</div><div style='margin-left:40px;'><span style='font-size:medium;'>Resampling is being used for the levels that aren't cached.</span></div><div><br />&nbsp;</div><div style='margin-left:40px;'><span style='font-size:medium;'><u>Tiling Scheme</u></span><br />&nbsp;</div><div style='margin-left:40px;'><span style='font-size:medium;'>The tiling scheme used for this service can be found </span><a target='_blank' href='https://www.arcgis.com/home/item.html?id=75d8c2aec505409ead3c07f6e89f56fb' rel='nofollow ugc noopener noreferrer'><span style='font-size:medium;'>here</span></a><span style='font-size:medium;'>.</span></div><div><br />&nbsp;</div><div><span style='font-size:medium;'><strong>About</strong></span><br />&nbsp;</div><div style='font-family:&quot;Avenir Next W01&quot;, &quot;Avenir Next W00&quot;, &quot;Avenir Next&quot;, Avenir, &quot;Helvetica Neue&quot;, Helvetica, Arial, sans-serif !important;'><span style='font-size:medium;'>These datasets are the product of the QMAP Geological Map of New Zealand Project and have been produced by GNS Science.</span><br />&nbsp;</div><div style='font-family:&quot;Avenir Next W01&quot;, &quot;Avenir Next W00&quot;, &quot;Avenir Next&quot;, Avenir, &quot;Helvetica Neue&quot;, Helvetica, Arial, sans-serif !important;'><span style='font-size:medium;'>QMAP represents the most current geological map of New Zealand at 1:250 000 scale.</span></div><div style='font-family:&quot;Avenir Next W01&quot;, &quot;Avenir Next W00&quot;, &quot;Avenir Next&quot;, Avenir, &quot;Helvetica Neue&quot;, Helvetica, Arial, sans-serif !important;'><p><br />&nbsp;</p><div><span style='font-size:medium;'>GNS Science is New Zealand's leading provider of Earth, geoscience and isotope research. More information about the QMAP Project can be found on: </span><a target='_blank' href='https://www.gns.cri.nz/qmap' rel='nofollow ugc noopener noreferrer'><span style='font-size:medium;'>https://www.gns.cri.nz/qmap</span></a></div><div>&nbsp;</div><div>The metadata of the source data can be found here: <a target='_blank' href='https://doi.org/10.21420/5XTJ-5718' rel='nofollow ugc noopener noreferrer'>https://doi.org/10.21420/5XTJ-5718</a></div><div><br />&nbsp;</div><div><div><span style='color:#2f4f4f; font-size:medium;'>This layer is offered by Eagle Technology (Official Esri Distributor). Eagle Technology offers services that can be used in the ArcGIS platform. The Content team at Eagle Technology updates the layers on a regular basis and regularly adds new content to the Living Atlas. By using this content and combining it with other data you can create new information products quickly and easily.</span></div><div><br />&nbsp;</div><div><span style='color:#2f4f4f; font-size:medium;'>If you have any questions or remarks about the content, please let us know at </span><a href='mailto:livingatlas@eagle.co.nz.' target='_blank' rel='nofollow ugc noopener noreferrer'><span style='font-size:medium;'>livingatlas@eagle.co.nz</span></a></div></div><div>&nbsp;</div></div>",
			"keyword": [
				"GNS",
				"QMap",
				"Geology",
				"NZ",
				"New Zealand",
				"QMAP",
				"esri_basemap",
				"basemap",
				"soils",
				"geology",
				"landscape",
				"hazards",
				"subsurface",
				"earth observations",
				"planning",
				"urban",
				"Kiwi",
				"Map",
				"Basemap",
				"Background",
				"Layer",
				"topographic",
				"topography",
				"content",
				"living atlas",
				"basemaps",
				"esri_basemaps",
				"detailed",
				"digital map",
				"current",
				"open data",
				"data sets"
			],
			"issued": "2020-03-24T22:48:10.000Z",
			"modified": "2026-10-09T08:57:37.000Z",
			"publisher": {
				"name": "Eagle Technology Group Ltd"
			},
			"contactPoint": {
				"@type": "vcard:Contact",
				"fn": "eaglegis",
				"hasEmail": "mailto:ts@eaglegis.co.nz"
			},
			"accessLevel": "public",
			"spatial": "130.2002,-48.5073,-157.3658,-22.3965",
			"license": "https://creativecommons.org/licenses/by/4.0",
			"distribution": [
				{
					"@type": "dcat:Distribution",
					"title": "ArcGIS Hub Dataset",
					"format": "Web Page",
					"mediaType": "text/html",
					"accessURL": "https://www.pacificgeoportal.com/datasets/eaglegis::nz-geology-2"
				},
				{
					"@type": "dcat:Distribution",
					"title": "ArcGIS GeoService",
					"format": "ArcGIS GeoServices REST API",
					"mediaType": "application/json",
					"accessURL": "https://services1.arcgisonline.co.nz/arcgis/rest/services/GNS/qmapgeology/MapServer/0"
				}
			],
			"theme": [
				"geospatial"
			]
		},
		{
			"@type": "dcat:Dataset",
			"identifier": "https://www.arcgis.com/home/item.html?id=04064aeaaee249a98ea2f536e515aea7",
			"landingPage": "https://www.pacificgeoportal.com/maps/eaglegis::nz-geology-1",
			"title": "NZ Geology",
			"description": "<div><div><span style=''><div style='font-size:17px; font-family:&quot;Avenir Next W01&quot;, &quot;Avenir Next W00&quot;, &quot;Avenir Next&quot;, Avenir, &quot;Helvetica Neue&quot;, Helvetica, Arial, sans-serif !important;'>See <a href='https://www.arcgis.com/home/item.html?id=00e8532979224167aff1a82e58c6c471' rel='nofollow ugc' target='_blank'>layer</a> for more informatio<span style='font-family:&quot;Avenir Next&quot;, &quot;Avenir&quot;, &quot;Helvetica Neue&quot;, &quot;Helvetica&quot;, &quot;Arial&quot;, sans-serif;'>n</span></div></span><br /></div></div><span style='font-weight:bold;'>Projection</span><br />New Zealand Transverse Mercator 2000 (NZTM2000).<br /><br /><span style='font-weight:bold;'>Scale/zoom levels</span><br /><div style='margin-left:40px;'><font size='3'><span style='text-decoration:underline;'>Available scale levels</span><br /></font></div><div style='margin-left:40px;'><font size='3'>Level 0 - 23 (1:591,657,527 - 1:70)</font></div><div style='margin-left:40px;'><font size='3'><span style='text-decoration:underline;'><br /></span></font></div><div style='margin-left:40px;'><font size='3'><span style='text-decoration:underline;'>Cached scale levels</span></font></div><div style='margin-left:40px;'><font size='3'><span style='text-decoration:underline;'></span>Level 0 to level 15 (1:591,657,527 - 1:18,055)</font></div><div style='margin-left:40px;'><font size='3'><span style='text-decoration:underline;'><br /></span></font></div><div style='margin-left:40px;'><font size='3'><span style='text-decoration:underline;'>Resampled scale levels</span><br /></font></div><div style='margin-left:40px;'><font size='3'>Resampling is being used for the levels that aren't cached.</font></div><div><font size='3'><span style='font-style:italic;'><br /></span></font></div><div style='margin-left:40px;'><font size='3'><span style='text-decoration:underline;'>Tiling Scheme</span><span style='font-style:italic;'><br /></span></font></div><div style='margin-left:40px;'><font size='3'>The tiling scheme used for this service can be found <a href='https://www.arcgis.com/home/item.html?id=75d8c2aec505409ead3c07f6e89f56fb' rel='nofollow ugc' target='_blank'>here</a>.</font></div><div><font size='3'><span style='font-weight:bold;'><br /></span></font></div><div><font size='3'><span style='font-weight:bold;'>About</span><br /></font></div><div style='font-family:&quot;Avenir Next W01&quot;, &quot;Avenir Next W00&quot;, &quot;Avenir Next&quot;, Avenir, &quot;Helvetica Neue&quot;, Helvetica, Arial, sans-serif !important;'><font size='3'>These datasets are the product of the QMAP Geological Map of New Zealand Project and have been produced by GNS Science.<br /></font></div><div style='font-family:&quot;Avenir Next W01&quot;, &quot;Avenir Next W00&quot;, &quot;Avenir Next&quot;, Avenir, &quot;Helvetica Neue&quot;, Helvetica, Arial, sans-serif !important;'><font size='3'>QMAP represents the most current geological map of New Zealand at 1:250 000 scale.</font></div><div style='font-family:&quot;Avenir Next W01&quot;, &quot;Avenir Next W00&quot;, &quot;Avenir Next&quot;, Avenir, &quot;Helvetica Neue&quot;, Helvetica, Arial, sans-serif !important;'><font size='3'><br /></font><div style=''><font size='3'>GNS Science is New Zealand's leading provider of Earth, geoscience and isotope research. More information about the QMAP Project can be found on: <a href='https://www.gns.cri.nz/qmap' rel='nofollow ugc' target='_blank'>https://www.gns.cri.nz/qmap</a></font></div><div style=''><font size='3'><br /></font></div><div style=''><div style=''><font color='#2f4f4f' size='3'>This layer is offered by Eagle Technology (Official Esri Distributor). Eagle Technology offers services that can be used in the ArcGIS platform. The Content team at Eagle Technology updates the layers on a regular basis and regularly adds new content to the Living Atlas. By using this content and combining it with other data you can create new information products quickly and easily.</font></div><div style=''><font color='#2f4f4f' size='3'><br /></font></div><div style=''><font size='3'><font color='#2f4f4f'>If you have any questions or remarks about the content, please let us know at </font><a href='mailto:livingatlas@eagle.co.nz.' rel='nofollow ugc' target='_blank'>livingatlas@eagle.co.nz</a></font></div></div><div><br /></div></div>",
			"keyword": [
				"GNS",
				"New Zealand",
				"NZ",
				"QMAP",
				"esri_basemap",
				"basemap",
				"soils",
				"geology",
				"landscape",
				"hazards",
				"subsurface",
				"earth observations",
				"planning",
				"urban",
				"QMap",
				"Geology",
				"Kiwi",
				"Map",
				"Basemap",
				"Background",
				"Layer",
				"topographic",
				"topography",
				"content",
				"living atlas",
				"basemaps",
				"esri_basemaps",
				"detailed",
				"digital map",
				"current",
				"open data",
				"data sets"
			],
			"issued": "2020-03-24T22:49:11.000Z",
			"modified": "2021-06-21T02:30:11.000Z",
			"publisher": {
				"name": "Eagle Technology Group Ltd"
			},
			"contactPoint": {
				"@type": "vcard:Contact",
				"fn": "eaglegis",
				"hasEmail": "mailto:ts@eaglegis.co.nz"
			},
			"accessLevel": "public",
			"spatial": "157.7939,-46.2247,180.0000,-33.2497",
			"license": "https://creativecommons.org/licenses/by/4.0",
			"distribution": [
				{
					"@type": "dcat:Distribution",
					"title": "ArcGIS Hub Dataset",
					"format": "Web Page",
					"mediaType": "text/html",
					"accessURL": "https://www.pacificgeoportal.com/maps/eaglegis::nz-geology-1"
				}
			],
			"theme": [
				"geospatial"
			]
		},
		{
			"@type": "dcat:Dataset",
			"identifier": "https://www.arcgis.com/home/item.html?id=6712602ebaa54b60a421fe7ac73eb7aa&sublayer=0",
			"landingPage": "https://www.pacificgeoportal.com/datasets/eaglegis::nz-constituencies-current",
			"title": "NZ Constituencies - Current",
			"description": "<p><span style='font-size:medium;'><font style='font-family:&quot;Avenir Next W01&quot;, &quot;Avenir Next W00&quot;, &quot;Avenir Next&quot;, Avenir, &quot;Helvetica Neue&quot;, Helvetica, Arial, sans-serif !important;'>Topicality:&nbsp;01-01-2026</font></span></p><div><p><span style='font-family:&quot;Avenir Next W01&quot;, &quot;Avenir Next W00&quot;, &quot;Avenir Next&quot;, Avenir, &quot;Helvetica Neue&quot;, Helvetica, Arial, sans-serif; font-size:medium;'>Projection: New Zealand Transverse Mercator (NZTM)</span></p><div><div style='font-family:&quot;Avenir Next W01&quot;, &quot;Avenir Next W00&quot;, &quot;Avenir Next&quot;, Avenir, &quot;Helvetica Neue&quot;, Helvetica, Arial, sans-serif !important;'><span style='font-family:Avenir Next W01, Avenir Next W00, Avenir Next, Avenir, Helvetica Neue, Helvetica, Arial, sans-serif; font-size:medium;'>This layer contains the latest set of</span><span style='font-size:medium;'> regional council constituency boundaries for 2021 as defined by the regional councils and Local Government Commission but maintained by Stats NZ (the custodian).</span><span style='font-family:Avenir Next W01, Avenir Next W00, Avenir Next, Avenir, Helvetica Neue, Helvetica, Arial, sans-serif; font-size:medium;'>&nbsp;</span></div><div><div>&nbsp;</div><div><div><span style='font-family:Avenir Next W01, Avenir Next W00, Avenir Next, Avenir, Helvetica Neue, Helvetica, Arial, sans-serif; font-size:medium;'>Constituencies are established under the Local Electoral Act 2001 and result from the division of a region for electoral purposes. If a regional council decides to have a Māori constituency, the constituencies within the council are known as general constituencies and Māori constituencies.&nbsp;&nbsp;</span></div><div>&nbsp;</div><div><span style='font-family:Avenir Next W01, Avenir Next W00, Avenir Next, Avenir, Helvetica Neue, Helvetica, Arial, sans-serif; font-size:medium;'>Constituencies are divisions of regional council areas. They are defined at meshblock level, and do not coincide with the statistical area 1 (SA1) geography or the statistical area 2 (SA2) geography. They are created, based on population, to be the voting areas within councils. Constituencies are required to reflect communities of interest. Their boundaries, so far as is practicable, coincide with those of territorial authorities or wards. The boundaries of constituencies may be reviewed before each three-yearly local government election. Regional councils must review their representation arrangements at least once every six years. The provisions for such reviews are in the Local Government Act 2002.&nbsp;</span></div><div>&nbsp;</div><div><span style='font-family:Avenir Next W01, Avenir Next W00, Avenir Next, Avenir, Helvetica Neue, Helvetica, Arial, sans-serif; font-size:medium;'>Constituencies are numbered based on their corresponding regional council. Each constituency has a unique four-digit code. The first two digits represent the regional council that the constituency lies within. The last two digits are sequential and represent the number of constituencies within a regional council. For example, the West Coast Regional Council (12) contains three constituencies, which are coded 1201, 1202, and 1203.</span></div></div></div><ul><li><span style='font-family:Avenir Next W01, Avenir Next W00, Avenir Next, Avenir, Helvetica Neue, Helvetica, Arial, sans-serif; font-size:medium;'>This layer get updated yearly with the latest boundary data.</span></li><li><span style='font-family:Avenir Next W01, Avenir Next W00, Avenir Next, Avenir, Helvetica Neue, Helvetica, Arial, sans-serif; font-size:medium;'><font style='font-family:&quot;Avenir Next W01&quot;, &quot;Avenir Next W00&quot;, &quot;Avenir Next&quot;, Avenir, &quot;Helvetica Neue&quot;, Helvetica, Arial, sans-serif;'>A layer with the full archive of the data for all the available years is available </font></span><a target='_blank' href='https://www.arcgis.com/home/item.html?id=5f373fde10f8442f81c4a3ef8a47961e' rel='nofollow ugc noopener noreferrer'>here.</a></li><li><span style='font-family:Avenir Next W01, Avenir Next W00, Avenir Next, Avenir, Helvetica Neue, Helvetica, Arial, sans-serif; font-size:medium;'>For information about the fields in this dataset go to the Data tab.</span></li></ul></div><div><div><span style='font-family:Avenir Next W01, Avenir Next W00, Avenir Next, Avenir, Helvetica Neue, Helvetica, Arial, sans-serif; font-size:medium;'>The layer is further generalised by Eagle Technology for improved performance on the web,&nbsp;</span><span style='font-family:&quot;Avenir Next W01&quot;, &quot;Avenir Next W00&quot;, &quot;Avenir Next&quot;, Avenir, &quot;Helvetica Neue&quot;, sans-serif; font-size:medium;'>therefore it doesn't fully represent the official boundaries</span><span style='font-family:&quot;Avenir Next W01&quot;, &quot;Avenir Next W00&quot;, &quot;Avenir Next&quot;, Avenir, &quot;Helvetica Neue&quot;, Helvetica, Arial, sans-serif; font-size:medium;'>.</span></div><div>&nbsp;</div><div><span style='font-family:Avenir Next W01, Avenir Next W00, Avenir Next, Avenir, Helvetica Neue, Helvetica, Arial, sans-serif; font-size:medium;'><font style='font-family:&quot;Avenir Next W01&quot;, &quot;Avenir Next W00&quot;, &quot;Avenir Next&quot;, Avenir, &quot;Helvetica Neue&quot;, Helvetica, Arial, sans-serif;'>The official dataset can be found on </font></span><a target='_blank' href='https://datafinder.stats.govt.nz/data/category/annual-boundaries/' rel='nofollow ugc noopener noreferrer'><span style='font-family:Avenir Next W01, Avenir Next W00, Avenir Next, Avenir, Helvetica Neue, Helvetica, Arial, sans-serif; font-size:medium;'>https://datafinder.stats.govt.nz.</span></a></div><div style='font-family:&quot;Avenir Next W01&quot;, &quot;Avenir Next W00&quot;, &quot;Avenir Next&quot;, Avenir, &quot;Helvetica Neue&quot;, Helvetica, Arial, sans-serif !important;'>&nbsp;</div><div style='font-family:&quot;Avenir Next W01&quot;, &quot;Avenir Next W00&quot;, &quot;Avenir Next&quot;, Avenir, &quot;Helvetica Neue&quot;, Helvetica, Arial, sans-serif !important;'><div><span style='color:#2f4f4f; font-size:medium;'>This layer is offered by Eagle Technology (Official Esri Distributor). Eagle Technology offers services that can be used in the ArcGIS platform. The Content team at Eagle Technology updates the layers on a regular basis and regularly adds new content to the Living Atlas. By using this content and combining it with other data you can create new information products quickly and easily.</span></div><div>&nbsp;</div><div><span style='color:#2f4f4f; font-size:medium;'>If you have any questions or comments about the content, please let us now&nbsp; at&nbsp;</span><a style='color:rgb(0, 121, 193); text-decoration-line:none;' href='mailto:livingatlas@eagle.co.nz' target='_blank' rel='nofollow ugc noopener noreferrer'><span style='font-size:medium;'>livingatlas@eagle.co.nz</span></a></div></div></div></div>",
			"keyword": [
				"Boundary",
				"Boundaries",
				"New zealand",
				"Statistics New Zealand",
				"StatsNZ",
				"Eagle technology",
				"Nz",
				"Content",
				"Kiwi",
				"eaglegis",
				"dr"
			],
			"issued": "2021-02-04T01:01:38.000Z",
			"modified": "2025-12-19T00:25:52.373Z",
			"publisher": {
				"name": "Eagle Technology Group Ltd"
			},
			"contactPoint": {
				"@type": "vcard:Contact",
				"fn": "eaglegis",
				"hasEmail": "mailto:ts@eaglegis.co.nz"
			},
			"accessLevel": "public",
			"spatial": "166.2620,-47.2230,-177.6189,-33.7734",
			"license": "https://creativecommons.org/licenses/by/4.0",
			"distribution": [
				{
					"@type": "dcat:Distribution",
					"title": "ArcGIS Hub Dataset",
					"format": "Web Page",
					"mediaType": "text/html",
					"accessURL": "https://www.pacificgeoportal.com/datasets/eaglegis::nz-constituencies-current"
				},
				{
					"@type": "dcat:Distribution",
					"title": "ArcGIS GeoService",
					"format": "ArcGIS GeoServices REST API",
					"mediaType": "application/json",
					"accessURL": "https://services.arcgis.com/XTtANUDT8Va4DLwI/arcgis/rest/services/nz_constituencies/FeatureServer/0"
				},
				{
					"@type": "dcat:Distribution",
					"title": "CSV",
					"format": "CSV",
					"mediaType": "text/csv",
					"accessURL": "https://www.pacificgeoportal.com/api/download/v1/items/6712602ebaa54b60a421fe7ac73eb7aa/csv?layers=0"
				},
				{
					"@type": "dcat:Distribution",
					"title": "Shapefile",
					"format": "ZIP",
					"mediaType": "application/zip",
					"accessURL": "https://www.pacificgeoportal.com/api/download/v1/items/6712602ebaa54b60a421fe7ac73eb7aa/shapefile?layers=0"
				},
				{
					"@type": "dcat:Distribution",
					"title": "GeoJSON",
					"format": "GeoJSON",
					"mediaType": "application/vnd.geo+json",
					"accessURL": "https://www.pacificgeoportal.com/api/download/v1/items/6712602ebaa54b60a421fe7ac73eb7aa/geojson?layers=0"
				},
				{
					"@type": "dcat:Distribution",
					"title": "KML",
					"format": "KML",
					"mediaType": "application/vnd.google-earth.kml+xml",
					"accessURL": "https://www.pacificgeoportal.com/api/download/v1/items/6712602ebaa54b60a421fe7ac73eb7aa/kml?layers=0"
				},
				{
					"@type": "dcat:Distribution",
					"title": "File Geodatabase",
					"format": "ZIP",
					"mediaType": "application/zip",
					"accessURL": "https://www.pacificgeoportal.com/api/download/v1/items/6712602ebaa54b60a421fe7ac73eb7aa/filegdb?layers=0"
				},
				{
					"@type": "dcat:Distribution",
					"title": "Feature Collection",
					"format": "TXT",
					"mediaType": "text/plain",
					"accessURL": "https://www.pacificgeoportal.com/api/download/v1/items/6712602ebaa54b60a421fe7ac73eb7aa/featureCollection?layers=0"
				},
				{
					"@type": "dcat:Distribution",
					"title": "Excel",
					"format": "XLSX",
					"mediaType": "application/vnd.ms-excel",
					"accessURL": "https://www.pacificgeoportal.com/api/download/v1/items/6712602ebaa54b60a421fe7ac73eb7aa/excel?layers=0"
				},
				{
					"@type": "dcat:Distribution",
					"title": "GeoPackage",
					"format": "GPKG",
					"mediaType": "application/geopackage+sqlite3",
					"accessURL": "https://www.pacificgeoportal.com/api/download/v1/items/6712602ebaa54b60a421fe7ac73eb7aa/geoPackage?layers=0"
				},
				{
					"@type": "dcat:Distribution",
					"title": "SQLite Geodatabase",
					"format": "GDB",
					"mediaType": "application/geopackage+sqlite3",
					"accessURL": "https://www.pacificgeoportal.com/api/download/v1/items/6712602ebaa54b60a421fe7ac73eb7aa/sqlite?layers=0"
				}
			],
			"theme": [
				"geospatial"
			]
		},
		{
			"@type": "dcat:Dataset",
			"identifier": "https://www.arcgis.com/home/item.html?id=f67d663afaab470982b63d0f37db0f30&sublayer=0",
			"landingPage": "https://www.pacificgeoportal.com/datasets/eaglegis::nz-community-boards-current",
			"title": "NZ Community Boards - Current",
			"description": "<font size='3' style='font-family:&quot;Avenir Next W01&quot;, &quot;Avenir Next W00&quot;, &quot;Avenir Next&quot;, Avenir, &quot;Helvetica Neue&quot;, Helvetica, Arial, sans-serif !important;'>Topicality: 01-01-2025</font><div><div style='font-size:17px; font-family:&quot;Avenir Next W01&quot;, &quot;Avenir Next W00&quot;, &quot;Avenir Next&quot;, Avenir, &quot;Helvetica Neue&quot;, Helvetica, Arial, sans-serif !important;'><font size='3'><span style='font-size:medium;'>Projection: New Zealand Transverse Mercator (NZTM)</span><br /></font></div><div style='font-family:&quot;Avenir Next W01&quot;, &quot;Avenir Next W00&quot;, &quot;Avenir Next&quot;, Avenir, &quot;Helvetica Neue&quot;, Helvetica, Arial, sans-serif !important;'><font size='3'><br /></font></div><div><div><font face='Avenir Next W01, Avenir Next W00, Avenir Next, Avenir, Helvetica Neue, Helvetica, Arial, sans-serif' size='3'>This layer contains the latest set of </font><font size='3'>Community Board boundaries as defined by the territorial authorities and Local Government \nCommission but maintained by Stats NZ. This classification includes \ncommunity boards and local boards. </font></div><div><font face='Avenir Next W01, Avenir Next W00, Avenir Next, Avenir, Helvetica Neue, Helvetica, Arial, sans-serif' size='3'><br /></font></div><div><font size='3'>Community boards and local boards provide voting representation at a community level. They are defined under the <a href='https://www.legislation.govt.nz/act/public/2002/0084/167.0/DLM170873.html' rel='nofollow ugc'>Local Government Act 2002</a> and<a href='https://www.legislation.govt.nz/act/public/2001/0035/48.0/whole.html' rel='nofollow ugc'> Local Electoral Act 2001</a>.\n Local boards were introduced as part of the new local government \narrangements for Auckland in 2010. Community boards and local boards are\n defined at meshblock level and do not coincide with the statistical \narea 1 (SA1) or statistical area 2 (SA2) geographies. </font></div><ul><li><font face='Avenir Next W01, Avenir Next W00, Avenir Next, Avenir, Helvetica Neue, Helvetica, Arial, sans-serif' size='3'>This layer gets updated yearly with the latest boundary data.<font style='font-family:&quot;Avenir Next W01&quot;, &quot;Avenir Next W00&quot;, &quot;Avenir Next&quot;, Avenir, &quot;Helvetica Neue&quot;, Helvetica, Arial, sans-serif;'> </font></font></li><li><font face='Avenir Next W01, Avenir Next W00, Avenir Next, Avenir, Helvetica Neue, Helvetica, Arial, sans-serif' size='3'><font style='font-family:&quot;Avenir Next W01&quot;, &quot;Avenir Next W00&quot;, &quot;Avenir Next&quot;, Avenir, &quot;Helvetica Neue&quot;, Helvetica, Arial, sans-serif;'>A layer with the full archive of the data for all the available years is available </font></font><a href='https://www.arcgis.com/home/item.html?id=a855671b0d884afb91be42331f469138' target='_blank' rel='nofollow ugc noopener noreferrer'>here<font size='3' style='font-family:Avenir Next W01, Avenir Next W00, Avenir Next, Avenir, Helvetica Neue, Helvetica, Arial, sans-serif;'>.</font></a></li><li><font face='Avenir Next W01, Avenir Next W00, Avenir Next, Avenir, Helvetica Neue, Helvetica, Arial, sans-serif' size='3'>For information about the fields in this dataset go to the Data tab.</font></li></ul></div><div><font face='Avenir Next W01, Avenir Next W00, Avenir Next, Avenir, Helvetica Neue, Helvetica, Arial, sans-serif' size='3'><div>The layer is further generalised by Eagle Technology for improved performance on the web, <span style='font-family:&quot;Avenir Next W01&quot;, &quot;Avenir Next W00&quot;, &quot;Avenir Next&quot;, Avenir, &quot;Helvetica Neue&quot;, sans-serif;'>therefore it doesn't fully represent the official boundaries.</span></div><div><font style='font-family:&quot;Avenir Next W01&quot;, &quot;Avenir Next W00&quot;, &quot;Avenir Next&quot;, Avenir, &quot;Helvetica Neue&quot;, Helvetica, Arial, sans-serif;'><br /></font></div><div><font style='font-family:&quot;Avenir Next W01&quot;, &quot;Avenir Next W00&quot;, &quot;Avenir Next&quot;, Avenir, &quot;Helvetica Neue&quot;, Helvetica, Arial, sans-serif;'>The official dataset can be found on<font face='Avenir Next W01, Avenir Next W00, Avenir Next, Avenir, Helvetica Neue, Helvetica, Arial, sans-serif'> </font></font><a href='https://datafinder.stats.govt.nz/data/category/annual-boundaries/' target='_blank' rel='nofollow ugc noopener noreferrer'>https://datafinder.stats.govt.nz.</a></div></font><div style='font-family:&quot;Avenir Next W01&quot;, &quot;Avenir Next W00&quot;, &quot;Avenir Next&quot;, Avenir, &quot;Helvetica Neue&quot;, Helvetica, Arial, sans-serif !important;'><font size='3'><br /></font></div><div><div style='font-family:&quot;Avenir Next W01&quot;, &quot;Avenir Next W00&quot;, &quot;Avenir Next&quot;, Avenir, &quot;Helvetica Neue&quot;, Helvetica, Arial, sans-serif !important;'><font color='#2f4f4f' size='3'>This layer is offered by Eagle Technology (Official Esri Distributor). Eagle Technology offers services that can be used in the ArcGIS platform. The Content team at Eagle Technology updates the layers on a regular basis and regularly adds new content to the Living Atlas. By using this content and combining it with other data you can create new information products quickly and easily.</font></div><div style='font-family:&quot;Avenir Next W01&quot;, &quot;Avenir Next W00&quot;, &quot;Avenir Next&quot;, Avenir, &quot;Helvetica Neue&quot;, Helvetica, Arial, sans-serif !important;'><font color='#2f4f4f' size='3'><br /></font></div><div style='font-family:&quot;Avenir Next W01&quot;, &quot;Avenir Next W00&quot;, &quot;Avenir Next&quot;, Avenir, &quot;Helvetica Neue&quot;, Helvetica, Arial, sans-serif !important;'><font color='#2f4f4f' size='3'>If you have any questions or comments about the content, please let us now  at </font><font size='3'><a href='mailto:livingatlas@eagle.co.nz' style='color:rgb(0, 121, 193); text-decoration-line:none;' target='_blank' rel='nofollow ugc noopener noreferrer'>livingatlas@eagle.co.nz</a></font></div></div></div></div>",
			"keyword": [
				"Boundary",
				"Boundaries",
				"New zealand",
				"Statistics New Zealand",
				"StatsNZ",
				"Eagle technology",
				"Nz",
				"Content",
				"Kiwi",
				"eaglegis",
				"dr"
			],
			"issued": "2021-02-04T01:00:40.000Z",
			"modified": "2025-12-19T00:25:48.774Z",
			"publisher": {
				"name": "Eagle Technology Group Ltd"
			},
			"contactPoint": {
				"@type": "vcard:Contact",
				"fn": "eaglegis",
				"hasEmail": "mailto:ts@eaglegis.co.nz"
			},
			"accessLevel": "public",
			"spatial": "166.2620,-47.2230,-177.6374,-33.6045",
			"license": "https://creativecommons.org/licenses/by/4.0",
			"distribution": [
				{
					"@type": "dcat:Distribution",
					"title": "ArcGIS Hub Dataset",
					"format": "Web Page",
					"mediaType": "text/html",
					"accessURL": "https://www.pacificgeoportal.com/datasets/eaglegis::nz-community-boards-current"
				},
				{
					"@type": "dcat:Distribution",
					"title": "ArcGIS GeoService",
					"format": "ArcGIS GeoServices REST API",
					"mediaType": "application/json",
					"accessURL": "https://services.arcgis.com/XTtANUDT8Va4DLwI/arcgis/rest/services/nz_community_boards/FeatureServer/0"
				},
				{
					"@type": "dcat:Distribution",
					"title": "CSV",
					"format": "CSV",
					"mediaType": "text/csv",
					"accessURL": "https://www.pacificgeoportal.com/api/download/v1/items/f67d663afaab470982b63d0f37db0f30/csv?layers=0"
				},
				{
					"@type": "dcat:Distribution",
					"title": "Shapefile",
					"format": "ZIP",
					"mediaType": "application/zip",
					"accessURL": "https://www.pacificgeoportal.com/api/download/v1/items/f67d663afaab470982b63d0f37db0f30/shapefile?layers=0"
				},
				{
					"@type": "dcat:Distribution",
					"title": "GeoJSON",
					"format": "GeoJSON",
					"mediaType": "application/vnd.geo+json",
					"accessURL": "https://www.pacificgeoportal.com/api/download/v1/items/f67d663afaab470982b63d0f37db0f30/geojson?layers=0"
				},
				{
					"@type": "dcat:Distribution",
					"title": "KML",
					"format": "KML",
					"mediaType": "application/vnd.google-earth.kml+xml",
					"accessURL": "https://www.pacificgeoportal.com/api/download/v1/items/f67d663afaab470982b63d0f37db0f30/kml?layers=0"
				},
				{
					"@type": "dcat:Distribution",
					"title": "File Geodatabase",
					"format": "ZIP",
					"mediaType": "application/zip",
					"accessURL": "https://www.pacificgeoportal.com/api/download/v1/items/f67d663afaab470982b63d0f37db0f30/filegdb?layers=0"
				},
				{
					"@type": "dcat:Distribution",
					"title": "Feature Collection",
					"format": "TXT",
					"mediaType": "text/plain",
					"accessURL": "https://www.pacificgeoportal.com/api/download/v1/items/f67d663afaab470982b63d0f37db0f30/featureCollection?layers=0"
				},
				{
					"@type": "dcat:Distribution",
					"title": "Excel",
					"format": "XLSX",
					"mediaType": "application/vnd.ms-excel",
					"accessURL": "https://www.pacificgeoportal.com/api/download/v1/items/f67d663afaab470982b63d0f37db0f30/excel?layers=0"
				},
				{
					"@type": "dcat:Distribution",
					"title": "GeoPackage",
					"format": "GPKG",
					"mediaType": "application/geopackage+sqlite3",
					"accessURL": "https://www.pacificgeoportal.com/api/download/v1/items/f67d663afaab470982b63d0f37db0f30/geoPackage?layers=0"
				},
				{
					"@type": "dcat:Distribution",
					"title": "SQLite Geodatabase",
					"format": "GDB",
					"mediaType": "application/geopackage+sqlite3",
					"accessURL": "https://www.pacificgeoportal.com/api/download/v1/items/f67d663afaab470982b63d0f37db0f30/sqlite?layers=0"
				}
			],
			"theme": [
				"geospatial"
			]
		},
		{
			"@type": "dcat:Dataset",
			"identifier": "https://www.arcgis.com/home/item.html?id=2effe91b31fc40d39434c35491e844c5&sublayer=0",
			"landingPage": "https://www.pacificgeoportal.com/datasets/eaglegis::nz-school-enrolment-zones",
			"title": "NZ School Enrolment Zones",
			"description": "<div><span style='font-size:medium;'>Last updated: 16 September 2026</span></div><div><span style='font-size:medium;'>Data date: 14 July 2026</span></div><div>&nbsp;</div><div><span style='font-size:medium;'>Projection: New Zealand Transverse Mercator (NZTM)</span></div><div><div><div><div style='font-family:&quot;Avenir Next W01&quot;, &quot;Avenir Next W00&quot;, &quot;Avenir Next&quot;, Avenir, &quot;Helvetica Neue&quot;, Helvetica, Arial, sans-serif;'>&nbsp;</div><div style='font-family:&quot;Avenir Next W01&quot;, &quot;Avenir Next W00&quot;, &quot;Avenir Next&quot;, Avenir, &quot;Helvetica Neue&quot;, Helvetica, Arial, sans-serif;'><span style='font-size:medium;'>This layer is based on the dataset Enrolment Scheme Home Zones retrieved from the Ministry of Education. It contains&nbsp;</span><span style='font-family:&quot;Avenir Next W01&quot;, &quot;Avenir Next W00&quot;, &quot;Avenir Next&quot;, Avenir, &quot;Helvetica Neue&quot;, sans-serif; font-size:medium;'>contains the NZ School Enrolment Zone boundaries by the Ministry of Education.&nbsp;This version contains the zones for all education institution types&nbsp;</span><span style='font-size:medium;'>and has been created for map creation/cartographic purposes and does not fully represent the official full extent boundaries.</span></div></div><div style='font-family:&quot;Avenir Next W01&quot;, &quot;Avenir Next W00&quot;, &quot;Avenir Next&quot;, Avenir, &quot;Helvetica Neue&quot;, Helvetica, Arial, sans-serif;'>&nbsp;</div><div style='font-family:&quot;Avenir Next W01&quot;, &quot;Avenir Next W00&quot;, &quot;Avenir Next&quot;, Avenir, &quot;Helvetica Neue&quot;, Helvetica, Arial, sans-serif;'><span style='font-size:medium;'>This layer contains all the institution types. If you only want to show a specific (set) of institution types, simply&nbsp;</span><a style='font-family:&quot;Avenir LT W01 35 Light&quot;, &quot;Avenir Next&quot;, Avenir, &quot;Helvetica Neue&quot;, Helvetica, Arial, sans-serif;' target='_blank' href='https://doc.arcgis.com/en/arcgis-online/create-maps/apply-filters.htm' rel='nofollow ugc noopener noreferrer'><span style='font-size:medium;'>apply a filter</span></a><span style='font-size:medium;'>.</span></div><div style='font-family:&quot;Avenir Next W01&quot;, &quot;Avenir Next W00&quot;, &quot;Avenir Next&quot;, Avenir, &quot;Helvetica Neue&quot;, Helvetica, Arial, sans-serif;'>&nbsp;</div><div style='font-family:&quot;Avenir Next W01&quot;, &quot;Avenir Next W00&quot;, &quot;Avenir Next&quot;, Avenir, &quot;Helvetica Neue&quot;, Helvetica, Arial, sans-serif;'><span style='font-size:medium;'>The layer is generalised by Eagle Technology for improved performance on the web,&nbsp;therefore it doesn't fully represent the official boundaries.</span><br />&nbsp;&nbsp;</div><p><span style='font-size:medium;'><span>An Enrolment Scheme Home Zone is a means of limiting the roll to prevent overcrowding at a school, and enables the Ministry of Education to make best use of the current accommodation at schools in the surrounding area.&nbsp;&nbsp;Each enrolment scheme must contain a home zone with clearly defined boundaries. Students who live in the home zone have an absolute right to enrol at the school. (source:&nbsp;</span></span><a target='_blank' href='https://www.educationcounts.govt.nz/data-services/collecting-information/school-enrolment-zones' rel='nofollow ugc noopener noreferrer'><span style='font-size:medium;'>https://www.educationcounts.govt.nz</span></a><span style='color:#000000; font-size:medium;'>).</span><br />&nbsp;&nbsp;</p></div><div><div style='font-family:&quot;Avenir Next W01&quot;, &quot;Avenir Next W00&quot;, &quot;Avenir Next&quot;, Avenir, &quot;Helvetica Neue&quot;, Helvetica, Arial, sans-serif;'><span style='font-size:medium;'>This layer contains the following attributes (</span><a target='_blank' href='https://www.arcgis.com/home/item.html?id=2effe91b31fc40d39434c35491e844c5#data' rel='nofollow ugc noopener noreferrer'><span style='font-size:medium;'>see data tab</span></a><span style='font-size:medium;'>):</span></div><div><ul><li><span style='font-size:medium;'>School ID</span></li><li><span style='font-size:medium;'>School name</span></li><li><span style='font-size:medium;'>Institution type</span></li><li><span style='font-size:medium;'>Office</span></li><li><span style='font-size:medium;'>Approval date</span></li><li><span style='font-size:medium;'>Effective date</span></li></ul></div></div><div><span style='color:rgb(47,79,79); font-family:&quot;Avenir Next W01&quot;, &quot;Avenir Next W00&quot;, &quot;Avenir Next&quot;, Avenir, &quot;Helvetica Neue&quot;, Helvetica, Arial, sans-serif; font-size:medium;'>This layer is offered by Eagle Technology (Official Esri Distributor). Eagle Technology offers services that can be used in the ArcGIS platform. The Content team at Eagle Technology updates the layers on a regular basis and regularly adds new content to the Living Atlas. By using this content and combining it with other data you can create new information products quickly and easily.</span><br />&nbsp;&nbsp;</div><div><div style='font-family:&quot;Avenir Next W01&quot;, &quot;Avenir Next W00&quot;, &quot;Avenir Next&quot;, Avenir, &quot;Helvetica Neue&quot;, sans-serif;'><div style='margin-bottom:3.1rem;'><div><div style='display:inherit; max-width:100%; word-wrap:break-word;'><div style='font-family:&quot;Avenir Next W01&quot;, &quot;Avenir Next W00&quot;, &quot;Avenir Next&quot;, Avenir, &quot;Helvetica Neue&quot;, Helvetica, Arial, sans-serif !important;'><span style='color:#2f4f4f; font-size:medium;'>If you have any questions or comments about the content, please let us now&nbsp; at </span><a href='mailto:livingatlas@eagle.co.nz.' target='_blank' rel='nofollow ugc noopener noreferrer'><span style='font-size:medium;'>livingatlas@eagle.co.nz</span></a><span style='font-size:medium;'>.</span></div></div></div></div></div></div></div>",
			"keyword": [
				"boundaries",
				"Boundary",
				"New Zealand",
				"Territorial Authorities",
				"Councils",
				"Boundaries",
				"Council",
				"Region",
				"data",
				"dataset",
				"Eagle Technology",
				"open",
				"layer",
				"web",
				"web layer",
				"service",
				"map",
				"map layer",
				"NZ",
				"Content",
				"Kiwi",
				"municipalities",
				"border",
				"boundary",
				"city",
				"council",
				"demography",
				"area",
				"School",
				"Schools",
				"School zone",
				"zone",
				"enrolment",
				"scheme",
				"home enrolment scheme",
				"secondary",
				"primary",
				"contributing",
				"full primary",
				"composite",
				"intermediate",
				"schoolzones",
				"school zones",
				"schoolzones nz",
				"eaglegis",
				"dr"
			],
			"issued": "2018-09-12T00:08:28.000Z",
			"modified": "2026-09-16T22:25:25.337Z",
			"publisher": {
				"name": "Eagle Technology Group Ltd"
			},
			"contactPoint": {
				"@type": "vcard:Contact",
				"fn": "eaglegis",
				"hasEmail": "mailto:ts@eaglegis.co.nz"
			},
			"accessLevel": "public",
			"spatial": "174.7262,-36.9390,174.7513,-36.9231",
			"license": "https://creativecommons.org/licenses/by/3.0",
			"distribution": [
				{
					"@type": "dcat:Distribution",
					"title": "ArcGIS Hub Dataset",
					"format": "Web Page",
					"mediaType": "text/html",
					"accessURL": "https://www.pacificgeoportal.com/datasets/eaglegis::nz-school-enrolment-zones"
				},
				{
					"@type": "dcat:Distribution",
					"title": "ArcGIS GeoService",
					"format": "ArcGIS GeoServices REST API",
					"mediaType": "application/json",
					"accessURL": "https://services.arcgis.com/XTtANUDT8Va4DLwI/arcgis/rest/services/NZ_School_Zone_boundaries/FeatureServer/0"
				},
				{
					"@type": "dcat:Distribution",
					"title": "CSV",
					"format": "CSV",
					"mediaType": "text/csv",
					"accessURL": "https://www.pacificgeoportal.com/api/download/v1/items/2effe91b31fc40d39434c35491e844c5/csv?layers=0"
				},
				{
					"@type": "dcat:Distribution",
					"title": "Shapefile",
					"format": "ZIP",
					"mediaType": "application/zip",
					"accessURL": "https://www.pacificgeoportal.com/api/download/v1/items/2effe91b31fc40d39434c35491e844c5/shapefile?layers=0"
				},
				{
					"@type": "dcat:Distribution",
					"title": "GeoJSON",
					"format": "GeoJSON",
					"mediaType": "application/vnd.geo+json",
					"accessURL": "https://www.pacificgeoportal.com/api/download/v1/items/2effe91b31fc40d39434c35491e844c5/geojson?layers=0"
				},
				{
					"@type": "dcat:Distribution",
					"title": "KML",
					"format": "KML",
					"mediaType": "application/vnd.google-earth.kml+xml",
					"accessURL": "https://www.pacificgeoportal.com/api/download/v1/items/2effe91b31fc40d39434c35491e844c5/kml?layers=0"
				},
				{
					"@type": "dcat:Distribution",
					"title": "File Geodatabase",
					"format": "ZIP",
					"mediaType": "application/zip",
					"accessURL": "https://www.pacificgeoportal.com/api/download/v1/items/2effe91b31fc40d39434c35491e844c5/filegdb?layers=0"
				},
				{
					"@type": "dcat:Distribution",
					"title": "Feature Collection",
					"format": "TXT",
					"mediaType": "text/plain",
					"accessURL": "https://www.pacificgeoportal.com/api/download/v1/items/2effe91b31fc40d39434c35491e844c5/featureCollection?layers=0"
				},
				{
					"@type": "dcat:Distribution",
					"title": "Excel",
					"format": "XLSX",
					"mediaType": "application/vnd.ms-excel",
					"accessURL": "https://www.pacificgeoportal.com/api/download/v1/items/2effe91b31fc40d39434c35491e844c5/excel?layers=0"
				},
				{
					"@type": "dcat:Distribution",
					"title": "GeoPackage",
					"format": "GPKG",
					"mediaType": "application/geopackage+sqlite3",
					"accessURL": "https://www.pacificgeoportal.com/api/download/v1/items/2effe91b31fc40d39434c35491e844c5/geoPackage?layers=0"
				},
				{
					"@type": "dcat:Distribution",
					"title": "SQLite Geodatabase",
					"format": "GDB",
					"mediaType": "application/geopackage+sqlite3",
					"accessURL": "https://www.pacificgeoportal.com/api/download/v1/items/2effe91b31fc40d39434c35491e844c5/sqlite?layers=0"
				}
			],
			"theme": [
				"geospatial"
			]
		},
		{
			"@type": "dcat:Dataset",
			"identifier": "https://www.arcgis.com/home/item.html?id=4f0cb6eb82ea4a12a3a749067b6ee1fd&sublayer=0",
			"landingPage": "https://www.pacificgeoportal.com/datasets/eaglegis::nz-subdivisions-current",
			"title": "NZ Subdivisions - Current",
			"description": "<p><span style='font-size:medium;'><font style='font-family:&quot;Avenir Next W01&quot;, &quot;Avenir Next W00&quot;, &quot;Avenir Next&quot;, Avenir, &quot;Helvetica Neue&quot;, Helvetica, Arial, sans-serif !important;'>Topicality:&nbsp;01-01-2026</font></span></p><div><p><span style='font-size:medium;'><font style='font-family:&quot;Avenir Next W01&quot;, &quot;Avenir Next W00&quot;, &quot;Avenir Next&quot;, Avenir, &quot;Helvetica Neue&quot;, Helvetica, Arial, sans-serif !important; font-size:17px;'>Projection: New Zealand Transverse Mercator (NZTM)</font></span></p><div style='font-family:&quot;Avenir Next W01&quot;, &quot;Avenir Next W00&quot;, &quot;Avenir Next&quot;, Avenir, &quot;Helvetica Neue&quot;, Helvetica, Arial, sans-serif !important; font-size:17px;'><span style='font-family:Avenir Next W01, Avenir Next W00, Avenir Next, Avenir, Helvetica Neue, Helvetica, Arial, sans-serif; font-size:medium;'>This layer contains the latest set of the </span><span style='font-family:&quot;Avenir Next W01&quot;, &quot;Avenir Next W00&quot;, &quot;Avenir Next&quot;, Avenir, &quot;Helvetica Neue&quot;, sans-serif; font-size:medium;'>Territorial Authority Subdivision boundaries</span><span style='font-family:&quot;Avenir Next W01&quot;, &quot;Avenir Next W00&quot;, &quot;Avenir Next&quot;, Avenir, &quot;Helvetica Neue&quot;, Helvetica, Arial, sans-serif; font-size:medium;'> </span><span style='font-size:medium;'>as defined by the regional councils and Local Government Commission but maintained by Stats NZ (the custodian).</span><span style='font-family:Avenir Next W01, Avenir Next W00, Avenir Next, Avenir, Helvetica Neue, Helvetica, Arial, sans-serif; font-size:medium;'>&nbsp;</span></div><div style='font-family:&quot;Avenir Next W01&quot;, &quot;Avenir Next W00&quot;, &quot;Avenir Next&quot;, Avenir, &quot;Helvetica Neue&quot;, Helvetica, Arial, sans-serif !important; font-size:17px;'>&nbsp;</div><div><div><span style='font-family:Avenir Next W01, Avenir Next W00, Avenir Next, Avenir, Helvetica Neue, Helvetica, Arial, sans-serif; font-size:medium;'>Subdivisions are set up under the Local Government Act 2002 and Local Electoral Act 2001. A subdivision is a division of a community or local board area for electoral purposes.</span></div><div>&nbsp;</div><div><span style='font-family:Avenir Next W01, Avenir Next W00, Avenir Next, Avenir, Helvetica Neue, Helvetica, Arial, sans-serif; font-size:medium;'>Subdivisions are defined at meshblock level, and do not coincide with the&nbsp; statistical area 1 (SA1) geography or the statistical area 2 (SA2) geography. A&nbsp; number of territorial authorities do not have subdivisions, and if they do, the&nbsp; subdivisions do not necessarily cover the whole territorial authority area.&nbsp; Subdivisions nest within community or local boards. Where a community or&nbsp; local board is divided into subdivisions all of the community or local board area&nbsp; must be included in a subdivision.</span><br />&nbsp;</div><div><span style='font-family:Avenir Next W01, Avenir Next W00, Avenir Next, Avenir, Helvetica Neue, Helvetica, Arial, sans-serif; font-size:medium;'>Subdivisions are numbered based on their corresponding territorial authority. Each subdivision has a unique five-digit number. The first three digits refer to the territorial authority that the subdivision lies within. The following two digits are sequential, and represent the number of subdivisions within the territorial authority. For example, Southland District (073) has two subdivisions numbered 07301 and 07302. The rest of the district is not represented by a subdivision and is coded 07399 (Area Outside Subdivision).</span></div><div><ul><li><span style='font-family:Avenir Next W01, Avenir Next W00, Avenir Next, Avenir, Helvetica Neue, Helvetica, Arial, sans-serif; font-size:medium;'>This layer gets updated yearly with the latest boundary data.</span></li><li><span style='font-family:Avenir Next W01, Avenir Next W00, Avenir Next, Avenir, Helvetica Neue, Helvetica, Arial, sans-serif; font-size:medium;'><font style='font-family:&quot;Avenir Next W01&quot;, &quot;Avenir Next W00&quot;, &quot;Avenir Next&quot;, Avenir, &quot;Helvetica Neue&quot;, Helvetica, Arial, sans-serif;'>A layer with the full archive of the data for all the available years is available </font></span><a target='_blank' href='https://www.arcgis.com/home/item.html?id=725ccdca733d49268ff6a707d20cf14e' rel='nofollow ugc noopener noreferrer'><span style='font-family:Avenir Next W01, Avenir Next W00, Avenir Next, Avenir, Helvetica Neue, Helvetica, Arial, sans-serif; font-size:medium;'>here.</span></a></li><li><span style='font-family:Avenir Next W01, Avenir Next W00, Avenir Next, Avenir, Helvetica Neue, Helvetica, Arial, sans-serif; font-size:medium;'>For information about the fields in this dataset go to the Data tab.</span></li></ul><div><span style='font-family:Avenir Next W01, Avenir Next W00, Avenir Next, Avenir, Helvetica Neue, Helvetica, Arial, sans-serif; font-size:medium;'>The layer is further generalised by Eagle Technology for improved performance on the web,&nbsp;</span><span style='font-family:&quot;Avenir Next W01&quot;, &quot;Avenir Next W00&quot;, &quot;Avenir Next&quot;, Avenir, &quot;Helvetica Neue&quot;, sans-serif; font-size:medium;'>therefore it doesn't fully represent the official boundaries.</span></div><div>&nbsp;</div><div><span style='font-family:Avenir Next W01, Avenir Next W00, Avenir Next, Avenir, Helvetica Neue, Helvetica, Arial, sans-serif; font-size:medium;'><font style='font-family:&quot;Avenir Next W01&quot;, &quot;Avenir Next W00&quot;, &quot;Avenir Next&quot;, Avenir, &quot;Helvetica Neue&quot;, Helvetica, Arial, sans-serif;'>The official dataset can be found on </font></span><a target='_blank' href='https://datafinder.stats.govt.nz/data/category/annual-boundaries/' rel='nofollow ugc noopener noreferrer'><span style='font-family:Avenir Next W01, Avenir Next W00, Avenir Next, Avenir, Helvetica Neue, Helvetica, Arial, sans-serif; font-size:medium;'>https://datafinder.stats.govt.nz.</span></a></div><div style='font-size:17px;'>&nbsp;</div><div style='font-size:17px;'><div><span style='color:#2f4f4f; font-family:Avenir Next W01, Avenir Next W00, Avenir Next, Avenir, Helvetica Neue, Helvetica, Arial, sans-serif; font-size:medium;'>This layer is offered by Eagle Technology (Official Esri Distributor). Eagle Technology offers services that can be used in the ArcGIS platform. The Content team at Eagle Technology updates the layers on a regular basis and regularly adds new content to the Living Atlas. By using this content and combining it with other data you can create new information products quickly and easily.</span></div><div>&nbsp;</div><div><span style='color:#2f4f4f; font-family:Avenir Next W01, Avenir Next W00, Avenir Next, Avenir, Helvetica Neue, Helvetica, Arial, sans-serif; font-size:medium;'>If you have any questions or comments about the content, please let us now&nbsp; at&nbsp;</span><a style='color:rgb(0, 121, 193); text-decoration-line:none;' href='mailto:livingatlas@eagle.co.nz' target='_blank' rel='nofollow ugc noopener noreferrer'><span style='font-family:Avenir Next W01, Avenir Next W00, Avenir Next, Avenir, Helvetica Neue, Helvetica, Arial, sans-serif; font-size:medium;'>livingatlas@eagle.co.nz</span></a></div></div></div></div></div>",
			"keyword": [
				"Boundary",
				"Boundaries",
				"New zealand",
				"Statistics New Zealand",
				"StatsNZ",
				"Eagle technology",
				"Nz",
				"Content",
				"Kiwi",
				"eaglegis",
				"dr"
			],
			"issued": "2021-02-04T01:09:01.000Z",
			"modified": "2025-12-19T00:26:17.500Z",
			"publisher": {
				"name": "Eagle Technology Group Ltd"
			},
			"contactPoint": {
				"@type": "vcard:Contact",
				"fn": "eaglegis",
				"hasEmail": "mailto:ts@eaglegis.co.nz"
			},
			"accessLevel": "public",
			"spatial": "166.2620,-47.2230,-177.6189,-33.7734",
			"license": "https://creativecommons.org/licenses/by/4.0",
			"distribution": [
				{
					"@type": "dcat:Distribution",
					"title": "ArcGIS Hub Dataset",
					"format": "Web Page",
					"mediaType": "text/html",
					"accessURL": "https://www.pacificgeoportal.com/datasets/eaglegis::nz-subdivisions-current"
				},
				{
					"@type": "dcat:Distribution",
					"title": "ArcGIS GeoService",
					"format": "ArcGIS GeoServices REST API",
					"mediaType": "application/json",
					"accessURL": "https://services.arcgis.com/XTtANUDT8Va4DLwI/arcgis/rest/services/nz_subdivisions/FeatureServer/0"
				},
				{
					"@type": "dcat:Distribution",
					"title": "CSV",
					"format": "CSV",
					"mediaType": "text/csv",
					"accessURL": "https://www.pacificgeoportal.com/api/download/v1/items/4f0cb6eb82ea4a12a3a749067b6ee1fd/csv?layers=0"
				},
				{
					"@type": "dcat:Distribution",
					"title": "Shapefile",
					"format": "ZIP",
					"mediaType": "application/zip",
					"accessURL": "https://www.pacificgeoportal.com/api/download/v1/items/4f0cb6eb82ea4a12a3a749067b6ee1fd/shapefile?layers=0"
				},
				{
					"@type": "dcat:Distribution",
					"title": "GeoJSON",
					"format": "GeoJSON",
					"mediaType": "application/vnd.geo+json",
					"accessURL": "https://www.pacificgeoportal.com/api/download/v1/items/4f0cb6eb82ea4a12a3a749067b6ee1fd/geojson?layers=0"
				},
				{
					"@type": "dcat:Distribution",
					"title": "KML",
					"format": "KML",
					"mediaType": "application/vnd.google-earth.kml+xml",
					"accessURL": "https://www.pacificgeoportal.com/api/download/v1/items/4f0cb6eb82ea4a12a3a749067b6ee1fd/kml?layers=0"
				},
				{
					"@type": "dcat:Distribution",
					"title": "File Geodatabase",
					"format": "ZIP",
					"mediaType": "application/zip",
					"accessURL": "https://www.pacificgeoportal.com/api/download/v1/items/4f0cb6eb82ea4a12a3a749067b6ee1fd/filegdb?layers=0"
				},
				{
					"@type": "dcat:Distribution",
					"title": "Feature Collection",
					"format": "TXT",
					"mediaType": "text/plain",
					"accessURL": "https://www.pacificgeoportal.com/api/download/v1/items/4f0cb6eb82ea4a12a3a749067b6ee1fd/featureCollection?layers=0"
				},
				{
					"@type": "dcat:Distribution",
					"title": "Excel",
					"format": "XLSX",
					"mediaType": "application/vnd.ms-excel",
					"accessURL": "https://www.pacificgeoportal.com/api/download/v1/items/4f0cb6eb82ea4a12a3a749067b6ee1fd/excel?layers=0"
				},
				{
					"@type": "dcat:Distribution",
					"title": "GeoPackage",
					"format": "GPKG",
					"mediaType": "application/geopackage+sqlite3",
					"accessURL": "https://www.pacificgeoportal.com/api/download/v1/items/4f0cb6eb82ea4a12a3a749067b6ee1fd/geoPackage?layers=0"
				},
				{
					"@type": "dcat:Distribution",
					"title": "SQLite Geodatabase",
					"format": "GDB",
					"mediaType": "application/geopackage+sqlite3",
					"accessURL": "https://www.pacificgeoportal.com/api/download/v1/items/4f0cb6eb82ea4a12a3a749067b6ee1fd/sqlite?layers=0"
				}
			],
			"theme": [
				"geospatial"
			]
		},
		{
			"@type": "dcat:Dataset",
			"identifier": "https://www.arcgis.com/home/item.html?id=30279c32565f4056b898e57551a441b7&sublayer=0",
			"landingPage": "https://www.pacificgeoportal.com/datasets/eaglegis::nz-schools-directory",
			"title": "NZ Schools Directory",
			"description": "<div style='font-family:&quot;Avenir Next W01&quot;, &quot;Avenir Next W00&quot;, &quot;Avenir Next&quot;, Avenir, &quot;Helvetica Neue&quot;, Helvetica, Arial, sans-serif !important; font-size:17px;'><div><div style='font-family:&quot;Avenir Next W01&quot;, &quot;Avenir Next W00&quot;, &quot;Avenir Next&quot;, Avenir, &quot;Helvetica Neue&quot;, Helvetica, Arial, sans-serif !important; font-size:17px;'><span style='color:#000000; font-size:medium;'>Topicality: Updated Daily through </span><a target='_blank' href='https://doc.arcgis.com/en/data-pipelines/latest/get-started/about-data-pipelines.htm' rel='nofollow ugc noopener noreferrer'><span style='color:#000000;'>ArcGIS Data Pipelines</span></a></div><div><span style='color:#000000; font-size:medium;'>Projection: New Zealand Transverse Mercator (NZTM)</span></div><p><br /><span style='color:#000000; font-size:medium;'><span>This layer contains schools in New Zealand sourced from the Ministry of Education. This layer shows the location of schools, address information and key figures.</span></span></p></div><div><br />&nbsp;</div><div><span style='color:#000000; font-size:medium;'><span>The source data and metadata about the attributes can be found </span></span><a target='_blank' href='https://www.educationcounts.govt.nz/data-services/directories/api-new-zealand-schools' rel='nofollow ugc noopener noreferrer'><span style='color:#000000; font-size:medium;'><span>here</span></span></a><span style='color:#000000; font-size:medium;'><span>. If you would like to update the details for a school please email </span></span><a href='mailto:information.officer@education.govt.nz?subject=Information%20enquiry.&amp;Body=%0D%0A%0D%0A%0D%0AYou%20have%20received%20the%20above%20enquiry%20from%20Education%20Counts%20regarding%20the%20below%20webpage.%0D%0A%0D%0ATitle:%20New Zealand Schools.%0D%0A%0D%0ALink%20on%20Education%20Counts:%20https://www.educationcounts.govt.nz/data-services/directories/list-of-nz-schools' target='_blank' rel='nofollow ugc noopener noreferrer'><span style='color:#000000; font-size:medium;'><span>education.officer@education.govt.nz</span></span></a><span style='color:#000000; font-size:medium;'><span>.</span></span></div><div><br />&nbsp;</div><div><span style='color:#000000; font-size:medium;'><span>As of August 2024, the following fields have been deprecated by the source:</span></span></div><div><ul><li><span style='color:#000000; font-size:medium;'><span>Urban Area</span></span></li><li><span style='color:#000000; font-size:medium;'><span>Area Unit</span></span></li></ul></div><div><span style='color:#000000; font-size:medium;'>The following fields have been added by the source:</span></div><div><ul><li><span style='color:#000000; font-size:medium;'>Urban Rural Indicator</span></li><li><span style='color:#000000; font-size:medium;'><font style='background-color:rgb(255, 255, 255);'>KME Peak Body</font></span></li><li><span style='background-color:rgb(255,255,255); color:#000000; font-family:&quot;Avenir Next W01&quot;, &quot;Avenir Next W00&quot;, &quot;Avenir Next&quot;, Avenir, &quot;Helvetica Neue&quot;, sans-serif; font-size:16px;'><span style='text-wrap:nowrap;'>Takiwā</span></span><br />&nbsp;</li><li><span style='background-color:rgb(255,255,255); color:#000000; font-family:&quot;Avenir Next W01&quot;, &quot;Avenir Next W00&quot;, &quot;Avenir Next&quot;, Avenir, &quot;Helvetica Neue&quot;, sans-serif; font-size:16px;'><span style='text-wrap:nowrap;'>Statistical Area 2 Code</span></span></li><li><span style='background-color:rgb(255,255,255); color:#000000; font-family:&quot;Avenir Next W01&quot;, &quot;Avenir Next W00&quot;, &quot;Avenir Next&quot;, Avenir, &quot;Helvetica Neue&quot;, sans-serif; font-size:16px;'><span style='text-wrap:nowrap;'>Statistical Area 2 Description</span></span></li><li><span style='background-color:rgb(255,255,255); color:#000000; font-family:&quot;Avenir Next W01&quot;, &quot;Avenir Next W00&quot;, &quot;Avenir Next&quot;, Avenir, &quot;Helvetica Neue&quot;, sans-serif; font-size:16px;'><span style='text-wrap:nowrap;'>Enrolment Scheme</span></span></li><li><span style='background-color:rgb(255,255,255); color:#000000; font-family:&quot;Avenir Next W01&quot;, &quot;Avenir Next W00&quot;, &quot;Avenir Next&quot;, Avenir, &quot;Helvetica Neue&quot;, sans-serif; font-size:16px;'><span style='text-wrap:nowrap;'>EQi Index</span></span></li><li><span style='background-color:rgb(255,255,255); color:#000000; font-family:&quot;Avenir Next W01&quot;, &quot;Avenir Next W00&quot;, &quot;Avenir Next&quot;, Avenir, &quot;Helvetica Neue&quot;, sans-serif; font-size:16px;'><span style='text-wrap:nowrap;'>Language of instruction</span></span></li><li><span style='background-color:rgb(255,255,255); color:#000000; font-family:&quot;Avenir Next W01&quot;, &quot;Avenir Next W00&quot;, &quot;Avenir Next&quot;, Avenir, &quot;Helvetica Neue&quot;, sans-serif; font-size:16px;'><span style='text-wrap:nowrap;'>Boarding Facilities</span></span></li><li><span style='background-color:rgb(255,255,255); color:#000000; font-family:&quot;Avenir Next W01&quot;, &quot;Avenir Next W00&quot;, &quot;Avenir Next&quot;, Avenir, &quot;Helvetica Neue&quot;, sans-serif; font-size:16px;'><span style='text-wrap:nowrap;'>Cohort Entry</span></span></li><li><span style='background-color:rgb(255,255,255); color:#000000; font-family:&quot;Avenir Next W01&quot;, &quot;Avenir Next W00&quot;, &quot;Avenir Next&quot;, Avenir, &quot;Helvetica Neue&quot;, sans-serif; font-size:16px;'><span style='text-wrap:nowrap;'>Status</span></span></li><li><span style='background-color:rgb(255,255,255); color:#000000; font-family:&quot;Avenir Next W01&quot;, &quot;Avenir Next W00&quot;, &quot;Avenir Next&quot;, Avenir, &quot;Helvetica Neue&quot;, sans-serif; font-size:16px;'><span style='text-wrap:nowrap;'>Date School Opened</span></span></li></ul></div><div><span style='color:#000000; font-size:medium;'>This layer is offered by Eagle Technology (Official Esri Distributor). Eagle Technology offers services that can be used in the ArcGIS platform. The Content team at Eagle Technology updates the layers on a regular basis and regularly adds new content to the Living Atlas. By using this content and combining it with other data you can create new information products quickly and easily.</span></div><div><br />&nbsp;</div><div><span style='color:#000000; font-size:medium;'>If you have any questions or comments about the content, please let us know at </span><a style='text-decoration-line:none;' href='mailto:livingatlas@eagle.co.nz' target='_blank' rel='nofollow ugc noopener noreferrer'><span style='color:#000000; font-size:medium;'>livingatlas@eagle.co.nz</span></a><span style='color:#000000; font-size:medium;'>.</span></div></div>",
			"keyword": [
				"Schools",
				"School",
				"New Zealand",
				"NZ",
				"Kiwi",
				"Education",
				"student",
				"students",
				"teachers",
				"teacher",
				"eaglegis",
				"dr"
			],
			"issued": "2020-03-25T01:58:59.000Z",
			"modified": "2026-11-11T05:15:53.882Z",
			"publisher": {
				"name": "Eagle Technology Group Ltd"
			},
			"contactPoint": {
				"@type": "vcard:Contact",
				"fn": "eaglegis",
				"hasEmail": "mailto:ts@eaglegis.co.nz"
			},
			"accessLevel": "public",
			"spatial": "167.5760,-46.8742,-177.6361,-34.1580",
			"license": "<span style='font-family:&quot;Avenir Next W01&quot;, &quot;Avenir Next W00&quot;, &quot;Avenir Next&quot;, Avenir, &quot;Helvetica Neue&quot;, sans-serif; font-size:17px;'><font size='3'>By using this layer you conform to the Eagle Technology web services terms of use.</font></span><ul><li><font size='3'>Fair Use</font></li><li><font size='3'>Use in combination with ArcGIS software</font></li><li><font size='3'>The data is sourced from third parties. </font></li><li><font size='3'>Eagle Technology gives no warranties in relation to the web services.</font></li></ul><font size='3'><i>Contains data sourced from the <a href='https://www.educationcounts.govt.nz/directories' target='_blank' rel='nofollow ugc noopener noreferrer'>Minstry of Education</a>.</i><span style='color:rgb(0, 121, 193);'><span style='color:rgb(76, 76, 76);'><span style='font-style:italic;'></span></span><br /></span></font>",
			"distribution": [
				{
					"@type": "dcat:Distribution",
					"title": "ArcGIS Hub Dataset",
					"format": "Web Page",
					"mediaType": "text/html",
					"accessURL": "https://www.pacificgeoportal.com/datasets/eaglegis::nz-schools-directory"
				},
				{
					"@type": "dcat:Distribution",
					"title": "ArcGIS GeoService",
					"format": "ArcGIS GeoServices REST API",
					"mediaType": "application/json",
					"accessURL": "https://services.arcgis.com/XTtANUDT8Va4DLwI/arcgis/rest/services/Schools_Directory_New_Zealand/FeatureServer/0"
				},
				{
					"@type": "dcat:Distribution",
					"title": "CSV",
					"format": "CSV",
					"mediaType": "text/csv",
					"accessURL": "https://www.pacificgeoportal.com/api/download/v1/items/30279c32565f4056b898e57551a441b7/csv?layers=0"
				},
				{
					"@type": "dcat:Distribution",
					"title": "Shapefile",
					"format": "ZIP",
					"mediaType": "application/zip",
					"accessURL": "https://www.pacificgeoportal.com/api/download/v1/items/30279c32565f4056b898e57551a441b7/shapefile?layers=0"
				},
				{
					"@type": "dcat:Distribution",
					"title": "GeoJSON",
					"format": "GeoJSON",
					"mediaType": "application/vnd.geo+json",
					"accessURL": "https://www.pacificgeoportal.com/api/download/v1/items/30279c32565f4056b898e57551a441b7/geojson?layers=0"
				},
				{
					"@type": "dcat:Distribution",
					"title": "KML",
					"format": "KML",
					"mediaType": "application/vnd.google-earth.kml+xml",
					"accessURL": "https://www.pacificgeoportal.com/api/download/v1/items/30279c32565f4056b898e57551a441b7/kml?layers=0"
				},
				{
					"@type": "dcat:Distribution",
					"title": "File Geodatabase",
					"format": "ZIP",
					"mediaType": "application/zip",
					"accessURL": "https://www.pacificgeoportal.com/api/download/v1/items/30279c32565f4056b898e57551a441b7/filegdb?layers=0"
				},
				{
					"@type": "dcat:Distribution",
					"title": "Feature Collection",
					"format": "TXT",
					"mediaType": "text/plain",
					"accessURL": "https://www.pacificgeoportal.com/api/download/v1/items/30279c32565f4056b898e57551a441b7/featureCollection?layers=0"
				},
				{
					"@type": "dcat:Distribution",
					"title": "Excel",
					"format": "XLSX",
					"mediaType": "application/vnd.ms-excel",
					"accessURL": "https://www.pacificgeoportal.com/api/download/v1/items/30279c32565f4056b898e57551a441b7/excel?layers=0"
				},
				{
					"@type": "dcat:Distribution",
					"title": "GeoPackage",
					"format": "GPKG",
					"mediaType": "application/geopackage+sqlite3",
					"accessURL": "https://www.pacificgeoportal.com/api/download/v1/items/30279c32565f4056b898e57551a441b7/geoPackage?layers=0"
				},
				{
					"@type": "dcat:Distribution",
					"title": "SQLite Geodatabase",
					"format": "GDB",
					"mediaType": "application/geopackage+sqlite3",
					"accessURL": "https://www.pacificgeoportal.com/api/download/v1/items/30279c32565f4056b898e57551a441b7/sqlite?layers=0"
				}
			],
			"theme": [
				"geospatial"
			]
		},
		{
			"@type": "dcat:Dataset",
			"identifier": "https://www.arcgis.com/home/item.html?id=cfc4e4be1e6d4c09a0d8f0a25601efd9",
			"landingPage": "https://www.pacificgeoportal.com/maps/eaglegis::nz-dsm-hillshade",
			"title": "NZ DSM Hillshade",
			"description": "<p><strong>This layer is updated as new elevation data is available.</strong><br /><br /><strong>Projection</strong><br />New Zealand Transverse Mercator 2000 (NZTM2000).</p><div><br />The New Zealand Hillshade DSM is a cached layer that visualizes New Zealand's Digital Surface Model as a Multi-Directional Hillshade. This layer can be used in combination with other New Zealand basemaps. In the map viewer, by using the layer blending options, this layer can be combined with other layers.&nbsp;</div><div>&nbsp;</div><div>The hillshade layer uses the publicly available 1m elevation data. Only for regions where high resolution DSM is available has this layer coverage. This layer will be regularly updated as more high resolution elevation data become available by Land Information New Zealand.</div><div>&nbsp;</div><div>The data in this layer is the same as the data in the New Zealand Elevation layer, except for datasets that don't have equivalent DSM. More information about this data can be found in the <a target='_blank' href='https://www.arcgis.com/home/item.html?id=1db3f4f7fd3d4ca3ba61c38d7f58fbf7' rel='nofollow ugc noopener noreferrer'>NZ Elevation metadata layer</a>.</div><p><br />&nbsp;</p><div>This service is offered by Eagle Technology (Official Esri Distributor). Eagle Technology offers layers and maps that can be used in the ArcGIS platform. The Content team at Eagle Technology updates the layers on a regular basis and regularly adds new content to the Living Atlas. By using this content and combining it with other data you can create new information products quickly and easily.<br /><br />If you have any questions or remarks about the content, please let us now at <a href='mailto:livingatlas@eagle.co.nz' target='_blank' rel='nofollow ugc noopener noreferrer'>livingatlas@eagle.co.nz</a><br />&nbsp;</div>",
			"keyword": [
				"aotearoa",
				"nz",
				"new zealand",
				"hillshade",
				"cached",
				"nztm",
				"digital",
				"elevation",
				"model",
				"multi-directional",
				"topo",
				"topography",
				"eaglegis",
				"dsm",
				"digital surface model"
			],
			"issued": "2022-08-26T22:46:03.000Z",
			"modified": "2026-09-28T04:30:12.000Z",
			"publisher": {
				"name": "Eagle Technology Group Ltd"
			},
			"contactPoint": {
				"@type": "vcard:Contact",
				"fn": "eaglegis",
				"hasEmail": "mailto:ts@eaglegis.co.nz"
			},
			"accessLevel": "public",
			"spatial": "103.7188,-52.0884,-151.3220,-6.1552",
			"license": "https://creativecommons.org/licenses/by/4.0",
			"distribution": [
				{
					"@type": "dcat:Distribution",
					"title": "ArcGIS Hub Dataset",
					"format": "Web Page",
					"mediaType": "text/html",
					"accessURL": "https://www.pacificgeoportal.com/maps/eaglegis::nz-dsm-hillshade"
				},
				{
					"@type": "dcat:Distribution",
					"title": "ArcGIS GeoService",
					"format": "ArcGIS GeoServices REST API",
					"mediaType": "application/json",
					"accessURL": "https://tiles.arcgis.com/tiles/XTtANUDT8Va4DLwI/arcgis/rest/services/nz_elevation_hillshade_dsm/MapServer"
				}
			],
			"theme": [
				"geospatial"
			]
		},
		{
			"@type": "dcat:Dataset",
			"identifier": "https://www.arcgis.com/home/item.html?id=4a664f6f5281444192fe7824fc8f325c",
			"landingPage": "https://www.pacificgeoportal.com/maps/eaglegis::nz-imagery-metadata-1",
			"title": "NZ Imagery Metadata",
			"description": "<div><span>This map shows the Metadata of the sources of the </span><a target='_blank' href='https://www.arcgis.com/home/item.html?id=d284729222d04a3cb548cfe27716ea43' rel='nofollow ugc noopener noreferrer'><span>New Zealand Imagery Map</span></a><span>. The coverage of the high resolution imagery exceeds 95% of New Zealand.&nbsp;</span><br />&nbsp;</div><div>The metadata layer can be found <a target='_blank' href='https://www.arcgis.com/home/item.html?id=3c6385368e87442bb5025851d65b5159' rel='nofollow ugc noopener noreferrer'>here</a>.</div><div>&nbsp;&nbsp;</div><div><span><strong>Metadata</strong></span></div><div><span>Click on the map to see the Imagery used for that location. Where available the metadata will give information about the source, resolution, spatial accuracy, flying season and year of capture.</span><br />&nbsp;&nbsp;</div><div><span style='font-size:medium;'><strong>About the NZ Imagery map</strong></span><br />&nbsp;</div><div style='font-family:&quot;Avenir Next W01&quot;, &quot;Avenir Next W00&quot;, &quot;Avenir Next&quot;, Avenir, &quot;Helvetica Neue&quot;, Helvetica, Arial, sans-serif !important; font-size:17px;'><span style='font-family:&quot;Avenir LT W01 35 Light&quot;, &quot;Avenir Next&quot;, Avenir, &quot;Helvetica Neue&quot;, Helvetica, Arial, sans-serif; font-size:medium;'>The New Zealand Imagery map is created by Eagle Technology and uses the best available publicly owned high resolution imagery.</span></div><div style='font-family:&quot;Avenir Next W01&quot;, &quot;Avenir Next W00&quot;, &quot;Avenir Next&quot;, Avenir, &quot;Helvetica Neue&quot;, Helvetica, Arial, sans-serif !important; font-size:17px;'>&nbsp;</div><div style='font-family:&quot;Avenir Next W01&quot;, &quot;Avenir Next W00&quot;, &quot;Avenir Next&quot;, Avenir, &quot;Helvetica Neue&quot;, Helvetica, Arial, sans-serif !important; font-size:17px;'><span style='font-family:&quot;Avenir LT W01 35 Light&quot;, &quot;Avenir Next&quot;, Avenir, &quot;Helvetica Neue&quot;, Helvetica, Arial, sans-serif; font-size:medium;'>The map combines high resolution imagery (0.075m - 1.25m) that covers around 95% of New Zealand with the New Zealand 10m Aerial Imagery. The 10m imagery is used for the smaller scales for a more consistent map and for areas where no high resolution imagery is available. This map is updated regularly with the latest high resolution imagery.</span><br />&nbsp;&nbsp;</div><div><div style='font-family:&quot;Avenir Next W01&quot;, &quot;Avenir Next W00&quot;, &quot;Avenir Next&quot;, Avenir, &quot;Helvetica Neue&quot;, Helvetica, Arial, sans-serif;'><span style='color:#2f4f4f; font-size:medium;'>This layer is offered by Eagle Technology (Official Esri Distributor). Eagle Technology offers services that can be used in the ArcGIS platform. The Content team at Eagle Technology updates the layers on a regular basis and regularly adds new content to the Living Atlas. By using this content and combining it with other data you can create new information products quickly and easily.</span></div><div style='font-family:&quot;Avenir Next W01&quot;, &quot;Avenir Next W00&quot;, &quot;Avenir Next&quot;, Avenir, &quot;Helvetica Neue&quot;, Helvetica, Arial, sans-serif;'>&nbsp;</div><div style='font-family:&quot;Avenir Next W01&quot;, &quot;Avenir Next W00&quot;, &quot;Avenir Next&quot;, Avenir, &quot;Helvetica Neue&quot;, Helvetica, Arial, sans-serif;'><span style='color:#2f4f4f; font-size:medium;'>If you have any questions or remarks about the content, please let us know at </span><a href='mailto:livingatlas@eagle.co.nz.' target='_blank' rel='nofollow ugc noopener noreferrer'><span style='font-size:medium;'>livingatlas@eagle.co.nz</span></a></div></div>",
			"keyword": [
				"NZ",
				"Imagery",
				"Metadata",
				"imagery",
				"new zealand",
				"linz",
				"taranaki",
				"Horizons",
				"Wellington",
				"manawatu",
				"canterbury",
				"nz",
				"baseimagery",
				"esri_basemap",
				"basemap",
				"landcover",
				"landscape",
				"agriculture",
				"earth observations",
				"people",
				"urban",
				"planning",
				"public",
				"accessibility",
				"transportation",
				"infrastructure",
				"transit",
				"places",
				"boundaries",
				"New Zealand",
				"Map",
				"Basemap",
				"Background",
				"Layer",
				"topographic",
				"topography",
				"content",
				"living atlas",
				"basemaps",
				"esri_basemaps",
				"detailed",
				"digital map",
				"Linz",
				"current",
				"open data",
				"data sets",
				"Kiwi",
				"eaglegis"
			],
			"issued": "2021-03-17T02:36:17.000Z",
			"modified": "2026-09-16T22:58:21.000Z",
			"publisher": {
				"name": "Eagle Technology Group Ltd"
			},
			"contactPoint": {
				"@type": "vcard:Contact",
				"fn": "eaglegis",
				"hasEmail": "mailto:ts@eaglegis.co.nz"
			},
			"accessLevel": "public",
			"spatial": "-180.0000,-50.9046,180.0000,-30.3944",
			"license": "https://creativecommons.org/licenses/by/4.0",
			"distribution": [
				{
					"@type": "dcat:Distribution",
					"title": "ArcGIS Hub Dataset",
					"format": "Web Page",
					"mediaType": "text/html",
					"accessURL": "https://www.pacificgeoportal.com/maps/eaglegis::nz-imagery-metadata-1"
				}
			],
			"theme": [
				"geospatial"
			]
		},
		{
			"@type": "dcat:Dataset",
			"identifier": "https://www.arcgis.com/home/item.html?id=3c6385368e87442bb5025851d65b5159&sublayer=0",
			"landingPage": "https://www.pacificgeoportal.com/datasets/eaglegis::nz-imagery-metadata-2",
			"title": "NZ Imagery Metadata",
			"description": "<div><span>This Layer shows the Metadata of the sources of the </span><a target='_blank' href='https://www.arcgis.com/home/item.html?id=d284729222d04a3cb548cfe27716ea43' rel='nofollow ugc noopener noreferrer'><span>New Zealand Imagery Map</span></a><span>. The coverage of the high resolution imagery exceeds 95% of New Zealand.&nbsp;</span></div><div>&nbsp;</div><div><span>A webmap with the Imagery and Metadata layer combined can found </span><a target='_blank' href='https://www.arcgis.com/home/item.html?id=4a664f6f5281444192fe7824fc8f325c' rel='nofollow ugc noopener noreferrer'><span>here</span></a><span>.</span><br />&nbsp;&nbsp;</div><div><span><strong>Metadata</strong></span></div><div><span>Click on the map to see the Imagery used for that location. Where available the metadata will give information about the source, resolution, spatial accuracy, flying season and year of capture.</span><br />&nbsp;&nbsp;</div><div><span style='font-size:medium;'><strong>About the NZ Imagery map</strong></span><br />&nbsp;</div><div style='font-family:&quot;Avenir Next W01&quot;, &quot;Avenir Next W00&quot;, &quot;Avenir Next&quot;, Avenir, &quot;Helvetica Neue&quot;, Helvetica, Arial, sans-serif !important; font-size:17px;'><span style='font-family:&quot;Avenir LT W01 35 Light&quot;, &quot;Avenir Next&quot;, Avenir, &quot;Helvetica Neue&quot;, Helvetica, Arial, sans-serif; font-size:medium;'>The New Zealand Imagery map is created by Eagle Technology and uses the best available publicly owned high resolution imagery.</span></div><div style='font-family:&quot;Avenir Next W01&quot;, &quot;Avenir Next W00&quot;, &quot;Avenir Next&quot;, Avenir, &quot;Helvetica Neue&quot;, Helvetica, Arial, sans-serif !important; font-size:17px;'>&nbsp;</div><div style='font-family:&quot;Avenir Next W01&quot;, &quot;Avenir Next W00&quot;, &quot;Avenir Next&quot;, Avenir, &quot;Helvetica Neue&quot;, Helvetica, Arial, sans-serif !important; font-size:17px;'><span style='font-family:&quot;Avenir LT W01 35 Light&quot;, &quot;Avenir Next&quot;, Avenir, &quot;Helvetica Neue&quot;, Helvetica, Arial, sans-serif; font-size:medium;'>The map combines high resolution imagery (0.075m - 1.25m) that covers around 95% of New Zealand with the New Zealand 10m Aerial Imagery. The 10m imagery is used for the smaller scales for a more consistent map and for areas where no high resolution imagery is available. This map is updated regularly with the latest high resolution imagery.</span><br />&nbsp;&nbsp;</div><div><div style='font-family:&quot;Avenir Next W01&quot;, &quot;Avenir Next W00&quot;, &quot;Avenir Next&quot;, Avenir, &quot;Helvetica Neue&quot;, Helvetica, Arial, sans-serif;'><span style='color:#2f4f4f; font-size:medium;'>This layer is offered by Eagle Technology (Official Esri Distributor). Eagle Technology offers services that can be used in the ArcGIS platform. The Content team at Eagle Technology updates the layers on a regular basis and regularly adds new content to the Living Atlas. By using this content and combining it with other data you can create new information products quickly and easily.</span></div><div style='font-family:&quot;Avenir Next W01&quot;, &quot;Avenir Next W00&quot;, &quot;Avenir Next&quot;, Avenir, &quot;Helvetica Neue&quot;, Helvetica, Arial, sans-serif;'>&nbsp;</div><div style='font-family:&quot;Avenir Next W01&quot;, &quot;Avenir Next W00&quot;, &quot;Avenir Next&quot;, Avenir, &quot;Helvetica Neue&quot;, Helvetica, Arial, sans-serif;'><span style='color:#2f4f4f; font-size:medium;'>If you have any questions or remarks about the content, please let us know at </span><a href='mailto:livingatlas@eagle.co.nz.' target='_blank' rel='nofollow ugc noopener noreferrer'><span style='font-size:medium;'>livingatlas@eagle.co.nz</span></a></div></div>",
			"keyword": [
				"NZ",
				"Imagery",
				"Metadata",
				"imagery",
				"new zealand",
				"linz",
				"taranaki",
				"Horizons",
				"Wellington",
				"manawatu",
				"canterbury",
				"nz",
				"baseimagery",
				"esri_basemap",
				"basemap",
				"landcover",
				"landscape",
				"agriculture",
				"earth observations",
				"people",
				"urban",
				"planning",
				"public",
				"accessibility",
				"transportation",
				"infrastructure",
				"transit",
				"places",
				"boundaries",
				"New Zealand",
				"Map",
				"Basemap",
				"Background",
				"Layer",
				"topographic",
				"topography",
				"content",
				"living atlas",
				"basemaps",
				"esri_basemaps",
				"detailed",
				"digital map",
				"Linz",
				"current",
				"open data",
				"data sets",
				"Kiwi",
				"eaglegis"
			],
			"issued": "2020-03-24T22:48:30.000Z",
			"modified": "2026-09-16T22:58:16.000Z",
			"publisher": {
				"name": "Eagle Technology Group Ltd"
			},
			"contactPoint": {
				"@type": "vcard:Contact",
				"fn": "eaglegis",
				"hasEmail": "mailto:ts@eaglegis.co.nz"
			},
			"accessLevel": "public",
			"spatial": "165.4643,-52.4518,-177.8511,-29.2238",
			"license": "https://creativecommons.org/licenses/by/4.0",
			"distribution": [
				{
					"@type": "dcat:Distribution",
					"title": "ArcGIS Hub Dataset",
					"format": "Web Page",
					"mediaType": "text/html",
					"accessURL": "https://www.pacificgeoportal.com/datasets/eaglegis::nz-imagery-metadata-2"
				},
				{
					"@type": "dcat:Distribution",
					"title": "ArcGIS GeoService",
					"format": "ArcGIS GeoServices REST API",
					"mediaType": "application/json",
					"accessURL": "https://services1.arcgisonline.co.nz/arcgis/rest/services/Imagery/newzealand/MapServer/0"
				},
				{
					"@type": "dcat:Distribution",
					"title": "CSV",
					"format": "CSV",
					"mediaType": "text/csv",
					"accessURL": "https://www.pacificgeoportal.com/api/download/v1/items/3c6385368e87442bb5025851d65b5159/csv?layers=0"
				},
				{
					"@type": "dcat:Distribution",
					"title": "Shapefile",
					"format": "ZIP",
					"mediaType": "application/zip",
					"accessURL": "https://www.pacificgeoportal.com/api/download/v1/items/3c6385368e87442bb5025851d65b5159/shapefile?layers=0"
				},
				{
					"@type": "dcat:Distribution",
					"title": "GeoJSON",
					"format": "GeoJSON",
					"mediaType": "application/vnd.geo+json",
					"accessURL": "https://www.pacificgeoportal.com/api/download/v1/items/3c6385368e87442bb5025851d65b5159/geojson?layers=0"
				},
				{
					"@type": "dcat:Distribution",
					"title": "KML",
					"format": "KML",
					"mediaType": "application/vnd.google-earth.kml+xml",
					"accessURL": "https://www.pacificgeoportal.com/api/download/v1/items/3c6385368e87442bb5025851d65b5159/kml?layers=0"
				}
			],
			"theme": [
				"geospatial"
			]
		},
		{
			"@type": "dcat:Dataset",
			"identifier": "https://www.arcgis.com/home/item.html?id=d284729222d04a3cb548cfe27716ea43&sublayer=0",
			"landingPage": "https://www.pacificgeoportal.com/datasets/eaglegis::nz-imagery-2",
			"title": "NZ Imagery",
			"description": "<div><span style='font-family:&quot;Avenir Next W01&quot;, &quot;Avenir Next W00&quot;, &quot;Avenir Next&quot;, Avenir, &quot;Helvetica Neue&quot;, sans-serif; font-size:medium;'><font style='font-family:&quot;Avenir Next W01&quot;, &quot;Avenir Next W00&quot;, &quot;Avenir Next&quot;, Avenir, &quot;Helvetica Neue&quot;, Helvetica, Arial, sans-serif !important;'><strong>Currency</strong></font></span></div><div><span style='font-family:&quot;Avenir Next W01&quot;, &quot;Avenir Next W00&quot;, &quot;Avenir Next&quot;, Avenir, &quot;Helvetica Neue&quot;, sans-serif; font-size:medium;'><font style='font-family:&quot;Avenir Next W01&quot;, &quot;Avenir Next W00&quot;, &quot;Avenir Next&quot;, Avenir, &quot;Helvetica Neue&quot;, Helvetica, Arial, sans-serif !important;'>This basemap is updated as new Imagery data is available</font></span></div><div><br />&nbsp;</div><div><span style='font-family:&quot;Avenir Next W01&quot;, &quot;Avenir Next W00&quot;, &quot;Avenir Next&quot;, Avenir, &quot;Helvetica Neue&quot;, sans-serif; font-size:medium;'><font style='font-family:&quot;Avenir Next W01&quot;, &quot;Avenir Next W00&quot;, &quot;Avenir Next&quot;, Avenir, &quot;Helvetica Neue&quot;, Helvetica, Arial, sans-serif !important;'><strong>Projection</strong></font></span></div><div style='font-family:&quot;Avenir Next W01&quot;, &quot;Avenir Next W00&quot;, &quot;Avenir Next&quot;, Avenir, &quot;Helvetica Neue&quot;, Helvetica, Arial, sans-serif !important;'><span style='font-family:&quot;Avenir Next W01&quot;, &quot;Avenir Next W00&quot;, &quot;Avenir Next&quot;, Avenir, &quot;Helvetica Neue&quot;, sans-serif; font-size:medium;'>New Zealand Transverse Mercator 2000 (NZTM2000).</span><br />&nbsp;</div><div style='font-family:&quot;Avenir Next W01&quot;, &quot;Avenir Next W00&quot;, &quot;Avenir Next&quot;, Avenir, &quot;Helvetica Neue&quot;, Helvetica, Arial, sans-serif !important;'><br />&nbsp;</div><p><span style='font-size:medium;'><strong>Scale/zoom levels:</strong></span><br />&nbsp;</p><div style='margin-left:40px;'><span style='font-size:medium;'><u>Available scale levels</u></span><br />&nbsp;</div><div style='margin-left:40px;'><span style='font-size:medium;'>Level 0 - 23 (1:591,657,527 - 1:70)</span></div><div style='margin-left:40px;'><br />&nbsp;</div><div style='margin-left:40px;'><span style='font-size:medium;'><u>Cached scale levels</u></span><br />&nbsp;</div><div style='margin-left:40px;'><span style='font-size:medium;'>Depending on the available source imagery.</span></div><div style='margin-left:40px;'><span style='font-size:medium;'>For 0.1m resolution and higher source imagery: Level 0 - 21 (1:591,657,527 - 1:282)</span></div><div style='margin-left:40px;'><span style='font-size:medium;'>For lower resolution source imagery: Level 0 - 19 (1:591,657,527 - 1:1128)</span></div><div style='margin-left:40px;'><br />&nbsp;</div><div style='margin-left:40px;'><span style='font-size:medium;'><u>Resampled scale levels</u></span><br />&nbsp;</div><div style='margin-left:40px;'><span style='font-size:medium;'>Resampling is being used for the levels that aren't cached.</span><br />&nbsp;</div><div>&nbsp;</div><div><span style='font-size:medium;'><strong>About</strong></span></div><div style='font-family:&quot;Avenir Next W01&quot;, &quot;Avenir Next W00&quot;, &quot;Avenir Next&quot;, Avenir, &quot;Helvetica Neue&quot;, Helvetica, Arial, sans-serif !important; font-size:17px;'><span style='font-family:&quot;Avenir LT W01 35 Light&quot;, &quot;Avenir Next&quot;, Avenir, &quot;Helvetica Neue&quot;, Helvetica, Arial, sans-serif; font-size:medium;'>The New Zealand Imagery map is created by Eagle Technology and uses the best available publicly owned high resolution imagery.</span></div><div style='font-family:&quot;Avenir Next W01&quot;, &quot;Avenir Next W00&quot;, &quot;Avenir Next&quot;, Avenir, &quot;Helvetica Neue&quot;, Helvetica, Arial, sans-serif !important; font-size:17px;'><br />&nbsp;</div><div style='font-family:&quot;Avenir Next W01&quot;, &quot;Avenir Next W00&quot;, &quot;Avenir Next&quot;, Avenir, &quot;Helvetica Neue&quot;, Helvetica, Arial, sans-serif !important; font-size:17px;'><span style='font-family:&quot;Avenir LT W01 35 Light&quot;, &quot;Avenir Next&quot;, Avenir, &quot;Helvetica Neue&quot;, Helvetica, Arial, sans-serif; font-size:medium;'>The map combines high resolution imagery (0.075m - 1.25m) that covers around 95% of New Zealand with the New Zealand 10m Aerial Imagery. The 10m imagery is used for the smaller scales for a more consistent map and for areas where no high resolution imagery is available. This map is updated regularly with the latest high resolution imagery.</span><br />&nbsp;</div><div>&nbsp;</div><div><span style='font-family:&quot;Avenir LT W01 35 Light&quot;, &quot;Avenir Next&quot;, Avenir, &quot;Helvetica Neue&quot;, Helvetica, Arial, sans-serif; font-size:medium;'>A layer with the imagery footprints and metadata is available </span><a target='_blank' href='https://www.arcgis.com/home/item.html?id=3c6385368e87442bb5025851d65b5159' rel='nofollow ugc noopener noreferrer'><span style='font-family:&quot;Avenir LT W01 35 Light&quot;, &quot;Avenir Next&quot;, Avenir, &quot;Helvetica Neue&quot;, Helvetica, Arial, sans-serif; font-size:medium;'>here</span></a><span style='font-family:&quot;Avenir LT W01 35 Light&quot;, &quot;Avenir Next&quot;, Avenir, &quot;Helvetica Neue&quot;, Helvetica, Arial, sans-serif; font-size:medium;'>.</span></div><p><br />&nbsp;</p><div><div style='font-family:&quot;Avenir Next W01&quot;, &quot;Avenir Next W00&quot;, &quot;Avenir Next&quot;, Avenir, &quot;Helvetica Neue&quot;, Helvetica, Arial, sans-serif;'><span style='color:#2f4f4f; font-size:medium;'>This layer is offered by Eagle Technology (Official Esri Distributor). Eagle Technology offers services that can be used in the ArcGIS platform. The Content team at Eagle Technology updates the layers on a regular basis and regularly adds new content to the Living Atlas. By using this content and combining it with other data you can create new information products quickly and easily.</span></div><div style='font-family:&quot;Avenir Next W01&quot;, &quot;Avenir Next W00&quot;, &quot;Avenir Next&quot;, Avenir, &quot;Helvetica Neue&quot;, Helvetica, Arial, sans-serif;'><br />&nbsp;</div><div style='font-family:&quot;Avenir Next W01&quot;, &quot;Avenir Next W00&quot;, &quot;Avenir Next&quot;, Avenir, &quot;Helvetica Neue&quot;, Helvetica, Arial, sans-serif;'><span style='color:#2f4f4f; font-size:medium;'>If you have any questions or remarks about the content, please let us know at </span><a href='mailto:livingatlas@eagle.co.nz.' target='_blank' rel='nofollow ugc noopener noreferrer'><span style='font-size:medium;'>livingatlas@eagle.co.nz</span></a></div></div>",
			"keyword": [
				"imagery",
				"new zealand",
				"taranaki",
				"Horizons",
				"Wellington",
				"manawatu",
				"canterbury",
				"nz",
				"baseimagery",
				"esri_basemap",
				"basemap",
				"landcover",
				"landscape",
				"agriculture",
				"earth observations",
				"people",
				"urban",
				"planning",
				"public",
				"accessibility",
				"transportation",
				"infrastructure",
				"transit",
				"places",
				"boundaries",
				"NZ",
				"New Zealand",
				"Map",
				"Basemap",
				"Background",
				"Layer",
				"topographic",
				"topography",
				"content",
				"living atlas",
				"basemaps",
				"esri_basemaps",
				"detailed",
				"digital map",
				"Linz",
				"current",
				"open data",
				"data sets",
				"Kiwi",
				"eaglegis"
			],
			"issued": "2020-03-24T22:48:12.000Z",
			"modified": "2026-11-11T14:42:12.557Z",
			"publisher": {
				"name": "Eagle Technology Group Ltd"
			},
			"contactPoint": {
				"@type": "vcard:Contact",
				"fn": "eaglegis",
				"hasEmail": "mailto:ts@eaglegis.co.nz"
			},
			"accessLevel": "public",
			"spatial": "165.4643,-52.4518,-177.8511,-29.2238",
			"license": "https://creativecommons.org/licenses/by/4.0",
			"distribution": [
				{
					"@type": "dcat:Distribution",
					"title": "ArcGIS Hub Dataset",
					"format": "Web Page",
					"mediaType": "text/html",
					"accessURL": "https://www.pacificgeoportal.com/datasets/eaglegis::nz-imagery-2"
				},
				{
					"@type": "dcat:Distribution",
					"title": "ArcGIS GeoService",
					"format": "ArcGIS GeoServices REST API",
					"mediaType": "application/json",
					"accessURL": "https://services1.arcgisonline.co.nz/arcgis/rest/services/Imagery/newzealand/MapServer/0"
				},
				{
					"@type": "dcat:Distribution",
					"title": "CSV",
					"format": "CSV",
					"mediaType": "text/csv",
					"accessURL": "https://www.pacificgeoportal.com/api/download/v1/items/d284729222d04a3cb548cfe27716ea43/csv?layers=0"
				},
				{
					"@type": "dcat:Distribution",
					"title": "Shapefile",
					"format": "ZIP",
					"mediaType": "application/zip",
					"accessURL": "https://www.pacificgeoportal.com/api/download/v1/items/d284729222d04a3cb548cfe27716ea43/shapefile?layers=0"
				},
				{
					"@type": "dcat:Distribution",
					"title": "GeoJSON",
					"format": "GeoJSON",
					"mediaType": "application/vnd.geo+json",
					"accessURL": "https://www.pacificgeoportal.com/api/download/v1/items/d284729222d04a3cb548cfe27716ea43/geojson?layers=0"
				},
				{
					"@type": "dcat:Distribution",
					"title": "KML",
					"format": "KML",
					"mediaType": "application/vnd.google-earth.kml+xml",
					"accessURL": "https://www.pacificgeoportal.com/api/download/v1/items/d284729222d04a3cb548cfe27716ea43/kml?layers=0"
				}
			],
			"theme": [
				"geospatial"
			]
		},
		{
			"@type": "dcat:Dataset",
			"identifier": "https://www.arcgis.com/home/item.html?id=689fb0c9670a4d71bf9f31dd03a4730c",
			"landingPage": "https://www.pacificgeoportal.com/maps/eaglegis::nz-imagery",
			"title": "NZ Imagery",
			"description": "<div>See <a target='_blank' href='https://www.arcgis.com/home/item.html?id=d284729222d04a3cb548cfe27716ea43' rel='nofollow ugc noopener noreferrer'>layer</a> for more information</div><div>&nbsp;</div><div style='font-family:&quot;Avenir Next W01&quot;, &quot;Avenir Next W00&quot;, &quot;Avenir Next&quot;, Avenir, &quot;Helvetica Neue&quot;, Helvetica, Arial, sans-serif !important;'><span style='font-family:&quot;Avenir Next W01&quot;, &quot;Avenir Next W00&quot;, &quot;Avenir Next&quot;, Avenir, &quot;Helvetica Neue&quot;, sans-serif; font-size:medium;'><font style='font-family:&quot;Avenir Next W01&quot;, &quot;Avenir Next W00&quot;, &quot;Avenir Next&quot;, Avenir, &quot;Helvetica Neue&quot;, Helvetica, Arial, sans-serif !important;'><strong>Projection</strong></font></span></div><div style='font-family:&quot;Avenir Next W01&quot;, &quot;Avenir Next W00&quot;, &quot;Avenir Next&quot;, Avenir, &quot;Helvetica Neue&quot;, Helvetica, Arial, sans-serif !important;'><span style='font-family:&quot;Avenir Next W01&quot;, &quot;Avenir Next W00&quot;, &quot;Avenir Next&quot;, Avenir, &quot;Helvetica Neue&quot;, sans-serif; font-size:medium;'>New Zealand Transverse Mercator 2000 (NZTM2000).</span><br />&nbsp;</div><div style='font-family:&quot;Avenir Next W01&quot;, &quot;Avenir Next W00&quot;, &quot;Avenir Next&quot;, Avenir, &quot;Helvetica Neue&quot;, Helvetica, Arial, sans-serif !important;'><br />&nbsp;</div><p><span style='font-size:medium;'><strong>Scale/zoom levels:</strong></span><br />&nbsp;</p><div style='margin-left:40px;'><span style='font-size:medium;'><u>Available scale levels</u></span><br />&nbsp;</div><div style='margin-left:40px;'><span style='font-size:medium;'>Level 0 - 23 (1:591,657,527 - 1:70)</span></div><div style='margin-left:40px;'><br />&nbsp;</div><div style='margin-left:40px;'><span style='font-size:medium;'><u>Cached scale levels</u></span><br />&nbsp;</div><div style='margin-left:40px;'><span style='font-size:medium;'>Depending on the available source imagery.</span></div><div style='margin-left:40px;'><span style='font-size:medium;'>For 1m and higher resolution source imagery: Level 0 - 21 (1:591,657,527 - 1:282)</span></div><div style='margin-left:40px;'><span style='font-size:medium;'>For lower resolution source imagery: Level 0 - 19 (1:591,657,527 - 1:1128)</span></div><div style='margin-left:40px;'><br />&nbsp;</div><div style='margin-left:40px;'><span style='font-size:medium;'><u>Resampled scale levels</u></span><br />&nbsp;</div><div style='margin-left:40px;'><span style='font-size:medium;'>Resampling is being used for the levels that aren't cached.</span><br />&nbsp;</div><div>&nbsp;</div><div><span style='font-size:medium;'><strong>About</strong></span></div><div style='font-family:&quot;Avenir Next W01&quot;, &quot;Avenir Next W00&quot;, &quot;Avenir Next&quot;, Avenir, &quot;Helvetica Neue&quot;, Helvetica, Arial, sans-serif !important; font-size:17px;'><span style='font-family:&quot;Avenir LT W01 35 Light&quot;, &quot;Avenir Next&quot;, Avenir, &quot;Helvetica Neue&quot;, Helvetica, Arial, sans-serif; font-size:medium;'>The New Zealand Imagery map is created by Eagle Technology and uses the best available publicly owned high resolution imagery.</span></div><div style='font-family:&quot;Avenir Next W01&quot;, &quot;Avenir Next W00&quot;, &quot;Avenir Next&quot;, Avenir, &quot;Helvetica Neue&quot;, Helvetica, Arial, sans-serif !important; font-size:17px;'><br />&nbsp;</div><div style='font-family:&quot;Avenir Next W01&quot;, &quot;Avenir Next W00&quot;, &quot;Avenir Next&quot;, Avenir, &quot;Helvetica Neue&quot;, Helvetica, Arial, sans-serif !important; font-size:17px;'><span style='font-family:&quot;Avenir LT W01 35 Light&quot;, &quot;Avenir Next&quot;, Avenir, &quot;Helvetica Neue&quot;, Helvetica, Arial, sans-serif; font-size:medium;'>The map combines high resolution imagery (0.075m - 1.25m) that covers around 95% of New Zealand with the New Zealand 10m Aerial Imagery. The 10m imagery is used for the smaller scales for a more consistent map and for areas where no high resolution imagery is available. This map is updated regularly with the latest high resolution imagery.</span><br />&nbsp;</div><div>&nbsp;</div><div><span style='font-family:&quot;Avenir LT W01 35 Light&quot;, &quot;Avenir Next&quot;, Avenir, &quot;Helvetica Neue&quot;, Helvetica, Arial, sans-serif; font-size:medium;'>A layer with the imagery footprints and metadata is available </span><a target='_blank' href='https://www.arcgis.com/home/item.html?id=3c6385368e87442bb5025851d65b5159' rel='nofollow ugc noopener noreferrer'><span style='font-family:&quot;Avenir LT W01 35 Light&quot;, &quot;Avenir Next&quot;, Avenir, &quot;Helvetica Neue&quot;, Helvetica, Arial, sans-serif; font-size:medium;'>here</span></a><span style='font-family:&quot;Avenir LT W01 35 Light&quot;, &quot;Avenir Next&quot;, Avenir, &quot;Helvetica Neue&quot;, Helvetica, Arial, sans-serif; font-size:medium;'>.</span></div><p><br />&nbsp;</p><div><div style='font-family:&quot;Avenir Next W01&quot;, &quot;Avenir Next W00&quot;, &quot;Avenir Next&quot;, Avenir, &quot;Helvetica Neue&quot;, Helvetica, Arial, sans-serif;'><span style='color:#2f4f4f; font-size:medium;'>This layer is offered by Eagle Technology (Official Esri Distributor). Eagle Technology offers services that can be used in the ArcGIS platform. The Content team at Eagle Technology updates the layers on a regular basis and regularly adds new content to the Living Atlas. By using this content and combining it with other data you can create new information products quickly and easily.</span></div><div style='font-family:&quot;Avenir Next W01&quot;, &quot;Avenir Next W00&quot;, &quot;Avenir Next&quot;, Avenir, &quot;Helvetica Neue&quot;, Helvetica, Arial, sans-serif;'><br />&nbsp;</div><div style='font-family:&quot;Avenir Next W01&quot;, &quot;Avenir Next W00&quot;, &quot;Avenir Next&quot;, Avenir, &quot;Helvetica Neue&quot;, Helvetica, Arial, sans-serif;'><span style='color:#2f4f4f; font-size:medium;'>If you have any questions or remarks about the content, please let us know at </span><a href='mailto:livingatlas@eagle.co.nz.' target='_blank' rel='nofollow ugc noopener noreferrer'><span style='font-size:medium;'>livingatlas@eagle.co.nz</span></a></div></div>",
			"keyword": [
				"imagery",
				"new zealand",
				"linz",
				"taranaki",
				"Horizons",
				"Wellington",
				"manawatu",
				"canterbury",
				"nz",
				"baseimagery",
				"esri_basemap",
				"basemap",
				"landcover",
				"landscape",
				"agriculture",
				"earth observations",
				"people",
				"urban",
				"planning",
				"public",
				"accessibility",
				"transportation",
				"infrastructure",
				"transit",
				"places",
				"boundaries",
				"NZ",
				"New Zealand",
				"Map",
				"Basemap",
				"Background",
				"Layer",
				"topographic",
				"topography",
				"content",
				"living atlas",
				"basemaps",
				"esri_basemaps",
				"detailed",
				"digital map",
				"Linz",
				"current",
				"open data",
				"data sets",
				"Kiwi",
				"eaglegis"
			],
			"issued": "2020-03-24T22:49:17.000Z",
			"modified": "2025-05-04T12:33:14.000Z",
			"publisher": {
				"name": "Eagle Technology Group Ltd"
			},
			"contactPoint": {
				"@type": "vcard:Contact",
				"fn": "eaglegis",
				"hasEmail": "mailto:ts@eaglegis.co.nz"
			},
			"accessLevel": "public",
			"spatial": "155.9451,-50.0990,180.0000,-29.3585",
			"license": "https://creativecommons.org/licenses/by/4.0",
			"distribution": [
				{
					"@type": "dcat:Distribution",
					"title": "ArcGIS Hub Dataset",
					"format": "Web Page",
					"mediaType": "text/html",
					"accessURL": "https://www.pacificgeoportal.com/maps/eaglegis::nz-imagery"
				}
			],
			"theme": [
				"geospatial"
			]
		},
		{
			"@type": "dcat:Dataset",
			"identifier": "https://www.arcgis.com/home/item.html?id=e221dc39fa7d43609562c529f170d416",
			"landingPage": "https://www.pacificgeoportal.com/maps/eaglegis::nz-imagery-hybrid",
			"title": "NZ Imagery Hybrid",
			"description": "<div><div><span style='font-family:&quot;Avenir Next W01&quot;, &quot;Avenir Next W00&quot;, &quot;Avenir Next&quot;, Avenir, &quot;Helvetica Neue&quot;, sans-serif; font-size:medium;'><font style='font-family:&quot;Avenir Next W01&quot;, &quot;Avenir Next W00&quot;, &quot;Avenir Next&quot;, Avenir, &quot;Helvetica Neue&quot;, Helvetica, Arial, sans-serif !important;'><strong>Currency</strong></font></span></div><div><span style='font-family:&quot;Avenir Next W01&quot;, &quot;Avenir Next W00&quot;, &quot;Avenir Next&quot;, Avenir, &quot;Helvetica Neue&quot;, sans-serif; font-size:medium;'><font style='font-family:&quot;Avenir Next W01&quot;, &quot;Avenir Next W00&quot;, &quot;Avenir Next&quot;, Avenir, &quot;Helvetica Neue&quot;, Helvetica, Arial, sans-serif !important;'>This basemap is updated as new Imagery data is available</font></span></div><div><br />&nbsp;</div></div><div>This map contains two layers, more information on the layers can be found here:</div><div><ul><li><a target='_blank' href='https://www.arcgis.com/home/item.html?id=d284729222d04a3cb548cfe27716ea43' rel='nofollow ugc noopener noreferrer'>NZ Imagery</a></li><li><a target='_blank' href='https://www.arcgis.com/home/item.html?id=72016493081d480bbc09d2981986a38e' rel='nofollow ugc noopener noreferrer'>NZ Hybrid Reference</a></li></ul><div><div style='font-family:&quot;Avenir Next W01&quot;, &quot;Avenir Next W00&quot;, &quot;Avenir Next&quot;, Avenir, &quot;Helvetica Neue&quot;, Helvetica, Arial, sans-serif !important;'><span style='font-family:&quot;Avenir Next W01&quot;, &quot;Avenir Next W00&quot;, &quot;Avenir Next&quot;, Avenir, &quot;Helvetica Neue&quot;, sans-serif; font-size:medium;'><font style='font-family:&quot;Avenir Next W01&quot;, &quot;Avenir Next W00&quot;, &quot;Avenir Next&quot;, Avenir, &quot;Helvetica Neue&quot;, Helvetica, Arial, sans-serif !important;'><strong>Projection</strong></font></span></div><div style='font-family:&quot;Avenir Next W01&quot;, &quot;Avenir Next W00&quot;, &quot;Avenir Next&quot;, Avenir, &quot;Helvetica Neue&quot;, Helvetica, Arial, sans-serif !important;'><span style='font-family:&quot;Avenir Next W01&quot;, &quot;Avenir Next W00&quot;, &quot;Avenir Next&quot;, Avenir, &quot;Helvetica Neue&quot;, sans-serif; font-size:medium;'>New Zealand Transverse Mercator 2000 (NZTM2000).</span><br />&nbsp;</div><div style='font-family:&quot;Avenir Next W01&quot;, &quot;Avenir Next W00&quot;, &quot;Avenir Next&quot;, Avenir, &quot;Helvetica Neue&quot;, Helvetica, Arial, sans-serif !important;'><br />&nbsp;</div><p><span style='font-size:medium;'><strong>Scale/zoom levels:</strong></span><br />&nbsp;</p><div style='margin-left:40px;'><span style='font-size:medium;'><u>Available scale levels</u></span><br />&nbsp;</div><div style='margin-left:40px;'><span style='font-size:medium;'>Level 0 - 23 (1:591,657,527 - 1:70)</span><br />&nbsp;</div></div><div>&nbsp;</div><div><div><span style='font-size:medium;'><strong>About NZ Imagery</strong></span><br />&nbsp;</div><div style='font-family:&quot;Avenir Next W01&quot;, &quot;Avenir Next W00&quot;, &quot;Avenir Next&quot;, Avenir, &quot;Helvetica Neue&quot;, Helvetica, Arial, sans-serif !important; font-size:17px;'><span style='font-family:&quot;Avenir LT W01 35 Light&quot;, &quot;Avenir Next&quot;, Avenir, &quot;Helvetica Neue&quot;, Helvetica, Arial, sans-serif; font-size:medium;'>The New Zealand Imagery map is created by Eagle Technology and uses the best available publicly owned high resolution imagery.</span></div><div style='font-family:&quot;Avenir Next W01&quot;, &quot;Avenir Next W00&quot;, &quot;Avenir Next&quot;, Avenir, &quot;Helvetica Neue&quot;, Helvetica, Arial, sans-serif !important; font-size:17px;'><br />&nbsp;</div><div style='font-family:&quot;Avenir Next W01&quot;, &quot;Avenir Next W00&quot;, &quot;Avenir Next&quot;, Avenir, &quot;Helvetica Neue&quot;, Helvetica, Arial, sans-serif !important; font-size:17px;'><span style='font-family:&quot;Avenir LT W01 35 Light&quot;, &quot;Avenir Next&quot;, Avenir, &quot;Helvetica Neue&quot;, Helvetica, Arial, sans-serif; font-size:medium;'>The map combines high resolution imagery (0.075m - 1.25m) that covers around 95% of New Zealand with the New Zealand 10m Aerial Imagery. The 10m imagery is used for the smaller scales for a more consistent map and for areas where no high resolution imagery is available. This map is updated regularly with the latest high resolution imagery.</span><br />&nbsp;</div><div>&nbsp;</div><div><span style='font-family:&quot;Avenir LT W01 35 Light&quot;, &quot;Avenir Next&quot;, Avenir, &quot;Helvetica Neue&quot;, Helvetica, Arial, sans-serif; font-size:medium;'>A layer with the imagery footprints and metadata is available </span><a target='_blank' href='https://www.arcgis.com/home/item.html?id=3c6385368e87442bb5025851d65b5159' rel='nofollow ugc noopener noreferrer'><span style='font-family:&quot;Avenir LT W01 35 Light&quot;, &quot;Avenir Next&quot;, Avenir, &quot;Helvetica Neue&quot;, Helvetica, Arial, sans-serif; font-size:medium;'>here</span></a><span style='font-family:&quot;Avenir LT W01 35 Light&quot;, &quot;Avenir Next&quot;, Avenir, &quot;Helvetica Neue&quot;, Helvetica, Arial, sans-serif; font-size:medium;'>.</span></div><div><br />&nbsp;</div><div><p><span style='font-family:&quot;Avenir LT W01 35 Light&quot;, &quot;Avenir Next&quot;, Avenir, &quot;Helvetica Neue&quot;, Helvetica, Arial, sans-serif; font-size:medium;'><strong>About NZ Hybrid Reference</strong></span><br /><span style='font-family:&quot;Avenir LT W01 35 Light&quot;, &quot;Avenir Next&quot;, Avenir, &quot;Helvetica Neue&quot;, Helvetica, Arial, sans-serif; font-size:medium;'>This vector tile layer provides a detailed reference layer for New Zealand in the NZ Transverse Mercator projection. The style is based on the Esri World Hybrid Imagery style. This vector tile layer provides unique capabilities for customization and high-resolution display.&nbsp;</span></p><div>&nbsp;</div><p><span style='font-size:medium;'>This map includes highways, major roads, minor roads, railways, water features, cities, parks, landmarks, and administrative boundaries for added context.</span></p></div><div><br />&nbsp;</div><div><div style='font-family:&quot;Avenir Next W01&quot;, &quot;Avenir Next W00&quot;, &quot;Avenir Next&quot;, Avenir, &quot;Helvetica Neue&quot;, Helvetica, Arial, sans-serif;'><span style='color:#2f4f4f; font-size:medium;'>This layer is offered by Eagle Technology (Official Esri Distributor). Eagle Technology offers services that can be used in the ArcGIS platform. The Content team at Eagle Technology updates the layers on a regular basis and regularly adds new content to the Living Atlas. By using this content and combining it with other data you can create new information products quickly and easily.</span></div><div style='font-family:&quot;Avenir Next W01&quot;, &quot;Avenir Next W00&quot;, &quot;Avenir Next&quot;, Avenir, &quot;Helvetica Neue&quot;, Helvetica, Arial, sans-serif;'><br />&nbsp;</div><div style='font-family:&quot;Avenir Next W01&quot;, &quot;Avenir Next W00&quot;, &quot;Avenir Next&quot;, Avenir, &quot;Helvetica Neue&quot;, Helvetica, Arial, sans-serif;'><span style='color:#2f4f4f; font-size:medium;'>If you have any questions or remarks about the content, please let us know at </span><a href='mailto:livingatlas@eagle.co.nz.' target='_blank' rel='nofollow ugc noopener noreferrer'><span style='font-size:medium;'>livingatlas@eagle.co.nz</span></a></div></div></div></div>",
			"keyword": [
				"imagery",
				"new zealand",
				"linz",
				"nz",
				"basemap",
				"landcover",
				"landscape",
				"agriculture",
				"earth observations",
				"people",
				"urban",
				"planning",
				"public",
				"accessibility",
				"transportation",
				"infrastructure",
				"transit",
				"places",
				"boundaries",
				"NZ",
				"New Zealand",
				"Map",
				"Basemap",
				"Background",
				"Layer",
				"topographic",
				"topography",
				"content",
				"living atlas",
				"basemaps",
				"digital map",
				"data sets",
				"Kiwi",
				"detailed",
				"Linz",
				"current",
				"open data",
				"kiwi",
				"vector",
				"vector tiles",
				"topo",
				"topo nz",
				"Eagle",
				"Eagle Technology",
				"NZTM",
				"Aotearoa",
				"eaglegis",
				"hybrid",
				"reference",
				"image"
			],
			"issued": "2021-09-08T01:50:56.000Z",
			"modified": "2026-09-16T22:56:57.000Z",
			"publisher": {
				"name": "Eagle Technology Group Ltd"
			},
			"contactPoint": {
				"@type": "vcard:Contact",
				"fn": "eaglegis",
				"hasEmail": "mailto:ts@eaglegis.co.nz"
			},
			"accessLevel": "public",
			"spatial": "163.8527,-47.6571,179.5732,-34.0089",
			"license": "https://creativecommons.org/licenses/by/4.0",
			"distribution": [
				{
					"@type": "dcat:Distribution",
					"title": "ArcGIS Hub Dataset",
					"format": "Web Page",
					"mediaType": "text/html",
					"accessURL": "https://www.pacificgeoportal.com/maps/eaglegis::nz-imagery-hybrid"
				}
			],
			"theme": [
				"geospatial"
			]
		},
		{
			"@type": "dcat:Dataset",
			"identifier": "https://www.arcgis.com/home/item.html?id=79461a1ec0974301bde274177c7108bd&sublayer=0",
			"landingPage": "https://www.pacificgeoportal.com/datasets/esri2::global-earthquake-archive",
			"title": "Global Earthquake Archive",
			"description": "<p><span>The US Geological Survey maintains official records of earthquake\nactivity from around the globe. This layer displays all earthquakes since 1900\nwith a magnitude 4.0 or greater, and updates once a day. For more recent activity,\nplease see the <a href='https://arcgis.com/home/item.html?id=9e2f2b544c954fda9cd13b7f3e6eebce' rel='nofollow ugc'>Recent\nEarthquakes layer</a> that updates every 5 minutes. </span></p>\n\n<p style='background:white;'><span style='color:black;'>Data\nsource: original data is accessed </span><a href='https://earthquake.usgs.gov/earthquakes/search/' target='_blank' rel='nofollow ugc noopener noreferrer'><font size='3'>here </font></a><span style='color:black;'>and updated using the</span><span style='color:#4C4C4C;'>\n<a href='https://www.arcgis.com/home/item.html?id=d45f80eb53c748e7aa3d938a46b48836' rel='nofollow ugc'>OverwriteFS</a>\ntool </span><span style='color:black;'>in ArcGIS Online. The full\ndocumentation for all of the fields can be found on the <a href='https://earthquake.usgs.gov/data/comcat/data-eventterms.php' rel='nofollow ugc'>USGS ComCat</a>\nsite. For more information, please see the <a href='https://earthquake.usgs.gov/data/pager/' rel='nofollow ugc'>USGS PAGER</a> program.</span></p><div style='color:rgb(105, 105, 105); font-family:&quot;Avenir Next W01&quot;, &quot;Avenir Next W00&quot;, &quot;Avenir Next&quot;, Avenir, &quot;Helvetica Neue&quot;, sans-serif;'><font size='5'>Revisions</font></div><div style='color:rgb(105, 105, 105); font-family:&quot;Avenir Next W01&quot;, &quot;Avenir Next W00&quot;, &quot;Avenir Next&quot;, Avenir, &quot;Helvetica Neue&quot;, sans-serif; font-size:16px;'><ul><li><b>June 13, 2022:</b> Updated service with Z Coordinates set to 0 due to limitation on the negative Z value range for online services. This change allows users to support analytics and export for local client consumption. Depth can be leveraged by using the elevation field. Anticipating online enhancements, we set the custom projection to support the change in the Z value range. Refined the schema to improve efficiency. Layer has been Time-Enabled to allow for Time Series display, but disabled by default. Data download has now been enabled.</li><li><b>May 5, 2023: </b>Updated service with four duplicated fields to match the Recent Earthquake Service's data schema. Depth, Event Time, Event Type, TZ are the duplicated fields. </li></ul></div>\n\n<p><span style='color:black; background:white;'>This map is\nprovided for informational purposes and is not monitored 24/7 for accuracy and\ncurrency. Always refer to </span><span style='color:gray; background:white;'><a href='https://www.usgs.gov/natural-hazards/earthquake-hazards/earthquakes' target='_blank' rel='nofollow ugc noopener noreferrer'><span style='color:#0079C1; text-decoration:none;'>USGS</span></a> </span><span style='color:black; background:white;'>source for official guidance.</span></p>",
			"keyword": [
				"livefeeds",
				"usgs",
				"earthquakes",
				"esri_environment",
				"environment",
				"Live Feeds",
				"hosted"
			],
			"issued": "2021-12-16T01:56:27.000Z",
			"modified": "2026-11-10T22:34:15.500Z",
			"publisher": {
				"name": "Esri"
			},
			"contactPoint": {
				"@type": "vcard:Contact",
				"fn": "esri_livefeeds2",
				"hasEmail": "{{orgContactEmail}}"
			},
			"accessLevel": "public",
			"spatial": "-179.9997,-84.4220,179.9997,87.3860",
			"license": "<img src='https://downloads.esri.com/blogs/arcgisonline/esrilogo_new.png' /> This work is licensed under the Esri Master License Agreement.<br /><div><a href='https://goto.arcgis.com/termsofuse/viewsummary' target='_blank' rel='nofollow ugc noopener noreferrer'><b>View Summary</b></a> | <a href='https://goto.arcgis.com/termsofuse/viewtermsofuse' target='_blank' rel='nofollow ugc noopener noreferrer'><b>View Terms of Use</b></a></div>",
			"distribution": [
				{
					"@type": "dcat:Distribution",
					"title": "ArcGIS Hub Dataset",
					"format": "Web Page",
					"mediaType": "text/html",
					"accessURL": "https://www.pacificgeoportal.com/datasets/esri2::global-earthquake-archive"
				},
				{
					"@type": "dcat:Distribution",
					"title": "ArcGIS GeoService",
					"format": "ArcGIS GeoServices REST API",
					"mediaType": "application/json",
					"accessURL": "https://services9.arcgis.com/RHVPKKiFTONKtxq3/arcgis/rest/services/Historical_Quakes/FeatureServer/0"
				},
				{
					"@type": "dcat:Distribution",
					"title": "CSV",
					"format": "CSV",
					"mediaType": "text/csv",
					"accessURL": "https://www.pacificgeoportal.com/api/download/v1/items/79461a1ec0974301bde274177c7108bd/csv?layers=0"
				},
				{
					"@type": "dcat:Distribution",
					"title": "Shapefile",
					"format": "ZIP",
					"mediaType": "application/zip",
					"accessURL": "https://www.pacificgeoportal.com/api/download/v1/items/79461a1ec0974301bde274177c7108bd/shapefile?layers=0"
				},
				{
					"@type": "dcat:Distribution",
					"title": "GeoJSON",
					"format": "GeoJSON",
					"mediaType": "application/vnd.geo+json",
					"accessURL": "https://www.pacificgeoportal.com/api/download/v1/items/79461a1ec0974301bde274177c7108bd/geojson?layers=0"
				},
				{
					"@type": "dcat:Distribution",
					"title": "KML",
					"format": "KML",
					"mediaType": "application/vnd.google-earth.kml+xml",
					"accessURL": "https://www.pacificgeoportal.com/api/download/v1/items/79461a1ec0974301bde274177c7108bd/kml?layers=0"
				},
				{
					"@type": "dcat:Distribution",
					"title": "File Geodatabase",
					"format": "ZIP",
					"mediaType": "application/zip",
					"accessURL": "https://www.pacificgeoportal.com/api/download/v1/items/79461a1ec0974301bde274177c7108bd/filegdb?layers=0"
				},
				{
					"@type": "dcat:Distribution",
					"title": "Feature Collection",
					"format": "TXT",
					"mediaType": "text/plain",
					"accessURL": "https://www.pacificgeoportal.com/api/download/v1/items/79461a1ec0974301bde274177c7108bd/featureCollection?layers=0"
				},
				{
					"@type": "dcat:Distribution",
					"title": "Excel",
					"format": "XLSX",
					"mediaType": "application/vnd.ms-excel",
					"accessURL": "https://www.pacificgeoportal.com/api/download/v1/items/79461a1ec0974301bde274177c7108bd/excel?layers=0"
				},
				{
					"@type": "dcat:Distribution",
					"title": "GeoPackage",
					"format": "GPKG",
					"mediaType": "application/geopackage+sqlite3",
					"accessURL": "https://www.pacificgeoportal.com/api/download/v1/items/79461a1ec0974301bde274177c7108bd/geoPackage?layers=0"
				},
				{
					"@type": "dcat:Distribution",
					"title": "SQLite Geodatabase",
					"format": "GDB",
					"mediaType": "application/geopackage+sqlite3",
					"accessURL": "https://www.pacificgeoportal.com/api/download/v1/items/79461a1ec0974301bde274177c7108bd/sqlite?layers=0"
				}
			],
			"theme": [
				"geospatial"
			]
		},
		{
			"@type": "dcat:Dataset",
			"identifier": "https://www.arcgis.com/home/item.html?id=741a56ae6a5340058b9704a8f68f1b9a",
			"landingPage": "https://www.pacificgeoportal.com/content/esri::mangrove-classification-landsat-8",
			"title": "Mangrove Classification (Landsat 8)",
			"description": "<div style='display:inherit; max-width:100%;'><p style='margin-bottom:1.5rem; margin-top:0px;'><span style='font-size:16px;'>Mangroves are critical to the maintenance and conservation of healthy coastal ecosystems. They are extremely rich in biodiversity and are home to a diverse set of plant and animal species. Mangroves protect inland coastal areas from erosion and storm surge impacts such as from tsunamis. These factors make mangrove monitoring and conservation an important activity. Due to various climatic phenomena and coastal activity such as reclamation for development, mangrove forests are rapidly shrinking. This warrants active monitoring and conservation efforts of mangroves. This deep learning model enables rapid monitoring of mangrove forests.</span><br /><br /><span style='font-size:large;'><font style='font-family:inherit;'><strong>Using the model</strong></font></span><br /><font style='font-family:inherit; font-size:16px;'>Follow this </font><a target='_blank' href='https://doc.arcgis.com/en/pretrained-models/latest/imagery/using-mangrove-classification-landsat-8-.htm' rel='nofollow ugc noopener noreferrer'>guide</a><font style='font-family:inherit; font-size:16px;'>&nbsp;</font><span style='font-size:medium;'>to use the model</span><span style='font-size:16px;'><font style='background-color:transparent;'>.&nbsp;</font><font style='font-family:inherit;'>Before using this model, ensure that the supported deep learning&nbsp;</font></span><span style='font-size:17px;'><font style='font-family:inherit;'>libraries&nbsp;</font></span><span style='font-size:16px;'><font style='font-family:inherit;'>are installed.&nbsp;</font></span><span style='font-size:medium;'><font style='font-family:inherit;'>For more details, check&nbsp;</font></span><a style='color:rgb(0, 121, 193); font-family:inherit;' target='_blank' href='https://github.com/esri/deep-learning-frameworks' rel='nofollow ugc noopener noreferrer'><span style='font-size:medium;'><font style='font-family:inherit;'>Deep Learning Libraries Installer for ArcGIS</font></span></a><span style='font-size:medium;'><font style='font-family:inherit;'>.</font></span><br /><br /><span style='font-size:large;'><font style='font-family:&quot;Avenir Next W01&quot;, &quot;Avenir Next W00&quot;, &quot;Avenir Next&quot;, Avenir, &quot;Helvetica Neue&quot;, sans-serif;'><strong>Fine-tuning the model</strong></font></span><br /><span style='font-size:medium;'><font style='font-family:inherit; font-size:16px;'>This model can be fine-tuned using the Train Deep Learning Model tool. Follow the&nbsp;</font></span><a target='_blank' href='https://doc.arcgis.com/en/pretrained-models/latest/imagery/finetuning-the-mangrove-classification-landsat-8-.htm' rel='nofollow ugc noopener noreferrer'><font style='font-family:inherit; font-size:16px;'>guide</font></a><span style='font-size:medium;'><font style='font-family:inherit; font-size:16px;'>&nbsp;to fine-tune this model.</font></span><br /><br /><span style='font-size:large;'><strong>Input</strong></span><br /><span style='font-size:16px;'>Surface Reflectance (Collection 2 Level 2) imagery acquired by the Landsat 8 Sensor in form of a raster, mosaic dataset or image service.</span><br /><br /><span style='font-size:large;'><font style='font-family:inherit;'><strong>Output</strong></font></span><br /><span style='font-size:medium;'>Classified raster containing two classes: mangrove and other.</span><br /><br /><span style='font-size:large;'><font style='font-family:inherit;'><strong>Applicable geographies</strong></font></span><br /><span style='font-size:16px;'>This model is expected to work well globally.</span><br /><br /><span style='font-size:large;'><font style='font-family:inherit;'><strong>Model architecture</strong></font></span><br /><span style='font-size:16px;'>This model uses the&nbsp;</span><a style='color:rgb(0, 121, 193); font-family:inherit; font-size:16px;' target='_blank' href='https://developers.arcgis.com/python/guide/how-unet-works/' rel='nofollow ugc noopener noreferrer'>UNet</a><span style='font-size:16px;'>&nbsp;model architecture implemented in ArcGIS API for Python.</span><br /><br /><span style='font-size:large;'><font style='font-family:inherit;'><strong>Accuracy metrics</strong></font></span><br /><span style='font-size:16px;'>The mangrove class has a precision of 0.85, recall of 0.80 and F1 score of 0.82.</span><br /><br /><span style='font-size:large;'><font style='font-family:inherit;'><strong>Training data</strong></font></span><br /><font style='font-family:inherit; font-size:16px;'>This model has been trained on the&nbsp;</font><a style='color:rgb(0, 121, 193); font-family:inherit; font-size:16px;' target='_blank' href='https://data.unep-wcmc.org/datasets/45' rel='nofollow ugc noopener noreferrer'>Global Mangrove Watch dataset</a><span style='font-size:16px;'>&nbsp;with Landsat 8 Scenes from the same time.</span><br /><br /><span style='font-size:large;'><font style='font-family:inherit;'><strong>Sample results</strong></font></span><br /><span style='font-size:medium;'>Here are a few results from the model.&nbsp;</span></p></div><div style='display:inherit; font-family:&quot;Avenir Next W01&quot;, &quot;Avenir Next W00&quot;, &quot;Avenir Next&quot;, Avenir, &quot;Helvetica Neue&quot;, sans-serif; font-size:16px; max-width:100%;'><div><img src='https://esri.maps.arcgis.com/sharing/rest/content/items/9ec68ac43e5a45208ac097d6ce9b8c15/data' alt='Figure 1' /></div><div>&nbsp;</div><div><img src='https://esri.maps.arcgis.com/sharing/rest/content/items/8b115907bfaa40fdaf43667efa4798c6/data' alt='figure2' /><br />&nbsp;&nbsp;</div><div><img src='https://esri.maps.arcgis.com/sharing/rest/content/items/ca813beb23ed4c5597ecf43a201ff7c6/data' alt='figure2' /></div></div>",
			"keyword": [
				"living atlas dlpk",
				"dlpk",
				"LivingAtlasDLPK",
				"Mangrove",
				"mangrove classification"
			],
			"issued": "2021-09-23T21:34:08.000Z",
			"modified": "2026-09-01T07:12:46.000Z",
			"publisher": {
				"name": "Esri"
			},
			"contactPoint": {
				"@type": "vcard:Contact",
				"fn": "esri_analytics",
				"hasEmail": "{{orgContactEmail}}"
			},
			"accessLevel": "public",
			"spatial": "-178.7615,-57.8276,179.5782,71.2525",
			"license": "<p><img src='https://downloads.esri.com/blogs/arcgisonline/esrilogo_new.png' /> &nbsp;This work is licensed under the Esri Master License Agreement<p><a target='_blank' href='https://goto.arcgis.com/termsofuse/viewsummary' rel='nofollow ugc noopener noreferrer'><strong>View Summary | <a target='_blank' href='https://goto.arcgis.com/termsofuse/viewtermsofuse' rel='nofollow ugc noopener noreferrer'><strong>View Terms of Use</p></p></a></a></strong></strong>",
			"distribution": [
				{
					"@type": "dcat:Distribution",
					"title": "ArcGIS Hub Dataset",
					"format": "Web Page",
					"mediaType": "text/html",
					"accessURL": "https://www.pacificgeoportal.com/content/esri::mangrove-classification-landsat-8"
				}
			],
			"theme": [
				"geospatial"
			]
		},
		{
			"@type": "dcat:Dataset",
			"identifier": "https://www.arcgis.com/home/item.html?id=af244e4810454ab8baf2768a69deee62&sublayer=0",
			"landingPage": "https://www.pacificgeoportal.com/datasets/af244e4810454ab8baf2768a69deee62_0",
			"title": "OpenStreetMap Educational Establishments for Australia and Oceania",
			"description": "<span style='font-family:&quot;Avenir Next W01&quot;, &quot;Avenir Next W00&quot;, &quot;Avenir Next&quot;, Avenir, &quot;Helvetica Neue&quot;, sans-serif; font-size:17px;'>This feature layer provides access to OpenStreetMap (OSM) <b>educational establishment point </b></span><font style='font-family:&quot;Avenir Next W01&quot;, &quot;Avenir Next W00&quot;, &quot;Avenir Next&quot;, Avenir, &quot;Helvetica Neue&quot;, sans-serif; font-size:16px;'><span style='font-family:inherit; font-size:17px;'><b>data </b>for Australia and Oceania, which is </span></font><b>updated every 15 minutes</b><font style='font-family:&quot;Avenir Next W01&quot;, &quot;Avenir Next W00&quot;, &quot;Avenir Next&quot;, Avenir, &quot;Helvetica Neue&quot;, sans-serif; font-size:16px;'><span style='font-family:inherit; font-size:17px;'> with the latest edits.</span></font><b> </b><font style='font-family:&quot;Avenir Next W01&quot;, &quot;Avenir Next W00&quot;, &quot;Avenir Next&quot;, Avenir, &quot;Helvetica Neue&quot;, sans-serif; font-size:16px;'><span style='font-family:inherit; font-size:17px;'>This </span></font><a href='https://doc.arcgis.com/en/arcgis-online/share-maps/about-sharing-feature-layer-data-as-copies.htm' rel='nofollow ugc' style='color:rgb(0, 121, 193); font-family:&quot;Avenir Next W01&quot;, &quot;Avenir Next W00&quot;, &quot;Avenir Next&quot;, Avenir, &quot;Helvetica Neue&quot;, sans-serif; font-size:16px; text-decoration-line:none;' target='_blank'>hosted feature layer view</a><span style='font-family:&quot;Avenir Next W01&quot;, &quot;Avenir Next W00&quot;, &quot;Avenir Next&quot;, Avenir, &quot;Helvetica Neue&quot;, sans-serif; font-size:17px;'> is referencing a hosted feature layer of OSM point (node) data in ArcGIS Online that is updated with minutely diffs from the OSM planet file.  This feature </span><span style='font-family:&quot;Avenir Next W01&quot;, &quot;Avenir Next W00&quot;, &quot;Avenir Next&quot;, Avenir, &quot;Helvetica Neue&quot;, sans-serif; font-size:17px;'>layer view</span><span style='font-family:&quot;Avenir Next W01&quot;, &quot;Avenir Next W00&quot;, &quot;Avenir Next&quot;, Avenir, &quot;Helvetica Neue&quot;, sans-serif; font-size:17px;'> includes amenity </span><span style='font-family:&quot;Avenir Next W01&quot;, &quot;Avenir Next W00&quot;, &quot;Avenir Next&quot;, Avenir, &quot;Helvetica Neue&quot;, sans-serif; font-size:17px;'>features defined as a query against the hosted feature layer where the <b>a</b></span><span style='font-family:&quot;Avenir Next W01&quot;, &quot;Avenir Next W00&quot;, &quot;Avenir Next&quot;, Avenir, &quot;Helvetica Neue&quot;, sans-serif; font-size:17px;'><b>menity </b>value </span><span style='font-family:&quot;Avenir Next W01&quot;, &quot;Avenir Next W00&quot;, &quot;Avenir Next&quot;, Avenir, &quot;Helvetica Neue&quot;, sans-serif; font-size:17px;'>is any of </span><span style='font-family:&quot;Avenir Next W01&quot;, &quot;Avenir Next W00&quot;, &quot;Avenir Next&quot;, Avenir, &quot;Helvetica Neue&quot;, sans-serif; font-size:17px;'>'</span><span style='font-family:&quot;Avenir Next W01&quot;, &quot;Avenir Next W00&quot;, &quot;Avenir Next&quot;, Avenir, &quot;Helvetica Neue&quot;, sans-serif; font-size:17px;'><b>school</b>', '<b>university</b>', '<b>college</b>', or '</span><span style='font-family:&quot;Avenir Next W01&quot;, &quot;Avenir Next W00&quot;, &quot;Avenir Next&quot;, Avenir, &quot;Helvetica Neue&quot;, sans-serif; font-size:17px;'><b>kindergarten</b>'.</span><div style='font-family:&quot;Avenir Next W01&quot;, &quot;Avenir Next W00&quot;, &quot;Avenir Next&quot;, Avenir, &quot;Helvetica Neue&quot;, sans-serif; font-size:16px;'><span style='font-family:inherit; font-size:17px;'><br /></span><div style='font-family:inherit;'><font style='font-family:inherit;'><span style='font-family:inherit; font-size:17px;'>In OSM, amenities are </span></font><font style='font-family:inherit;'><span style='font-family:inherit; font-size:17px;'><b>useful and important facilities</b> for visitors and residents, such as schools and universities.  These features are identified with an </span></font><a href='https://wiki.openstreetmap.org/wiki/Key:amenity' rel='nofollow ugc' style='color:rgb(0, 121, 193); font-family:inherit; text-decoration-line:none;' target='_blank'>amenity tag</a><span style='font-family:inherit; font-size:17px;'>.  </span><span style='font-family:inherit; font-size:17px;'>In OSM, </span><a href='https://wiki.openstreetmap.org/wiki/Tag:amenity%3Dschool' rel='nofollow ugc' style='color:rgb(0, 121, 193); font-family:inherit; text-decoration-line:none;' target='_blank'>amenity=school</a><span style='font-family:inherit; font-size:17px;'> is used to identify a place where pupils, normally between the ages of about 6 and 18 are taught under the supervision of teachers. This includes primary and secondary schools. See </span><a href='https://wiki.openstreetmap.org/wiki/Tag:amenity%3Dcollege' rel='nofollow ugc' style='color:rgb(0, 121, 193); font-family:inherit; text-decoration-line:none;' target='_blank'>amenity=college</a><span style='font-family:inherit; font-size:17px;'>, </span><a href='https://wiki.openstreetmap.org/wiki/Tag:amenity%3Duniversity' rel='nofollow ugc' style='color:rgb(0, 121, 193); font-family:inherit; text-decoration-line:none;' target='_blank'>amenity=university</a>, and <a href='https://wiki.openstreetmap.org/wiki/Tag:amenity%3Dkindergarten' rel='nofollow ugc' style='color:rgb(0, 121, 193); font-family:inherit; text-decoration-line:none;' target='_blank'>amenity=kindergarten</a><span style='font-family:inherit; font-size:17px;'> for </span><span style='font-family:inherit; font-size:17px;'>other educational establishments.</span></div><div style='font-family:inherit;'><div style='font-family:inherit;'><span style='font-family:&quot;Avenir Next W01&quot;, &quot;Avenir Next W00&quot;, &quot;Avenir Next&quot;, Avenir, &quot;Helvetica Neue&quot;, Helvetica, Arial, sans-serif; font-size:17px;'><br /></span></div><div style='font-family:inherit;'><span style='font-family:&quot;Avenir Next W01&quot;, &quot;Avenir Next W00&quot;, &quot;Avenir Next&quot;, Avenir, &quot;Helvetica Neue&quot;, Helvetica, Arial, sans-serif; font-size:17px;'>Zoom in to large scales (e.g. </span><span style='font-family:&quot;Avenir Next W01&quot;, &quot;Avenir Next W00&quot;, &quot;Avenir Next&quot;, Avenir, &quot;Helvetica Neue&quot;, Helvetica, Arial, sans-serif; font-size:17px;'>Cities level or 1:160k scale</span><span style='font-family:&quot;Avenir Next W01&quot;, &quot;Avenir Next W00&quot;, &quot;Avenir Next&quot;, Avenir, &quot;Helvetica Neue&quot;, Helvetica, Arial, sans-serif; font-size:17px;'>) to see the educational features display.  </span><span style='font-family:&quot;Avenir Next W01&quot;, &quot;Avenir Next W00&quot;, &quot;Avenir Next&quot;, Avenir, &quot;Helvetica Neue&quot;, Helvetica, Arial, sans-serif; font-size:17px;'>You can click on </span><span style='font-family:&quot;Avenir Next W01&quot;, &quot;Avenir Next W00&quot;, &quot;Avenir Next&quot;, Avenir, &quot;Helvetica Neue&quot;, Helvetica, Arial, sans-serif; font-size:17px;'>a </span><span style='font-family:&quot;Avenir Next W01&quot;, &quot;Avenir Next W00&quot;, &quot;Avenir Next&quot;, Avenir, &quot;Helvetica Neue&quot;, Helvetica, Arial, sans-serif; font-size:17px;'>feature to get the name and any other available attributes of the feature.  The name of the feature will display by default at very large scales (e.g. Building level of 1:2k scale).  Labels can be turned off in your map if you prefer.</span></div></div></div>",
			"keyword": [
				"osm",
				"OpenStreetMap",
				"education",
				"school",
				"university",
				"college",
				"Australia",
				"Oceania",
				"American Samoa",
				"Cook Islands",
				"Fed States of Micronesia",
				"Fiji",
				"French Polynesia",
				"Guam",
				"Kiribati",
				"Marshall Islands",
				"Nauru",
				"New Caledonia",
				"Niue",
				"North Mariana Islands",
				"Palau",
				"Papua New Guinea",
				"Pitcairn Islands",
				"Samoa",
				"Solomon Islands",
				"Tokelau",
				"Tonga",
				"Tuvalu",
				"Vanuatu",
				"Wallis and Futuna"
			],
			"issued": "2021-04-30T22:12:52.000Z",
			"modified": "2026-08-12T20:49:04.006Z",
			"publisher": {
				"name": "{{source}}"
			},
			"contactPoint": {
				"@type": "vcard:Contact",
				"fn": "smoore3_osm",
				"hasEmail": "{{orgContactEmail}}"
			},
			"accessLevel": "public",
			"spatial": "-179.9997,-56.9670,180.0000,26.0812",
			"license": "https://opendatacommons.org/licenses/odbl/summary",
			"distribution": [
				{
					"@type": "dcat:Distribution",
					"title": "ArcGIS Hub Dataset",
					"format": "Web Page",
					"mediaType": "text/html",
					"accessURL": "https://www.pacificgeoportal.com/datasets/af244e4810454ab8baf2768a69deee62_0"
				},
				{
					"@type": "dcat:Distribution",
					"title": "ArcGIS GeoService",
					"format": "ArcGIS GeoServices REST API",
					"mediaType": "application/json",
					"accessURL": "https://services-ap1.arcgis.com/iA7fZQOnjY9D67Zx/arcgis/rest/services/OSM_AU_Educational/FeatureServer/0"
				},
				{
					"@type": "dcat:Distribution",
					"title": "CSV",
					"format": "CSV",
					"mediaType": "text/csv",
					"accessURL": "https://www.pacificgeoportal.com/api/download/v1/items/af244e4810454ab8baf2768a69deee62/csv?layers=0"
				},
				{
					"@type": "dcat:Distribution",
					"title": "Shapefile",
					"format": "ZIP",
					"mediaType": "application/zip",
					"accessURL": "https://www.pacificgeoportal.com/api/download/v1/items/af244e4810454ab8baf2768a69deee62/shapefile?layers=0"
				},
				{
					"@type": "dcat:Distribution",
					"title": "GeoJSON",
					"format": "GeoJSON",
					"mediaType": "application/vnd.geo+json",
					"accessURL": "https://www.pacificgeoportal.com/api/download/v1/items/af244e4810454ab8baf2768a69deee62/geojson?layers=0"
				},
				{
					"@type": "dcat:Distribution",
					"title": "KML",
					"format": "KML",
					"mediaType": "application/vnd.google-earth.kml+xml",
					"accessURL": "https://www.pacificgeoportal.com/api/download/v1/items/af244e4810454ab8baf2768a69deee62/kml?layers=0"
				}
			],
			"theme": [
				"geospatial"
			]
		},
		{
			"@type": "dcat:Dataset",
			"identifier": "https://www.arcgis.com/home/item.html?id=743db182392a47c5a7231fbab9a43b91&sublayer=0",
			"landingPage": "https://www.pacificgeoportal.com/datasets/743db182392a47c5a7231fbab9a43b91_0",
			"title": "OpenStreetMap POIs for Australia and Oceania",
			"description": "<span style='font-family:&quot;Avenir Next W01&quot;, &quot;Avenir Next W00&quot;, &quot;Avenir Next&quot;, Avenir, &quot;Helvetica Neue&quot;, sans-serif; font-size:17px;'>This feature layer provides access to OpenStreetMap (OSM) point of interest (</span><span style='font-family:&quot;Avenir Next W01&quot;, &quot;Avenir Next W00&quot;, &quot;Avenir Next&quot;, Avenir, &quot;Helvetica Neue&quot;, sans-serif; font-size:17px;'>POI) </span><span style='font-family:&quot;Avenir Next W01&quot;, &quot;Avenir Next W00&quot;, &quot;Avenir Next&quot;, Avenir, &quot;Helvetica Neue&quot;, sans-serif; font-size:17px;'>data for Australia and Oceania, which is <b>updated every 1-2 minutes</b> with the latest edits<b>.</b> This </span><a href='https://doc.arcgis.com/en/arcgis-online/share-maps/about-sharing-feature-layer-data-as-copies.htm' rel='nofollow ugc' style='color:rgb(0, 121, 193); font-family:&quot;Avenir Next W01&quot;, &quot;Avenir Next W00&quot;, &quot;Avenir Next&quot;, Avenir, &quot;Helvetica Neue&quot;, sans-serif; font-size:16px; text-decoration-line:none;' target='_blank'>hosted feature layer view</a><span style='font-family:&quot;Avenir Next W01&quot;, &quot;Avenir Next W00&quot;, &quot;Avenir Next&quot;, Avenir, &quot;Helvetica Neue&quot;, sans-serif; font-size:17px;'> is referencing a hosted feature layer of OSM point (node) data in ArcGIS Online that is updated with minutely diffs from the OSM planet file. The layer includes POIs with a large number of tags, including </span><a href='https://wiki.openstreetmap.org/wiki/Key:amenity' rel='nofollow ugc' style='color:rgb(0, 121, 193); font-family:inherit; font-size:16px; text-decoration-line:none;' target='_blank'>amenity</a><span style='font-family:&quot;Avenir Next W01&quot;, &quot;Avenir Next W00&quot;, &quot;Avenir Next&quot;, Avenir, &quot;Helvetica Neue&quot;, sans-serif; font-size:16px;'>, </span><font style='font-family:inherit; font-size:16px;'><font style='font-family:inherit;'><a href='https://wiki.openstreetmap.org/wiki/Key:shop' rel='nofollow ugc' style='color:rgb(0, 121, 193); font-family:inherit; text-decoration-line:none;' target='_blank'>shop</a>,<span> </span></font></font><a href='https://wiki.openstreetmap.org/wiki/Key:tourism' rel='nofollow ugc' style='color:rgb(0, 121, 193); font-family:inherit; font-size:16px; text-decoration-line:none;' target='_blank'>tourism</a><span style='font-family:&quot;Avenir Next W01&quot;, &quot;Avenir Next W00&quot;, &quot;Avenir Next&quot;, Avenir, &quot;Helvetica Neue&quot;, sans-serif; font-size:17px;'>, and several more.</span><div style='font-family:&quot;Avenir Next W01&quot;, &quot;Avenir Next W00&quot;, &quot;Avenir Next&quot;, Avenir, &quot;Helvetica Neue&quot;, sans-serif; font-size:16px;'><div style='font-family:inherit;'><span style='font-family:&quot;Avenir Next W01&quot;, &quot;Avenir Next W00&quot;, &quot;Avenir Next&quot;, Avenir, &quot;Helvetica Neue&quot;, Helvetica, Arial, sans-serif; font-size:17px;'><br /></span></div><div style='font-family:inherit;'><span style='font-family:&quot;Avenir Next W01&quot;, &quot;Avenir Next W00&quot;, &quot;Avenir Next&quot;, Avenir, &quot;Helvetica Neue&quot;, Helvetica, Arial, sans-serif; font-size:17px;'>Zoom in to large scales (e.g. City level or 1:80k scale) to see the POI features display.  </span><span style='font-family:&quot;Avenir Next W01&quot;, &quot;Avenir Next W00&quot;, &quot;Avenir Next&quot;, Avenir, &quot;Helvetica Neue&quot;, Helvetica, Arial, sans-serif; font-size:17px;'>You can click on the feature to get the name of the POI.  The name of the POI will display by default at very large scales (e.g. Building level of 1:2k scale).  Labels can be turned off in your map if you prefer.</span></div></div><div style='font-family:&quot;Avenir Next W01&quot;, &quot;Avenir Next W00&quot;, &quot;Avenir Next&quot;, Avenir, &quot;Helvetica Neue&quot;, sans-serif; font-size:16px;'><span style='font-family:&quot;Avenir Next W01&quot;, &quot;Avenir Next W00&quot;, &quot;Avenir Next&quot;, Avenir, &quot;Helvetica Neue&quot;, Helvetica, Arial, sans-serif; font-size:17px;'><br /></span></div><div style='font-family:&quot;Avenir Next W01&quot;, &quot;Avenir Next W00&quot;, &quot;Avenir Next&quot;, Avenir, &quot;Helvetica Neue&quot;, sans-serif; font-size:16px;'><span style='font-family:&quot;Avenir Next W01&quot;, &quot;Avenir Next W00&quot;, &quot;Avenir Next&quot;, Avenir, &quot;Helvetica Neue&quot;, Helvetica, Arial, sans-serif; font-size:17px;'><b>Create New Layer</b></span></div><div style='font-family:&quot;Avenir Next W01&quot;, &quot;Avenir Next W00&quot;, &quot;Avenir Next&quot;, Avenir, &quot;Helvetica Neue&quot;, sans-serif; font-size:16px;'><span style='font-family:&quot;Avenir Next W01&quot;, &quot;Avenir Next W00&quot;, &quot;Avenir Next&quot;, Avenir, &quot;Helvetica Neue&quot;, Helvetica, Arial, sans-serif; font-size:17px;'>If you would like to create a more focused version of this POI layer displaying just one or two types, you can do that easily!  Just add the layer to a map, copy the layer in the content window, add a filter to the new layer (e.g. amenity is bar or shop is alcohol), rename the layer as appropriate, and save layer.  You can also change the layer symbols or popup if you like.  Esri may publish a few such layers that are ready to use, but not for every type of amenity.</span></div><div style='font-family:&quot;Avenir Next W01&quot;, &quot;Avenir Next W00&quot;, &quot;Avenir Next&quot;, Avenir, &quot;Helvetica Neue&quot;, sans-serif; font-size:16px;'><span style='font-family:&quot;Avenir Next W01&quot;, &quot;Avenir Next W00&quot;, &quot;Avenir Next&quot;, Avenir, &quot;Helvetica Neue&quot;, Helvetica, Arial, sans-serif; font-size:17px;'><br /></span></div><div style='font-family:&quot;Avenir Next W01&quot;, &quot;Avenir Next W00&quot;, &quot;Avenir Next&quot;, Avenir, &quot;Helvetica Neue&quot;, sans-serif; font-size:16px;'><span style='font-family:&quot;Avenir Next W01&quot;, &quot;Avenir Next W00&quot;, &quot;Avenir Next&quot;, Avenir, &quot;Helvetica Neue&quot;, Helvetica, Arial, sans-serif; font-size:17px;'><b><i>Important Note</i></b>: if you do create a new layer, it should be provided under the same Terms of Use and include the same Credits as this layer.  You can copy and paste the Terms of Use and Credits info below in the new Item page as needed.</span></div>",
			"keyword": [
				"osm",
				"OpenStreetMap",
				"POI",
				"Australia",
				"Oceania",
				"Points of Interest",
				"American Samoa",
				"Cook Islands",
				"Fed States of Micronesia",
				"Fiji",
				"French Polynesia",
				"Guam",
				"Kiribati",
				"Marshall Islands",
				"Nauru",
				"New Caledonia",
				"Niue",
				"North Mariana Islands",
				"Palau",
				"Papua New Guinea",
				"Pitcairn Islands",
				"Samoa",
				"Solomon Islands",
				"Tokelau",
				"Tonga",
				"Tuvalu",
				"Vanuatu",
				"Wallis and Futuna"
			],
			"issued": "2021-04-30T22:06:25.000Z",
			"modified": "2026-08-12T20:49:04.006Z",
			"publisher": {
				"name": "{{source}}"
			},
			"contactPoint": {
				"@type": "vcard:Contact",
				"fn": "smoore3_osm",
				"hasEmail": "{{orgContactEmail}}"
			},
			"accessLevel": "public",
			"spatial": "-179.9997,-56.9670,180.0000,26.0812",
			"license": "https://opendatacommons.org/licenses/odbl/summary",
			"distribution": [
				{
					"@type": "dcat:Distribution",
					"title": "ArcGIS Hub Dataset",
					"format": "Web Page",
					"mediaType": "text/html",
					"accessURL": "https://www.pacificgeoportal.com/datasets/743db182392a47c5a7231fbab9a43b91_0"
				},
				{
					"@type": "dcat:Distribution",
					"title": "ArcGIS GeoService",
					"format": "ArcGIS GeoServices REST API",
					"mediaType": "application/json",
					"accessURL": "https://services-ap1.arcgis.com/iA7fZQOnjY9D67Zx/arcgis/rest/services/OSM_AU_POIs/FeatureServer/0"
				},
				{
					"@type": "dcat:Distribution",
					"title": "CSV",
					"format": "CSV",
					"mediaType": "text/csv",
					"accessURL": "https://www.pacificgeoportal.com/api/download/v1/items/743db182392a47c5a7231fbab9a43b91/csv?layers=0"
				},
				{
					"@type": "dcat:Distribution",
					"title": "Shapefile",
					"format": "ZIP",
					"mediaType": "application/zip",
					"accessURL": "https://www.pacificgeoportal.com/api/download/v1/items/743db182392a47c5a7231fbab9a43b91/shapefile?layers=0"
				},
				{
					"@type": "dcat:Distribution",
					"title": "GeoJSON",
					"format": "GeoJSON",
					"mediaType": "application/vnd.geo+json",
					"accessURL": "https://www.pacificgeoportal.com/api/download/v1/items/743db182392a47c5a7231fbab9a43b91/geojson?layers=0"
				},
				{
					"@type": "dcat:Distribution",
					"title": "KML",
					"format": "KML",
					"mediaType": "application/vnd.google-earth.kml+xml",
					"accessURL": "https://www.pacificgeoportal.com/api/download/v1/items/743db182392a47c5a7231fbab9a43b91/kml?layers=0"
				}
			],
			"theme": [
				"geospatial"
			]
		},
		{
			"@type": "dcat:Dataset",
			"identifier": "https://www.arcgis.com/home/item.html?id=76e2281c81814e8c8c7e6cb1081f4d22&sublayer=0",
			"landingPage": "https://www.pacificgeoportal.com/datasets/76e2281c81814e8c8c7e6cb1081f4d22_0",
			"title": "OpenStreetMap Tourist Attractions for Australia and Oceania",
			"description": "<span style='font-family:&quot;Avenir Next W01&quot;, &quot;Avenir Next W00&quot;, &quot;Avenir Next&quot;, Avenir, &quot;Helvetica Neue&quot;, sans-serif; font-size:17px;'>This feature layer provides access to OpenStreetMap (OSM) </span><span style='font-family:&quot;Avenir Next W01&quot;, &quot;Avenir Next W00&quot;, &quot;Avenir Next&quot;, Avenir, &quot;Helvetica Neue&quot;, sans-serif; font-size:17px;'><b>tourist attraction point </b></span><font style='font-family:&quot;Avenir Next W01&quot;, &quot;Avenir Next W00&quot;, &quot;Avenir Next&quot;, Avenir, &quot;Helvetica Neue&quot;, sans-serif; font-size:16px;'><span style='font-family:inherit; font-size:17px;'><b>data</b> for Australia and Oceania, which is </span></font><b>updated every 5 minutes</b><font style='font-family:&quot;Avenir Next W01&quot;, &quot;Avenir Next W00&quot;, &quot;Avenir Next&quot;, Avenir, &quot;Helvetica Neue&quot;, sans-serif; font-size:16px;'><span style='font-family:inherit; font-size:17px;'> with the latest edits.</span></font><b> </b><font style='font-family:&quot;Avenir Next W01&quot;, &quot;Avenir Next W00&quot;, &quot;Avenir Next&quot;, Avenir, &quot;Helvetica Neue&quot;, sans-serif; font-size:16px;'><span style='font-family:inherit; font-size:17px;'>This </span></font><a href='https://doc.arcgis.com/en/arcgis-online/share-maps/about-sharing-feature-layer-data-as-copies.htm' rel='nofollow ugc' style='color:rgb(0, 121, 193); font-family:&quot;Avenir Next W01&quot;, &quot;Avenir Next W00&quot;, &quot;Avenir Next&quot;, Avenir, &quot;Helvetica Neue&quot;, sans-serif; font-size:16px; text-decoration-line:none;' target='_blank'>hosted feature layer view</a><span style='font-family:&quot;Avenir Next W01&quot;, &quot;Avenir Next W00&quot;, &quot;Avenir Next&quot;, Avenir, &quot;Helvetica Neue&quot;, sans-serif; font-size:17px;'> is referencing a hosted feature layer of OSM point (node) data in ArcGIS Online that is updated with minutely diffs from the OSM planet file.  This feature </span><span style='font-family:&quot;Avenir Next W01&quot;, &quot;Avenir Next W00&quot;, &quot;Avenir Next&quot;, Avenir, &quot;Helvetica Neue&quot;, sans-serif; font-size:17px;'>layer view</span><span style='font-family:&quot;Avenir Next W01&quot;, &quot;Avenir Next W00&quot;, &quot;Avenir Next&quot;, Avenir, &quot;Helvetica Neue&quot;, sans-serif; font-size:17px;'> includes tourism </span><span style='font-family:&quot;Avenir Next W01&quot;, &quot;Avenir Next W00&quot;, &quot;Avenir Next&quot;, Avenir, &quot;Helvetica Neue&quot;, sans-serif; font-size:17px;'>features defined as a query against the hosted feature layer (i.e. tourism is not blank).</span><div style='font-family:&quot;Avenir Next W01&quot;, &quot;Avenir Next W00&quot;, &quot;Avenir Next&quot;, Avenir, &quot;Helvetica Neue&quot;, sans-serif; font-size:16px;'><br /></div><div style='font-family:&quot;Avenir Next W01&quot;, &quot;Avenir Next W00&quot;, &quot;Avenir Next&quot;, Avenir, &quot;Helvetica Neue&quot;, sans-serif; font-size:16px;'><font style='font-family:inherit;'><span style='font-family:inherit;'>In OSM, tourism features are <b>places and things of specific interest to tourists</b> including places to see, places to stay, things and places providing information and support to tourists.  These features are identified with a </span><a href='https://wiki.openstreetmap.org/wiki/Key:tourism' rel='nofollow ugc' style='color:rgb(0, 121, 193); font-family:inherit; text-decoration-line:none;' target='_blank'>tourism tag</a><span style='font-family:inherit;'>.  There are hundreds of different tag values used in the OSM database.  In this feature layer, unique symbols are used for several of the most popular tourism types, while lesser used types are grouped in an &quot;other&quot; category.</span></font><br /></div><div style='font-family:&quot;Avenir Next W01&quot;, &quot;Avenir Next W00&quot;, &quot;Avenir Next&quot;, Avenir, &quot;Helvetica Neue&quot;, sans-serif; font-size:16px;'><div style='font-family:inherit;'><span style='font-family:&quot;Avenir Next W01&quot;, &quot;Avenir Next W00&quot;, &quot;Avenir Next&quot;, Avenir, &quot;Helvetica Neue&quot;, Helvetica, Arial, sans-serif; font-size:17px;'><br /></span></div><div style='font-family:inherit;'><span style='font-family:&quot;Avenir Next W01&quot;, &quot;Avenir Next W00&quot;, &quot;Avenir Next&quot;, Avenir, &quot;Helvetica Neue&quot;, Helvetica, Arial, sans-serif; font-size:17px;'>Zoom in to large scales (e.g. Cities level or 1:160k scale) to see the tourism features display.  </span><span style='font-family:&quot;Avenir Next W01&quot;, &quot;Avenir Next W00&quot;, &quot;Avenir Next&quot;, Avenir, &quot;Helvetica Neue&quot;, Helvetica, Arial, sans-serif; font-size:17px;'>You can click on </span><span style='font-family:&quot;Avenir Next W01&quot;, &quot;Avenir Next W00&quot;, &quot;Avenir Next&quot;, Avenir, &quot;Helvetica Neue&quot;, Helvetica, Arial, sans-serif; font-size:17px;'>a </span><span style='font-family:&quot;Avenir Next W01&quot;, &quot;Avenir Next W00&quot;, &quot;Avenir Next&quot;, Avenir, &quot;Helvetica Neue&quot;, Helvetica, Arial, sans-serif; font-size:17px;'>feature to get the name of the tourism feature.  The name of the feature will display by default at very large scales (e.g. Building level of 1:2k scale).  Labels can be turned off in your map if you prefer.</span></div></div><div style='font-family:&quot;Avenir Next W01&quot;, &quot;Avenir Next W00&quot;, &quot;Avenir Next&quot;, Avenir, &quot;Helvetica Neue&quot;, sans-serif; font-size:16px;'><span style='font-family:&quot;Avenir Next W01&quot;, &quot;Avenir Next W00&quot;, &quot;Avenir Next&quot;, Avenir, &quot;Helvetica Neue&quot;, Helvetica, Arial, sans-serif; font-size:17px;'><br /></span></div><div style='font-family:&quot;Avenir Next W01&quot;, &quot;Avenir Next W00&quot;, &quot;Avenir Next&quot;, Avenir, &quot;Helvetica Neue&quot;, sans-serif; font-size:16px;'><span style='font-family:&quot;Avenir Next W01&quot;, &quot;Avenir Next W00&quot;, &quot;Avenir Next&quot;, Avenir, &quot;Helvetica Neue&quot;, Helvetica, Arial, sans-serif; font-size:17px;'><b>Create New Layer</b></span></div><div style='font-family:&quot;Avenir Next W01&quot;, &quot;Avenir Next W00&quot;, &quot;Avenir Next&quot;, Avenir, &quot;Helvetica Neue&quot;, sans-serif; font-size:16px;'><span style='font-family:&quot;Avenir Next W01&quot;, &quot;Avenir Next W00&quot;, &quot;Avenir Next&quot;, Avenir, &quot;Helvetica Neue&quot;, Helvetica, Arial, sans-serif; font-size:17px;'>If you would like to create a more focused version of this tourism layer displaying just one or two tourism types, you can do that easily!  Just add the layer to a map, copy the layer in the content window, add a filter to the new layer (e.g. tourism is ruin), rename the layer as appropriate, and save layer.  You can also change the layer symbols or popup if you like.</span></div><div style='font-family:&quot;Avenir Next W01&quot;, &quot;Avenir Next W00&quot;, &quot;Avenir Next&quot;, Avenir, &quot;Helvetica Neue&quot;, sans-serif; font-size:16px;'><span style='font-family:&quot;Avenir Next W01&quot;, &quot;Avenir Next W00&quot;, &quot;Avenir Next&quot;, Avenir, &quot;Helvetica Neue&quot;, Helvetica, Arial, sans-serif; font-size:17px;'><br /></span></div><div style='font-family:&quot;Avenir Next W01&quot;, &quot;Avenir Next W00&quot;, &quot;Avenir Next&quot;, Avenir, &quot;Helvetica Neue&quot;, sans-serif; font-size:16px;'><span style='font-family:&quot;Avenir Next W01&quot;, &quot;Avenir Next W00&quot;, &quot;Avenir Next&quot;, Avenir, &quot;Helvetica Neue&quot;, Helvetica, Arial, sans-serif; font-size:17px;'><b><i>Important Note</i></b>: if you do create a new layer, it should be provided under the same Terms of Use and include the same Credits as this layer.  You can copy and paste the Terms of Use and Credits info below in the new Item page as needed.</span></div>",
			"keyword": [
				"osm",
				"OpenStreetMap",
				"tourism",
				"Australia",
				"Oceania",
				"tourist attraction",
				"American Samoa",
				"Cook Islands",
				"Fed States of Micronesia",
				"Fiji",
				"French Polynesia",
				"Guam",
				"Kiribati",
				"Marshall Islands",
				"Nauru",
				"New Caledonia",
				"Niue",
				"North Mariana Islands",
				"Palau",
				"Papua New Guinea",
				"Pitcairn Islands",
				"Samoa",
				"Solomon Islands",
				"Tokelau",
				"Tonga",
				"Tuvalu",
				"Vanuatu",
				"Wallis and Futuna"
			],
			"issued": "2021-04-30T22:10:06.000Z",
			"modified": "2026-08-12T20:49:04.006Z",
			"publisher": {
				"name": "{{source}}"
			},
			"contactPoint": {
				"@type": "vcard:Contact",
				"fn": "smoore3_osm",
				"hasEmail": "{{orgContactEmail}}"
			},
			"accessLevel": "public",
			"spatial": "-179.9997,-56.9670,180.0000,26.0812",
			"license": "https://opendatacommons.org/licenses/odbl/summary",
			"distribution": [
				{
					"@type": "dcat:Distribution",
					"title": "ArcGIS Hub Dataset",
					"format": "Web Page",
					"mediaType": "text/html",
					"accessURL": "https://www.pacificgeoportal.com/datasets/76e2281c81814e8c8c7e6cb1081f4d22_0"
				},
				{
					"@type": "dcat:Distribution",
					"title": "ArcGIS GeoService",
					"format": "ArcGIS GeoServices REST API",
					"mediaType": "application/json",
					"accessURL": "https://services-ap1.arcgis.com/iA7fZQOnjY9D67Zx/arcgis/rest/services/OSM_AU_Tourism/FeatureServer/0"
				},
				{
					"@type": "dcat:Distribution",
					"title": "CSV",
					"format": "CSV",
					"mediaType": "text/csv",
					"accessURL": "https://www.pacificgeoportal.com/api/download/v1/items/76e2281c81814e8c8c7e6cb1081f4d22/csv?layers=0"
				},
				{
					"@type": "dcat:Distribution",
					"title": "Shapefile",
					"format": "ZIP",
					"mediaType": "application/zip",
					"accessURL": "https://www.pacificgeoportal.com/api/download/v1/items/76e2281c81814e8c8c7e6cb1081f4d22/shapefile?layers=0"
				},
				{
					"@type": "dcat:Distribution",
					"title": "GeoJSON",
					"format": "GeoJSON",
					"mediaType": "application/vnd.geo+json",
					"accessURL": "https://www.pacificgeoportal.com/api/download/v1/items/76e2281c81814e8c8c7e6cb1081f4d22/geojson?layers=0"
				},
				{
					"@type": "dcat:Distribution",
					"title": "KML",
					"format": "KML",
					"mediaType": "application/vnd.google-earth.kml+xml",
					"accessURL": "https://www.pacificgeoportal.com/api/download/v1/items/76e2281c81814e8c8c7e6cb1081f4d22/kml?layers=0"
				}
			],
			"theme": [
				"geospatial"
			]
		},
		{
			"@type": "dcat:Dataset",
			"identifier": "https://www.arcgis.com/home/item.html?id=988071da24954be5b250a5d2a6bc6cab&sublayer=0",
			"landingPage": "https://www.pacificgeoportal.com/datasets/988071da24954be5b250a5d2a6bc6cab_0",
			"title": "OpenStreetMap Shops for Australia and Oceania",
			"description": "<span style='font-family:&quot;Avenir Next W01&quot;, &quot;Avenir Next W00&quot;, &quot;Avenir Next&quot;, Avenir, &quot;Helvetica Neue&quot;, sans-serif; font-size:17px;'>This feature layer provides access to OpenStreetMap (OSM) </span><span style='font-family:&quot;Avenir Next W01&quot;, &quot;Avenir Next W00&quot;, &quot;Avenir Next&quot;, Avenir, &quot;Helvetica Neue&quot;, sans-serif; font-size:17px;'>shops </span><font style='font-family:&quot;Avenir Next W01&quot;, &quot;Avenir Next W00&quot;, &quot;Avenir Next&quot;, Avenir, &quot;Helvetica Neue&quot;, sans-serif; font-size:16px;'><span style='font-family:inherit; font-size:17px;'>data for Australia and Oceania, which is </span></font><b>updated every 5 minutes</b><font style='font-family:&quot;Avenir Next W01&quot;, &quot;Avenir Next W00&quot;, &quot;Avenir Next&quot;, Avenir, &quot;Helvetica Neue&quot;, sans-serif; font-size:16px;'><span style='font-family:inherit; font-size:17px;'> with the latest edits.</span></font><b> </b><font style='font-family:&quot;Avenir Next W01&quot;, &quot;Avenir Next W00&quot;, &quot;Avenir Next&quot;, Avenir, &quot;Helvetica Neue&quot;, sans-serif; font-size:16px;'><span style='font-family:inherit; font-size:17px;'>This </span></font><a href='https://doc.arcgis.com/en/arcgis-online/share-maps/about-sharing-feature-layer-data-as-copies.htm' rel='nofollow ugc' style='color:rgb(0, 121, 193); font-family:&quot;Avenir Next W01&quot;, &quot;Avenir Next W00&quot;, &quot;Avenir Next&quot;, Avenir, &quot;Helvetica Neue&quot;, sans-serif; font-size:16px; text-decoration-line:none;' target='_blank'>hosted feature layer view</a><span style='font-family:&quot;Avenir Next W01&quot;, &quot;Avenir Next W00&quot;, &quot;Avenir Next&quot;, Avenir, &quot;Helvetica Neue&quot;, sans-serif; font-size:17px;'> is referencing a hosted feature layer of OSM point (node) data in ArcGIS Online that is updated with minutely diffs from the OSM planet file.  This feature </span><span style='font-family:&quot;Avenir Next W01&quot;, &quot;Avenir Next W00&quot;, &quot;Avenir Next&quot;, Avenir, &quot;Helvetica Neue&quot;, sans-serif; font-size:17px;'>layer view</span><span style='font-family:&quot;Avenir Next W01&quot;, &quot;Avenir Next W00&quot;, &quot;Avenir Next&quot;, Avenir, &quot;Helvetica Neue&quot;, sans-serif; font-size:17px;'> includes shop </span><span style='font-family:&quot;Avenir Next W01&quot;, &quot;Avenir Next W00&quot;, &quot;Avenir Next&quot;, Avenir, &quot;Helvetica Neue&quot;, sans-serif; font-size:17px;'>features defined as a query against the hosted feature layer (i.e. shop is not blank).</span><div style='font-family:&quot;Avenir Next W01&quot;, &quot;Avenir Next W00&quot;, &quot;Avenir Next&quot;, Avenir, &quot;Helvetica Neue&quot;, sans-serif; font-size:16px;'><font style='font-family:inherit;'><span style='font-family:inherit; font-size:17px;'><br /></span></font></div><div style='font-family:&quot;Avenir Next W01&quot;, &quot;Avenir Next W00&quot;, &quot;Avenir Next&quot;, Avenir, &quot;Helvetica Neue&quot;, sans-serif; font-size:16px;'><font style='font-family:inherit;'><span style='font-family:inherit; font-size:17px;'>In OSM, a shop is </span></font><font style='font-family:inherit;'><font style='font-family:inherit;'><span style='font-family:inherit; font-size:17px;'>a<b> place selling retail products or services</b></span></font><font style='font-family:inherit;'><span style='font-family:inherit; font-size:17px;'>, such as a supermarket, bakery, or florist.  These features are identified with a </span></font></font><font style='font-family:inherit;'><a href='https://wiki.openstreetmap.org/wiki/Key:shop' rel='nofollow ugc' style='color:rgb(0, 121, 193); font-family:inherit; text-decoration-line:none;' target='_blank'>shop tag</a><span style='font-family:inherit; font-size:17px;'>.  There are thousands of different tag values for shop used in the OSM database.  In this feature layer, unique symbols are used for several of the most popular shop types, while lesser used types are grouped in an &quot;other&quot; category.<br /></span></font><div style='font-family:inherit;'><span style='font-family:&quot;Avenir Next W01&quot;, &quot;Avenir Next W00&quot;, &quot;Avenir Next&quot;, Avenir, &quot;Helvetica Neue&quot;, Helvetica, Arial, sans-serif; font-size:17px;'><br /></span></div><div style='font-family:inherit;'><span style='font-family:&quot;Avenir Next W01&quot;, &quot;Avenir Next W00&quot;, &quot;Avenir Next&quot;, Avenir, &quot;Helvetica Neue&quot;, Helvetica, Arial, sans-serif; font-size:17px;'>Zoom in to large scales (e.g. Neighborhood level or 1:80k scale) to see the shop features display.  </span><span style='font-family:&quot;Avenir Next W01&quot;, &quot;Avenir Next W00&quot;, &quot;Avenir Next&quot;, Avenir, &quot;Helvetica Neue&quot;, Helvetica, Arial, sans-serif; font-size:17px;'>You can click on the feature to get the name of the shop.  The name of the shop will display by default at very large scales (e.g. Building level of 1:2k scale).  Labels can be turned off in your map if you prefer.</span></div></div><div style='font-family:&quot;Avenir Next W01&quot;, &quot;Avenir Next W00&quot;, &quot;Avenir Next&quot;, Avenir, &quot;Helvetica Neue&quot;, sans-serif; font-size:16px;'><span style='font-family:&quot;Avenir Next W01&quot;, &quot;Avenir Next W00&quot;, &quot;Avenir Next&quot;, Avenir, &quot;Helvetica Neue&quot;, Helvetica, Arial, sans-serif; font-size:17px;'><br /></span></div><div style='font-family:&quot;Avenir Next W01&quot;, &quot;Avenir Next W00&quot;, &quot;Avenir Next&quot;, Avenir, &quot;Helvetica Neue&quot;, sans-serif; font-size:16px;'><span style='font-family:&quot;Avenir Next W01&quot;, &quot;Avenir Next W00&quot;, &quot;Avenir Next&quot;, Avenir, &quot;Helvetica Neue&quot;, Helvetica, Arial, sans-serif; font-size:17px;'><b>Create New Layer</b></span></div><div style='font-family:&quot;Avenir Next W01&quot;, &quot;Avenir Next W00&quot;, &quot;Avenir Next&quot;, Avenir, &quot;Helvetica Neue&quot;, sans-serif; font-size:16px;'><span style='font-family:&quot;Avenir Next W01&quot;, &quot;Avenir Next W00&quot;, &quot;Avenir Next&quot;, Avenir, &quot;Helvetica Neue&quot;, Helvetica, Arial, sans-serif; font-size:17px;'>If you would like to create a more focused version of this shop layer displaying just one or two shop types, you can do that easily!  Just add the layer to a map, copy the layer in the content window, add a filter to the new layer (e.g. shop is jewelry), rename the layer as appropriate, and save layer.  You can also change the layer symbols or popup if you like.  Esri may publish a few such layers (e.g. supermarket or convenience shop) that are ready to use, but not for every type of shop.</span></div><div style='font-family:&quot;Avenir Next W01&quot;, &quot;Avenir Next W00&quot;, &quot;Avenir Next&quot;, Avenir, &quot;Helvetica Neue&quot;, sans-serif; font-size:16px;'><span style='font-family:&quot;Avenir Next W01&quot;, &quot;Avenir Next W00&quot;, &quot;Avenir Next&quot;, Avenir, &quot;Helvetica Neue&quot;, Helvetica, Arial, sans-serif; font-size:17px;'><br /></span></div><div style='font-family:&quot;Avenir Next W01&quot;, &quot;Avenir Next W00&quot;, &quot;Avenir Next&quot;, Avenir, &quot;Helvetica Neue&quot;, sans-serif; font-size:16px;'><span style='font-family:&quot;Avenir Next W01&quot;, &quot;Avenir Next W00&quot;, &quot;Avenir Next&quot;, Avenir, &quot;Helvetica Neue&quot;, Helvetica, Arial, sans-serif; font-size:17px;'><b><i>Important Note</i></b>: if you do create a new layer, it should be provided under the same Terms of Use and include the same Credits as this layer.  You can copy and paste the Terms of Use and Credits info below in the new Item page as needed.</span></div>",
			"keyword": [
				"osm",
				"OpenStreetMap",
				"shop",
				"Australia",
				"Oceania",
				"American Samoa",
				"Cook Islands",
				"Fed States of Micronesia",
				"Fiji",
				"French Polynesia",
				"Guam",
				"Kiribati",
				"Marshall Islands",
				"Nauru",
				"New Caledonia",
				"Niue",
				"North Mariana Islands",
				"Palau",
				"Papua New Guinea",
				"Pitcairn Islands",
				"Samoa",
				"Solomon Islands",
				"Tokelau",
				"Tonga",
				"Tuvalu",
				"Vanuatu",
				"Wallis and Futuna"
			],
			"issued": "2021-04-30T22:04:43.000Z",
			"modified": "2026-08-12T20:49:04.006Z",
			"publisher": {
				"name": "{{source}}"
			},
			"contactPoint": {
				"@type": "vcard:Contact",
				"fn": "smoore3_osm",
				"hasEmail": "{{orgContactEmail}}"
			},
			"accessLevel": "public",
			"spatial": "-179.9997,-56.9670,180.0000,26.0812",
			"license": "https://opendatacommons.org/licenses/odbl/summary",
			"distribution": [
				{
					"@type": "dcat:Distribution",
					"title": "ArcGIS Hub Dataset",
					"format": "Web Page",
					"mediaType": "text/html",
					"accessURL": "https://www.pacificgeoportal.com/datasets/988071da24954be5b250a5d2a6bc6cab_0"
				},
				{
					"@type": "dcat:Distribution",
					"title": "ArcGIS GeoService",
					"format": "ArcGIS GeoServices REST API",
					"mediaType": "application/json",
					"accessURL": "https://services-ap1.arcgis.com/iA7fZQOnjY9D67Zx/arcgis/rest/services/OSM_AU_Shops/FeatureServer/0"
				},
				{
					"@type": "dcat:Distribution",
					"title": "CSV",
					"format": "CSV",
					"mediaType": "text/csv",
					"accessURL": "https://www.pacificgeoportal.com/api/download/v1/items/988071da24954be5b250a5d2a6bc6cab/csv?layers=0"
				},
				{
					"@type": "dcat:Distribution",
					"title": "Shapefile",
					"format": "ZIP",
					"mediaType": "application/zip",
					"accessURL": "https://www.pacificgeoportal.com/api/download/v1/items/988071da24954be5b250a5d2a6bc6cab/shapefile?layers=0"
				},
				{
					"@type": "dcat:Distribution",
					"title": "GeoJSON",
					"format": "GeoJSON",
					"mediaType": "application/vnd.geo+json",
					"accessURL": "https://www.pacificgeoportal.com/api/download/v1/items/988071da24954be5b250a5d2a6bc6cab/geojson?layers=0"
				},
				{
					"@type": "dcat:Distribution",
					"title": "KML",
					"format": "KML",
					"mediaType": "application/vnd.google-earth.kml+xml",
					"accessURL": "https://www.pacificgeoportal.com/api/download/v1/items/988071da24954be5b250a5d2a6bc6cab/kml?layers=0"
				}
			],
			"theme": [
				"geospatial"
			]
		},
		{
			"@type": "dcat:Dataset",
			"identifier": "https://www.arcgis.com/home/item.html?id=b4e6461dacd946ea854115570ee4ea68&sublayer=0",
			"landingPage": "https://www.pacificgeoportal.com/datasets/b4e6461dacd946ea854115570ee4ea68_0",
			"title": "OpenStreetMap Amenities for Australia and Oceania",
			"description": "<span style='font-family:&quot;Avenir Next W01&quot;, &quot;Avenir Next W00&quot;, &quot;Avenir Next&quot;, Avenir, &quot;Helvetica Neue&quot;, sans-serif; font-size:17px;'>This feature layer provides access to OpenStreetMap (OSM) </span><span style='font-family:&quot;Avenir Next W01&quot;, &quot;Avenir Next W00&quot;, &quot;Avenir Next&quot;, Avenir, &quot;Helvetica Neue&quot;, sans-serif; font-size:17px;'>amenity </span><font style='font-family:&quot;Avenir Next W01&quot;, &quot;Avenir Next W00&quot;, &quot;Avenir Next&quot;, Avenir, &quot;Helvetica Neue&quot;, sans-serif; font-size:16px;'><span style='font-family:inherit; font-size:17px;'>data for Australia and Oceania, which is </span></font><b>updated every 5 minutes</b><font style='font-family:&quot;Avenir Next W01&quot;, &quot;Avenir Next W00&quot;, &quot;Avenir Next&quot;, Avenir, &quot;Helvetica Neue&quot;, sans-serif; font-size:16px;'><span style='font-family:inherit; font-size:17px;'> with the latest edits.</span></font><b> </b><font style='font-family:&quot;Avenir Next W01&quot;, &quot;Avenir Next W00&quot;, &quot;Avenir Next&quot;, Avenir, &quot;Helvetica Neue&quot;, sans-serif; font-size:16px;'><span style='font-family:inherit; font-size:17px;'>This </span></font><a href='https://doc.arcgis.com/en/arcgis-online/share-maps/about-sharing-feature-layer-data-as-copies.htm' rel='nofollow ugc' style='color:rgb(0, 121, 193); font-family:&quot;Avenir Next W01&quot;, &quot;Avenir Next W00&quot;, &quot;Avenir Next&quot;, Avenir, &quot;Helvetica Neue&quot;, sans-serif; font-size:16px; text-decoration-line:none;' target='_blank'>hosted feature layer view</a><span style='font-family:&quot;Avenir Next W01&quot;, &quot;Avenir Next W00&quot;, &quot;Avenir Next&quot;, Avenir, &quot;Helvetica Neue&quot;, sans-serif; font-size:17px;'> is referencing a hosted feature layer of OSM point (node) data in ArcGIS Online that is updated with minutely diffs from the OSM planet file.  This feature </span><span style='font-family:&quot;Avenir Next W01&quot;, &quot;Avenir Next W00&quot;, &quot;Avenir Next&quot;, Avenir, &quot;Helvetica Neue&quot;, sans-serif; font-size:17px;'>layer view</span><span style='font-family:&quot;Avenir Next W01&quot;, &quot;Avenir Next W00&quot;, &quot;Avenir Next&quot;, Avenir, &quot;Helvetica Neue&quot;, sans-serif; font-size:17px;'> includes amenity </span><span style='font-family:&quot;Avenir Next W01&quot;, &quot;Avenir Next W00&quot;, &quot;Avenir Next&quot;, Avenir, &quot;Helvetica Neue&quot;, sans-serif; font-size:17px;'>features defined as a query against the hosted feature layer (i.e. amenity is not blank).</span><div style='font-family:&quot;Avenir Next W01&quot;, &quot;Avenir Next W00&quot;, &quot;Avenir Next&quot;, Avenir, &quot;Helvetica Neue&quot;, sans-serif; font-size:16px;'><font style='font-family:inherit;'><span style='font-family:inherit; font-size:17px;'><br /></span></font></div><div style='font-family:&quot;Avenir Next W01&quot;, &quot;Avenir Next W00&quot;, &quot;Avenir Next&quot;, Avenir, &quot;Helvetica Neue&quot;, sans-serif; font-size:16px;'><font style='font-family:inherit;'><span style='font-family:inherit; font-size:17px;'>In OSM, amenities are </span></font><font style='font-family:inherit;'><span style='font-family:inherit; font-size:17px;'><b>useful and important facilities</b> for visitors and residents, such as places of worship, restaurants, banks, and schools.  These features are identified with an </span></font><a href='https://wiki.openstreetmap.org/wiki/Key:amenity' rel='nofollow ugc' style='color:rgb(0, 121, 193); font-family:inherit; text-decoration-line:none;' target='_blank'>amenity tag</a><font style='font-family:inherit;'><span style='font-family:inherit; font-size:17px;'>.  There are thousands of different tag values used in the OSM database.  In this feature layer, unique symbols are used for several of the most popular amenity types, while lesser used types are grouped in an &quot;other&quot; category.<br /></span></font><div style='font-family:inherit;'><span style='font-family:&quot;Avenir Next W01&quot;, &quot;Avenir Next W00&quot;, &quot;Avenir Next&quot;, Avenir, &quot;Helvetica Neue&quot;, Helvetica, Arial, sans-serif; font-size:17px;'><br /></span></div><div style='font-family:inherit;'><span style='font-family:&quot;Avenir Next W01&quot;, &quot;Avenir Next W00&quot;, &quot;Avenir Next&quot;, Avenir, &quot;Helvetica Neue&quot;, Helvetica, Arial, sans-serif; font-size:17px;'>Zoom in to large scales (e.g. </span><span style='font-family:&quot;Avenir Next W01&quot;, &quot;Avenir Next W00&quot;, &quot;Avenir Next&quot;, Avenir, &quot;Helvetica Neue&quot;, Helvetica, Arial, sans-serif; font-size:17px;'>City level or 1:80k scale</span><span style='font-family:&quot;Avenir Next W01&quot;, &quot;Avenir Next W00&quot;, &quot;Avenir Next&quot;, Avenir, &quot;Helvetica Neue&quot;, Helvetica, Arial, sans-serif; font-size:17px;'>) to see the amenity features display.  </span><span style='font-family:&quot;Avenir Next W01&quot;, &quot;Avenir Next W00&quot;, &quot;Avenir Next&quot;, Avenir, &quot;Helvetica Neue&quot;, Helvetica, Arial, sans-serif; font-size:17px;'>You can click on a feature to get the name of the amenity.  The name of the amenity will display by default at very large scales (e.g. Building level of 1:2k scale).  Labels can be turned off in your map if you prefer.</span></div></div><div style='font-family:&quot;Avenir Next W01&quot;, &quot;Avenir Next W00&quot;, &quot;Avenir Next&quot;, Avenir, &quot;Helvetica Neue&quot;, sans-serif; font-size:16px;'><span style='font-family:&quot;Avenir Next W01&quot;, &quot;Avenir Next W00&quot;, &quot;Avenir Next&quot;, Avenir, &quot;Helvetica Neue&quot;, Helvetica, Arial, sans-serif; font-size:17px;'><br /></span></div><div style='font-family:&quot;Avenir Next W01&quot;, &quot;Avenir Next W00&quot;, &quot;Avenir Next&quot;, Avenir, &quot;Helvetica Neue&quot;, sans-serif; font-size:16px;'><span style='font-family:&quot;Avenir Next W01&quot;, &quot;Avenir Next W00&quot;, &quot;Avenir Next&quot;, Avenir, &quot;Helvetica Neue&quot;, Helvetica, Arial, sans-serif; font-size:17px;'><b>Create New Layer</b></span></div><div style='font-family:&quot;Avenir Next W01&quot;, &quot;Avenir Next W00&quot;, &quot;Avenir Next&quot;, Avenir, &quot;Helvetica Neue&quot;, sans-serif; font-size:16px;'><span style='font-family:&quot;Avenir Next W01&quot;, &quot;Avenir Next W00&quot;, &quot;Avenir Next&quot;, Avenir, &quot;Helvetica Neue&quot;, Helvetica, Arial, sans-serif; font-size:17px;'>If you would like to create a more focused version of this amenity layer displaying just one or two amenity types, you can do that easily!  Just add the layer to a map, copy the layer in the content window, add a filter to the new layer (e.g. amenity is fire station), rename the layer as appropriate, and save layer.  You can also change the layer symbols or popup if you like.  Esri will publish a few such layers (e.g. </span><span style='font-family:&quot;Avenir Next W01&quot;, &quot;Avenir Next W00&quot;, &quot;Avenir Next&quot;, Avenir, &quot;Helvetica Neue&quot;, Helvetica, Arial, sans-serif; font-size:17px;'>Schools, </span><span style='font-family:&quot;Avenir Next W01&quot;, &quot;Avenir Next W00&quot;, &quot;Avenir Next&quot;, Avenir, &quot;Helvetica Neue&quot;, Helvetica, Arial, sans-serif; font-size:17px;'>Medical Facilities</span><span style='font-family:&quot;Avenir Next W01&quot;, &quot;Avenir Next W00&quot;, &quot;Avenir Next&quot;, Avenir, &quot;Helvetica Neue&quot;, Helvetica, Arial, sans-serif; font-size:17px;'>, </span><span style='font-family:&quot;Avenir Next W01&quot;, &quot;Avenir Next W00&quot;, &quot;Avenir Next&quot;, Avenir, &quot;Helvetica Neue&quot;, Helvetica, Arial, sans-serif; font-size:17px;'>and Places of Worship) that are ready to use, but not for every type of amenity.</span></div><div style='font-family:&quot;Avenir Next W01&quot;, &quot;Avenir Next W00&quot;, &quot;Avenir Next&quot;, Avenir, &quot;Helvetica Neue&quot;, sans-serif; font-size:16px;'><span style='font-family:&quot;Avenir Next W01&quot;, &quot;Avenir Next W00&quot;, &quot;Avenir Next&quot;, Avenir, &quot;Helvetica Neue&quot;, Helvetica, Arial, sans-serif; font-size:17px;'><br /></span></div><div style='font-family:&quot;Avenir Next W01&quot;, &quot;Avenir Next W00&quot;, &quot;Avenir Next&quot;, Avenir, &quot;Helvetica Neue&quot;, sans-serif; font-size:16px;'><span style='font-family:&quot;Avenir Next W01&quot;, &quot;Avenir Next W00&quot;, &quot;Avenir Next&quot;, Avenir, &quot;Helvetica Neue&quot;, Helvetica, Arial, sans-serif; font-size:17px;'><b><i>Important Note</i></b>: if you do create a new layer, it should be provided under the same Terms of Use and include the same Credits as this layer.  You can copy and paste the Terms of Use and Credits info below in the new Item page as needed.</span></div>",
			"keyword": [
				"osm",
				"amenity",
				"Australia",
				"Oceania",
				"New Zealand",
				"OpenStreetMap",
				"American Samoa",
				"Cook Islands",
				"Fed States of Micronesia",
				"Fiji",
				"French Polynesia",
				"Guam",
				"Kiribati",
				"Marshall Islands",
				"Nauru",
				"New Caledonia",
				"Niue",
				"North Mariana Islands",
				"Palau",
				"Papua New Guinea",
				"Pitcairn Islands",
				"Samoa",
				"Solomon Islands",
				"Tokelau",
				"Tonga",
				"Tuvalu",
				"Vanuatu",
				"Wallis and Futuna"
			],
			"issued": "2021-04-29T15:58:06.000Z",
			"modified": "2026-08-12T20:49:04.006Z",
			"publisher": {
				"name": "{{source}}"
			},
			"contactPoint": {
				"@type": "vcard:Contact",
				"fn": "smoore3_osm",
				"hasEmail": "{{orgContactEmail}}"
			},
			"accessLevel": "public",
			"spatial": "-179.9997,-56.9670,180.0000,26.0812",
			"license": "https://opendatacommons.org/licenses/odbl/summary",
			"distribution": [
				{
					"@type": "dcat:Distribution",
					"title": "ArcGIS Hub Dataset",
					"format": "Web Page",
					"mediaType": "text/html",
					"accessURL": "https://www.pacificgeoportal.com/datasets/b4e6461dacd946ea854115570ee4ea68_0"
				},
				{
					"@type": "dcat:Distribution",
					"title": "ArcGIS GeoService",
					"format": "ArcGIS GeoServices REST API",
					"mediaType": "application/json",
					"accessURL": "https://services-ap1.arcgis.com/iA7fZQOnjY9D67Zx/arcgis/rest/services/OSM_AU_Amenities/FeatureServer/0"
				},
				{
					"@type": "dcat:Distribution",
					"title": "CSV",
					"format": "CSV",
					"mediaType": "text/csv",
					"accessURL": "https://www.pacificgeoportal.com/api/download/v1/items/b4e6461dacd946ea854115570ee4ea68/csv?layers=0"
				},
				{
					"@type": "dcat:Distribution",
					"title": "Shapefile",
					"format": "ZIP",
					"mediaType": "application/zip",
					"accessURL": "https://www.pacificgeoportal.com/api/download/v1/items/b4e6461dacd946ea854115570ee4ea68/shapefile?layers=0"
				},
				{
					"@type": "dcat:Distribution",
					"title": "GeoJSON",
					"format": "GeoJSON",
					"mediaType": "application/vnd.geo+json",
					"accessURL": "https://www.pacificgeoportal.com/api/download/v1/items/b4e6461dacd946ea854115570ee4ea68/geojson?layers=0"
				},
				{
					"@type": "dcat:Distribution",
					"title": "KML",
					"format": "KML",
					"mediaType": "application/vnd.google-earth.kml+xml",
					"accessURL": "https://www.pacificgeoportal.com/api/download/v1/items/b4e6461dacd946ea854115570ee4ea68/kml?layers=0"
				}
			],
			"theme": [
				"geospatial"
			]
		},
		{
			"@type": "dcat:Dataset",
			"identifier": "https://www.arcgis.com/home/item.html?id=8cf16523599849fa8aa9a93c4c3122f1&sublayer=0",
			"landingPage": "https://www.pacificgeoportal.com/datasets/8cf16523599849fa8aa9a93c4c3122f1_0",
			"title": "OpenStreetMap Medical Facilities for Australia and Oceania",
			"description": "<span style='font-family:&quot;Avenir Next W01&quot;, &quot;Avenir Next W00&quot;, &quot;Avenir Next&quot;, Avenir, &quot;Helvetica Neue&quot;, sans-serif; font-size:17px;'>This feature layer provides access to OpenStreetMap (OSM) <b>point </b></span><font style='font-family:&quot;Avenir Next W01&quot;, &quot;Avenir Next W00&quot;, &quot;Avenir Next&quot;, Avenir, &quot;Helvetica Neue&quot;, sans-serif; font-size:16px;'><span style='font-family:inherit; font-size:17px;'><b>data of medical facilities</b> for Australia and Oceania, which is </span></font><b>updated every 15 minutes</b><font style='font-family:&quot;Avenir Next W01&quot;, &quot;Avenir Next W00&quot;, &quot;Avenir Next&quot;, Avenir, &quot;Helvetica Neue&quot;, sans-serif; font-size:16px;'><span style='font-family:inherit; font-size:17px;'> with the latest edits.</span></font><b> </b><font style='font-family:&quot;Avenir Next W01&quot;, &quot;Avenir Next W00&quot;, &quot;Avenir Next&quot;, Avenir, &quot;Helvetica Neue&quot;, sans-serif; font-size:16px;'><span style='font-family:inherit; font-size:17px;'>This </span></font><a href='https://doc.arcgis.com/en/arcgis-online/share-maps/about-sharing-feature-layer-data-as-copies.htm' rel='nofollow ugc' style='color:rgb(0, 121, 193); font-family:&quot;Avenir Next W01&quot;, &quot;Avenir Next W00&quot;, &quot;Avenir Next&quot;, Avenir, &quot;Helvetica Neue&quot;, sans-serif; font-size:16px; text-decoration-line:none;' target='_blank'>hosted feature layer view</a><span style='font-family:&quot;Avenir Next W01&quot;, &quot;Avenir Next W00&quot;, &quot;Avenir Next&quot;, Avenir, &quot;Helvetica Neue&quot;, sans-serif; font-size:17px;'> is referencing a hosted feature layer of OSM point (node) data in ArcGIS Online that is updated with minutely diffs from the OSM planet file.  This feature </span><span style='font-family:&quot;Avenir Next W01&quot;, &quot;Avenir Next W00&quot;, &quot;Avenir Next&quot;, Avenir, &quot;Helvetica Neue&quot;, sans-serif; font-size:17px;'>layer view</span><span style='font-family:&quot;Avenir Next W01&quot;, &quot;Avenir Next W00&quot;, &quot;Avenir Next&quot;, Avenir, &quot;Helvetica Neue&quot;, sans-serif; font-size:17px;'> includes amenity </span><span style='font-family:&quot;Avenir Next W01&quot;, &quot;Avenir Next W00&quot;, &quot;Avenir Next&quot;, Avenir, &quot;Helvetica Neue&quot;, sans-serif; font-size:17px;'>features defined as a query against the hosted feature layer where the <b>a</b></span><span style='font-family:&quot;Avenir Next W01&quot;, &quot;Avenir Next W00&quot;, &quot;Avenir Next&quot;, Avenir, &quot;Helvetica Neue&quot;, sans-serif; font-size:17px;'><b>menity </b>value is any of '</span><span style='font-family:&quot;Avenir Next W01&quot;, &quot;Avenir Next W00&quot;, &quot;Avenir Next&quot;, Avenir, &quot;Helvetica Neue&quot;, sans-serif; font-size:17px;'><b>hospital</b>', '</span><span style='font-family:&quot;Avenir Next W01&quot;, &quot;Avenir Next W00&quot;, &quot;Avenir Next&quot;, Avenir, &quot;Helvetica Neue&quot;, sans-serif; font-size:17px;'><b>clinic</b>', '</span><span style='font-family:&quot;Avenir Next W01&quot;, &quot;Avenir Next W00&quot;, &quot;Avenir Next&quot;, Avenir, &quot;Helvetica Neue&quot;, sans-serif; font-size:17px;'><b>doctors</b>', or '</span><span style='font-family:&quot;Avenir Next W01&quot;, &quot;Avenir Next W00&quot;, &quot;Avenir Next&quot;, Avenir, &quot;Helvetica Neue&quot;, sans-serif; font-size:17px;'><b>pharmacy</b>'.</span><div style='font-family:&quot;Avenir Next W01&quot;, &quot;Avenir Next W00&quot;, &quot;Avenir Next&quot;, Avenir, &quot;Helvetica Neue&quot;, sans-serif; font-size:16px;'><span style='font-family:inherit; font-size:17px;'><br /></span><div style='font-family:inherit;'><font style='font-family:inherit;'><span style='font-family:inherit; font-size:17px;'>In OSM, amenities are </span></font><font style='font-family:inherit;'><span style='font-family:inherit; font-size:17px;'><b>useful and important facilities</b> for visitors and residents, such as hospitals and clinics.  These features are identified with an </span></font><a href='https://wiki.openstreetmap.org/wiki/Key:amenity' rel='nofollow ugc' style='color:rgb(0, 121, 193); font-family:inherit; text-decoration-line:none;' target='_blank'>amenity tag</a><font style='font-family:inherit;'><span style='font-family:inherit; font-size:17px;'>.  There are thousands of different tag values used in the OSM database.  In this feature layer, unique symbols are used for the most common amenity tags used for medical facilities.<br /></span></font><div style='font-family:inherit;'><span style='font-family:&quot;Avenir Next W01&quot;, &quot;Avenir Next W00&quot;, &quot;Avenir Next&quot;, Avenir, &quot;Helvetica Neue&quot;, Helvetica, Arial, sans-serif; font-size:17px;'><br /></span></div><div style='font-family:inherit;'><span style='font-family:&quot;Avenir Next W01&quot;, &quot;Avenir Next W00&quot;, &quot;Avenir Next&quot;, Avenir, &quot;Helvetica Neue&quot;, Helvetica, Arial, sans-serif; font-size:17px;'>Zoom in to large scales (e.g. </span><span style='font-family:&quot;Avenir Next W01&quot;, &quot;Avenir Next W00&quot;, &quot;Avenir Next&quot;, Avenir, &quot;Helvetica Neue&quot;, Helvetica, Arial, sans-serif; font-size:17px;'>Neighborhood level or 1:20k scale</span><span style='font-family:&quot;Avenir Next W01&quot;, &quot;Avenir Next W00&quot;, &quot;Avenir Next&quot;, Avenir, &quot;Helvetica Neue&quot;, Helvetica, Arial, sans-serif; font-size:17px;'>) to see the amenity features display.  </span><span style='font-family:&quot;Avenir Next W01&quot;, &quot;Avenir Next W00&quot;, &quot;Avenir Next&quot;, Avenir, &quot;Helvetica Neue&quot;, Helvetica, Arial, sans-serif; font-size:17px;'>You can click on a feature to get the name of the amenity.  The name of the amenity will display by default at very large scales (e.g. Building level of 1:2k scale).  Labels can be turned off in your map if you prefer.</span></div></div><div style='font-family:inherit;'><span style='font-family:&quot;Avenir Next W01&quot;, &quot;Avenir Next W00&quot;, &quot;Avenir Next&quot;, Avenir, &quot;Helvetica Neue&quot;, Helvetica, Arial, sans-serif; font-size:17px;'><br /></span></div><div style='font-family:inherit;'><span style='font-family:&quot;Avenir Next W01&quot;, &quot;Avenir Next W00&quot;, &quot;Avenir Next&quot;, Avenir, &quot;Helvetica Neue&quot;, Helvetica, Arial, sans-serif; font-size:17px;'><b>Create New Layer</b></span></div><div style='font-family:inherit;'><span style='font-family:&quot;Avenir Next W01&quot;, &quot;Avenir Next W00&quot;, &quot;Avenir Next&quot;, Avenir, &quot;Helvetica Neue&quot;, Helvetica, Arial, sans-serif; font-size:17px;'>If you would like to create a more focused version of this medical facilities layer displaying just one or two amenity types, you can do that easily!  Just add the layer to a map, copy the layer in the content window, add a filter to the new layer (e.g. amenity is hospital), rename the layer as appropriate, and save layer.  You can also change the layer symbols or popup if you like.  Esri will publish a few such layers (e.g. Places of Worship, Schools, and Parking) that are ready to use, but not for every type of amenity.</span></div><div style='font-family:inherit;'><span style='font-family:&quot;Avenir Next W01&quot;, &quot;Avenir Next W00&quot;, &quot;Avenir Next&quot;, Avenir, &quot;Helvetica Neue&quot;, Helvetica, Arial, sans-serif; font-size:17px;'><br /></span></div><div style='font-family:inherit;'><span style='font-family:&quot;Avenir Next W01&quot;, &quot;Avenir Next W00&quot;, &quot;Avenir Next&quot;, Avenir, &quot;Helvetica Neue&quot;, Helvetica, Arial, sans-serif; font-size:17px;'><b><i>Important Note</i></b>: if you do create a new layer, it should be provided under the same Terms of Use and include the same Credits as this layer.  You can copy and paste the Terms of Use and Credits info below in the new Item page as needed.</span></div></div>",
			"keyword": [
				"osm",
				"OpenStreetMap",
				"medical",
				"Australia",
				"Oceania",
				"hospital",
				"clinic",
				"doctor",
				"American Samoa",
				"Cook Islands",
				"Fed States of Micronesia",
				"Fiji",
				"French Polynesia",
				"Guam",
				"Kiribati",
				"Marshall Islands",
				"Nauru",
				"New Caledonia",
				"Niue",
				"North Mariana Islands",
				"Palau",
				"Papua New Guinea",
				"Pitcairn Islands",
				"Samoa",
				"Solomon Islands",
				"Tokelau",
				"Tonga",
				"Tuvalu",
				"Vanuatu",
				"Wallis and Futuna"
			],
			"issued": "2021-04-30T22:08:31.000Z",
			"modified": "2026-08-12T20:49:04.006Z",
			"publisher": {
				"name": "{{source}}"
			},
			"contactPoint": {
				"@type": "vcard:Contact",
				"fn": "smoore3_osm",
				"hasEmail": "{{orgContactEmail}}"
			},
			"accessLevel": "public",
			"spatial": "-179.9997,-56.9670,180.0000,26.0812",
			"license": "https://opendatacommons.org/licenses/odbl/summary",
			"distribution": [
				{
					"@type": "dcat:Distribution",
					"title": "ArcGIS Hub Dataset",
					"format": "Web Page",
					"mediaType": "text/html",
					"accessURL": "https://www.pacificgeoportal.com/datasets/8cf16523599849fa8aa9a93c4c3122f1_0"
				},
				{
					"@type": "dcat:Distribution",
					"title": "ArcGIS GeoService",
					"format": "ArcGIS GeoServices REST API",
					"mediaType": "application/json",
					"accessURL": "https://services-ap1.arcgis.com/iA7fZQOnjY9D67Zx/arcgis/rest/services/OSM_AU_Medical/FeatureServer/0"
				},
				{
					"@type": "dcat:Distribution",
					"title": "CSV",
					"format": "CSV",
					"mediaType": "text/csv",
					"accessURL": "https://www.pacificgeoportal.com/api/download/v1/items/8cf16523599849fa8aa9a93c4c3122f1/csv?layers=0"
				},
				{
					"@type": "dcat:Distribution",
					"title": "Shapefile",
					"format": "ZIP",
					"mediaType": "application/zip",
					"accessURL": "https://www.pacificgeoportal.com/api/download/v1/items/8cf16523599849fa8aa9a93c4c3122f1/shapefile?layers=0"
				},
				{
					"@type": "dcat:Distribution",
					"title": "GeoJSON",
					"format": "GeoJSON",
					"mediaType": "application/vnd.geo+json",
					"accessURL": "https://www.pacificgeoportal.com/api/download/v1/items/8cf16523599849fa8aa9a93c4c3122f1/geojson?layers=0"
				},
				{
					"@type": "dcat:Distribution",
					"title": "KML",
					"format": "KML",
					"mediaType": "application/vnd.google-earth.kml+xml",
					"accessURL": "https://www.pacificgeoportal.com/api/download/v1/items/8cf16523599849fa8aa9a93c4c3122f1/kml?layers=0"
				}
			],
			"theme": [
				"geospatial"
			]
		},
		{
			"@type": "dcat:Dataset",
			"identifier": "https://www.arcgis.com/home/item.html?id=8c2db10c952e45b68efdfc78f64267b0",
			"landingPage": "https://www.pacificgeoportal.com/datasets/WorldPop::worldpop-total-population-2000-2020-100m",
			"title": "WorldPop Total Population 2000-2020 100m",
			"description": "<p style='font-family:&quot;Avenir Next W01&quot;, &quot;Avenir Next W00&quot;, &quot;Avenir Next&quot;, Avenir, &quot;Helvetica Neue&quot;, sans-serif; font-size:16px; margin-bottom:1.5rem; margin-top:0px;'><span style='color:#b22222;'><strong>Retirement Notice</strong></span>: This item is in <a target='_blank' href='https://content.esri.com/support/techarticles/product-life-cycle.pdf' rel='nofollow ugc noopener noreferrer'><strong>mature support</strong></a> as of August 2026 and will retire in December 2027. Similar items are available in this <a target='_blank' href='https://www.arcgis.com/home/group.html?id=bfb8bfc29d824780b669949fb007aab3#overview' rel='nofollow ugc noopener noreferrer'>ArcGIS Online Group</a>. Esri and WorldPop recommend updating your maps and apps to use the new version.</p><p style='font-family:&quot;Avenir Next W01&quot;, &quot;Avenir Next W00&quot;, &quot;Avenir Next&quot;, Avenir, &quot;Helvetica Neue&quot;, sans-serif; font-size:16px; margin-bottom:1.5rem; margin-top:0px;'>This layer contains&nbsp;<a style='color:rgb(0, 121, 193); font-family:inherit; text-decoration-line:none;' target='_blank' href='https://www.worldpop.org/' rel='nofollow ugc noopener noreferrer'>WorldPop's</a>&nbsp;100-meter resolution annual estimates of total population from the year 2000 to 2020.&nbsp;</p><p style='font-family:&quot;Avenir Next W01&quot;, &quot;Avenir Next W00&quot;, &quot;Avenir Next&quot;, Avenir, &quot;Helvetica Neue&quot;, sans-serif; font-size:16px; margin-bottom:1.5rem; margin-top:0px;'><strong>Usage notes:</strong></p><ul><li><span style='font-size:medium;'>This layer is configured to be viewed only at a scale range for large-scale maps, i.e., zoomed into small areas of the world.&nbsp;</span></li><li><span style='font-size:medium;'>Because the underlying data for this layer is relatively large and because raster pyramids cannot accurately represent aggregated population counts, there are no pyramids. Thus, this layer may at times require 10 to 15 seconds to draw.</span></li><li><span style='font-size:medium;'>We recommend using this layer in&nbsp;in conjunction with&nbsp;</span><a style='font-family:&quot;Avenir Next W01&quot;, &quot;Avenir Next W00&quot;, &quot;Avenir Next&quot;, Avenir, &quot;Helvetica Neue&quot;, sans-serif; font-size:medium;' target='_blank' href='https://www.arcgis.com/home/item.html?id=56eb0f050c61434782f008a08331d23a' rel='nofollow ugc noopener noreferrer'>WorldPop's 1-km resolution Total Population layer</a><span style='font-family:&quot;Avenir Next W01&quot;, &quot;Avenir Next W00&quot;, &quot;Avenir Next&quot;, Avenir, &quot;Helvetica Neue&quot;, sans-serif; font-size:medium;'>&nbsp;to create web maps that allow users to pan and zoom to wider areas</span><span style='font-size:medium;'>; this&nbsp;</span><a target='_blank' href='https://www.arcgis.com/home/item.html?id=0f0690c5b517410dafc25d18a5df4eb6' rel='nofollow ugc noopener noreferrer'><span style='font-family:&quot;Avenir Next W01&quot;, &quot;Avenir Next W00&quot;, &quot;Avenir Next&quot;, Avenir, &quot;Helvetica Neue&quot;, sans-serif; font-size:medium;'>web map</span></a><span style='font-family:&quot;Avenir Next W01&quot;, &quot;Avenir Next W00&quot;, &quot;Avenir Next&quot;, Avenir, &quot;Helvetica Neue&quot;, sans-serif; font-size:medium;'>&nbsp;contains an example of this combination.&nbsp;</span></li></ul><p style='font-family:&quot;Avenir Next W01&quot;, &quot;Avenir Next W00&quot;, &quot;Avenir Next&quot;, Avenir, &quot;Helvetica Neue&quot;, sans-serif; margin-bottom:1.5rem; margin-top:0px;'><span style='font-size:medium;'>WorldPop estimated the total population for each cell in this data using a random forest-based dasymetric redistribution model&nbsp;</span><span style='font-family:Avenir Next W01, Avenir Next W00, Avenir Next, Avenir, Helvetica Neue, sans-serif; font-size:medium;'>(Stevens, F. R., Gaughan, A. E., Linard, C., &amp; Tatem, A. J. (2015).&nbsp;</span><a style='font-family:&quot;Avenir Next&quot;, Avenir, &quot;Helvetica Neue&quot;, Helvetica, Arial, sans-serif;' target='_blank' href='https://journals.plos.org/plosone/article?id=10.1371%2fjournal.pone.0107042&amp;msclkid=e680f12ec18d11ec9d35ec3fdcf85b40' rel='nofollow ugc noopener noreferrer'><span style='font-size:medium;'>Disaggregating census data for population mapping using random forests with remotely-sensed and ancillary data</span></a><span style='font-family:Avenir Next W01, Avenir Next W00, Avenir Next, Avenir, Helvetica Neue, sans-serif; font-size:medium;'>. PloS one, 10(2), e0107042</span><span style='font-size:medium;'>).&nbsp;The estimates in this layer use WorldPop's&nbsp;</span><a style='color:rgb(0, 121, 193); font-family:inherit; text-decoration-line:none;' target='_blank' href='https://www.worldpop.org/methods/top_down_constrained_vs_unconstrained' rel='nofollow ugc noopener noreferrer'><span style='font-size:medium;'>Top-down unconstrained method</span></a><span style='font-size:medium;'>&nbsp;which estimates the total population for each cell with a Random Forest-based dasymetric model. This diagram visually describes this model that uses known populated locations to analyze imagery to find similarly populated locations.&nbsp;</span></p><p style='font-family:&quot;Avenir Next W01&quot;, &quot;Avenir Next W00&quot;, &quot;Avenir Next&quot;, Avenir, &quot;Helvetica Neue&quot;, sans-serif; font-size:16px; margin-bottom:1.5rem; margin-top:0px; text-align:center;'><img src='https://data.worldpop.org/tmp/top_down_unconstrained_v1.png' alt='Top down unconstrained method' /></p><p style='font-family:&quot;Avenir Next W01&quot;, &quot;Avenir Next W00&quot;, &quot;Avenir Next&quot;, Avenir, &quot;Helvetica Neue&quot;, sans-serif; font-size:16px; margin-bottom:1.5rem; margin-top:0px;'>The DOI for the original WorldPop.org total population data is&nbsp;<a target='_blank' href='https://www.worldpop.org/doi/10.5258/SOTON/WP00645' rel='nofollow ugc noopener noreferrer'>10.5258/SOTON/WP00645</a>.</p><p style='font-family:&quot;Avenir Next W01&quot;, &quot;Avenir Next W00&quot;, &quot;Avenir Next&quot;, Avenir, &quot;Helvetica Neue&quot;, sans-serif; font-size:16px; margin-bottom:1.5rem; margin-top:0px;'><strong>Recommended Citation:</strong><span style='font-family:&quot;Avenir Next&quot;, Avenir, &quot;Helvetica Neue&quot;, Helvetica, Arial, sans-serif; font-size:15px;'> WorldPop (www.worldpop.org - School of Geography and Environmental Science, University of Southampton; Department of Geography and Geosciences, University of Louisville; Departement de Geographie, Universite de Namur) and Center for International Earth Science Information Network (CIESIN), Columbia University (2018). Global High Resolution Population Denominators Project - Funded by The Bill and Melinda Gates Foundation. Accessed from https://worldpop.arcgis.com/arcgis/rest/services/WorldPop_Total_Population_1km/ImageServer, which was acquired from https://www.worldpop.org/doi/10.5258/SOTON/WP00645 on 15 Sep, 2021.</span></p>",
			"keyword": [
				"WorldPop",
				"worldpop_soton",
				"Population",
				"Dasymetric",
				"retiring-2027-12"
			],
			"issued": "2022-02-09T17:37:32.000Z",
			"modified": "2026-08-10T18:34:36.000Z",
			"publisher": {
				"name": "WorldPop"
			},
			"contactPoint": {
				"@type": "vcard:Contact",
				"fn": "WorldPop_Project",
				"hasEmail": "mailto:noreply@worldpop.org"
			},
			"accessLevel": "public",
			"spatial": "-179.9996,-72.0002,180.0000,83.6279",
			"license": "https://creativecommons.org/licenses/by/4.0",
			"distribution": [
				{
					"@type": "dcat:Distribution",
					"title": "ArcGIS Hub Dataset",
					"format": "Web Page",
					"mediaType": "text/html",
					"accessURL": "https://www.pacificgeoportal.com/datasets/WorldPop::worldpop-total-population-2000-2020-100m"
				},
				{
					"@type": "dcat:Distribution",
					"title": "ArcGIS GeoService",
					"format": "ArcGIS GeoServices REST API",
					"mediaType": "application/json",
					"accessURL": "https://worldpop.arcgis.com/arcgis/rest/services/WorldPop_Total_Population_100m/ImageServer"
				}
			],
			"theme": [
				"geospatial"
			]
		},
		{
			"@type": "dcat:Dataset",
			"identifier": "https://www.arcgis.com/home/item.html?id=56eb0f050c61434782f008a08331d23a",
			"landingPage": "https://www.pacificgeoportal.com/datasets/WorldPop::worldpop-total-population-2000-2020-1km",
			"title": "WorldPop Total Population 2000-2020 1km",
			"description": "<p><span style='color:#b22222;'><strong>Retirement Notice</strong></span>: This item is in <a target='_blank' href='https://content.esri.com/support/techarticles/product-life-cycle.pdf' rel='nofollow ugc noopener noreferrer'><strong>mature support</strong></a> as of August 2026 and will retire in December 2027. Similar items are available in this <a target='_blank' href='https://www.arcgis.com/home/group.html?id=bfb8bfc29d824780b669949fb007aab3#overview' rel='nofollow ugc noopener noreferrer'>ArcGIS Online Group</a>. Esri and WorldPop recommend updating your maps and apps to use the new version.</p><p>This layer contains&nbsp;<a target='_blank' href='https://www.worldpop.org' rel='nofollow ugc noopener noreferrer'>WorldPop's</a>&nbsp;1-km resolution annual estimates of total population from the year 2000 to 2020. WorldPop estimated the total population for each cell in this data using a random forest-based dasymetric redistribution model.&nbsp;The estimates in this layer use WorldPop's&nbsp;<a target='_blank' href='https://www.worldpop.org/methods/top_down_constrained_vs_unconstrained' rel='nofollow ugc noopener noreferrer'>Top-down unconstrained method</a>&nbsp;which estimates the total population for each cell with a Random Forest-based model. This diagram visually describes this model that uses known populated locations to analyze imagery to find similarly populated locations.&nbsp;</p><p style='text-align:center;'><img src='https://data.worldpop.org/tmp/top_down_unconstrained_v1.png' alt='Top down unconstrained method' /></p><p>The DOI for the original WorldPop.org total population data is&nbsp;<a target='_blank' href='https://www.worldpop.org/doi/10.5258/SOTON/WP00647' rel='nofollow ugc noopener noreferrer'>10.5258/SOTON/WP00647</a>.</p><p><strong>Recommended Citation:</strong> WorldPop (www.worldpop.org - School of Geography and Environmental Science, University of Southampton; Department of Geography and Geosciences, University of Louisville; Departement de Geographie, Universite de Namur) and Center for International Earth Science Information Network (CIESIN), Columbia University (2018). Global High Resolution Population Denominators Project - Funded by The Bill and Melinda Gates Foundation. Accessed from https://worldpop.arcgis.com/arcgis/rest/services/WorldPop_Total_Population_1km/ImageServer, which was acquired from&nbsp;<a target='_blank' href='https://www.worldpop.org/doi/10.5258/SOTON/WP00647' rel='nofollow ugc noopener noreferrer'>https://www.worldpop.org/doi/10.5258/SOTON/WP00647</a>&nbsp;on 15 Sep, 2021.</p>",
			"keyword": [
				"WorldPop",
				"Population",
				"Dasymetric",
				"worldpop_soton",
				"retiring-2027-12"
			],
			"issued": "2021-11-03T21:19:47.000Z",
			"modified": "2026-08-10T18:34:20.000Z",
			"publisher": {
				"name": "WorldPop"
			},
			"contactPoint": {
				"@type": "vcard:Contact",
				"fn": "WorldPop_Project",
				"hasEmail": "mailto:noreply@worldpop.org"
			},
			"accessLevel": "public",
			"spatial": "-180.0000,-72.0004,180.0000,84.0079",
			"license": "https://creativecommons.org/licenses/by/4.0",
			"distribution": [
				{
					"@type": "dcat:Distribution",
					"title": "ArcGIS Hub Dataset",
					"format": "Web Page",
					"mediaType": "text/html",
					"accessURL": "https://www.pacificgeoportal.com/datasets/WorldPop::worldpop-total-population-2000-2020-1km"
				},
				{
					"@type": "dcat:Distribution",
					"title": "ArcGIS GeoService",
					"format": "ArcGIS GeoServices REST API",
					"mediaType": "application/json",
					"accessURL": "https://worldpop.arcgis.com/arcgis/rest/services/WorldPop_Total_Population_1km/ImageServer"
				}
			],
			"theme": [
				"geospatial"
			]
		},
		{
			"@type": "dcat:Dataset",
			"identifier": "https://www.arcgis.com/home/item.html?id=5826b14592ab4ebc99574919165bd860",
			"landingPage": "https://www.pacificgeoportal.com/datasets/esri::world-bioclimates",
			"title": "World Bioclimates",
			"description": "<div><div>Climate plays a major role in determining the distribution of plants and animals. <a href='https://en.wikipedia.org/wiki/Bioclimatology' rel='nofollow ugc' target='_blank'>Bioclimatology</a>, the study of climate as it affects and is affected by living organisms, is key to understanding the patterns of forests and deserts on the landscape, where productive agricultural lands may be found, and how changes in the climate will affect rare species. </div><div><br /></div><div>This layer is part of the Ecophysiographic Project and is one of the four input layers used to create the <a href='https://www.arcgis.com/home/item.html?id=e55c8b1919854715a0d0ca5762c4dec9' rel='nofollow ugc' target='_blank'>World Ecological Land Units Map</a>.<br /></div><div><br /></div><div><font size='4'>Dataset Summary </font></div><div><br /></div><div>This layer provides access to a 250m cell-sized raster with a bioclimatic stratification. The source dataset was a 30-arcsecond resolution raster (equivalent to 0.86 km2 at the equator or about a 920m pixel size). </div><div><br /></div><div>The layer has the following attributes: </div><div><br /></div><div><i><font color='#8b0000'><b>Temperature Description </b></font></i>- Seven classes based on the number of growing degree days (the monthly mean temperature multiplied by number of days in the month summed for all months). The 1950 to 2000 monthly average temperature was used to calculate growing degree days. Values in this field and associated number of growing degree days are:</div><div><span style='font-size: 12.7272720336914px; line-height: 16.7142848968506px; background-color: rgb(255, 255, 255);'><br /></span></div><div><table border='1' cellpadding='0' cellspacing='0' style='border-collapse: collapse; border: none;'><tbody><tr><td style='width: 148.25pt; border-style: solid; border-color: rgb(153, 153, 153) rgb(153, 153, 153) rgb(102, 102, 102); border-width: 1pt 1pt 1.5pt; padding: 0in 5.4pt;' valign='top' width='198'><p align='center' style='text-align: center;'><b><font size='2'>Temperature Description</font></b></p></td><td style='width: 130.5pt; border-style: solid solid solid none; border-top-color: rgb(153, 153, 153); border-top-width: 1pt; border-bottom-color: rgb(102, 102, 102); border-bottom-width: 1.5pt; border-right-color: rgb(153, 153, 153); border-right-width: 1pt; padding: 0in 5.4pt;' valign='top' width='174'><p align='center' style='text-align: center;'><b><font size='2'>Growing Degree Days</font></b></p></td></tr><tr><td style='width: 148.25pt; border-style: none solid solid; border-right-color: rgb(153, 153, 153); border-bottom-color: rgb(153, 153, 153); border-left-color: rgb(153, 153, 153); border-right-width: 1pt; border-bottom-width: 1pt; border-left-width: 1pt; padding: 0in 5.4pt;' valign='top' width='198'><p><b><font size='2'>Very Hot</font></b></p></td><td style='width: 130.5pt; border-style: none solid solid none; border-bottom-color: rgb(153, 153, 153); border-bottom-width: 1pt; border-right-color: rgb(153, 153, 153); border-right-width: 1pt; padding: 0in 5.4pt;' valign='top' width='174'><p align='center' style='text-align: center;'><span style='color: rgb(38, 38, 38);'><font size='2'>9,000 – 13,500</font></span></p></td></tr><tr><td style='width: 148.25pt; border-style: none solid solid; border-right-color: rgb(153, 153, 153); border-bottom-color: rgb(153, 153, 153); border-left-color: rgb(153, 153, 153); border-right-width: 1pt; border-bottom-width: 1pt; border-left-width: 1pt; padding: 0in 5.4pt;' valign='top' width='198'><p><b><font size='2'>Hot</font></b></p></td><td style='width: 130.5pt; border-style: none solid solid none; border-bottom-color: rgb(153, 153, 153); border-bottom-width: 1pt; border-right-color: rgb(153, 153, 153); border-right-width: 1pt; padding: 0in 5.4pt;' valign='top' width='174'><p align='center' style='text-align: center;'><span style='color: rgb(38, 38, 38);'><font size='2'>7,000 – 9,000</font></span></p></td></tr><tr><td style='width: 148.25pt; border-style: none solid solid; border-right-color: rgb(153, 153, 153); border-bottom-color: rgb(153, 153, 153); border-left-color: rgb(153, 153, 153); border-right-width: 1pt; border-bottom-width: 1pt; border-left-width: 1pt; padding: 0in 5.4pt;' valign='top' width='198'><p><b><font size='2'>Warm</font></b></p></td><td style='width: 130.5pt; border-style: none solid solid none; border-bottom-color: rgb(153, 153, 153); border-bottom-width: 1pt; border-right-color: rgb(153, 153, 153); border-right-width: 1pt; padding: 0in 5.4pt;' valign='top' width='174'><p align='center' style='text-align: center;'><span style='color: rgb(38, 38, 38);'><font size='2'>4,500 – 7,000</font></span></p></td></tr><tr><td style='width: 148.25pt; border-style: none solid solid; border-right-color: rgb(153, 153, 153); border-bottom-color: rgb(153, 153, 153); border-left-color: rgb(153, 153, 153); border-right-width: 1pt; border-bottom-width: 1pt; border-left-width: 1pt; padding: 0in 5.4pt;' valign='top' width='198'><p><b><font size='2'>Cool</font></b></p></td><td style='width: 130.5pt; border-style: none solid solid none; border-bottom-color: rgb(153, 153, 153); border-bottom-width: 1pt; border-right-color: rgb(153, 153, 153); border-right-width: 1pt; padding: 0in 5.4pt;' valign='top' width='174'><p align='center' style='text-align: center;'><span style='color: rgb(38, 38, 38);'><font size='2'>2,500 – 4,500</font></span></p></td></tr><tr><td style='width: 148.25pt; border-style: none solid solid; border-right-color: rgb(153, 153, 153); border-bottom-color: rgb(153, 153, 153); border-left-color: rgb(153, 153, 153); border-right-width: 1pt; border-bottom-width: 1pt; border-left-width: 1pt; padding: 0in 5.4pt;' valign='top' width='198'><p><b><font size='2'>Cold</font></b></p></td><td style='width: 130.5pt; border-style: none solid solid none; border-bottom-color: rgb(153, 153, 153); border-bottom-width: 1pt; border-right-color: rgb(153, 153, 153); border-right-width: 1pt; padding: 0in 5.4pt;' valign='top' width='174'><p align='center' style='text-align: center;'><span style='color: rgb(38, 38, 38);'><font size='2'>1,000 – 2,500</font></span></p></td></tr><tr><td style='width: 148.25pt; border-style: none solid solid; border-right-color: rgb(153, 153, 153); border-bottom-color: rgb(153, 153, 153); border-left-color: rgb(153, 153, 153); border-right-width: 1pt; border-bottom-width: 1pt; border-left-width: 1pt; padding: 0in 5.4pt;' valign='top' width='198'><p><b><font size='2'>Very Cold</font></b></p></td><td style='width: 130.5pt; border-style: none solid solid none; border-bottom-color: rgb(153, 153, 153); border-bottom-width: 1pt; border-right-color: rgb(153, 153, 153); border-right-width: 1pt; padding: 0in 5.4pt;' valign='top' width='174'><p align='center' style='text-align: center;'><span style='color: rgb(38, 38, 38);'><font size='2'>300 – 1,000</font></span></p></td></tr><tr><td style='width: 148.25pt; border-style: none solid solid; border-right-color: rgb(153, 153, 153); border-bottom-color: rgb(153, 153, 153); border-left-color: rgb(153, 153, 153); border-right-width: 1pt; border-bottom-width: 1pt; border-left-width: 1pt; padding: 0in 5.4pt;' valign='top' width='198'><p><b><span style='color: rgb(38, 38, 38);'><font size='2'>Arctic</font></span></b></p></td><td style='width: 130.5pt; border-style: none solid solid none; border-bottom-color: rgb(153, 153, 153); border-bottom-width: 1pt; border-right-color: rgb(153, 153, 153); border-right-width: 1pt; padding: 0in 5.4pt;' valign='top' width='174'><p align='center' style='text-align: center;'><span style='color: rgb(38, 38, 38);'><font size='2'>0 - 300</font></span></p></td></tr></tbody></table></div><div><span style='font-size: 12.7272720336914px; line-height: 16.7142848968506px; background-color: rgb(255, 255, 255);'><br /></span></div><div><i><b><font color='#8b0000'>Aridity Description</font></b></i><font color='#000000' style='font-size: 12.7272720336914px; line-height: 16.7142848968506px; background-color: rgb(255, 255, 255);'> </font>- Six classes based on an index of aridity calculated by dividing precipitation by evapotranspiration. Precipitation and evapotranspiration are average values from 1950 to 2000.<font color='#000000' style='font-size: 12.7272720336914px; line-height: 16.7142848968506px; background-color: rgb(255, 255, 255);'><br /></font></div><div><br /></div><div><table border='1' cellpadding='0' cellspacing='0' style='border-collapse: collapse; border: none;'><tbody><tr><td style='width: 148.25pt; border-style: solid; border-color: rgb(153, 153, 153) rgb(153, 153, 153) rgb(102, 102, 102); border-width: 1pt 1pt 1.5pt; padding: 0in 5.4pt;' valign='bottom' width='198'><p align='center' style='text-align: center;'><b>Aridity Description</b></p></td><td style='width: 130.5pt; border-style: solid solid solid none; border-top-color: rgb(153, 153, 153); border-top-width: 1pt; border-bottom-color: rgb(102, 102, 102); border-bottom-width: 1.5pt; border-right-color: rgb(153, 153, 153); border-right-width: 1pt; padding: 0in 5.4pt;' valign='bottom' width='174'><p align='center' style='text-align: center;'><b>Aridity Index</b></p></td></tr><tr><td style='width: 148.25pt; border-style: none solid solid; border-right-color: rgb(153, 153, 153); border-bottom-color: rgb(153, 153, 153); border-left-color: rgb(153, 153, 153); border-right-width: 1pt; border-bottom-width: 1pt; border-left-width: 1pt; padding: 0in 5.4pt;' valign='bottom' width='198'><p align='center' style='text-align: center;'><b>Very Wet</b></p></td><td style='width: 130.5pt; border-style: none solid solid none; border-bottom-color: rgb(153, 153, 153); border-bottom-width: 1pt; border-right-color: rgb(153, 153, 153); border-right-width: 1pt; padding: 0in 5.4pt;' valign='bottom' width='174'><p align='center' style='text-align: center;'><span style='color: rgb(38, 38, 38);'>1.5 – 70</span></p></td></tr><tr><td style='width: 148.25pt; border-style: none solid solid; border-right-color: rgb(153, 153, 153); border-bottom-color: rgb(153, 153, 153); border-left-color: rgb(153, 153, 153); border-right-width: 1pt; border-bottom-width: 1pt; border-left-width: 1pt; padding: 0in 5.4pt;' valign='bottom' width='198'><p align='center' style='text-align: center;'><b>Wet</b></p></td><td style='width: 130.5pt; border-style: none solid solid none; border-bottom-color: rgb(153, 153, 153); border-bottom-width: 1pt; border-right-color: rgb(153, 153, 153); border-right-width: 1pt; padding: 0in 5.4pt;' valign='bottom' width='174'><p align='center' style='text-align: center;'><span style='color: rgb(38, 38, 38);'>1.0 – 1.5</span></p></td></tr><tr><td style='width: 148.25pt; border-style: none solid solid; border-right-color: rgb(153, 153, 153); border-bottom-color: rgb(153, 153, 153); border-left-color: rgb(153, 153, 153); border-right-width: 1pt; border-bottom-width: 1pt; border-left-width: 1pt; padding: 0in 5.4pt;' valign='bottom' width='198'><p align='center' style='text-align: center;'><b>Moist</b></p></td><td style='width: 130.5pt; border-style: none solid solid none; border-bottom-color: rgb(153, 153, 153); border-bottom-width: 1pt; border-right-color: rgb(153, 153, 153); border-right-width: 1pt; padding: 0in 5.4pt;' valign='bottom' width='174'><p align='center' style='text-align: center;'><span style='color: rgb(38, 38, 38);'>0.6 – 1.0</span></p></td></tr><tr><td style='width: 148.25pt; border-style: none solid solid; border-right-color: rgb(153, 153, 153); border-bottom-color: rgb(153, 153, 153); border-left-color: rgb(153, 153, 153); border-right-width: 1pt; border-bottom-width: 1pt; border-left-width: 1pt; padding: 0in 5.4pt;' valign='bottom' width='198'><p align='center' style='text-align: center;'><b>Semi-dry</b></p></td><td style='width: 130.5pt; border-style: none solid solid none; border-bottom-color: rgb(153, 153, 153); border-bottom-width: 1pt; border-right-color: rgb(153, 153, 153); border-right-width: 1pt; padding: 0in 5.4pt;' valign='bottom' width='174'><p align='center' style='text-align: center;'><span style='color: rgb(38, 38, 38);'>0.3 – 0.6</span></p></td></tr><tr><td style='width: 148.25pt; border-style: none solid solid; border-right-color: rgb(153, 153, 153); border-bottom-color: rgb(153, 153, 153); border-left-color: rgb(153, 153, 153); border-right-width: 1pt; border-bottom-width: 1pt; border-left-width: 1pt; padding: 0in 5.4pt;' valign='bottom' width='198'><p align='center' style='text-align: center;'><b>Dry</b></p></td><td style='width: 130.5pt; border-style: none solid solid none; border-bottom-color: rgb(153, 153, 153); border-bottom-width: 1pt; border-right-color: rgb(153, 153, 153); border-right-width: 1pt; padding: 0in 5.4pt;' valign='bottom' width='174'><p align='center' style='text-align: center;'><span style='color: rgb(38, 38, 38);'>0.1 – 0.3</span></p></td></tr><tr><td style='width: 148.25pt; border-style: none solid solid; border-right-color: rgb(153, 153, 153); border-bottom-color: rgb(153, 153, 153); border-left-color: rgb(153, 153, 153); border-right-width: 1pt; border-bottom-width: 1pt; border-left-width: 1pt; padding: 0in 5.4pt;' valign='bottom' width='198'><p align='center' style='text-align: center;'><b>Very Dry</b></p></td><td style='width: 130.5pt; border-style: none solid solid none; border-bottom-color: rgb(153, 153, 153); border-bottom-width: 1pt; border-right-color: rgb(153, 153, 153); border-right-width: 1pt; padding: 0in 5.4pt;' valign='bottom' width='174'><p align='center' style='text-align: center;'><span style='color: rgb(38, 38, 38);'>0.01 – 0.1</span></p></td></tr></tbody></table></div><div><span style='font-size: 12.7272720336914px; line-height: 16.7142848968506px; background-color: rgb(255, 255, 255);'><i><b><font color='#8b0000'><br /></font></b></i></span></div><div><b><i><font color='#8b0000'>Bioclimate Class</font></i></b> - a 2-part description that combines the value of the Temperature Description field and the Aridity Description field. The alias for this field is ELU Bioclimate Reclass. </div><div><br /></div><div>This layer was created by modifying the dataset documented in the publication: <br /></div><div><a href='https://www.earthobservations.org/documents/cop/bi_geobon/outreach/201211_Metzger_GEB_inpress_1.pdf' rel='nofollow ugc' target='_blank'>Metzger and others</a>. 2012. A high-resolution bioclimate map of the world: a unifying framework for global biodiversity research and monitoring. </div><div><br /></div><div><font size='4'>What can you do with this layer? </font></div><div><br /></div><div>This layer is suitable for both visualization and analysis. It can be used in ArcGIS Online in web maps and applications and can be used in ArcGIS Desktop.</div><div><br /><div style='margin: 0px; padding: 0px;'>This layer has <a href='https://resources.arcgis.com/en/help/main/10.2/index.html#//00sp00000007000000' rel='nofollow ugc' target='_blank'>query</a>, <a href='https://resources.arcgis.com/en/help/main/10.2/index.html#//00s500000010000000' rel='nofollow ugc' target='_blank'>identify</a>, and <a href='https://resources.arcgis.com/en/help/main/10.2/index.html#/Downloading_data_from_an_image_service/00sp00000016000000/' rel='nofollow ugc' target='_blank'>export</a> image services available. This layer is restricted to a maximum area of 16,000 x 16,000 pixels - an area 4,000 kilometers on a side or an area approximately the size of Europe. </div><div style='margin: 0px; padding: 0px;'><br /></div><div style='margin: 0px; padding: 0px;'>A service is available providing access to the data table associated with this layer. The data table services can be used by developers to quickly and efficiently query the data and to create custom applications. For more information see the <a href='https://www.arcgis.com/home/item.html?id=5c321f97872b4643a0f061e9781991cf' rel='nofollow ugc' target='_blank'>World Ecophysiographic Tables</a>.<br /></div><div style='margin: 0px; padding: 0px;'><br /></div><div style='margin: 0px; padding: 0px;'>This layer is part of a larger collection of <a href='https://www.arcgis.com/home/group.html?owner=esri&amp;title=Landscape%20Layers&amp;start=131&amp;q=' rel='nofollow ugc' target='_blank'>landscape layers</a> that you can use to perform a wide variety of mapping and analysis tasks.</div><div style='margin: 0px; padding: 0px;'><br /></div><div style='margin: 0px; padding: 0px;'>The <a href='https://doc.arcgis.com/en/living-atlas/#s=0&amp;n=0&amp;d=1&amp;col=&amp;fs=0&amp;fn=30&amp;npp=120&amp;subCat=0' rel='nofollow ugc' target='_blank'>Living Atlas of the World</a> provides an easy way to explore the landscape layers and many other beautiful and authoritative maps on hundreds of topics.</div><div style='margin: 0px; padding: 0px;'><br /></div><div style='margin: 0px; padding: 0px;'><div style='font-size: 12.7272720336914px; line-height: 16.7142868041992px; margin: 0px; padding: 0px;'><a href='https://geonet.esri.com' rel='nofollow ugc' target='_blank'>Geonet</a> is a good resource for learning more about landscape layers and the Living Atlas of the World. To get started see the <a href='https://geonet.esri.com/groups/livingatlas?sr=search&amp;searchId=ec0b33d6-14bb-4319-8ad5-38961b68610e&amp;searchIndex=0' rel='nofollow ugc' target='_blank'>Living Atlas Discussion Group</a>.</div><div style='font-size: 12.7272720336914px; line-height: 16.7142868041992px; margin: 0px; padding: 0px;'><br /></div><div style='font-size: 12.7272720336914px; line-height: 16.7142868041992px; margin: 0px; padding: 0px;'>The <a href='https://goto.arcgisonline.com/arcgis/Ecological_Land_Units/RolloutBlog ' rel='nofollow ugc' target='_blank'>Esri Insider Blog</a> provides an introduction to the Ecophysiographic Mapping project.</div></div></div></div>",
			"keyword": [
				"ecophysiography",
				"landscape6",
				"esri_landscape",
				"climate",
				"landscape",
				"ExU",
				"AnalysisOptimized"
			],
			"issued": "2014-12-03T19:05:06.000Z",
			"modified": "2020-08-27T00:00:43.000Z",
			"publisher": {
				"name": "Esri"
			},
			"contactPoint": {
				"@type": "vcard:Contact",
				"fn": "esri_landscape2",
				"hasEmail": "{{orgContactEmail}}"
			},
			"accessLevel": "public",
			"spatial": "-180.0000,-60.0006,-180.0000,89.0000",
			"license": "<img alt='' src='https://downloads.esri.com/blogs/arcgisonline/esrilogo_new.png' />This work is licensed under the Esri Master License Agreement. <br /><div><a href='https://goto.arcgis.com/termsofuse/viewsummary' target='_blank' rel='nofollow ugc noopener noreferrer'><b>View Summary</b></a> | <a href='https://goto.arcgis.com/termsofuse/viewtermsofuse' target='_blank' rel='nofollow ugc noopener noreferrer'><b>View Terms of Use</b></a> </div><div><span style='line-height: 16.05px;'><br /></span></div><div><font color='#b22222'>Important Note:</font> This item requires an ArcGIS Online organizational subscription or an ArcGIS Developer account and does not consume credits. To access this item, you'll need to do one of the following: </div><div><ul><li>Sign in with an account that is a member of an organizational subscription </li><li>Sign in with a developer account </li><li><a href='https://goto.arcgis.com/termsofuse/registeranapplication' target='_blank' rel='nofollow ugc noopener noreferrer'>Register an application</a> and use your application's credentials.</li></ul>If you don't have an account, you can sign up for a <a href='https://goto.arcgis.com/features/trial' target='_blank' rel='nofollow ugc noopener noreferrer'>free trial of ArcGIS</a> or a <a href='https://goto.arcgis.com/developers/signup' target='_blank' rel='nofollow ugc noopener noreferrer'>free ArcGIS Developer account</a>.</div>",
			"distribution": [
				{
					"@type": "dcat:Distribution",
					"title": "ArcGIS Hub Dataset",
					"format": "Web Page",
					"mediaType": "text/html",
					"accessURL": "https://www.pacificgeoportal.com/datasets/esri::world-bioclimates"
				},
				{
					"@type": "dcat:Distribution",
					"title": "ArcGIS GeoService",
					"format": "ArcGIS GeoServices REST API",
					"mediaType": "application/json",
					"accessURL": "https://landscape6.arcgis.com/arcgis/rest/services/World_Bioclimates/ImageServer"
				}
			],
			"theme": [
				"geospatial"
			]
		},
		{
			"@type": "dcat:Dataset",
			"identifier": "https://www.arcgis.com/home/item.html?id=926a206393ec40a590d8caf29ae9a93e",
			"landingPage": "https://www.pacificgeoportal.com/datasets/esri::world-terrestrial-ecosystems",
			"title": "World Terrestrial Ecosystems",
			"description": "<div>The World Terrestrial Ecosystems map classifies the world into areas of similar climate, landform, and land cover, which form the basic components of any terrestrial ecosystem structure.&nbsp;</div><div>&nbsp;</div><div>This map is important because it uses objectively derived and globally consistent data to characterize the ecosystems at a much finer spatial resolution (250-m) than existing ecoregionalizations, and a much finer thematic resolution (431 classes) than existing global land cover products.&nbsp;</div><div>&nbsp;</div><div><div>This item was updated on Apr 14, 2023 to distinguish between Boreal and Polar climate regions in the terrestrial ecosystems.&nbsp;</div></div><div>&nbsp;</div><div><div><strong>Cell Size</strong>: 250-meter&nbsp;</div><div><strong>Source Type</strong>: Thematic</div><div><strong>Pixel Type</strong>: 16 Bit Unsigned</div><div><strong>Data Projection</strong>: GCS WGS84</div><div><strong>Extent</strong>: Global</div><div><strong>Source</strong>: USGS, The Nature Conservancy, Esri</div><div><strong>Update Cycle</strong>: None</div></div><div><strong>Analysis:</strong> <a target='_blank' href='https://www.arcgis.com/home/group.html?id=55f9f38754f8438bade85c93061bd84c#overview' rel='nofollow ugc noopener noreferrer'>Analysis-Optimized</a></div><div>&nbsp;</div><div><div><span style='font-size:large;'>What can you do with this layer?</span></div><div>This map allows you to query the land surface pixels and returns the values of all the input parameters (landform type, landcover/vegetation type, climate region) and the name of the terrestrial ecosystem at that location.</div><div>&nbsp;</div><div>This layer can be used in analysis at global and local regions. However, for large scale spatial analysis, we have also provided an&nbsp;<a target='_blank' href='https://www.arcgis.com/home/item.html?id=3bfa1aa4cd9844d5a0922540210da25b' rel='nofollow ugc noopener noreferrer'>ArcGIS Pro Package</a>&nbsp;that contains the original raster data with multiple table attributes. For simple mapping applications, there is also a&nbsp;<a target='_blank' href='https://www.arcgis.com/home/item.html?id=d9434e94c817434c8448445501aee60a' rel='nofollow ugc noopener noreferrer'>raster tile layer</a>.&nbsp;</div><div>&nbsp;</div><div>This layer can be combined with the&nbsp;<a target='_blank' href='https://www.arcgis.com/home/item.html?id=ae78aeb913a343d69e950b53e29076f7' rel='nofollow ugc noopener noreferrer'>World Protected Areas Database</a>&nbsp;to assess the types of ecosystems that are protected, and progress towards meeting conservation goals. The WDPA layer updates monthly from the United Nations Environment Programme.</div><div>&nbsp;</div><p><strong>Analysis</strong></p><ul><li>In order to leverage the optimization for analysis, the capability must be enabled by your ArcGIS organization administrator. More information on enabling this feature can be found in the ‘Regional data hosting’ section of this help doc.</li><li>Optimized for analysis means this layer does not have size constraints for analysis and it is recommended for multisource analysis with other layers optimized for analysis. See the <a target='_blank' href='https://www.arcgis.com/home/group.html?id=55f9f38754f8438bade85c93061bd84c' rel='nofollow ugc noopener noreferrer'>ArcGIS Living Atlas: Analysis-Optimized Imagery Layers Group</a> for a complete list of imagery layers optimized for analysis.&nbsp;</li></ul><div>&nbsp;</div><div><span style='font-size:large;'>Developing the World Terrestrial Ecosystems</span></div><div>World Terrestrial Ecosystems map was produced by adopting and modifying the Intergovernmental Panel on Climate Change (IPCC) approach on the definition of Terrestrial Ecosystems and development of standardized global climate regions using the values of environmental moisture regime and temperature regime. We then combined the values of Global Climate Regions, Landforms and matrix-forming vegetation assemblage or land use, using the ArcGIS Combine tool (Spatial Analyst) to produce World Ecosystems Dataset. This combination resulted of 431 World Ecosystems classes.</div><div>&nbsp;</div><div>Each combination was assigned a color using an algorithm that blended traditional color schemes for each of the three components. Every pixel in this map is symbolized by a combination of values for each of these fields.</div><div>&nbsp;</div><div>The work from this collaboration is documented in the publication:</div><div><a target='_blank' href='https://www.sciencedirect.com/science/article/pii/S2351989419307231' rel='nofollow ugc noopener noreferrer'>Sayre et al. 2020.&nbsp; An assessment of the representation of ecosystems in global protected areas using new maps of World Climate Regions and World Ecosystems - Global Ecology and Conservation</a>&nbsp;&nbsp;</div><div>&nbsp;</div><div>More information about World Terrestrial Ecosystems can be found in&nbsp;<a target='_blank' href='https://storymaps.arcgis.com/stories/a4a6b1f779be4b64816d1876cfe669b9' rel='nofollow ugc noopener noreferrer'>this Story Map</a>.&nbsp;</div></div><div>&nbsp;</div><div>&nbsp;</div>",
			"keyword": [
				"esri_environment",
				"environment",
				"landscape",
				"worldecosystems",
				"terrestrialecosystems",
				"sdg15",
				"sdg",
				"landscape12",
				"ExU",
				"AnalysisOptimized"
			],
			"issued": "2020-04-02T00:35:31.000Z",
			"modified": "2026-08-07T22:37:20.000Z",
			"publisher": {
				"name": "Esri"
			},
			"contactPoint": {
				"@type": "vcard:Contact",
				"fn": "esri_landscape2",
				"hasEmail": "{{orgContactEmail}}"
			},
			"accessLevel": "public",
			"spatial": "-180.0000,-56.0000,179.9993,83.6258",
			"license": "<img src='https://downloads.esri.com/blogs/arcgisonline/esrilogo_new.png' /> This work is licensed under the Esri Master License Agreement.<br /><div><a href='https://goto.arcgis.com/termsofuse/viewsummary' rel='nofollow ugc' target='_blank'><b>View Summary</b></a> | <a href='https://goto.arcgis.com/termsofuse/viewtermsofuse' rel='nofollow ugc' target='_blank'><b>View Terms of Use</b></a></div>",
			"distribution": [
				{
					"@type": "dcat:Distribution",
					"title": "ArcGIS Hub Dataset",
					"format": "Web Page",
					"mediaType": "text/html",
					"accessURL": "https://www.pacificgeoportal.com/datasets/esri::world-terrestrial-ecosystems"
				},
				{
					"@type": "dcat:Distribution",
					"title": "ArcGIS GeoService",
					"format": "ArcGIS GeoServices REST API",
					"mediaType": "application/json",
					"accessURL": "https://landscape12.arcgis.com/arcgis/rest/services/World_Terrestrial_Ecosystems/ImageServer"
				}
			],
			"theme": [
				"geospatial"
			]
		},
		{
			"@type": "dcat:Dataset",
			"identifier": "https://www.arcgis.com/home/item.html?id=cd817a746aa7437cbd72a6d39cdb4559",
			"landingPage": "https://www.pacificgeoportal.com/datasets/esri::world-ecological-facets-landform-classes",
			"title": "World Ecological Facets Landform Classes",
			"description": "<div>Landforms are large recognizable features such as mountains, hills and plains; they are an important determinant of ecological character, habitat definition and terrain analysis. Landforms are important to the distribution of life in natural systems and are the basis for opportunities in built systems, and therefore landforms play a useful role in all natural science <span style='line-height: 1.38461538461538;'>fields of study </span><span style='line-height: 1.38461538461538;'>and planning disciplines.</span></div><div><span style='line-height: 1.38461538461538;'><br /></span></div><div><span style='line-height: 1.38461538461538;'><div style='font-family: &quot;Avenir Next W01&quot;, &quot;Avenir Next W00&quot;, &quot;Avenir Next&quot;, Avenir, &quot;Helvetica Neue&quot;, Helvetica, Arial, sans-serif; font-size: 17px; text-align: center;'><font size='4'><b>Dataset Summary</b></font></div><div style='font-family: &quot;Avenir Next W01&quot;, &quot;Avenir Next W00&quot;, &quot;Avenir Next&quot;, Avenir, &quot;Helvetica Neue&quot;, Helvetica, Arial, sans-serif; font-size: 17px;'><b>Phenomenon Mapped:</b> Landforms<br /></div><div style='font-family: &quot;Avenir Next W01&quot;, &quot;Avenir Next W00&quot;, &quot;Avenir Next&quot;, Avenir, &quot;Helvetica Neue&quot;, Helvetica, Arial, sans-serif; font-size: 17px;'><div><b>Units:</b> Meters</div><div><b>Cell Size:</b> <span style='background-color: rgb(255, 255, 255); font-size: 15.3333px;'>231.91560581932</span> meters</div><div><b>Source Type:</b> Thematic</div><div><b>Pixel Type:</b> 8-bit unsigned integer</div><div><b>Data Coordinate System:</b> WGS 1984</div><div><b>Mosaic Projection:</b> Web Mercator Auxiliary Sphere</div><div><b>Extent:</b> Global</div><div><b>Source:</b> Esri</div><div><b>Publication Date:</b> May 2016</div><div><b>ArcGIS Server URL:</b> https://landscape7.arcgis.com/arcgis/</div><div><br /></div></div></span></div><div><div style='font-family: &quot;Avenir Next W01&quot;, &quot;Avenir Next W00&quot;, &quot;Avenir Next&quot;, Avenir, &quot;Helvetica Neue&quot;, Helvetica, Arial, sans-serif; font-size: 17px; margin: 0px; padding: 0px;'><span style='line-height: 1.38462;'>In February 2017, Esri updated the <span style='font-size:11.0pt;font-family:&quot;Calibri&quot;,&quot;sans-serif&quot;;\nmso-fareast-font-family:Calibri;mso-fareast-theme-font:minor-latin;mso-bidi-font-family:\n&quot;Times New Roman&quot;;mso-ansi-language:EN-US;mso-fareast-language:EN-US;\nmso-bidi-language:AR-SA'><span style='font-size: 13pt; font-family: Helvetica, sans-serif; text-decoration: none;'>World Landforms -\nImproved Hammond Method </span></span>service with two display functions: Ecological Land Units landform classes and Ecological Facets landform classes. This layer represents Ecological Facets landform classes. You can view the Ecological Land Units landform classes by choosing Image Display, and changing the Renderer. </span></div><div style='font-family: &quot;Avenir Next W01&quot;, &quot;Avenir Next W00&quot;, &quot;Avenir Next&quot;, Avenir, &quot;Helvetica Neue&quot;, Helvetica, Arial, sans-serif; font-size: 17px; margin: 0px; padding: 0px;'><span style='line-height: 1.38462;'><br /></span></div><div style='margin: 0px; padding: 0px;'></div><div style='font-family: &quot;Avenir Next W01&quot;, &quot;Avenir Next W00&quot;, &quot;Avenir Next&quot;, Avenir, &quot;Helvetica Neue&quot;, Helvetica, Arial, sans-serif; font-size: 17px; margin: 0px; padding: 0px;'>This layer was produced using the I<span style='color: rgb(77, 77, 77);'>mproved Hammond Landform Classification Algorithm produced by Esri in 2016. </span></div><div style='margin: 0px; padding: 0px;'><font color='#4d4d4d' face='Avenir Next W01, Avenir Next W00, Avenir Next, Avenir, Helvetica Neue, Helvetica, Arial, sans-serif'><span style='font-size: 17px;'>This algorithm published and described by Karagulle et al. 2017: Modeling global Hammond landform regions from 250-m elevation data in </span></font><a href='https://onlinelibrary.wiley.com/doi/abs/10.1111/tgis.12265' rel='nofollow ugc' target='_blank'>Transactions in GIS</a><font color='#4d4d4d' face='Avenir Next W01, Avenir Next W00, Avenir Next, Avenir, Helvetica Neue, Helvetica, Arial, sans-serif'><span style='font-size: 17px;'>.</span></font><br /></div><div style='margin: 0px; padding: 0px;'><font color='#4d4d4d' face='Avenir Next W01, Avenir Next W00, Avenir Next, Avenir, Helvetica Neue, Helvetica, Arial, sans-serif'><span style='font-size: 17px;'><br /></span></font></div><div style='font-family: &quot;Avenir Next W01&quot;, &quot;Avenir Next W00&quot;, &quot;Avenir Next&quot;, Avenir, &quot;Helvetica Neue&quot;, Helvetica, Arial, sans-serif; font-size: 17px; margin: 0px; padding: 0px;'><span style='color: rgb(77, 77, 77);'>The algorithm, which is based on the most recent work in this area by </span><font color='#4d4d4d'><span style='background-color: rgb(255, 255, 255);'>Morgan, J. &amp;  Lesh, A. 2005: <i>Developing Landform Maps Using Esri’s Model Builder</i>., </span>Esri converted Morgan’s model into a Python script and revised it to work on global 250-meter resolution </font><a href='https://topotools.cr.usgs.gov/gmted_viewer/' rel='nofollow ugc' style='color: rgb(33, 117, 155); text-decoration: none; outline: none !important;' target='_blank'>GMTED2010</a><font color='#4d4d4d'> elevation data. <span style='background-color: rgb(255, 255, 255);'>Hammond’s landform classification characterizes regions rather than identifying individual features, thus, this layer contains sixteen classes of landforms:</span></font></div></div><div><div><ul><li><span style='line-height: 1.38461538461538;'>Nearly flat plains</span><br /></li><li><span style='line-height: 1.38461538461538;'>Smooth plains with some local relief</span><br /></li><li><span style='line-height: 1.38461538461538;'>Irregular plains with moderate relief </span><br /></li><li><span style='line-height: 1.38461538461538;'>Irregular plains with low hills</span><br /></li><li><span style='line-height: 1.38461538461538;'>Scattered moderate hills</span><br /></li><li><span style='line-height: 1.38461538461538;'>Scattered high hills</span><br /></li><li><span style='line-height: 1.38461538461538;'>Scattered low mountains</span><br /></li><li><span style='line-height: 1.38461538461538;'>Scattered high mountains</span><br /></li><li><span style='line-height: 1.38461538461538;'>Moderate hills</span><br /></li><li><span style='line-height: 1.38461538461538;'>High hills </span><br /></li><li><span style='line-height: 1.38461538461538;'>Tablelands with moderate relief</span><br /></li><li><span style='line-height: 1.38461538461538;'>Tablelands with considerable relief</span><br /></li><li><span style='line-height: 1.38461538461538;'>Tablelands with high relief </span><br /></li><li><span style='line-height: 1.38461538461538;'>Tablelands with very high relief </span><br /></li><li><span style='line-height: 1.38461538461538;'>Low mountains</span><br /></li><li><span style='line-height: 1.38461538461538;'>High mountains</span><br /></li></ul></div></div><div>To produce these classes, Esri staff first projected the 250-meter resolution GMTED elevation data to the World Equidistant Cylindrical coordinate system. Each cell in this dataset was assigned three characteristics:  slope based on 3-km neighborhood, relief based on 6 km neighborhood, and profile based on 6-km neighborhood. The last step was to overlay the combination of these three characteristics with areas that are exclusively plains. <br /></div><div><br /></div><div><b>Slope </b>is the percentage of the 3-km neighborhood occupied by gentle slope. Hammond specified 8% as the threshold for gentle slope. Slope is used to define how flat or steep the terrain is. Slope was classified into one of four classes: <br /></div><div><br /></div><div><table border='1' cellpadding='0' cellspacing='0' style='border-collapse:collapse;border:none;mso-border-alt:solid windowtext .5pt;\n mso-yfti-tbllook:1184;mso-padding-alt:0in 5.4pt 0in 5.4pt'>\n <tbody><tr>\n  <td style='width:125.75pt;border:solid windowtext 1.0pt;\n  mso-border-alt:solid windowtext .5pt;padding:0in 5.4pt 0in 5.4pt' valign='top' width='210'>\n  <p style='margin-bottom:0in;margin-bottom:.0001pt;line-height:\n  16.5pt'><span style='color: rgb(77, 77, 77);'><font size='2'>Percent of\n  neighborhood over 8% of slope</font></span></p>\n  </td>\n  <td style='width:.75in;border:solid windowtext 1.0pt;\n  border-left:none;mso-border-left-alt:solid windowtext .5pt;mso-border-alt:\n  solid windowtext .5pt;padding:0in 5.4pt 0in 5.4pt' valign='top' width='90'>\n  <p style='margin-bottom:0in;margin-bottom:.0001pt;line-height:\n  16.5pt'><span style='color: rgb(77, 77, 77);'><font size='2'>Slope Classes</font></span></p>\n  </td>\n </tr>\n <tr>\n  <td style='width:125.75pt;border:solid windowtext 1.0pt;\n  border-top:none;mso-border-top-alt:solid windowtext .5pt;mso-border-alt:solid windowtext .5pt;\n  padding:0in 5.4pt 0in 5.4pt' valign='top' width='210'>\n  <p style='margin-bottom:0in;margin-bottom:.0001pt;line-height:\n  16.5pt'><span style='color: rgb(77, 77, 77);'><font size='2'>0 - 20%</font></span></p>\n  </td>\n  <td style='width:.75in;border-top:none;border-left:none;\n  border-bottom:solid windowtext 1.0pt;border-right:solid windowtext 1.0pt;\n  mso-border-top-alt:solid windowtext .5pt;mso-border-left-alt:solid windowtext .5pt;\n  mso-border-alt:solid windowtext .5pt;padding:0in 5.4pt 0in 5.4pt' valign='top' width='90'>\n  <p align='center' style='margin-bottom:0in;margin-bottom:.0001pt;\n  text-align:center;line-height:16.5pt'><span style='color: rgb(77, 77, 77);'><font size='2'>400</font></span></p>\n  </td>\n </tr>\n <tr>\n  <td style='width:125.75pt;border:solid windowtext 1.0pt;\n  border-top:none;mso-border-top-alt:solid windowtext .5pt;mso-border-alt:solid windowtext .5pt;\n  padding:0in 5.4pt 0in 5.4pt' valign='top' width='210'>\n  <p style='margin-bottom:0in;margin-bottom:.0001pt;line-height:\n  16.5pt'><span style='color: rgb(77, 77, 77);'><font size='2'>21% -50%</font></span></p>\n  </td>\n  <td style='width:.75in;border-top:none;border-left:none;\n  border-bottom:solid windowtext 1.0pt;border-right:solid windowtext 1.0pt;\n  mso-border-top-alt:solid windowtext .5pt;mso-border-left-alt:solid windowtext .5pt;\n  mso-border-alt:solid windowtext .5pt;padding:0in 5.4pt 0in 5.4pt' valign='top' width='90'>\n  <p align='center' style='margin-bottom:0in;margin-bottom:.0001pt;\n  text-align:center;line-height:16.5pt'><span style='color: rgb(77, 77, 77);'><font size='2'>300</font></span></p>\n  </td>\n </tr>\n <tr>\n  <td style='width:125.75pt;border:solid windowtext 1.0pt;\n  border-top:none;mso-border-top-alt:solid windowtext .5pt;mso-border-alt:solid windowtext .5pt;\n  padding:0in 5.4pt 0in 5.4pt' valign='top' width='210'>\n  <p style='margin-bottom:0in;margin-bottom:.0001pt;line-height:\n  16.5pt'><span style='color: rgb(77, 77, 77);'><font size='2'>51% - 80%</font></span></p>\n  </td>\n  <td style='width:.75in;border-top:none;border-left:none;\n  border-bottom:solid windowtext 1.0pt;border-right:solid windowtext 1.0pt;\n  mso-border-top-alt:solid windowtext .5pt;mso-border-left-alt:solid windowtext .5pt;\n  mso-border-alt:solid windowtext .5pt;padding:0in 5.4pt 0in 5.4pt' valign='top' width='90'>\n  <p align='center' style='margin-bottom:0in;margin-bottom:.0001pt;\n  text-align:center;line-height:16.5pt'><span style='color: rgb(77, 77, 77);'><font size='2'>200</font></span></p>\n  </td>\n </tr>\n <tr>\n  <td style='width:125.75pt;border:solid windowtext 1.0pt;\n  border-top:none;mso-border-top-alt:solid windowtext .5pt;mso-border-alt:solid windowtext .5pt;\n  padding:0in 5.4pt 0in 5.4pt' valign='top' width='210'>\n  <p style='margin-bottom:0in;margin-bottom:.0001pt;line-height:\n  16.5pt'><span style='color: rgb(77, 77, 77);'><font size='2'>&gt;81%  </font></span></p>\n  </td>\n  <td style='width:.75in;border-top:none;border-left:none;\n  border-bottom:solid windowtext 1.0pt;border-right:solid windowtext 1.0pt;\n  mso-border-top-alt:solid windowtext .5pt;mso-border-left-alt:solid windowtext .5pt;\n  mso-border-alt:solid windowtext .5pt;padding:0in 5.4pt 0in 5.4pt' valign='top' width='90'>\n  <p align='center' style='margin-bottom:0in;margin-bottom:.0001pt;\n  text-align:center;line-height:16.5pt'><span style='color: rgb(77, 77, 77);'><font size='2'>100</font><font face='Lucida Sans Unicode, sans-serif' style='font-size: 10.5pt;'></font></span></p>\n  </td>\n </tr>\n</tbody></table><br /></div><div><b>Local Relief</b> is the difference between the maximum and minimum elevation within in the 6-km neighborhood. Local relief is used to define terrain how rugged or the complexity of the terrain's texture. Relief was assigned one of six classes:</div><div><br /></div><div><table border='1' cellpadding='0' cellspacing='0' style='border-collapse:collapse;border:none;mso-border-alt:solid windowtext .5pt;\n mso-yfti-tbllook:1184;mso-padding-alt:0in 5.4pt 0in 5.4pt'>\n <tbody><tr style='mso-yfti-irow:0;mso-yfti-firstrow:yes;height:17.1pt'>\n  <td style='width:149.95pt;border:solid windowtext 1.0pt;\n  mso-border-alt:solid windowtext .5pt;padding:0in 5.4pt 0in 5.4pt;height:17.1pt' valign='top' width='250'>\n  <p style='margin-bottom:0in;margin-bottom:.0001pt;text-align:\n  justify;line-height:16.5pt'><span style='color: rgb(77, 77, 77);'><font size='2'>Change in elevation </font></span></p>\n  </td>\n  <td style='width:93.95pt;border:solid windowtext 1.0pt;\n  border-left:none;mso-border-left-alt:solid windowtext .5pt;mso-border-alt:\n  solid windowtext .5pt;padding:0in 5.4pt 0in 5.4pt;height:17.1pt' valign='top' width='157'>\n  <p style='margin-bottom:0in;margin-bottom:.0001pt;line-height:\n  16.5pt'><span style='color: rgb(77, 77, 77);'><font size='2'>Relief Class ID</font></span></p>\n  </td>\n </tr>\n <tr style='mso-yfti-irow:1;height:13.45pt'>\n  <td style='width:149.95pt;border:solid windowtext 1.0pt;\n  border-top:none;mso-border-top-alt:solid windowtext .5pt;mso-border-alt:solid windowtext .5pt;\n  padding:0in 5.4pt 0in 5.4pt;height:13.45pt' valign='top' width='250'>\n  <p style='margin-bottom:0in;margin-bottom:.0001pt;text-align:\n  justify;line-height:16.5pt'><span style='color: rgb(77, 77, 77);'><font size='2'>0 – 30 meters</font></span></p>\n  </td>\n  <td style='width:93.95pt;border-top:none;border-left:\n  none;border-bottom:solid windowtext 1.0pt;border-right:solid windowtext 1.0pt;\n  mso-border-top-alt:solid windowtext .5pt;mso-border-left-alt:solid windowtext .5pt;\n  mso-border-alt:solid windowtext .5pt;padding:0in 5.4pt 0in 5.4pt;height:13.45pt' valign='top' width='157'>\n  <p align='center' style='margin-bottom:0in;margin-bottom:.0001pt;\n  text-align:center;line-height:16.5pt'><span style='color: rgb(77, 77, 77);'><font size='2'>10</font></span></p>\n  </td>\n </tr>\n <tr style='mso-yfti-irow:2;height:17.1pt'>\n  <td style='width:149.95pt;border:solid windowtext 1.0pt;\n  border-top:none;mso-border-top-alt:solid windowtext .5pt;mso-border-alt:solid windowtext .5pt;\n  padding:0in 5.4pt 0in 5.4pt;height:17.1pt' valign='top' width='250'>\n  <p style='margin-bottom:0in;margin-bottom:.0001pt;text-align:\n  justify;line-height:16.5pt'><span style='color: rgb(77, 77, 77);'><font size='2'>31 meter – 90 meters</font></span></p>\n  </td>\n  <td style='width:93.95pt;border-top:none;border-left:\n  none;border-bottom:solid windowtext 1.0pt;border-right:solid windowtext 1.0pt;\n  mso-border-top-alt:solid windowtext .5pt;mso-border-left-alt:solid windowtext .5pt;\n  mso-border-alt:solid windowtext .5pt;padding:0in 5.4pt 0in 5.4pt;height:17.1pt' valign='top' width='157'>\n  <p align='center' style='margin-bottom:0in;margin-bottom:.0001pt;\n  text-align:center;line-height:16.5pt'><span style='color: rgb(77, 77, 77);'><font size='2'>20</font></span></p>\n  </td>\n </tr>\n <tr style='mso-yfti-irow:3;height:17.1pt'>\n  <td style='width:149.95pt;border:solid windowtext 1.0pt;\n  border-top:none;mso-border-top-alt:solid windowtext .5pt;mso-border-alt:solid windowtext .5pt;\n  padding:0in 5.4pt 0in 5.4pt;height:17.1pt' valign='top' width='250'>\n  <p style='margin-bottom:0in;margin-bottom:.0001pt;text-align:\n  justify;line-height:16.5pt'><span style='color: rgb(77, 77, 77);'><font size='2'>91 meter – 150 meters</font></span></p>\n  </td>\n  <td style='width:93.95pt;border-top:none;border-left:\n  none;border-bottom:solid windowtext 1.0pt;border-right:solid windowtext 1.0pt;\n  mso-border-top-alt:solid windowtext .5pt;mso-border-left-alt:solid windowtext .5pt;\n  mso-border-alt:solid windowtext .5pt;padding:0in 5.4pt 0in 5.4pt;height:17.1pt' valign='top' width='157'>\n  <p align='center' style='margin-bottom:0in;margin-bottom:.0001pt;\n  text-align:center;line-height:16.5pt'><span style='color: rgb(77, 77, 77);'><font size='2'>30</font></span></p>\n  </td>\n </tr>\n <tr style='mso-yfti-irow:4;height:17.1pt'>\n  <td style='width:149.95pt;border:solid windowtext 1.0pt;\n  border-top:none;mso-border-top-alt:solid windowtext .5pt;mso-border-alt:solid windowtext .5pt;\n  padding:0in 5.4pt 0in 5.4pt;height:17.1pt' valign='top' width='250'>\n  <p style='margin-bottom:0in;margin-bottom:.0001pt;text-align:\n  justify;line-height:16.5pt'><span style='color: rgb(77, 77, 77);'><font size='2'>151 meter – 300\n  meters</font></span></p>\n  </td>\n  <td style='width:93.95pt;border-top:none;border-left:\n  none;border-bottom:solid windowtext 1.0pt;border-right:solid windowtext 1.0pt;\n  mso-border-top-alt:solid windowtext .5pt;mso-border-left-alt:solid windowtext .5pt;\n  mso-border-alt:solid windowtext .5pt;padding:0in 5.4pt 0in 5.4pt;height:17.1pt' valign='top' width='157'>\n  <p align='center' style='margin-bottom:0in;margin-bottom:.0001pt;\n  text-align:center;line-height:16.5pt'><span style='color: rgb(77, 77, 77);'><font size='2'>40</font></span></p>\n  </td>\n </tr>\n <tr style='mso-yfti-irow:5;height:17.1pt'>\n  <td style='width:149.95pt;border:solid windowtext 1.0pt;\n  border-top:none;mso-border-top-alt:solid windowtext .5pt;mso-border-alt:solid windowtext .5pt;\n  padding:0in 5.4pt 0in 5.4pt;height:17.1pt' valign='top' width='250'>\n  <p style='margin-bottom:0in;margin-bottom:.0001pt;text-align:\n  justify;line-height:16.5pt'><span style='color: rgb(77, 77, 77);'><font size='2'>301 meter – 900\n  meters</font></span></p>\n  </td>\n  <td style='width:93.95pt;border-top:none;border-left:\n  none;border-bottom:solid windowtext 1.0pt;border-right:solid windowtext 1.0pt;\n  mso-border-top-alt:solid windowtext .5pt;mso-border-left-alt:solid windowtext .5pt;\n  mso-border-alt:solid windowtext .5pt;padding:0in 5.4pt 0in 5.4pt;height:17.1pt' valign='top' width='157'>\n  <p align='center' style='margin-bottom:0in;margin-bottom:.0001pt;\n  text-align:center;line-height:16.5pt'><span style='color: rgb(77, 77, 77);'><font size='2'>50</font></span></p>\n  </td>\n </tr>\n <tr style='mso-yfti-irow:6;mso-yfti-lastrow:yes;height:17.1pt'>\n  <td style='width:149.95pt;border:solid windowtext 1.0pt;\n  border-top:none;mso-border-top-alt:solid windowtext .5pt;mso-border-alt:solid windowtext .5pt;\n  padding:0in 5.4pt 0in 5.4pt;height:17.1pt' valign='top' width='250'>\n  <p style='margin-bottom:0in;margin-bottom:.0001pt;text-align:\n  justify;line-height:16.5pt'><span style='color: rgb(77, 77, 77);'><font size='2'>&gt;900 meters</font></span></p>\n  </td>\n  <td style='width:93.95pt;border-top:none;border-left:\n  none;border-bottom:solid windowtext 1.0pt;border-right:solid windowtext 1.0pt;\n  mso-border-top-alt:solid windowtext .5pt;mso-border-left-alt:solid windowtext .5pt;\n  mso-border-alt:solid windowtext .5pt;padding:0in 5.4pt 0in 5.4pt;height:17.1pt' valign='top' width='157'>\n  <p align='center' style='margin-bottom:0in;margin-bottom:.0001pt;\n  text-align:center;line-height:16.5pt'><span style='color: rgb(77, 77, 77);'><font size='2'>60</font></span></p>\n  </td>\n </tr>\n</tbody></table></div><div><br /></div><div>The combination of slope and relief begin to define terrain as mountains, hills and plains. However, the difference between mountains or hills and tablelands cannot be distinguished using only these parameters. <br /></div><div><br /></div><div><b>Profile</b> is used to determine tableland areas. Profile identifies neighborhoods with upland and lowland areas, and calculates the percent area of gently sloping terrain within those upland and lowland areas. A 6-km circular neighborhood was used to calculate the profile parameter. Upland/lowland is determined by the difference between average local relief and elevation. In the 6-km neighborhood window, if the difference between maximum elevation and cell’s elevation is smaller than half of the local relief it’s an upland. If the difference between maximum elevation and cell’s elevation is larger than half of the local relief it’s a lowland.  Profile was assigned one of five classes:<br /></div><div><br /></div><div><table border='1' cellpadding='0' cellspacing='0' style='border-collapse:collapse;border:none;mso-border-alt:solid windowtext .5pt;\n mso-yfti-tbllook:1184;mso-padding-alt:0in 5.4pt 0in 5.4pt'>\n <tbody><tr>\n  <td style='width:233.75pt;border:solid windowtext 1.0pt;\n  mso-border-alt:solid windowtext .5pt;padding:0in 5.4pt 0in 5.4pt' valign='top' width='390'>\n  <p align='center' style='margin-bottom:0in;margin-bottom:.0001pt;\n  text-align:center;line-height:normal'><span style='color: rgb(77, 77, 77);'><font size='2'>Percent of neighborhood over 8% slope in upland or lowland\n  areas</font></span></p>\n  </td>\n  <td style='width:77.65pt;border:solid windowtext 1.0pt;\n  border-left:none;mso-border-left-alt:solid windowtext .5pt;mso-border-alt:\n  solid windowtext .5pt;padding:0in 5.4pt 0in 5.4pt' valign='top' width='129'>\n  <p style='margin-bottom:0in;margin-bottom:.0001pt;line-height:\n  normal'><span style='color: rgb(77, 77, 77);'><font size='2'>Profile Class</font></span></p>\n  </td>\n </tr>\n <tr>\n  <td style='width:233.75pt;border:solid windowtext 1.0pt;\n  border-top:none;mso-border-top-alt:solid windowtext .5pt;mso-border-alt:solid windowtext .5pt;\n  padding:0in 5.4pt 0in 5.4pt' valign='top' width='390'>\n  <p style='margin-bottom:0in;margin-bottom:.0001pt;line-height:\n  normal'><span style='color: rgb(77, 77, 77);'><font size='2'>Less than 50% gentle\n  slope is in upland or lowland</font></span></p>\n  </td>\n  <td style='width:77.65pt;border-top:none;border-left:\n  none;border-bottom:solid windowtext 1.0pt;border-right:solid windowtext 1.0pt;\n  mso-border-top-alt:solid windowtext .5pt;mso-border-left-alt:solid windowtext .5pt;\n  mso-border-alt:solid windowtext .5pt;padding:0in 5.4pt 0in 5.4pt' valign='top' width='129'>\n  <p align='center' style='margin-bottom:0in;margin-bottom:.0001pt;\n  text-align:center;line-height:normal'><span style='color: rgb(77, 77, 77);'><font size='2'>0</font></span></p>\n  </td>\n </tr>\n <tr>\n  <td style='width:233.75pt;border:solid windowtext 1.0pt;\n  border-top:none;mso-border-top-alt:solid windowtext .5pt;mso-border-alt:solid windowtext .5pt;\n  padding:0in 5.4pt 0in 5.4pt' valign='top' width='390'>\n  <p style='margin-bottom:0in;margin-bottom:.0001pt;line-height:\n  normal'><span style='color: rgb(77, 77, 77);'><font size='2'>More than 75% of\n  gentle slope is in lowland</font></span></p>\n  </td>\n  <td style='width:77.65pt;border-top:none;border-left:\n  none;border-bottom:solid windowtext 1.0pt;border-right:solid windowtext 1.0pt;\n  mso-border-top-alt:solid windowtext .5pt;mso-border-left-alt:solid windowtext .5pt;\n  mso-border-alt:solid windowtext .5pt;padding:0in 5.4pt 0in 5.4pt' valign='top' width='129'>\n  <p align='center' style='margin-bottom:0in;margin-bottom:.0001pt;\n  text-align:center;line-height:normal'><span style='color: rgb(77, 77, 77);'><font size='2'>1</font></span></p>\n  </td>\n </tr>\n <tr>\n  <td style='width:233.75pt;border:solid windowtext 1.0pt;\n  border-top:none;mso-border-top-alt:solid windowtext .5pt;mso-border-alt:solid windowtext .5pt;\n  padding:0in 5.4pt 0in 5.4pt' valign='top' width='390'>\n  <p style='margin-bottom:0in;margin-bottom:.0001pt;line-height:\n  normal'><span style='color: rgb(77, 77, 77);'><font size='2'>50%-75% of gentle\n  slope is in lowland</font></span></p>\n  </td>\n  <td style='width:77.65pt;border-top:none;border-left:\n  none;border-bottom:solid windowtext 1.0pt;border-right:solid windowtext 1.0pt;\n  mso-border-top-alt:solid windowtext .5pt;mso-border-left-alt:solid windowtext .5pt;\n  mso-border-alt:solid windowtext .5pt;padding:0in 5.4pt 0in 5.4pt' valign='top' width='129'>\n  <p align='center' style='margin-bottom:0in;margin-bottom:.0001pt;\n  text-align:center;line-height:normal'><span style='color: rgb(77, 77, 77);'><font size='2'>2</font></span></p>\n  </td>\n </tr>\n <tr>\n  <td style='width:233.75pt;border:solid windowtext 1.0pt;\n  border-top:none;mso-border-top-alt:solid windowtext .5pt;mso-border-alt:solid windowtext .5pt;\n  padding:0in 5.4pt 0in 5.4pt' valign='top' width='390'>\n  <p style='margin-bottom:0in;margin-bottom:.0001pt;line-height:\n  normal'><span style='color: rgb(77, 77, 77);'><font size='2'>50-75% of gentle\n  slope is in upland</font></span></p>\n  </td>\n  <td style='width:77.65pt;border-top:none;border-left:\n  none;border-bottom:solid windowtext 1.0pt;border-right:solid windowtext 1.0pt;\n  mso-border-top-alt:solid windowtext .5pt;mso-border-left-alt:solid windowtext .5pt;\n  mso-border-alt:solid windowtext .5pt;padding:0in 5.4pt 0in 5.4pt' valign='top' width='129'>\n  <p align='center' style='margin-bottom:0in;margin-bottom:.0001pt;\n  text-align:center;line-height:normal'><span style='color: rgb(77, 77, 77);'><font size='2'>3</font></span></p>\n  </td>\n </tr>\n <tr>\n  <td style='width:233.75pt;border:solid windowtext 1.0pt;\n  border-top:none;mso-border-top-alt:solid windowtext .5pt;mso-border-alt:solid windowtext .5pt;\n  padding:0in 5.4pt 0in 5.4pt' valign='top' width='390'>\n  <p style='margin-bottom:0in;margin-bottom:.0001pt;line-height:\n  normal'><span style='color: rgb(77, 77, 77);'><font size='2'>More than 75% of\n  gentle slope is in upland</font></span></p>\n  </td>\n  <td style='width:77.65pt;border-top:none;border-left:\n  none;border-bottom:solid windowtext 1.0pt;border-right:solid windowtext 1.0pt;\n  mso-border-top-alt:solid windowtext .5pt;mso-border-left-alt:solid windowtext .5pt;\n  mso-border-alt:solid windowtext .5pt;padding:0in 5.4pt 0in 5.4pt' valign='top' width='129'>\n  <p align='center' style='margin-bottom:0in;margin-bottom:.0001pt;\n  text-align:center;line-height:normal'><span style='color: rgb(77, 77, 77);'><font size='2'>4</font><span style='font-family: '></span></span></p>\n  </td>\n </tr>\n</tbody></table></div><div><br /></div><div><span style='line-height: 1.38461538461538;'>Early reviewers of the resulting classes noted one confusing outcome</span><span style='line-height: 1.38461538461538;'>, which was that </span><span style='line-height: 1.38461538461538;'>areas were classified as &quot;plains with low mountains&quot;, or &quot;plains with hills&quot; were often mostly plains, and the hills or mountains were part of an adjacent set of exclusively identified hills or mountains. To address this areas that are exclusively plains were produced, and used to override these confusing areas. The hills and mountains within those areas were converted to their respective landform class.</span><br /></div><div><span style='line-height: 1.38461538461538;'><br /></span></div><div>The combination of slope, relief and profile merged with the areas of plains, can be better understood using the following diagram, which uses the colors in this layer to show which classes are present and what parameter values produced them:<br /></div><div><br /></div><div><img alt='Hammond Classification by parameter' src='https://downloads2.esri.com/esri_content_doc/landscape/hammondclasses.gif' /><br /></div><div><br /></div><div style='text-align: center;'><b><br /></b></div><div style='text-align: center;'><font size='4'><b>What can you do with this layer?</b></font></div><div><br /></div><div><div style='margin: 0px; padding: 0px;'>This layer is suitable for both visualization and analysis. It can be used in ArcGIS Online in web maps and applications and can be used in ArcGIS Desktop. </div><div style='margin: 0px; padding: 0px;'><div style='margin: 0px; padding: 0px;'><div style='margin: 0px; padding: 0px;'><div><br /></div><div><div style='margin: 0px; padding: 0px;'>This layer is part of a larger collection of <a href='https://www.arcgis.com/home/group.html?owner=esri&amp;title=Landscape%20Layers&amp;start=131&amp;q=' rel='nofollow ugc' style='outline: none !important;' target='_blank'>landscape layers</a> that you can use to perform a wide variety of mapping and analysis tasks.</div><div style='margin: 0px; padding: 0px;'><br /></div><div style='margin: 0px; padding: 0px;'>The <a href='https://doc.arcgis.com/en/living-atlas/#s=0&amp;n=0&amp;d=1&amp;col=&amp;fs=0&amp;fn=30&amp;npp=120&amp;subCat=0' rel='nofollow ugc' style='outline: none !important;' target='_blank'>Living Atlas of the World</a> provides an easy way to explore the landscape layers and many other beautiful and authoritative maps on hundreds of topics.</div><div style='margin: 0px; padding: 0px;'><br /></div><div style='margin: 0px; padding: 0px;'><div style='margin: 0px; padding: 0px;'><a href='https://geonet.esri.com/' rel='nofollow ugc' style='outline: none !important;' target='_blank'>Geonet</a> is a good resource for learning more about landscape layers and the Living Atlas of the World. To get started see the <a href='https://geonet.esri.com/groups/livingatlas?sr=search&amp;searchId=ec0b33d6-14bb-4319-8ad5-38961b68610e&amp;searchIndex=0' rel='nofollow ugc' style='outline: none !important;' target='_blank'>Living Atlas Discussion Group</a>.</div><div style='margin: 0px; padding: 0px;'><br /></div><div style='margin: 0px; padding: 0px;'>The <a href='https://goto.arcgisonline.com/arcgis/Ecological_Land_Units/RolloutBlog' rel='nofollow ugc' style='outline: none !important;' target='_blank'>Esri Insider Blog</a> provides an introduction to the Ecophysiographic Mapping project.</div></div></div></div></div></div></div>",
			"keyword": [
				"esri_landscape",
				"landscape7",
				"ecophysiography",
				"landscape",
				"elevation",
				"ExU"
			],
			"issued": "2015-07-14T21:05:53.000Z",
			"modified": "2020-08-27T00:01:49.000Z",
			"publisher": {
				"name": "Esri"
			},
			"contactPoint": {
				"@type": "vcard:Contact",
				"fn": "esri_landscape2",
				"hasEmail": "{{orgContactEmail}}"
			},
			"accessLevel": "public",
			"spatial": "-180.0000,-56.0010,180.0000,83.6249",
			"license": "<img alt='' src='https://downloads.esri.com/blogs/arcgisonline/esrilogo_new.png' />This work is licensed under the Esri Master License Agreement. <br /><div><a href='https://goto.arcgis.com/termsofuse/viewsummary' target='_blank' rel='nofollow ugc noopener noreferrer'><b>View Summary</b></a> | <a href='https://goto.arcgis.com/termsofuse/viewtermsofuse' target='_blank' rel='nofollow ugc noopener noreferrer'><b>View Terms of Use</b></a> </div><div><span style='line-height: 16.05px;'><br /></span></div><div><font color='#b22222'>Important Note:</font> This item requires an ArcGIS Online organizational subscription or an ArcGIS Developer account and does not consume credits. To access this item, you'll need to do one of the following: </div><div><ul><li>Sign in with an account that is a member of an organizational subscription </li><li>Sign in with a developer account </li><li><a href='https://goto.arcgis.com/termsofuse/registeranapplication' target='_blank' rel='nofollow ugc noopener noreferrer'>Register an application</a> and use your application's credentials.</li></ul>If you don't have an account, you can sign up for a <a href='https://goto.arcgis.com/features/trial' target='_blank' rel='nofollow ugc noopener noreferrer'>free trial of ArcGIS</a> or a <a href='https://goto.arcgis.com/developers/signup' target='_blank' rel='nofollow ugc noopener noreferrer'>free ArcGIS Developer account</a>.</div>",
			"distribution": [
				{
					"@type": "dcat:Distribution",
					"title": "ArcGIS Hub Dataset",
					"format": "Web Page",
					"mediaType": "text/html",
					"accessURL": "https://www.pacificgeoportal.com/datasets/esri::world-ecological-facets-landform-classes"
				},
				{
					"@type": "dcat:Distribution",
					"title": "ArcGIS GeoService",
					"format": "ArcGIS GeoServices REST API",
					"mediaType": "application/json",
					"accessURL": "https://landscape7.arcgis.com/arcgis/rest/services/World_Landforms_Improved_Hammond_Method/ImageServer"
				}
			],
			"theme": [
				"geospatial"
			]
		},
		{
			"@type": "dcat:Dataset",
			"identifier": "https://www.arcgis.com/home/item.html?id=37a384d4c1ef4f56a33a40f291a634e9&sublayer=0",
			"landingPage": "https://www.pacificgeoportal.com/datasets/arcgis-content::global-active-earthquake-faults",
			"title": "Global Active Earthquake Faults",
			"description": "<p>Faults are where two pieces of Earth's crust meet and are associated with movement. Sometimes they move suddenly, generating an earthquake. According to the USGS, there are several types of faults, characterized by how the two pieces are moving relative to each other:</p><div><ul><li>Normal Fault: where the upper block moves downward relative to the lower block</li><li>Thrust Fault: where the upper block move up and over the lower block</li><li>Strike-slip: where two blocks slide past each other.&nbsp;</li></ul><div>The mapping of active faults has been done by many organizations around the world, and the&nbsp;<a target='_blank' href='https://www.globalquakemodel.org/' rel='nofollow ugc noopener noreferrer'>Global Earthquake Model Foundation</a>&nbsp;(GEM) has been aggregating that information into a single dataset, available in this layer. Additional information on the contributors can be found&nbsp;<a target='_blank' href='https://blogs.openquake.org/hazard/global-active-fault-viewer/' rel='nofollow ugc noopener noreferrer'>here</a>, along with links to the original data with more detailed movement and source information.&nbsp;</div><div>&nbsp;</div><div>Use and constraints: This layer was created for mapping purposes, not in-depth analysis.&nbsp; &nbsp;<br /><br />Expected data updates: none</div></div>",
			"keyword": [
				"geology",
				"fault",
				"earthquake"
			],
			"issued": "2020-08-05T21:12:46.000Z",
			"modified": "2026-07-22T23:34:03.124Z",
			"publisher": {
				"name": "ArcGIS Living Atlas Team"
			},
			"contactPoint": {
				"@type": "vcard:Contact",
				"fn": "dpisut_content",
				"hasEmail": "{{orgContactEmail}}"
			},
			"accessLevel": "public",
			"spatial": "-180.0000,-66.1630,180.0000,86.8050",
			"license": "https://creativecommons.org/licenses/by/4.0",
			"distribution": [
				{
					"@type": "dcat:Distribution",
					"title": "ArcGIS Hub Dataset",
					"format": "Web Page",
					"mediaType": "text/html",
					"accessURL": "https://www.pacificgeoportal.com/datasets/arcgis-content::global-active-earthquake-faults"
				},
				{
					"@type": "dcat:Distribution",
					"title": "ArcGIS GeoService",
					"format": "ArcGIS GeoServices REST API",
					"mediaType": "application/json",
					"accessURL": "https://services.arcgis.com/jIL9msH9OI208GCb/arcgis/rest/services/Active_Faults/FeatureServer/0"
				},
				{
					"@type": "dcat:Distribution",
					"title": "CSV",
					"format": "CSV",
					"mediaType": "text/csv",
					"accessURL": "https://www.pacificgeoportal.com/api/download/v1/items/37a384d4c1ef4f56a33a40f291a634e9/csv?layers=0"
				},
				{
					"@type": "dcat:Distribution",
					"title": "Shapefile",
					"format": "ZIP",
					"mediaType": "application/zip",
					"accessURL": "https://www.pacificgeoportal.com/api/download/v1/items/37a384d4c1ef4f56a33a40f291a634e9/shapefile?layers=0"
				},
				{
					"@type": "dcat:Distribution",
					"title": "GeoJSON",
					"format": "GeoJSON",
					"mediaType": "application/vnd.geo+json",
					"accessURL": "https://www.pacificgeoportal.com/api/download/v1/items/37a384d4c1ef4f56a33a40f291a634e9/geojson?layers=0"
				},
				{
					"@type": "dcat:Distribution",
					"title": "KML",
					"format": "KML",
					"mediaType": "application/vnd.google-earth.kml+xml",
					"accessURL": "https://www.pacificgeoportal.com/api/download/v1/items/37a384d4c1ef4f56a33a40f291a634e9/kml?layers=0"
				}
			],
			"theme": [
				"geospatial"
			]
		},
		{
			"@type": "dcat:Dataset",
			"identifier": "https://www.arcgis.com/home/item.html?id=8f5deec9956e4a8cb1f13dfd8c0232db",
			"landingPage": "https://www.pacificgeoportal.com/maps/esri2::standardized-precipitation-index-spi-recent-conditions",
			"title": "Standardized Precipitation Index (SPI) Recent Conditions",
			"description": "<div><a target='_blank' href='https://www.fao.org/land-water/water/drought/en/' rel='nofollow ugc noopener noreferrer'>Droughts</a> are natural occurring events in which dry conditions persist over time. Droughts are complex to characterize because they depend on water and energy balances at different temporal and spatial scales. The <a target='_blank' href='https://climatedataguide.ucar.edu/climate-data/standardized-precipitation-index-spi' rel='nofollow ugc noopener noreferrer'>Standardized Precipitation Index (SPI)</a> is used to analyze meteorological droughts. SPI estimates the deviation of precipitation from the long-term probability function at <a target='_blank' href='https://www.in.gov/dnr/water/water-availability-use-rights/water-resource-updates/monthly-water-resource-summary/explanation-of-standard-precipitation-index-spi/' rel='nofollow ugc noopener noreferrer'>different time scales</a> (e.g. 1, 3, 6, 9, or 12 months). SPI only uses monthly precipitation as an input, which can be helpful for characterizing meteorological droughts. Other variables should be included (e.g. temperature or evapotranspiration) in the characterization of other types of droughts (e.g. agricultural droughts).</div><div>&nbsp;</div><div>This layer shows the SPI index at different temporal periods calculated using the SPEI library in R and precipitation data from CHIRPS data set.</div><div>&nbsp;</div><div>Read more in our blogs:&nbsp;</div><ul><li><div><a target='_blank' href='https://www.esri.com/arcgis-blog/products/arcgis-living-atlas/water/water-conflicts-in-international-rivers' rel='nofollow ugc noopener noreferrer'>Water Conflicts in International Rivers</a></div></li><li><div><a target='_blank' href='https://www.esri.com/arcgis-blog/products/arcgis-living-atlas/mapping/mapping-drought-trends-in-the-u-s' rel='nofollow ugc noopener noreferrer'>Mapping Drought Trends in the U.S.</a></div></li></ul><div>&nbsp;</div><div><strong>Sources:</strong></div><div><ul><li><a target='_blank' href='https://www.chc.ucsb.edu/data' rel='nofollow ugc noopener noreferrer'>Climate Hazards Center InfraRed Precipitation with Station data (CHIRPS)</a></li><li><a target='_blank' href='https://spei.csic.es/index.html' rel='nofollow ugc noopener noreferrer'>SPEI R library</a></li></ul></div>",
			"keyword": [
				"Drought",
				"Precipitation",
				"Environment",
				"Standardized Precipitation Index",
				"SPI",
				"Live Feeds",
				"livefeeds2"
			],
			"issued": "2020-07-07T19:28:02.000Z",
			"modified": "2026-07-21T17:21:59.000Z",
			"publisher": {
				"name": "Esri"
			},
			"contactPoint": {
				"@type": "vcard:Contact",
				"fn": "esri_livefeeds2",
				"hasEmail": "{{orgContactEmail}}"
			},
			"accessLevel": "public",
			"spatial": "-180.0000,-50.0000,-179.9057,49.9360",
			"license": "<img src='https://downloads.esri.com/blogs/arcgisonline/esrilogo_new.png' /> This work is licensed under the Esri Master License Agreement.<br /><div><a href='https://goto.arcgis.com/termsofuse/viewsummary' target='_blank' rel='nofollow ugc noopener noreferrer'><b>View Summary</b></a> | <a href='https://goto.arcgis.com/termsofuse/viewtermsofuse' target='_blank' rel='nofollow ugc noopener noreferrer'><b>View Terms of Use</b></a></div>",
			"distribution": [
				{
					"@type": "dcat:Distribution",
					"title": "ArcGIS Hub Dataset",
					"format": "Web Page",
					"mediaType": "text/html",
					"accessURL": "https://www.pacificgeoportal.com/maps/esri2::standardized-precipitation-index-spi-recent-conditions"
				},
				{
					"@type": "dcat:Distribution",
					"title": "ArcGIS GeoService",
					"format": "ArcGIS GeoServices REST API",
					"mediaType": "application/json",
					"accessURL": "https://services9.arcgis.com/RHVPKKiFTONKtxq3/arcgis/rest/services/SPI_recent/FeatureServer"
				}
			],
			"theme": [
				"geospatial"
			]
		},
		{
			"@type": "dcat:Dataset",
			"identifier": "https://www.arcgis.com/home/item.html?id=8f5deec9956e4a8cb1f13dfd8c0232db&sublayer=0",
			"landingPage": "https://www.pacificgeoportal.com/datasets/esri2::1-month-spi",
			"title": "1-month SPI",
			"description": "<div><a target='_blank' href='https://www.fao.org/land-water/water/drought/en/' rel='nofollow ugc noopener noreferrer'>Droughts</a> are natural occurring events in which dry conditions persist over time. Droughts are complex to characterize because they depend on water and energy balances at different temporal and spatial scales. The <a target='_blank' href='https://climatedataguide.ucar.edu/climate-data/standardized-precipitation-index-spi' rel='nofollow ugc noopener noreferrer'>Standardized Precipitation Index (SPI)</a> is used to analyze meteorological droughts. SPI estimates the deviation of precipitation from the long-term probability function at <a target='_blank' href='https://www.in.gov/dnr/water/water-availability-use-rights/water-resource-updates/monthly-water-resource-summary/explanation-of-standard-precipitation-index-spi/' rel='nofollow ugc noopener noreferrer'>different time scales</a> (e.g. 1, 3, 6, 9, or 12 months). SPI only uses monthly precipitation as an input, which can be helpful for characterizing meteorological droughts. Other variables should be included (e.g. temperature or evapotranspiration) in the characterization of other types of droughts (e.g. agricultural droughts).</div><div>&nbsp;</div><div>This layer shows the SPI index at different temporal periods calculated using the SPEI library in R and precipitation data from CHIRPS data set.</div><div>&nbsp;</div><div>Read more in our blogs:&nbsp;</div><ul><li><div><a target='_blank' href='https://www.esri.com/arcgis-blog/products/arcgis-living-atlas/water/water-conflicts-in-international-rivers' rel='nofollow ugc noopener noreferrer'>Water Conflicts in International Rivers</a></div></li><li><div><a target='_blank' href='https://www.esri.com/arcgis-blog/products/arcgis-living-atlas/mapping/mapping-drought-trends-in-the-u-s' rel='nofollow ugc noopener noreferrer'>Mapping Drought Trends in the U.S.</a></div></li></ul><div>&nbsp;</div><div><strong>Sources:</strong></div><div><ul><li><a target='_blank' href='https://www.chc.ucsb.edu/data' rel='nofollow ugc noopener noreferrer'>Climate Hazards Center InfraRed Precipitation with Station data (CHIRPS)</a></li><li><a target='_blank' href='https://spei.csic.es/index.html' rel='nofollow ugc noopener noreferrer'>SPEI R library</a></li></ul></div>",
			"keyword": [
				"Drought",
				"Precipitation",
				"Environment",
				"Standardized Precipitation Index",
				"SPI",
				"Live Feeds",
				"livefeeds2"
			],
			"issued": "2020-07-07T19:28:02.000Z",
			"modified": "2026-09-01T17:44:52.221Z",
			"publisher": {
				"name": "Esri"
			},
			"contactPoint": {
				"@type": "vcard:Contact",
				"fn": "esri_livefeeds2",
				"hasEmail": "{{orgContactEmail}}"
			},
			"accessLevel": "public",
			"spatial": "-180.0000,-50.0000,-179.9057,49.9360",
			"license": "<img src='https://downloads.esri.com/blogs/arcgisonline/esrilogo_new.png' /> This work is licensed under the Esri Master License Agreement.<br /><div><a href='https://goto.arcgis.com/termsofuse/viewsummary' target='_blank' rel='nofollow ugc noopener noreferrer'><b>View Summary</b></a> | <a href='https://goto.arcgis.com/termsofuse/viewtermsofuse' target='_blank' rel='nofollow ugc noopener noreferrer'><b>View Terms of Use</b></a></div>",
			"distribution": [
				{
					"@type": "dcat:Distribution",
					"title": "ArcGIS Hub Dataset",
					"format": "Web Page",
					"mediaType": "text/html",
					"accessURL": "https://www.pacificgeoportal.com/datasets/esri2::1-month-spi"
				},
				{
					"@type": "dcat:Distribution",
					"title": "ArcGIS GeoService",
					"format": "ArcGIS GeoServices REST API",
					"mediaType": "application/json",
					"accessURL": "https://services9.arcgis.com/RHVPKKiFTONKtxq3/arcgis/rest/services/SPI_recent/FeatureServer/0"
				},
				{
					"@type": "dcat:Distribution",
					"title": "CSV",
					"format": "CSV",
					"mediaType": "text/csv",
					"accessURL": "https://www.pacificgeoportal.com/api/download/v1/items/8f5deec9956e4a8cb1f13dfd8c0232db/csv?layers=0"
				},
				{
					"@type": "dcat:Distribution",
					"title": "Shapefile",
					"format": "ZIP",
					"mediaType": "application/zip",
					"accessURL": "https://www.pacificgeoportal.com/api/download/v1/items/8f5deec9956e4a8cb1f13dfd8c0232db/shapefile?layers=0"
				},
				{
					"@type": "dcat:Distribution",
					"title": "GeoJSON",
					"format": "GeoJSON",
					"mediaType": "application/vnd.geo+json",
					"accessURL": "https://www.pacificgeoportal.com/api/download/v1/items/8f5deec9956e4a8cb1f13dfd8c0232db/geojson?layers=0"
				},
				{
					"@type": "dcat:Distribution",
					"title": "KML",
					"format": "KML",
					"mediaType": "application/vnd.google-earth.kml+xml",
					"accessURL": "https://www.pacificgeoportal.com/api/download/v1/items/8f5deec9956e4a8cb1f13dfd8c0232db/kml?layers=0"
				}
			],
			"theme": [
				"geospatial"
			]
		},
		{
			"@type": "dcat:Dataset",
			"identifier": "https://www.arcgis.com/home/item.html?id=8f5deec9956e4a8cb1f13dfd8c0232db&sublayer=1",
			"landingPage": "https://www.pacificgeoportal.com/datasets/esri2::3-month-spi",
			"title": "3-month SPI",
			"description": "<div><a target='_blank' href='https://www.fao.org/land-water/water/drought/en/' rel='nofollow ugc noopener noreferrer'>Droughts</a> are natural occurring events in which dry conditions persist over time. Droughts are complex to characterize because they depend on water and energy balances at different temporal and spatial scales. The <a target='_blank' href='https://climatedataguide.ucar.edu/climate-data/standardized-precipitation-index-spi' rel='nofollow ugc noopener noreferrer'>Standardized Precipitation Index (SPI)</a> is used to analyze meteorological droughts. SPI estimates the deviation of precipitation from the long-term probability function at <a target='_blank' href='https://www.in.gov/dnr/water/water-availability-use-rights/water-resource-updates/monthly-water-resource-summary/explanation-of-standard-precipitation-index-spi/' rel='nofollow ugc noopener noreferrer'>different time scales</a> (e.g. 1, 3, 6, 9, or 12 months). SPI only uses monthly precipitation as an input, which can be helpful for characterizing meteorological droughts. Other variables should be included (e.g. temperature or evapotranspiration) in the characterization of other types of droughts (e.g. agricultural droughts).</div><div>&nbsp;</div><div>This layer shows the SPI index at different temporal periods calculated using the SPEI library in R and precipitation data from CHIRPS data set.</div><div>&nbsp;</div><div>Read more in our blogs:&nbsp;</div><ul><li><div><a target='_blank' href='https://www.esri.com/arcgis-blog/products/arcgis-living-atlas/water/water-conflicts-in-international-rivers' rel='nofollow ugc noopener noreferrer'>Water Conflicts in International Rivers</a></div></li><li><div><a target='_blank' href='https://www.esri.com/arcgis-blog/products/arcgis-living-atlas/mapping/mapping-drought-trends-in-the-u-s' rel='nofollow ugc noopener noreferrer'>Mapping Drought Trends in the U.S.</a></div></li></ul><div>&nbsp;</div><div><strong>Sources:</strong></div><div><ul><li><a target='_blank' href='https://www.chc.ucsb.edu/data' rel='nofollow ugc noopener noreferrer'>Climate Hazards Center InfraRed Precipitation with Station data (CHIRPS)</a></li><li><a target='_blank' href='https://spei.csic.es/index.html' rel='nofollow ugc noopener noreferrer'>SPEI R library</a></li></ul></div>",
			"keyword": [
				"Drought",
				"Precipitation",
				"Environment",
				"Standardized Precipitation Index",
				"SPI",
				"Live Feeds",
				"livefeeds2"
			],
			"issued": "2020-07-07T19:28:02.000Z",
			"modified": "2026-09-01T17:44:52.221Z",
			"publisher": {
				"name": "Esri"
			},
			"contactPoint": {
				"@type": "vcard:Contact",
				"fn": "esri_livefeeds2",
				"hasEmail": "{{orgContactEmail}}"
			},
			"accessLevel": "public",
			"spatial": "-180.0000,-50.0000,-179.9057,49.9360",
			"license": "<img src='https://downloads.esri.com/blogs/arcgisonline/esrilogo_new.png' /> This work is licensed under the Esri Master License Agreement.<br /><div><a href='https://goto.arcgis.com/termsofuse/viewsummary' target='_blank' rel='nofollow ugc noopener noreferrer'><b>View Summary</b></a> | <a href='https://goto.arcgis.com/termsofuse/viewtermsofuse' target='_blank' rel='nofollow ugc noopener noreferrer'><b>View Terms of Use</b></a></div>",
			"distribution": [
				{
					"@type": "dcat:Distribution",
					"title": "ArcGIS Hub Dataset",
					"format": "Web Page",
					"mediaType": "text/html",
					"accessURL": "https://www.pacificgeoportal.com/datasets/esri2::3-month-spi"
				},
				{
					"@type": "dcat:Distribution",
					"title": "ArcGIS GeoService",
					"format": "ArcGIS GeoServices REST API",
					"mediaType": "application/json",
					"accessURL": "https://services9.arcgis.com/RHVPKKiFTONKtxq3/arcgis/rest/services/SPI_recent/FeatureServer/1"
				},
				{
					"@type": "dcat:Distribution",
					"title": "CSV",
					"format": "CSV",
					"mediaType": "text/csv",
					"accessURL": "https://www.pacificgeoportal.com/api/download/v1/items/8f5deec9956e4a8cb1f13dfd8c0232db/csv?layers=1"
				},
				{
					"@type": "dcat:Distribution",
					"title": "Shapefile",
					"format": "ZIP",
					"mediaType": "application/zip",
					"accessURL": "https://www.pacificgeoportal.com/api/download/v1/items/8f5deec9956e4a8cb1f13dfd8c0232db/shapefile?layers=1"
				},
				{
					"@type": "dcat:Distribution",
					"title": "GeoJSON",
					"format": "GeoJSON",
					"mediaType": "application/vnd.geo+json",
					"accessURL": "https://www.pacificgeoportal.com/api/download/v1/items/8f5deec9956e4a8cb1f13dfd8c0232db/geojson?layers=1"
				},
				{
					"@type": "dcat:Distribution",
					"title": "KML",
					"format": "KML",
					"mediaType": "application/vnd.google-earth.kml+xml",
					"accessURL": "https://www.pacificgeoportal.com/api/download/v1/items/8f5deec9956e4a8cb1f13dfd8c0232db/kml?layers=1"
				}
			],
			"theme": [
				"geospatial"
			]
		},
		{
			"@type": "dcat:Dataset",
			"identifier": "https://www.arcgis.com/home/item.html?id=8f5deec9956e4a8cb1f13dfd8c0232db&sublayer=2",
			"landingPage": "https://www.pacificgeoportal.com/datasets/esri2::6-month-spi",
			"title": "6-month SPI",
			"description": "<div><a target='_blank' href='https://www.fao.org/land-water/water/drought/en/' rel='nofollow ugc noopener noreferrer'>Droughts</a> are natural occurring events in which dry conditions persist over time. Droughts are complex to characterize because they depend on water and energy balances at different temporal and spatial scales. The <a target='_blank' href='https://climatedataguide.ucar.edu/climate-data/standardized-precipitation-index-spi' rel='nofollow ugc noopener noreferrer'>Standardized Precipitation Index (SPI)</a> is used to analyze meteorological droughts. SPI estimates the deviation of precipitation from the long-term probability function at <a target='_blank' href='https://www.in.gov/dnr/water/water-availability-use-rights/water-resource-updates/monthly-water-resource-summary/explanation-of-standard-precipitation-index-spi/' rel='nofollow ugc noopener noreferrer'>different time scales</a> (e.g. 1, 3, 6, 9, or 12 months). SPI only uses monthly precipitation as an input, which can be helpful for characterizing meteorological droughts. Other variables should be included (e.g. temperature or evapotranspiration) in the characterization of other types of droughts (e.g. agricultural droughts).</div><div>&nbsp;</div><div>This layer shows the SPI index at different temporal periods calculated using the SPEI library in R and precipitation data from CHIRPS data set.</div><div>&nbsp;</div><div>Read more in our blogs:&nbsp;</div><ul><li><div><a target='_blank' href='https://www.esri.com/arcgis-blog/products/arcgis-living-atlas/water/water-conflicts-in-international-rivers' rel='nofollow ugc noopener noreferrer'>Water Conflicts in International Rivers</a></div></li><li><div><a target='_blank' href='https://www.esri.com/arcgis-blog/products/arcgis-living-atlas/mapping/mapping-drought-trends-in-the-u-s' rel='nofollow ugc noopener noreferrer'>Mapping Drought Trends in the U.S.</a></div></li></ul><div>&nbsp;</div><div><strong>Sources:</strong></div><div><ul><li><a target='_blank' href='https://www.chc.ucsb.edu/data' rel='nofollow ugc noopener noreferrer'>Climate Hazards Center InfraRed Precipitation with Station data (CHIRPS)</a></li><li><a target='_blank' href='https://spei.csic.es/index.html' rel='nofollow ugc noopener noreferrer'>SPEI R library</a></li></ul></div>",
			"keyword": [
				"Drought",
				"Precipitation",
				"Environment",
				"Standardized Precipitation Index",
				"SPI",
				"Live Feeds",
				"livefeeds2"
			],
			"issued": "2020-07-07T19:28:02.000Z",
			"modified": "2026-09-01T17:44:52.221Z",
			"publisher": {
				"name": "Esri"
			},
			"contactPoint": {
				"@type": "vcard:Contact",
				"fn": "esri_livefeeds2",
				"hasEmail": "{{orgContactEmail}}"
			},
			"accessLevel": "public",
			"spatial": "-180.0000,-50.0000,-179.9057,49.9360",
			"license": "<img src='https://downloads.esri.com/blogs/arcgisonline/esrilogo_new.png' /> This work is licensed under the Esri Master License Agreement.<br /><div><a href='https://goto.arcgis.com/termsofuse/viewsummary' target='_blank' rel='nofollow ugc noopener noreferrer'><b>View Summary</b></a> | <a href='https://goto.arcgis.com/termsofuse/viewtermsofuse' target='_blank' rel='nofollow ugc noopener noreferrer'><b>View Terms of Use</b></a></div>",
			"distribution": [
				{
					"@type": "dcat:Distribution",
					"title": "ArcGIS Hub Dataset",
					"format": "Web Page",
					"mediaType": "text/html",
					"accessURL": "https://www.pacificgeoportal.com/datasets/esri2::6-month-spi"
				},
				{
					"@type": "dcat:Distribution",
					"title": "ArcGIS GeoService",
					"format": "ArcGIS GeoServices REST API",
					"mediaType": "application/json",
					"accessURL": "https://services9.arcgis.com/RHVPKKiFTONKtxq3/arcgis/rest/services/SPI_recent/FeatureServer/2"
				},
				{
					"@type": "dcat:Distribution",
					"title": "CSV",
					"format": "CSV",
					"mediaType": "text/csv",
					"accessURL": "https://www.pacificgeoportal.com/api/download/v1/items/8f5deec9956e4a8cb1f13dfd8c0232db/csv?layers=2"
				},
				{
					"@type": "dcat:Distribution",
					"title": "Shapefile",
					"format": "ZIP",
					"mediaType": "application/zip",
					"accessURL": "https://www.pacificgeoportal.com/api/download/v1/items/8f5deec9956e4a8cb1f13dfd8c0232db/shapefile?layers=2"
				},
				{
					"@type": "dcat:Distribution",
					"title": "GeoJSON",
					"format": "GeoJSON",
					"mediaType": "application/vnd.geo+json",
					"accessURL": "https://www.pacificgeoportal.com/api/download/v1/items/8f5deec9956e4a8cb1f13dfd8c0232db/geojson?layers=2"
				},
				{
					"@type": "dcat:Distribution",
					"title": "KML",
					"format": "KML",
					"mediaType": "application/vnd.google-earth.kml+xml",
					"accessURL": "https://www.pacificgeoportal.com/api/download/v1/items/8f5deec9956e4a8cb1f13dfd8c0232db/kml?layers=2"
				}
			],
			"theme": [
				"geospatial"
			]
		},
		{
			"@type": "dcat:Dataset",
			"identifier": "https://www.arcgis.com/home/item.html?id=8f5deec9956e4a8cb1f13dfd8c0232db&sublayer=3",
			"landingPage": "https://www.pacificgeoportal.com/datasets/esri2::9-month-spi",
			"title": "9-month SPI",
			"description": "<div><a target='_blank' href='https://www.fao.org/land-water/water/drought/en/' rel='nofollow ugc noopener noreferrer'>Droughts</a> are natural occurring events in which dry conditions persist over time. Droughts are complex to characterize because they depend on water and energy balances at different temporal and spatial scales. The <a target='_blank' href='https://climatedataguide.ucar.edu/climate-data/standardized-precipitation-index-spi' rel='nofollow ugc noopener noreferrer'>Standardized Precipitation Index (SPI)</a> is used to analyze meteorological droughts. SPI estimates the deviation of precipitation from the long-term probability function at <a target='_blank' href='https://www.in.gov/dnr/water/water-availability-use-rights/water-resource-updates/monthly-water-resource-summary/explanation-of-standard-precipitation-index-spi/' rel='nofollow ugc noopener noreferrer'>different time scales</a> (e.g. 1, 3, 6, 9, or 12 months). SPI only uses monthly precipitation as an input, which can be helpful for characterizing meteorological droughts. Other variables should be included (e.g. temperature or evapotranspiration) in the characterization of other types of droughts (e.g. agricultural droughts).</div><div>&nbsp;</div><div>This layer shows the SPI index at different temporal periods calculated using the SPEI library in R and precipitation data from CHIRPS data set.</div><div>&nbsp;</div><div>Read more in our blogs:&nbsp;</div><ul><li><div><a target='_blank' href='https://www.esri.com/arcgis-blog/products/arcgis-living-atlas/water/water-conflicts-in-international-rivers' rel='nofollow ugc noopener noreferrer'>Water Conflicts in International Rivers</a></div></li><li><div><a target='_blank' href='https://www.esri.com/arcgis-blog/products/arcgis-living-atlas/mapping/mapping-drought-trends-in-the-u-s' rel='nofollow ugc noopener noreferrer'>Mapping Drought Trends in the U.S.</a></div></li></ul><div>&nbsp;</div><div><strong>Sources:</strong></div><div><ul><li><a target='_blank' href='https://www.chc.ucsb.edu/data' rel='nofollow ugc noopener noreferrer'>Climate Hazards Center InfraRed Precipitation with Station data (CHIRPS)</a></li><li><a target='_blank' href='https://spei.csic.es/index.html' rel='nofollow ugc noopener noreferrer'>SPEI R library</a></li></ul></div>",
			"keyword": [
				"Drought",
				"Precipitation",
				"Environment",
				"Standardized Precipitation Index",
				"SPI",
				"Live Feeds",
				"livefeeds2"
			],
			"issued": "2020-07-07T19:28:02.000Z",
			"modified": "2026-09-01T17:44:52.221Z",
			"publisher": {
				"name": "Esri"
			},
			"contactPoint": {
				"@type": "vcard:Contact",
				"fn": "esri_livefeeds2",
				"hasEmail": "{{orgContactEmail}}"
			},
			"accessLevel": "public",
			"spatial": "-180.0000,-50.0000,-179.9057,49.9360",
			"license": "<img src='https://downloads.esri.com/blogs/arcgisonline/esrilogo_new.png' /> This work is licensed under the Esri Master License Agreement.<br /><div><a href='https://goto.arcgis.com/termsofuse/viewsummary' target='_blank' rel='nofollow ugc noopener noreferrer'><b>View Summary</b></a> | <a href='https://goto.arcgis.com/termsofuse/viewtermsofuse' target='_blank' rel='nofollow ugc noopener noreferrer'><b>View Terms of Use</b></a></div>",
			"distribution": [
				{
					"@type": "dcat:Distribution",
					"title": "ArcGIS Hub Dataset",
					"format": "Web Page",
					"mediaType": "text/html",
					"accessURL": "https://www.pacificgeoportal.com/datasets/esri2::9-month-spi"
				},
				{
					"@type": "dcat:Distribution",
					"title": "ArcGIS GeoService",
					"format": "ArcGIS GeoServices REST API",
					"mediaType": "application/json",
					"accessURL": "https://services9.arcgis.com/RHVPKKiFTONKtxq3/arcgis/rest/services/SPI_recent/FeatureServer/3"
				},
				{
					"@type": "dcat:Distribution",
					"title": "CSV",
					"format": "CSV",
					"mediaType": "text/csv",
					"accessURL": "https://www.pacificgeoportal.com/api/download/v1/items/8f5deec9956e4a8cb1f13dfd8c0232db/csv?layers=3"
				},
				{
					"@type": "dcat:Distribution",
					"title": "Shapefile",
					"format": "ZIP",
					"mediaType": "application/zip",
					"accessURL": "https://www.pacificgeoportal.com/api/download/v1/items/8f5deec9956e4a8cb1f13dfd8c0232db/shapefile?layers=3"
				},
				{
					"@type": "dcat:Distribution",
					"title": "GeoJSON",
					"format": "GeoJSON",
					"mediaType": "application/vnd.geo+json",
					"accessURL": "https://www.pacificgeoportal.com/api/download/v1/items/8f5deec9956e4a8cb1f13dfd8c0232db/geojson?layers=3"
				},
				{
					"@type": "dcat:Distribution",
					"title": "KML",
					"format": "KML",
					"mediaType": "application/vnd.google-earth.kml+xml",
					"accessURL": "https://www.pacificgeoportal.com/api/download/v1/items/8f5deec9956e4a8cb1f13dfd8c0232db/kml?layers=3"
				}
			],
			"theme": [
				"geospatial"
			]
		},
		{
			"@type": "dcat:Dataset",
			"identifier": "https://www.arcgis.com/home/item.html?id=8f5deec9956e4a8cb1f13dfd8c0232db&sublayer=4",
			"landingPage": "https://www.pacificgeoportal.com/datasets/esri2::12-month-spi",
			"title": "12-month SPI",
			"description": "<div><a target='_blank' href='https://www.fao.org/land-water/water/drought/en/' rel='nofollow ugc noopener noreferrer'>Droughts</a> are natural occurring events in which dry conditions persist over time. Droughts are complex to characterize because they depend on water and energy balances at different temporal and spatial scales. The <a target='_blank' href='https://climatedataguide.ucar.edu/climate-data/standardized-precipitation-index-spi' rel='nofollow ugc noopener noreferrer'>Standardized Precipitation Index (SPI)</a> is used to analyze meteorological droughts. SPI estimates the deviation of precipitation from the long-term probability function at <a target='_blank' href='https://www.in.gov/dnr/water/water-availability-use-rights/water-resource-updates/monthly-water-resource-summary/explanation-of-standard-precipitation-index-spi/' rel='nofollow ugc noopener noreferrer'>different time scales</a> (e.g. 1, 3, 6, 9, or 12 months). SPI only uses monthly precipitation as an input, which can be helpful for characterizing meteorological droughts. Other variables should be included (e.g. temperature or evapotranspiration) in the characterization of other types of droughts (e.g. agricultural droughts).</div><div>&nbsp;</div><div>This layer shows the SPI index at different temporal periods calculated using the SPEI library in R and precipitation data from CHIRPS data set.</div><div>&nbsp;</div><div>Read more in our blogs:&nbsp;</div><ul><li><div><a target='_blank' href='https://www.esri.com/arcgis-blog/products/arcgis-living-atlas/water/water-conflicts-in-international-rivers' rel='nofollow ugc noopener noreferrer'>Water Conflicts in International Rivers</a></div></li><li><div><a target='_blank' href='https://www.esri.com/arcgis-blog/products/arcgis-living-atlas/mapping/mapping-drought-trends-in-the-u-s' rel='nofollow ugc noopener noreferrer'>Mapping Drought Trends in the U.S.</a></div></li></ul><div>&nbsp;</div><div><strong>Sources:</strong></div><div><ul><li><a target='_blank' href='https://www.chc.ucsb.edu/data' rel='nofollow ugc noopener noreferrer'>Climate Hazards Center InfraRed Precipitation with Station data (CHIRPS)</a></li><li><a target='_blank' href='https://spei.csic.es/index.html' rel='nofollow ugc noopener noreferrer'>SPEI R library</a></li></ul></div>",
			"keyword": [
				"Drought",
				"Precipitation",
				"Environment",
				"Standardized Precipitation Index",
				"SPI",
				"Live Feeds",
				"livefeeds2"
			],
			"issued": "2020-07-07T19:28:02.000Z",
			"modified": "2026-09-01T17:44:52.221Z",
			"publisher": {
				"name": "Esri"
			},
			"contactPoint": {
				"@type": "vcard:Contact",
				"fn": "esri_livefeeds2",
				"hasEmail": "{{orgContactEmail}}"
			},
			"accessLevel": "public",
			"spatial": "-180.0000,-50.0000,-179.9057,49.9360",
			"license": "<img src='https://downloads.esri.com/blogs/arcgisonline/esrilogo_new.png' /> This work is licensed under the Esri Master License Agreement.<br /><div><a href='https://goto.arcgis.com/termsofuse/viewsummary' target='_blank' rel='nofollow ugc noopener noreferrer'><b>View Summary</b></a> | <a href='https://goto.arcgis.com/termsofuse/viewtermsofuse' target='_blank' rel='nofollow ugc noopener noreferrer'><b>View Terms of Use</b></a></div>",
			"distribution": [
				{
					"@type": "dcat:Distribution",
					"title": "ArcGIS Hub Dataset",
					"format": "Web Page",
					"mediaType": "text/html",
					"accessURL": "https://www.pacificgeoportal.com/datasets/esri2::12-month-spi"
				},
				{
					"@type": "dcat:Distribution",
					"title": "ArcGIS GeoService",
					"format": "ArcGIS GeoServices REST API",
					"mediaType": "application/json",
					"accessURL": "https://services9.arcgis.com/RHVPKKiFTONKtxq3/arcgis/rest/services/SPI_recent/FeatureServer/4"
				},
				{
					"@type": "dcat:Distribution",
					"title": "CSV",
					"format": "CSV",
					"mediaType": "text/csv",
					"accessURL": "https://www.pacificgeoportal.com/api/download/v1/items/8f5deec9956e4a8cb1f13dfd8c0232db/csv?layers=4"
				},
				{
					"@type": "dcat:Distribution",
					"title": "Shapefile",
					"format": "ZIP",
					"mediaType": "application/zip",
					"accessURL": "https://www.pacificgeoportal.com/api/download/v1/items/8f5deec9956e4a8cb1f13dfd8c0232db/shapefile?layers=4"
				},
				{
					"@type": "dcat:Distribution",
					"title": "GeoJSON",
					"format": "GeoJSON",
					"mediaType": "application/vnd.geo+json",
					"accessURL": "https://www.pacificgeoportal.com/api/download/v1/items/8f5deec9956e4a8cb1f13dfd8c0232db/geojson?layers=4"
				},
				{
					"@type": "dcat:Distribution",
					"title": "KML",
					"format": "KML",
					"mediaType": "application/vnd.google-earth.kml+xml",
					"accessURL": "https://www.pacificgeoportal.com/api/download/v1/items/8f5deec9956e4a8cb1f13dfd8c0232db/kml?layers=4"
				}
			],
			"theme": [
				"geospatial"
			]
		},
		{
			"@type": "dcat:Dataset",
			"identifier": "https://www.arcgis.com/home/item.html?id=9e2f2b544c954fda9cd13b7f3e6eebce",
			"landingPage": "https://www.pacificgeoportal.com/maps/esri2::recent-earthquakes",
			"title": "Recent Earthquakes",
			"description": "<div>In addition to displaying earthquakes by magnitude, this service also provide earthquake impact details. Impact is measured by population as well as models for economic and fatality loss. For more details, see: <a target='_blank' href='https://earthquake.usgs.gov/earthquakes/pager' rel='nofollow ugc noopener noreferrer'><strong>PAGER Alerts</strong></a>.&nbsp;<br />&nbsp;</div><div><p><strong>Consumption Best Practices:</strong></p><ul><li>As a service that is subject to very high usage, ensure peak performance and accessibility of your maps and apps by avoiding the use of non-cache-able relative Date/Time field filters. To accommodate filtering events by Date/Time, we suggest using the included \"Age\" fields that maintain the number of days or hours since a record was created or last modified, compared to the last service update. These queries fully support the ability to cache a response, allowing common query results to be efficiently provided to users in a high demand service environment.</li><li>When ingesting this service in your applications, avoid using <a target='_blank' href='https://en.wikipedia.org/wiki/POST_(HTTP)' rel='nofollow ugc noopener noreferrer'><strong>POST</strong></a> requests whenever possible. These requests can compromise performance and scalability during periods of high usage because they too are not cache-able.</li></ul><p>&nbsp;</p></div><p><strong>Update Frequency: </strong>Events are updated as frequently as every 5 minutes and are available up to 30 days with the following exceptions:</p><ul><li>Events with a Magnitude LESS than 4.5 are retained for 7 days</li><li>Events with a Significance value, \"sig\" field, of 600 or higher are retained for 90 days</li></ul><p>&nbsp;</p><p>In addition to event points, ShakeMaps are also provided. These have been dissolved by Shake Intensity to reduce the Layer Complexity.<br /><br />The specific layers provided in this service have been Time Enabled and include:</p><ul><li><strong>Events by Magnitude:</strong> The event’s seismic magnitude value.<ul><li><strong>Contains PAGER Alert Level:</strong> USGS PAGER (Prompt Assessment of Global Earthquakes for Response) system provides an automated impact level assignment that estimates fatality and economic loss.</li><li><strong>Contains Significance Level:</strong> An event’s significance is determined by factors like magnitude, max MMI, ‘felt’ reports, and estimated impact.</li></ul></li><li><strong>Shake Intensity:</strong> The Instrumental Intensity or Modified Mercalli Intensity (MMI) for available events.</li></ul><div>&nbsp;</div><div>For field terms and technical details, see: <a target='_blank' href='https://earthquake.usgs.gov/data/comcat/data-eventterms.php' rel='nofollow ugc noopener noreferrer'><strong>ComCat Documentation</strong></a></div><div>&nbsp;</div><div><span style='font-size:x-large;'>Alternate Symbologies</span></div><div><ul><li>Visit the <a target='_blank' href='https://www.arcgis.com/home/item.html?id=5b564bbefa2c482982de7f092dc4f9c9' rel='nofollow ugc noopener noreferrer'><strong>Classic USGS Feature Layer</strong></a> item for a Rainbow view of Shakemap features.</li></ul><p>Read more in our blog: <a target='_blank' href='https://www.esri.com/arcgis-blog/products/arcgis-living-atlas/mapping/earthquake-mapping-in-real-time-for-everyone' rel='nofollow ugc noopener noreferrer'>Live Earthquake Mapping for Everyone</a>.</p><div><span style='font-size:x-large;'>Revisions</span></div><div><ul><li><strong>Dec 22, 2025</strong>: Added ‘Hours Old’ field to Shake Intensity layer.</li><li><strong>Sep 16, 2025</strong>: Exposed ‘UniqueId’ field in Shake Intensity Polygon layer.</li><li><strong>Sep 14, 2025</strong>: Upgrade to Layer data update workflow, to improve reliability and scalability.</li><li><strong>Aug 14, 2024</strong>: Added a default Minimum scale suppression of 1:6,000,000 on Shake Intensity layer.&nbsp;</li><li><strong>Jul 11, 2024</strong>: Updated event popup, setting \"Tsunami Warning\" text to \"Alert Possible\" when flag is present. Also included hyperlink to tsunami warning center.&nbsp;</li><li><strong>Feb 13, 2024</strong>: Updated feed logic to remove Superseded events</li></ul><p>&nbsp;</p></div></div><div><p><span style='color:rgb(128,128,128);'><i>This map is provided for informational purposes and is not monitored 24/7 for accuracy and currency. Always refer to&nbsp;</i></span><a target='_blank' href='https://www.usgs.gov/natural-hazards/earthquake-hazards/earthquakes' rel='nofollow ugc noopener noreferrer'><span style='color:rgb(128,128,128);'><i><strong>USGS</strong></i></span></a><span style='color:rgb(128,128,128);'><i> source for official guidance.</i></span></p><div>&nbsp;</div><p>If you would like to be alerted to potential issues or simply see when this Service will update next, please visit our <a target='_blank' href='https://livingatlas.arcgis.com/livefeeds-status/' rel='nofollow ugc noopener noreferrer'><strong>Live Feed Status</strong></a> Page!</p></div>",
			"keyword": [
				"Esri",
				"USGS",
				"Earthquake",
				"Shakemap",
				"PAGER",
				"Live Feed",
				"Live Feeds",
				"earth observations",
				"hazards"
			],
			"issued": "2019-12-14T00:58:08.000Z",
			"modified": "2026-07-21T16:29:17.000Z",
			"publisher": {
				"name": "Esri"
			},
			"contactPoint": {
				"@type": "vcard:Contact",
				"fn": "esri_livefeeds2",
				"hasEmail": "{{orgContactEmail}}"
			},
			"accessLevel": "public",
			"spatial": "-180.0000,-66.7500,180.0000,69.4606",
			"license": "<img alt='' src='https://downloads.esri.com/blogs/arcgisonline/esrilogo_new.png' /> This work is licensed under the Esri Master License Agreement.<br /><div><a href='https://goto.arcgis.com/termsofuse/viewsummary' target='_blank' rel='nofollow ugc noopener noreferrer'><b>View Summary</b></a> | <a href='https://goto.arcgis.com/termsofuse/viewtermsofuse' target='_blank' rel='nofollow ugc noopener noreferrer'><b>View Terms of Use</b></a></div>",
			"distribution": [
				{
					"@type": "dcat:Distribution",
					"title": "ArcGIS Hub Dataset",
					"format": "Web Page",
					"mediaType": "text/html",
					"accessURL": "https://www.pacificgeoportal.com/maps/esri2::recent-earthquakes"
				},
				{
					"@type": "dcat:Distribution",
					"title": "ArcGIS GeoService",
					"format": "ArcGIS GeoServices REST API",
					"mediaType": "application/json",
					"accessURL": "https://services9.arcgis.com/RHVPKKiFTONKtxq3/arcgis/rest/services/USGS_Seismic_Data_v1/FeatureServer"
				}
			],
			"theme": [
				"geospatial"
			]
		},
		{
			"@type": "dcat:Dataset",
			"identifier": "https://www.arcgis.com/home/item.html?id=9e2f2b544c954fda9cd13b7f3e6eebce&sublayer=0",
			"landingPage": "https://www.pacificgeoportal.com/datasets/esri2::events-by-magnitude",
			"title": "Events by Magnitude",
			"description": "<div>In addition to displaying earthquakes by magnitude, this service also provide earthquake impact details. Impact is measured by population as well as models for economic and fatality loss. For more details, see: <a target='_blank' href='https://earthquake.usgs.gov/earthquakes/pager' rel='nofollow ugc noopener noreferrer'><strong>PAGER Alerts</strong></a>.&nbsp;<br />&nbsp;</div><div><p><strong>Consumption Best Practices:</strong></p><ul><li>As a service that is subject to very high usage, ensure peak performance and accessibility of your maps and apps by avoiding the use of non-cache-able relative Date/Time field filters. To accommodate filtering events by Date/Time, we suggest using the included \"Age\" fields that maintain the number of days or hours since a record was created or last modified, compared to the last service update. These queries fully support the ability to cache a response, allowing common query results to be efficiently provided to users in a high demand service environment.</li><li>When ingesting this service in your applications, avoid using <a target='_blank' href='https://en.wikipedia.org/wiki/POST_(HTTP)' rel='nofollow ugc noopener noreferrer'><strong>POST</strong></a> requests whenever possible. These requests can compromise performance and scalability during periods of high usage because they too are not cache-able.</li></ul><p>&nbsp;</p></div><p><strong>Update Frequency: </strong>Events are updated as frequently as every 5 minutes and are available up to 30 days with the following exceptions:</p><ul><li>Events with a Magnitude LESS than 4.5 are retained for 7 days</li><li>Events with a Significance value, \"sig\" field, of 600 or higher are retained for 90 days</li></ul><p>&nbsp;</p><p>In addition to event points, ShakeMaps are also provided. These have been dissolved by Shake Intensity to reduce the Layer Complexity.<br /><br />The specific layers provided in this service have been Time Enabled and include:</p><ul><li><strong>Events by Magnitude:</strong> The event’s seismic magnitude value.<ul><li><strong>Contains PAGER Alert Level:</strong> USGS PAGER (Prompt Assessment of Global Earthquakes for Response) system provides an automated impact level assignment that estimates fatality and economic loss.</li><li><strong>Contains Significance Level:</strong> An event’s significance is determined by factors like magnitude, max MMI, ‘felt’ reports, and estimated impact.</li></ul></li><li><strong>Shake Intensity:</strong> The Instrumental Intensity or Modified Mercalli Intensity (MMI) for available events.</li></ul><div>&nbsp;</div><div>For field terms and technical details, see: <a target='_blank' href='https://earthquake.usgs.gov/data/comcat/data-eventterms.php' rel='nofollow ugc noopener noreferrer'><strong>ComCat Documentation</strong></a></div><div>&nbsp;</div><div><span style='font-size:x-large;'>Alternate Symbologies</span></div><div><ul><li>Visit the <a target='_blank' href='https://www.arcgis.com/home/item.html?id=5b564bbefa2c482982de7f092dc4f9c9' rel='nofollow ugc noopener noreferrer'><strong>Classic USGS Feature Layer</strong></a> item for a Rainbow view of Shakemap features.</li></ul><p>Read more in our blog: <a target='_blank' href='https://www.esri.com/arcgis-blog/products/arcgis-living-atlas/mapping/earthquake-mapping-in-real-time-for-everyone' rel='nofollow ugc noopener noreferrer'>Live Earthquake Mapping for Everyone</a>.</p><div><span style='font-size:x-large;'>Revisions</span></div><div><ul><li><strong>Dec 22, 2025</strong>: Added ‘Hours Old’ field to Shake Intensity layer.</li><li><strong>Sep 16, 2025</strong>: Exposed ‘UniqueId’ field in Shake Intensity Polygon layer.</li><li><strong>Sep 14, 2025</strong>: Upgrade to Layer data update workflow, to improve reliability and scalability.</li><li><strong>Aug 14, 2024</strong>: Added a default Minimum scale suppression of 1:6,000,000 on Shake Intensity layer.&nbsp;</li><li><strong>Jul 11, 2024</strong>: Updated event popup, setting \"Tsunami Warning\" text to \"Alert Possible\" when flag is present. Also included hyperlink to tsunami warning center.&nbsp;</li><li><strong>Feb 13, 2024</strong>: Updated feed logic to remove Superseded events</li></ul><p>&nbsp;</p></div></div><div><p><span style='color:rgb(128,128,128);'><i>This map is provided for informational purposes and is not monitored 24/7 for accuracy and currency. Always refer to&nbsp;</i></span><a target='_blank' href='https://www.usgs.gov/natural-hazards/earthquake-hazards/earthquakes' rel='nofollow ugc noopener noreferrer'><span style='color:rgb(128,128,128);'><i><strong>USGS</strong></i></span></a><span style='color:rgb(128,128,128);'><i> source for official guidance.</i></span></p><div>&nbsp;</div><p>If you would like to be alerted to potential issues or simply see when this Service will update next, please visit our <a target='_blank' href='https://livingatlas.arcgis.com/livefeeds-status/' rel='nofollow ugc noopener noreferrer'><strong>Live Feed Status</strong></a> Page!</p></div>",
			"keyword": [
				"Esri",
				"USGS",
				"Earthquake",
				"Shakemap",
				"PAGER",
				"Live Feed",
				"Live Feeds",
				"earth observations",
				"hazards"
			],
			"issued": "2019-12-14T00:58:08.000Z",
			"modified": "2026-11-11T10:36:05.568Z",
			"publisher": {
				"name": "Esri"
			},
			"contactPoint": {
				"@type": "vcard:Contact",
				"fn": "esri_livefeeds2",
				"hasEmail": "{{orgContactEmail}}"
			},
			"accessLevel": "public",
			"spatial": "-179.7507,-65.0219,179.8605,69.4606",
			"license": "<img alt='' src='https://downloads.esri.com/blogs/arcgisonline/esrilogo_new.png' /> This work is licensed under the Esri Master License Agreement.<br /><div><a href='https://goto.arcgis.com/termsofuse/viewsummary' target='_blank' rel='nofollow ugc noopener noreferrer'><b>View Summary</b></a> | <a href='https://goto.arcgis.com/termsofuse/viewtermsofuse' target='_blank' rel='nofollow ugc noopener noreferrer'><b>View Terms of Use</b></a></div>",
			"distribution": [
				{
					"@type": "dcat:Distribution",
					"title": "ArcGIS Hub Dataset",
					"format": "Web Page",
					"mediaType": "text/html",
					"accessURL": "https://www.pacificgeoportal.com/datasets/esri2::events-by-magnitude"
				},
				{
					"@type": "dcat:Distribution",
					"title": "ArcGIS GeoService",
					"format": "ArcGIS GeoServices REST API",
					"mediaType": "application/json",
					"accessURL": "https://services9.arcgis.com/RHVPKKiFTONKtxq3/arcgis/rest/services/USGS_Seismic_Data_v1/FeatureServer/0"
				},
				{
					"@type": "dcat:Distribution",
					"title": "CSV",
					"format": "CSV",
					"mediaType": "text/csv",
					"accessURL": "https://www.pacificgeoportal.com/api/download/v1/items/9e2f2b544c954fda9cd13b7f3e6eebce/csv?layers=0"
				},
				{
					"@type": "dcat:Distribution",
					"title": "Shapefile",
					"format": "ZIP",
					"mediaType": "application/zip",
					"accessURL": "https://www.pacificgeoportal.com/api/download/v1/items/9e2f2b544c954fda9cd13b7f3e6eebce/shapefile?layers=0"
				},
				{
					"@type": "dcat:Distribution",
					"title": "GeoJSON",
					"format": "GeoJSON",
					"mediaType": "application/vnd.geo+json",
					"accessURL": "https://www.pacificgeoportal.com/api/download/v1/items/9e2f2b544c954fda9cd13b7f3e6eebce/geojson?layers=0"
				},
				{
					"@type": "dcat:Distribution",
					"title": "KML",
					"format": "KML",
					"mediaType": "application/vnd.google-earth.kml+xml",
					"accessURL": "https://www.pacificgeoportal.com/api/download/v1/items/9e2f2b544c954fda9cd13b7f3e6eebce/kml?layers=0"
				},
				{
					"@type": "dcat:Distribution",
					"title": "File Geodatabase",
					"format": "ZIP",
					"mediaType": "application/zip",
					"accessURL": "https://www.pacificgeoportal.com/api/download/v1/items/9e2f2b544c954fda9cd13b7f3e6eebce/filegdb?layers=0"
				},
				{
					"@type": "dcat:Distribution",
					"title": "Feature Collection",
					"format": "TXT",
					"mediaType": "text/plain",
					"accessURL": "https://www.pacificgeoportal.com/api/download/v1/items/9e2f2b544c954fda9cd13b7f3e6eebce/featureCollection?layers=0"
				},
				{
					"@type": "dcat:Distribution",
					"title": "Excel",
					"format": "XLSX",
					"mediaType": "application/vnd.ms-excel",
					"accessURL": "https://www.pacificgeoportal.com/api/download/v1/items/9e2f2b544c954fda9cd13b7f3e6eebce/excel?layers=0"
				},
				{
					"@type": "dcat:Distribution",
					"title": "GeoPackage",
					"format": "GPKG",
					"mediaType": "application/geopackage+sqlite3",
					"accessURL": "https://www.pacificgeoportal.com/api/download/v1/items/9e2f2b544c954fda9cd13b7f3e6eebce/geoPackage?layers=0"
				},
				{
					"@type": "dcat:Distribution",
					"title": "SQLite Geodatabase",
					"format": "GDB",
					"mediaType": "application/geopackage+sqlite3",
					"accessURL": "https://www.pacificgeoportal.com/api/download/v1/items/9e2f2b544c954fda9cd13b7f3e6eebce/sqlite?layers=0"
				}
			],
			"theme": [
				"geospatial"
			]
		},
		{
			"@type": "dcat:Dataset",
			"identifier": "https://www.arcgis.com/home/item.html?id=9e2f2b544c954fda9cd13b7f3e6eebce&sublayer=1",
			"landingPage": "https://www.pacificgeoportal.com/datasets/esri2::shake-intensity-1",
			"title": "Shake Intensity",
			"description": "<div>In addition to displaying earthquakes by magnitude, this service also provide earthquake impact details. Impact is measured by population as well as models for economic and fatality loss. For more details, see: <a target='_blank' href='https://earthquake.usgs.gov/earthquakes/pager' rel='nofollow ugc noopener noreferrer'><strong>PAGER Alerts</strong></a>.&nbsp;<br />&nbsp;</div><div><p><strong>Consumption Best Practices:</strong></p><ul><li>As a service that is subject to very high usage, ensure peak performance and accessibility of your maps and apps by avoiding the use of non-cache-able relative Date/Time field filters. To accommodate filtering events by Date/Time, we suggest using the included \"Age\" fields that maintain the number of days or hours since a record was created or last modified, compared to the last service update. These queries fully support the ability to cache a response, allowing common query results to be efficiently provided to users in a high demand service environment.</li><li>When ingesting this service in your applications, avoid using <a target='_blank' href='https://en.wikipedia.org/wiki/POST_(HTTP)' rel='nofollow ugc noopener noreferrer'><strong>POST</strong></a> requests whenever possible. These requests can compromise performance and scalability during periods of high usage because they too are not cache-able.</li></ul><p>&nbsp;</p></div><p><strong>Update Frequency: </strong>Events are updated as frequently as every 5 minutes and are available up to 30 days with the following exceptions:</p><ul><li>Events with a Magnitude LESS than 4.5 are retained for 7 days</li><li>Events with a Significance value, \"sig\" field, of 600 or higher are retained for 90 days</li></ul><p>&nbsp;</p><p>In addition to event points, ShakeMaps are also provided. These have been dissolved by Shake Intensity to reduce the Layer Complexity.<br /><br />The specific layers provided in this service have been Time Enabled and include:</p><ul><li><strong>Events by Magnitude:</strong> The event’s seismic magnitude value.<ul><li><strong>Contains PAGER Alert Level:</strong> USGS PAGER (Prompt Assessment of Global Earthquakes for Response) system provides an automated impact level assignment that estimates fatality and economic loss.</li><li><strong>Contains Significance Level:</strong> An event’s significance is determined by factors like magnitude, max MMI, ‘felt’ reports, and estimated impact.</li></ul></li><li><strong>Shake Intensity:</strong> The Instrumental Intensity or Modified Mercalli Intensity (MMI) for available events.</li></ul><div>&nbsp;</div><div>For field terms and technical details, see: <a target='_blank' href='https://earthquake.usgs.gov/data/comcat/data-eventterms.php' rel='nofollow ugc noopener noreferrer'><strong>ComCat Documentation</strong></a></div><div>&nbsp;</div><div><span style='font-size:x-large;'>Alternate Symbologies</span></div><div><ul><li>Visit the <a target='_blank' href='https://www.arcgis.com/home/item.html?id=5b564bbefa2c482982de7f092dc4f9c9' rel='nofollow ugc noopener noreferrer'><strong>Classic USGS Feature Layer</strong></a> item for a Rainbow view of Shakemap features.</li></ul><p>Read more in our blog: <a target='_blank' href='https://www.esri.com/arcgis-blog/products/arcgis-living-atlas/mapping/earthquake-mapping-in-real-time-for-everyone' rel='nofollow ugc noopener noreferrer'>Live Earthquake Mapping for Everyone</a>.</p><div><span style='font-size:x-large;'>Revisions</span></div><div><ul><li><strong>Dec 22, 2025</strong>: Added ‘Hours Old’ field to Shake Intensity layer.</li><li><strong>Sep 16, 2025</strong>: Exposed ‘UniqueId’ field in Shake Intensity Polygon layer.</li><li><strong>Sep 14, 2025</strong>: Upgrade to Layer data update workflow, to improve reliability and scalability.</li><li><strong>Aug 14, 2024</strong>: Added a default Minimum scale suppression of 1:6,000,000 on Shake Intensity layer.&nbsp;</li><li><strong>Jul 11, 2024</strong>: Updated event popup, setting \"Tsunami Warning\" text to \"Alert Possible\" when flag is present. Also included hyperlink to tsunami warning center.&nbsp;</li><li><strong>Feb 13, 2024</strong>: Updated feed logic to remove Superseded events</li></ul><p>&nbsp;</p></div></div><div><p><span style='color:rgb(128,128,128);'><i>This map is provided for informational purposes and is not monitored 24/7 for accuracy and currency. Always refer to&nbsp;</i></span><a target='_blank' href='https://www.usgs.gov/natural-hazards/earthquake-hazards/earthquakes' rel='nofollow ugc noopener noreferrer'><span style='color:rgb(128,128,128);'><i><strong>USGS</strong></i></span></a><span style='color:rgb(128,128,128);'><i> source for official guidance.</i></span></p><div>&nbsp;</div><p>If you would like to be alerted to potential issues or simply see when this Service will update next, please visit our <a target='_blank' href='https://livingatlas.arcgis.com/livefeeds-status/' rel='nofollow ugc noopener noreferrer'><strong>Live Feed Status</strong></a> Page!</p></div>",
			"keyword": [
				"Esri",
				"USGS",
				"Earthquake",
				"Shakemap",
				"PAGER",
				"Live Feed",
				"Live Feeds",
				"earth observations",
				"hazards"
			],
			"issued": "2019-12-14T00:58:08.000Z",
			"modified": "2026-11-11T10:36:05.568Z",
			"publisher": {
				"name": "Esri"
			},
			"contactPoint": {
				"@type": "vcard:Contact",
				"fn": "esri_livefeeds2",
				"hasEmail": "{{orgContactEmail}}"
			},
			"accessLevel": "public",
			"spatial": "-180.0000,-66.7500,180.0000,64.8333",
			"license": "<img alt='' src='https://downloads.esri.com/blogs/arcgisonline/esrilogo_new.png' /> This work is licensed under the Esri Master License Agreement.<br /><div><a href='https://goto.arcgis.com/termsofuse/viewsummary' target='_blank' rel='nofollow ugc noopener noreferrer'><b>View Summary</b></a> | <a href='https://goto.arcgis.com/termsofuse/viewtermsofuse' target='_blank' rel='nofollow ugc noopener noreferrer'><b>View Terms of Use</b></a></div>",
			"distribution": [
				{
					"@type": "dcat:Distribution",
					"title": "ArcGIS Hub Dataset",
					"format": "Web Page",
					"mediaType": "text/html",
					"accessURL": "https://www.pacificgeoportal.com/datasets/esri2::shake-intensity-1"
				},
				{
					"@type": "dcat:Distribution",
					"title": "ArcGIS GeoService",
					"format": "ArcGIS GeoServices REST API",
					"mediaType": "application/json",
					"accessURL": "https://services9.arcgis.com/RHVPKKiFTONKtxq3/arcgis/rest/services/USGS_Seismic_Data_v1/FeatureServer/1"
				},
				{
					"@type": "dcat:Distribution",
					"title": "CSV",
					"format": "CSV",
					"mediaType": "text/csv",
					"accessURL": "https://www.pacificgeoportal.com/api/download/v1/items/9e2f2b544c954fda9cd13b7f3e6eebce/csv?layers=1"
				},
				{
					"@type": "dcat:Distribution",
					"title": "Shapefile",
					"format": "ZIP",
					"mediaType": "application/zip",
					"accessURL": "https://www.pacificgeoportal.com/api/download/v1/items/9e2f2b544c954fda9cd13b7f3e6eebce/shapefile?layers=1"
				},
				{
					"@type": "dcat:Distribution",
					"title": "GeoJSON",
					"format": "GeoJSON",
					"mediaType": "application/vnd.geo+json",
					"accessURL": "https://www.pacificgeoportal.com/api/download/v1/items/9e2f2b544c954fda9cd13b7f3e6eebce/geojson?layers=1"
				},
				{
					"@type": "dcat:Distribution",
					"title": "KML",
					"format": "KML",
					"mediaType": "application/vnd.google-earth.kml+xml",
					"accessURL": "https://www.pacificgeoportal.com/api/download/v1/items/9e2f2b544c954fda9cd13b7f3e6eebce/kml?layers=1"
				},
				{
					"@type": "dcat:Distribution",
					"title": "File Geodatabase",
					"format": "ZIP",
					"mediaType": "application/zip",
					"accessURL": "https://www.pacificgeoportal.com/api/download/v1/items/9e2f2b544c954fda9cd13b7f3e6eebce/filegdb?layers=1"
				},
				{
					"@type": "dcat:Distribution",
					"title": "Feature Collection",
					"format": "TXT",
					"mediaType": "text/plain",
					"accessURL": "https://www.pacificgeoportal.com/api/download/v1/items/9e2f2b544c954fda9cd13b7f3e6eebce/featureCollection?layers=1"
				},
				{
					"@type": "dcat:Distribution",
					"title": "Excel",
					"format": "XLSX",
					"mediaType": "application/vnd.ms-excel",
					"accessURL": "https://www.pacificgeoportal.com/api/download/v1/items/9e2f2b544c954fda9cd13b7f3e6eebce/excel?layers=1"
				},
				{
					"@type": "dcat:Distribution",
					"title": "GeoPackage",
					"format": "GPKG",
					"mediaType": "application/geopackage+sqlite3",
					"accessURL": "https://www.pacificgeoportal.com/api/download/v1/items/9e2f2b544c954fda9cd13b7f3e6eebce/geoPackage?layers=1"
				},
				{
					"@type": "dcat:Distribution",
					"title": "SQLite Geodatabase",
					"format": "GDB",
					"mediaType": "application/geopackage+sqlite3",
					"accessURL": "https://www.pacificgeoportal.com/api/download/v1/items/9e2f2b544c954fda9cd13b7f3e6eebce/sqlite?layers=1"
				}
			],
			"theme": [
				"geospatial"
			]
		},
		{
			"@type": "dcat:Dataset",
			"identifier": "https://www.arcgis.com/home/item.html?id=dece835b488a468788729b78479790d7",
			"landingPage": "https://www.pacificgeoportal.com/content/arcgis-content::urban-density-footprint-in-2020",
			"title": "Urban Density Footprint in 2020",
			"description": "<div>This layer represents an estimate of the footprint of urban settings in 2020. It is intended as a fast-drawing cartographic layer to augment base maps and to focus a map reader's attention on the location of human population. This layer is not intended for analysis. </div><div><br /></div><div>This layer was derived from the 2020 slice of the <a href='https://livingatlas.arcgis.com/en/browse/?q=worldpop%20density#d=2&amp;q=WorldPop%20Density' target='_blank' rel='nofollow ugc noopener noreferrer'>WorldPop Population Density 2000-2020 100m and 1km layers</a>.</div><div><br /></div><div>Also see the <a href='https://arcgis-content.maps.arcgis.com/home/item.html?id=564afc8398874a659e6bd964ce783f1d' target='_blank' rel='nofollow ugc noopener noreferrer'>Populated Footprint layer</a>, which like this layer, is intended to provide a fast-drawing cartographic context for the footprint of total population.<br /></div><div><br /></div><div>The following processing steps were used to produce this layer in ArcGIS Pro:<div><div><br /></div><div>1. <a href='https://pro.arcgis.com/en/pro-app/2.8/tool-reference/spatial-analyst/int.htm' style='color:rgb(0, 121, 193); text-decoration-line:none; font-family:&quot;Avenir Next W01&quot;, &quot;Avenir Next W00&quot;, &quot;Avenir Next&quot;, Avenir, &quot;Helvetica Neue&quot;, sans-serif; font-size:16px;' target='_blank' rel='nofollow ugc noopener noreferrer'>Int tool (Spatial Analyst)</a><span style='font-family:&quot;Avenir Next W01&quot;, &quot;Avenir Next W00&quot;, &quot;Avenir Next&quot;, Avenir, &quot;Helvetica Neue&quot;, sans-serif; font-size:16px;'> to</span> truncate double precision values; all values less than 0.99 become 0.</div><div>2. <a href='https://pro.arcgis.com/en/pro-app/2.8/tool-reference/spatial-analyst/reclassify.htm' style='color:rgb(0, 121, 193); text-decoration-line:none; font-family:&quot;Avenir Next W01&quot;, &quot;Avenir Next W00&quot;, &quot;Avenir Next&quot;, Avenir, &quot;Helvetica Neue&quot;, sans-serif; font-size:16px;' target='_blank' rel='nofollow ugc noopener noreferrer'>Reclassify tool</a><span style='font-family:&quot;Avenir Next W01&quot;, &quot;Avenir Next W00&quot;, &quot;Avenir Next&quot;, Avenir, &quot;Helvetica Neue&quot;, sans-serif; font-size:16px;'> (Spatial Analyst) to</span> set values 0 through 1499 to NoData (Null) and all other values become 1.</div><div>3. <a href='https://pro.arcgis.com/en/pro-app/2.8/tool-reference/data-management/copy-raster.htm' style='color:rgb(0, 121, 193); text-decoration-line:none; font-family:&quot;Avenir Next W01&quot;, &quot;Avenir Next W00&quot;, &quot;Avenir Next&quot;, Avenir, &quot;Helvetica Neue&quot;, sans-serif; font-size:16px;' target='_blank' rel='nofollow ugc noopener noreferrer'>Copy Raster tool</a><span style='font-family:&quot;Avenir Next W01&quot;, &quot;Avenir Next W00&quot;, &quot;Avenir Next&quot;, Avenir, &quot;Helvetica Neue&quot;, sans-serif; font-size:16px;'> with </span>Output Coordinate System environment set to Web Mercator, bit depth to 1 bit, and NoData Value to 0.</div></div></div><div><br /></div><div><div style='font-family:&quot;Avenir Next W01&quot;, &quot;Avenir Next W00&quot;, &quot;Avenir Next&quot;, Avenir, &quot;Helvetica Neue&quot;, sans-serif; font-size:16px;'>Source:</div><div style='font-family:&quot;Avenir Next W01&quot;, &quot;Avenir Next W00&quot;, &quot;Avenir Next&quot;, Avenir, &quot;Helvetica Neue&quot;, sans-serif; font-size:16px;'><ul><li><font style='font-family:inherit;'><span style='font-family:inherit; font-size:16px;'><a href='https://worldpop.maps.arcgis.com/home/item.html?id=c90197b8948948d7b2194e1b03b11d1e' style='color:rgb(0, 121, 193); text-decoration-line:none; font-family:inherit;' target='_blank' rel='nofollow ugc noopener noreferrer'>WorldPop Population Density 2000-2020 100m</a>, which is created from WorldPop (www.worldpop.org - School of Geography and Environmental Science, University of Southampton; Department of Geography and Geosciences, University of Louisville; Departement de Geographie, Universite de Namur) and Center for International Earth Science Information Network (CIESIN), Columbia University (2018). Global High Resolution Population Denominators Project - Funded by The Bill and Melinda Gates Foundation. </span></font>The DOI for the original WorldPop.org total population population data<span style='font-size:16px;'> is </span><a href='https://www.worldpop.org/doi/10.5258/SOTON/WP00645' style='color:rgb(0, 121, 193); text-decoration-line:none; font-size:16px;' target='_blank' rel='nofollow ugc noopener noreferrer'>10.5258/SOTON/WP00645</a><span style='font-size:16px;'>.</span></li></ul></div></div>",
			"keyword": [
				"Population",
				"Population Footprint",
				"Settlement",
				"Human Settlement",
				"Human Footprint"
			],
			"issued": "2022-05-03T22:21:12.000Z",
			"modified": "2026-07-16T16:57:25.000Z",
			"publisher": {
				"name": "ArcGIS Living Atlas Team"
			},
			"contactPoint": {
				"@type": "vcard:Contact",
				"fn": "Cfrye_content",
				"hasEmail": "{{orgContactEmail}}"
			},
			"accessLevel": "public",
			"spatial": "-180.0000,-72.0010,179.9998,83.6287",
			"license": "https://creativecommons.org/licenses/by/4.0",
			"distribution": [
				{
					"@type": "dcat:Distribution",
					"title": "ArcGIS Hub Dataset",
					"format": "Web Page",
					"mediaType": "text/html",
					"accessURL": "https://www.pacificgeoportal.com/content/arcgis-content::urban-density-footprint-in-2020"
				},
				{
					"@type": "dcat:Distribution",
					"title": "ArcGIS GeoService",
					"format": "ArcGIS GeoServices REST API",
					"mediaType": "application/json",
					"accessURL": "https://tiledimageservices.arcgis.com/jIL9msH9OI208GCb/arcgis/rest/services/WP_2020_Urban_1500ppkm2_Footprint_WM/ImageServer"
				}
			],
			"theme": [
				"geospatial"
			]
		},
		{
			"@type": "dcat:Dataset",
			"identifier": "https://www.arcgis.com/home/item.html?id=564afc8398874a659e6bd964ce783f1d",
			"landingPage": "https://www.pacificgeoportal.com/content/arcgis-content::populated-footprint-in-2020",
			"title": "Populated Footprint in 2020",
			"description": "<div>This layer represents an estimate of the footprint of human settlement in 2020. It is intended as a fast-drawing cartographic layer to augment base maps and to focus a map reader's attention on the location of human population. This layer is not intended for analysis.</div><div><br /></div><div>This layer was derived from the 2020 slice of the <a href='https://livingatlas.arcgis.com/en/browse/?q=worldpop%20density#d=2&amp;q=WorldPop%20Density' target='_blank' rel='nofollow ugc noopener noreferrer'>WorldPop Population Density 2000-2020 100m and 1km layers</a>. WorldPop <a href='https://journals.plos.org/plosone/article?id=10.1371%2fjournal.pone.0107042&amp;msclkid=e680f12ec18d11ec9d35ec3fdcf85b40' target='_blank' rel='nofollow ugc noopener noreferrer'>modeled</a> this population footprint based on imagery datasets and population data from national statistical organizations and the United Nations. Zooming in to very large scales will often show discrepancies between reality and this or any model. Like all data sources imagery and population counts are subject to many types of error, thus this gridded footprint contains errors of omission and commission. The imagery base maps available in ArcGIS Online were not used in WorldPop's model. Imagery only informs the model of characteristics that indicate a potential for settlement, and cannot intrinsically indicate whether any or how many people live in a building. </div><div><br /></div><div>Also see the <a href='https://arcgis-content.maps.arcgis.com/home/item.html?id=dece835b488a468788729b78479790d7' target='_blank' rel='nofollow ugc noopener noreferrer'>Urban Density Footprint layer</a>, which like this layer, is intended to provide a fast-drawing cartographic context for urban populations.</div><div><br /></div><div>The following processing steps were used to produce this layer in ArcGIS Pro:<br /></div><div><br /></div><div><div>1. <a href='https://pro.arcgis.com/en/pro-app/2.8/tool-reference/spatial-analyst/int.htm' target='_blank' rel='nofollow ugc noopener noreferrer'>Int tool (Spatial Analyst)</a> to truncate double precision values; all values less than 0.99 become 0.</div><div>2. <a href='https://pro.arcgis.com/en/pro-app/2.8/tool-reference/spatial-analyst/reclassify.htm' target='_blank' rel='nofollow ugc noopener noreferrer'>Reclassify tool</a> (Spatial Analyst) to set values 0 through 14 to NoData (Null) and all other values become <b>1</b>. The figure of 14 was empirically derived as a good balance between reducing errors of commission, i.e., false-positive cells with lower values, while not introducing errors of omission by eliminating obviously populated cells.</div><div>3. <a href='https://pro.arcgis.com/en/pro-app/2.8/tool-reference/data-management/copy-raster.htm' target='_blank' rel='nofollow ugc noopener noreferrer'>Copy Raster tool</a> with Output Coordinate System environment set to Web Mercator, bit depth to 1 bit, and NoData Value to 0.<br /></div><div><br /></div><div>Source:</div><div><ul><li><font face='Avenir Next W01, Avenir Next W00, Avenir Next, Avenir, Helvetica Neue, sans-serif'><span style='font-size:16px;'><a href='https://worldpop.maps.arcgis.com/home/item.html?id=c90197b8948948d7b2194e1b03b11d1e' target='_blank' rel='nofollow ugc noopener noreferrer'>WorldPop Population Density 2000-2020 100m</a>, which is created from WorldPop (www.worldpop.org - School of Geography and Environmental Science, University of Southampton; Department of Geography and Geosciences, University of Louisville; Departement de Geographie, Universite de Namur) and Center for International Earth Science Information Network (CIESIN), Columbia University (2018). Global High Resolution Population Denominators Project - Funded by The Bill and Melinda Gates Foundation. </span></font>The DOI for the original WorldPop.org total population population data<span style='font-family:&quot;Avenir Next W01&quot;, &quot;Avenir Next W00&quot;, &quot;Avenir Next&quot;, Avenir, &quot;Helvetica Neue&quot;, sans-serif; font-size:16px;'> is </span><a href='https://www.worldpop.org/doi/10.5258/SOTON/WP00645' style='color:rgb(0, 121, 193); text-decoration-line:none; font-family:&quot;Avenir Next W01&quot;, &quot;Avenir Next W00&quot;, &quot;Avenir Next&quot;, Avenir, &quot;Helvetica Neue&quot;, sans-serif; font-size:16px;' target='_blank' rel='nofollow ugc noopener noreferrer'>10.5258/SOTON/WP00645</a><span style='font-family:&quot;Avenir Next W01&quot;, &quot;Avenir Next W00&quot;, &quot;Avenir Next&quot;, Avenir, &quot;Helvetica Neue&quot;, sans-serif; font-size:16px;'>.</span></li></ul></div></div>",
			"keyword": [
				"Population",
				"Population Footprint",
				"Settlement",
				"Human Settlement",
				"Human Footprint"
			],
			"issued": "2022-05-04T18:04:17.000Z",
			"modified": "2026-07-16T16:53:34.000Z",
			"publisher": {
				"name": "ArcGIS Living Atlas Team"
			},
			"contactPoint": {
				"@type": "vcard:Contact",
				"fn": "Cfrye_content",
				"hasEmail": "{{orgContactEmail}}"
			},
			"accessLevel": "public",
			"spatial": "-180.0000,-72.0010,179.9998,83.6287",
			"license": "https://creativecommons.org/licenses/by/4.0",
			"distribution": [
				{
					"@type": "dcat:Distribution",
					"title": "ArcGIS Hub Dataset",
					"format": "Web Page",
					"mediaType": "text/html",
					"accessURL": "https://www.pacificgeoportal.com/content/arcgis-content::populated-footprint-in-2020"
				},
				{
					"@type": "dcat:Distribution",
					"title": "ArcGIS GeoService",
					"format": "ArcGIS GeoServices REST API",
					"mediaType": "application/json",
					"accessURL": "https://tiledimageservices.arcgis.com/jIL9msH9OI208GCb/arcgis/rest/services/WP_2020_Populated_Footprint_WM/ImageServer"
				}
			],
			"theme": [
				"geospatial"
			]
		},
		{
			"@type": "dcat:Dataset",
			"identifier": "https://www.arcgis.com/home/item.html?id=c8af9c5411814584b460cc87cb7c3780",
			"landingPage": "https://www.pacificgeoportal.com/apps/esri::latest-earthquake-monitoring-dashboard",
			"title": "Latest Earthquake Monitoring Dashboard",
			"description": "<div>This dashboard monitors the latest earthquake events around the world. It automatically updates when new events come in to show you where they occurred, how significant they were, and if any there were any resulting tsunamis. The real-time&nbsp;<a target='_blank' href='https://www.arcgis.com/home/item.html?id=af7568d8579048f7b42e534891824029' rel='nofollow ugc noopener noreferrer'>earthquake data</a>, provided by the&nbsp;<a target='_blank' href='https://livingatlas.arcgis.com/en/' rel='nofollow ugc noopener noreferrer'>Living Atlas</a>, was used to create a&nbsp;<a target='_blank' href='https://esri.maps.arcgis.com/home/item.html?id=f870515c4d6e4a12b15d6241e4955e68' rel='nofollow ugc noopener noreferrer'>web map</a>&nbsp;that was then used in this dashboard.</div><div>&nbsp;</div><p>To learn about the creation of this dashboard, read the blog:&nbsp;<a target='_blank' href='https://www.esri.com/arcgis-blog/products/ops-dashboard/real-time/making-an-auto-focusing-real-time-dashboard/' rel='nofollow ugc noopener noreferrer'>Making an Auto-Focusing Real-Time Dashboard</a>. Feel free to&nbsp;<a target='_blank' href='https://www.arcgis.com/apps/opsdashboard/index.html#/new?id=c8af9c5411814584b460cc87cb7c3780' rel='nofollow ugc noopener noreferrer'>make a copy</a>&nbsp;and see how it is configured.</p>",
			"keyword": [
				"Earthquakes",
				"Dashboard",
				"Operations Dashboard",
				"Monitoring",
				"Emergency Management",
				"USGS"
			],
			"issued": "2019-02-12T22:36:00.000Z",
			"modified": "2026-07-09T17:44:37.000Z",
			"publisher": {
				"name": "Esri"
			},
			"contactPoint": {
				"@type": "vcard:Contact",
				"fn": "esri_dashboardpub",
				"hasEmail": "{{orgContactEmail}}"
			},
			"accessLevel": "public",
			"spatial": "",
			"license": "<div><a href='https://www.arcgis.com/home/item.html?id=af7568d8579048f7b42e534891824029' target='_blank' rel='nofollow ugc noopener noreferrer'>Earthquake event data</a> is from the USGS, available in ArcGIS <a href='https://livingatlas.arcgis.com/en/' target='_blank' rel='nofollow ugc noopener noreferrer'>Living Atlas</a> of the World.</div>",
			"distribution": [
				{
					"@type": "dcat:Distribution",
					"title": "ArcGIS Hub Dataset",
					"format": "Web Page",
					"mediaType": "text/html",
					"accessURL": "https://www.pacificgeoportal.com/apps/esri::latest-earthquake-monitoring-dashboard"
				}
			],
			"theme": ""
		},
		{
			"@type": "dcat:Dataset",
			"identifier": "https://www.arcgis.com/home/item.html?id=e393da08765940e49e27e30e1df02b58",
			"landingPage": "https://www.pacificgeoportal.com/datasets/esri::world-elevation-gmted",
			"title": "World Elevation GMTED",
			"description": "<div><div>The Global Multi-resolution Terrain Elevation Data 2010 (GMTED2010) dataset provides a 7.5 arcsecond (approximately 250 meter resolution) digital elevation model with world-wide coverage at a resolution suitable for regional to continental scale analyses. </div><div><br /></div><div><font size='4'>Dataset Summary</font></div><div><br /></div><div>This layer provides access to a 250m cell-sized raster created from the <a href='https://topotools.cr.usgs.gov/gmted_viewer/' rel='nofollow ugc' target='_blank'>Global Multi-resolution Terrain Elevation Data 2010</a> 7.5 arcsecond mean elevation product. The dataset represents a compilation and synthesis of 11 different existing raster data sources. The data were published in 2011 by the USGS and the National Geospatial-Intelligence Agency.<br /></div><div><span style='line-height: 16.3636341094971px;'><br /></span></div><div><span style='line-height: 16.3636341094971px;'>The dataset is documented in the publication: </span></div><div><a href='https://pubs.usgs.gov/of/2011/1073/' rel='nofollow ugc' target='_blank'>Danielson and Gesch. 2011. Global Multi-resolution Terrain Elevation Data 2010 (GMTED2010). U.S. Geological Survey Open-File Report 2011–1073, 26 p.</a><br /></div><div><br /></div><div><span style='font-size: large; line-height: 16.7142848968506px;'>What can you do with this layer?</span></div><div><br /></div><div>This layer is suitable for both visualization and analysis. It can be used in ArcGIS Online in web maps and applications and can be used in ArcGIS Desktop.</div><div><br /></div><div><div style='margin: 0px; padding: 0px;'>This layer has <a href='https://resources.arcgis.com/en/help/main/10.2/index.html#//00sp00000007000000' rel='nofollow ugc' target='_blank'>query</a>, <a href='https://resources.arcgis.com/en/help/main/10.2/index.html#//00s500000010000000' rel='nofollow ugc' target='_blank'>identify</a>, and <a href='https://resources.arcgis.com/en/help/main/10.2/index.html#/Downloading_data_from_an_image_service/00sp00000016000000/' rel='nofollow ugc' target='_blank'>export</a> image services available. This layer is restricted to a maximum area of 16,000 x 16,000 pixels - an area 4,000 kilometers on a side or an area approximately the size of Europe. </div><div style='margin: 0px; padding: 0px;'><br /></div><div style='margin: 0px; padding: 0px;'>The source data for this layer are available <a href='https://topotools.cr.usgs.gov/gmted_viewer/' rel='nofollow ugc' target='_blank'>here</a>.</div><div style='margin: 0px; padding: 0px;'><br /></div><div style='margin: 0px; padding: 0px;'><div style='margin: 0px; padding: 0px;'><div style='margin: 0px; padding: 0px;'>This layer is part of a larger collection of <a href='https://www.arcgis.com/home/group.html?owner=esri&amp;title=Landscape%20Layers&amp;start=131&amp;q=' rel='nofollow ugc' target='_blank'>landscape layers</a> that you can use to perform a wide variety of mapping and analysis tasks.</div><div style='margin: 0px; padding: 0px;'><br /></div><div style='margin: 0px; padding: 0px;'>The <a href='https://doc.arcgis.com/en/living-atlas/#s=0&amp;n=0&amp;d=1&amp;col=&amp;fs=0&amp;fn=30&amp;npp=120&amp;subCat=0' rel='nofollow ugc' target='_blank'>Living Atlas of the World</a> provides an easy way to explore the landscape layers and many other beautiful and authoritative maps on hundreds of topics.</div><div style='margin: 0px; padding: 0px;'><br /></div><div style='margin: 0px; padding: 0px;'><div style='font-size: 12.7272720336914px; line-height: 16.7142868041992px; margin: 0px; padding: 0px;'><a href='https://geonet.esri.com' rel='nofollow ugc' target='_blank'>Geonet</a> is a good resource for learning more about landscape layers and the Living Atlas of the World. To get started see the <a href='https://geonet.esri.com/groups/livingatlas?sr=search&amp;searchId=ec0b33d6-14bb-4319-8ad5-38961b68610e&amp;searchIndex=0' rel='nofollow ugc' target='_blank'>Living Atlas Discussion Group</a>.</div><div style='font-size: 12.7272720336914px; line-height: 16.7142868041992px; margin: 0px; padding: 0px;'><br /></div><div style='font-size: 12.7272720336914px; line-height: 16.7142868041992px; margin: 0px; padding: 0px;'>The <a href='https://goto.arcgisonline.com/arcgis/Ecological_Land_Units/RolloutBlog ' rel='nofollow ugc' style='line-height: 1.41428579135817;' target='_blank'>Esri Insider Blog</a> provides an introduction to the Ecophysiographic Mapping project.</div></div></div></div></div></div>",
			"keyword": [
				"landscape6",
				"esri_landscape",
				"landscape",
				"elevation"
			],
			"issued": "2014-12-03T19:05:23.000Z",
			"modified": "2020-08-27T00:00:51.000Z",
			"publisher": {
				"name": "Esri"
			},
			"contactPoint": {
				"@type": "vcard:Contact",
				"fn": "esri_landscape2",
				"hasEmail": "{{orgContactEmail}}"
			},
			"accessLevel": "public",
			"spatial": "-180.0000,-56.0001,179.9999,83.9999",
			"license": "<img alt='' src='https://downloads.esri.com/blogs/arcgisonline/esrilogo_new.png' />This work is licensed under the Esri Master License Agreement. <br /><div><a href='https://goto.arcgis.com/termsofuse/viewsummary' target='_blank' rel='nofollow ugc noopener noreferrer'><b>View Summary</b></a> | <a href='https://goto.arcgis.com/termsofuse/viewtermsofuse' target='_blank' rel='nofollow ugc noopener noreferrer'><b>View Terms of Use</b></a> </div><div><span style='line-height: 16.05px;'><br /></span></div><div><font color='#b22222'>Important Note:</font> This item requires an ArcGIS Online organizational subscription or an ArcGIS Developer account and does not consume credits. To access this item, you'll need to do one of the following: </div><div><ul><li>Sign in with an account that is a member of an organizational subscription </li><li>Sign in with a developer account </li><li><a href='https://goto.arcgis.com/termsofuse/registeranapplication' target='_blank' rel='nofollow ugc noopener noreferrer'>Register an application</a> and use your application's credentials.</li></ul>If you don't have an account, you can sign up for a <a href='https://goto.arcgis.com/features/trial' target='_blank' rel='nofollow ugc noopener noreferrer'>free trial of ArcGIS</a> or a <a href='https://goto.arcgis.com/developers/signup' target='_blank' rel='nofollow ugc noopener noreferrer'>free ArcGIS Developer account</a>.</div>",
			"distribution": [
				{
					"@type": "dcat:Distribution",
					"title": "ArcGIS Hub Dataset",
					"format": "Web Page",
					"mediaType": "text/html",
					"accessURL": "https://www.pacificgeoportal.com/datasets/esri::world-elevation-gmted"
				},
				{
					"@type": "dcat:Distribution",
					"title": "ArcGIS GeoService",
					"format": "ArcGIS GeoServices REST API",
					"mediaType": "application/json",
					"accessURL": "https://landscape6.arcgis.com/arcgis/rest/services/World_Elevation_GMTED/ImageServer"
				}
			],
			"theme": [
				"geospatial"
			]
		},
		{
			"@type": "dcat:Dataset",
			"identifier": "https://www.arcgis.com/home/item.html?id=ddfce15a8ccd4c8c88fb125cb4f23cc9",
			"landingPage": "https://www.pacificgeoportal.com/datasets/esri::world-surface-water",
			"title": "World Surface Water",
			"description": "<div>Water bodies are a key element in the landscape. This layer provides a global map of large water bodies for use in <span style='line-height: 1.38461538461538;'>landscape-scale analysis.</span></div><div><span style='line-height: 1.38461538461538;'><br /></span></div><div><font size='4'>Dataset Summary</font></div><div><br /></div><div>This layer provides access to a 250m cell-sized raster of surface water created by extracting pixels coded as water in the <a href='https://www.arcgis.com/home/item.html?id=53c82af69cae4c1f99902c0e0d456bf8' rel='nofollow ugc' target='_blank'>Global Lithological Map</a> and the <a href='https://www.arcgis.com/home/item.html?id=77864b7ae87a49e7984998e63d768c77' rel='nofollow ugc' target='_blank'>Global Landcover Map</a><span style='background-color: rgb(255, 255, 255);'>. The layer was created by Esri in 2014.</span></div><p><font size='4'>What can you do with this layer?</font></p><p><span style='line-height: 1.38461538461538;'>This layer is suitable for both visualization and analysis. It can be used in ArcGIS Online in web maps and applications and can be used in ArcGIS Desktop.</span><br /></p><div style='margin: 0px; padding: 0px;'>This layer has <a href='https://resources.arcgis.com/en/help/main/10.2/index.html#//00sp00000007000000' rel='nofollow ugc' target='_blank'>query</a>, <a href='https://resources.arcgis.com/en/help/main/10.2/index.html#//00s500000010000000' rel='nofollow ugc' target='_blank'>identify</a>, and <a href='https://resources.arcgis.com/en/help/main/10.2/index.html#/Downloading_data_from_an_image_service/00sp00000016000000/' rel='nofollow ugc' target='_blank'>export</a> image services available. This layer is restricted to a maximum area of 16,000 x 16,000 pixels - an area 4,000 kilometers on a side or an area approximately the size of Europe. </div><div style='margin: 0px; padding: 0px;'><br /></div><div style='margin: 0px; padding: 0px;'><div style='margin: 0px; padding: 0px;'><div><div style='margin: 0px; padding: 0px;'><div style='margin: 0px; padding: 0px;'>This layer is part of a larger collection of <a href='https://www.arcgis.com/home/group.html?owner=esri&amp;title=Landscape%20Layers&amp;start=131&amp;q=' rel='nofollow ugc' target='_blank'>landscape layers</a> that you can use to perform a wide variety of mapping and analysis tasks.</div><div style='margin: 0px; padding: 0px;'><br /></div><div style='margin: 0px; padding: 0px;'>The <a href='https://doc.arcgis.com/en/living-atlas/#s=0&amp;n=0&amp;d=1&amp;col=&amp;fs=0&amp;fn=30&amp;npp=120&amp;subCat=0' rel='nofollow ugc' target='_blank'>Living Atlas of the World</a> provides an easy way to explore the landscape layers and many other beautiful and authoritative maps on hundreds of topics.</div><div style='margin: 0px; padding: 0px;'><br /></div><div style='margin: 0px; padding: 0px;'><div style='margin: 0px; padding: 0px;'><a href='https://geonet.esri.com' rel='nofollow ugc' target='_blank'>Geonet</a> is a good resource for learning more about landscape layers and the Living Atlas of the World. To get started see the <a href='https://geonet.esri.com/groups/livingatlas?sr=search&amp;searchId=ec0b33d6-14bb-4319-8ad5-38961b68610e&amp;searchIndex=0' rel='nofollow ugc' target='_blank'>Living Atlas Discussion Group</a>.</div><div style='margin: 0px; padding: 0px;'><br /></div><div style='margin: 0px; padding: 0px;'>The <a href='https://goto.arcgisonline.com/arcgis/Ecological_Land_Units/RolloutBlog ' rel='nofollow ugc' target='_blank'>Esri Insider Blog</a> provides an introduction to the Ecophysiographic Mapping project.</div></div></div></div></div></div>",
			"keyword": [
				"landscape6",
				"esri_landscape",
				"landscape",
				"water"
			],
			"issued": "2014-12-03T19:05:34.000Z",
			"modified": "2020-08-27T00:01:21.000Z",
			"publisher": {
				"name": "Esri"
			},
			"contactPoint": {
				"@type": "vcard:Contact",
				"fn": "esri_landscape2",
				"hasEmail": "{{orgContactEmail}}"
			},
			"accessLevel": "public",
			"spatial": "-180.0000,-89.0000,180.0000,89.0000",
			"license": "<img alt='' src='https://downloads.esri.com/blogs/arcgisonline/esrilogo_new.png' />This work is licensed under the Esri Master License Agreement. <br /><div><a href='https://goto.arcgis.com/termsofuse/viewsummary' target='_blank' rel='nofollow ugc noopener noreferrer'><b>View Summary</b></a> | <a href='https://goto.arcgis.com/termsofuse/viewtermsofuse' target='_blank' rel='nofollow ugc noopener noreferrer'><b>View Terms of Use</b></a> </div><div><span style='line-height: 16.05px;'><br /></span></div><div><font color='#b22222'>Important Note:</font> This item requires an ArcGIS Online organizational subscription or an ArcGIS Developer account and does not consume credits. To access this item, you'll need to do one of the following: </div><div><ul><li>Sign in with an account that is a member of an organizational subscription </li><li>Sign in with a developer account </li><li><a href='https://goto.arcgis.com/termsofuse/registeranapplication' target='_blank' rel='nofollow ugc noopener noreferrer'>Register an application</a> and use your application's credentials.</li></ul>If you don't have an account, you can sign up for a <a href='https://goto.arcgis.com/features/trial' target='_blank' rel='nofollow ugc noopener noreferrer'>free trial of ArcGIS</a> or a <a href='https://goto.arcgis.com/developers/signup' target='_blank' rel='nofollow ugc noopener noreferrer'>free ArcGIS Developer account</a>.</div>",
			"distribution": [
				{
					"@type": "dcat:Distribution",
					"title": "ArcGIS Hub Dataset",
					"format": "Web Page",
					"mediaType": "text/html",
					"accessURL": "https://www.pacificgeoportal.com/datasets/esri::world-surface-water"
				},
				{
					"@type": "dcat:Distribution",
					"title": "ArcGIS GeoService",
					"format": "ArcGIS GeoServices REST API",
					"mediaType": "application/json",
					"accessURL": "https://landscape6.arcgis.com/arcgis/rest/services/World_Surface_Water/ImageServer"
				}
			],
			"theme": [
				"geospatial"
			]
		},
		{
			"@type": "dcat:Dataset",
			"identifier": "https://www.arcgis.com/home/item.html?id=3a40d6b0035d4f968f2621611a77fe64",
			"landingPage": "https://www.pacificgeoportal.com/maps/3a40d6b0035d4f968f2621611a77fe64",
			"title": "{{name}}",
			"description": "{{description}}",
			"keyword": [
				"esri_oceans",
				"esri_marine",
				"oceans",
				"landscape",
				"esri_landscape",
				"oceans1"
			],
			"issued": "2015-06-30T00:20:59.000Z",
			"modified": "{{modified:toISO}}",
			"publisher": {
				"name": "{{source}}"
			},
			"contactPoint": {
				"@type": "vcard:Contact",
				"fn": "esri_oceans",
				"hasEmail": "{{orgContactEmail}}"
			},
			"accessLevel": "public",
			"spatial": "",
			"license": "<img alt='' src='https://downloads.esri.com/blogs/arcgisonline/esrilogo_new.png' />This work is licensed under the Esri Master License Agreement. <br /><div><a href='https://goto.arcgis.com/termsofuse/viewsummary' target='_blank'><b>View Summary</b></a> | <a href='https://goto.arcgis.com/termsofuse/viewtermsofuse' target='_blank'><b>View Terms of Use</b></a> </div><div><span style='line-height: 16.05px;'><br /></span></div><div><font color='#b22222'>Important Note:</font> This item requires an ArcGIS Online organizational subscription or an ArcGIS Developer account and does not consume credits. To access this item, you'll need to do one of the following: </div><div><ul><li>Sign in with an account that is a member of an organizational subscription </li><li>Sign in with a developer account </li><li><a href='https://goto.arcgis.com/termsofuse/registeranapplication' target='_blank'>Register an application</a> and use your application's credentials.</li></ul>If you don't have an account, you can sign up for a <a href='https://goto.arcgis.com/features/trial' target='_blank'>free trial of ArcGIS</a> or a <a href='https://goto.arcgis.com/developers/signup' target='_blank'>free ArcGIS Developer account</a>.</div>",
			"distribution": [
				{
					"@type": "dcat:Distribution",
					"title": "ArcGIS Hub Dataset",
					"format": "Web Page",
					"mediaType": "text/html",
					"accessURL": "https://www.pacificgeoportal.com/maps/3a40d6b0035d4f968f2621611a77fe64"
				}
			],
			"theme": ""
		},
		{
			"@type": "dcat:Dataset",
			"identifier": "https://www.arcgis.com/home/item.html?id=428539ef9cab4017b69d15a40a9ee98b&sublayer=0",
			"landingPage": "https://www.pacificgeoportal.com/datasets/esri::world-hillshade-dark",
			"title": "World Hillshade (Dark)",
			"description": "<div>Inspired by the legendary Swiss artist, Eduard Imhof, this&nbsp;<a target='_blank' href='https://www.esri.com/arcgis-blog/products/arcgis-living-atlas/mapping/introducing-dark-hillshade/' rel='nofollow ugc noopener noreferrer'>dark multi-directional hillshade map</a>&nbsp;present unparalleled views of the world’s mountains, plateaus, valleys and canyons providing stunning visualization in both high slope and expressionless areas.</div><div>&nbsp;</div><div>This Dark version of our&nbsp;<a target='_blank' href='https://www.arcgis.com/home/item.html?id=1b243539f4514b6ba35e7d995890db1d' rel='nofollow ugc noopener noreferrer'>World Hillshade</a>&nbsp;is especially useful in building maps that provide terrain context while highlighting feature layers and labels.</div><div>&nbsp;</div><div>The map is compiled from a variety of data sources from commercial, community maps and many authoritative organizations across the globe. The basemap has global coverage down to a scale of ~1:72k. In the United States, parts of Europe, Asia and Africa coverage goes down to ~1:9k.&nbsp;</div><div>&nbsp;</div><div>To see the coverage and sources of various datasets comprising this map layer, view the&nbsp;<a target='_blank' href='https://www.arcgis.com/home/item.html?id=3af669838f594b378f90c10f98e46a7f' rel='nofollow ugc noopener noreferrer'>World Elevation Coverage Map</a>. Additionally, this layer uses data from&nbsp;<a target='_blank' href='https://www.arcgis.com/home/item.html?id=2daa50a1091b4395925e816a8bb05ae0' rel='nofollow ugc noopener noreferrer'>Vantor’s Precision 3D</a>&nbsp;Digital Terrain Models for parts of the globe.</div><div>&nbsp;</div>",
			"keyword": [
				"basemap",
				"elevation",
				"Esri Basemaps",
				"Hillshade Dark",
				"esriHillshadedarkRaster",
				"raster",
				"world",
				"multi-directional hillshade",
				"multidirectional",
				"shaded relief",
				"relief shading",
				"terrain"
			],
			"issued": "2019-04-24T19:09:26.000Z",
			"modified": "2026-07-01T02:17:08.000Z",
			"publisher": {
				"name": "Esri"
			},
			"contactPoint": {
				"@type": "vcard:Contact",
				"fn": "esri",
				"hasEmail": "{{orgContactEmail}}"
			},
			"accessLevel": "public",
			"spatial": "-180.0000,-85.0147,180.0000,85.0491",
			"license": "<p><img src='https://downloads.esri.com/blogs/arcgisonline/esrilogo_new.png' /> &nbsp;This work is licensed under the Esri Master License Agreement.</p><div><a target='_blank' href='https://goto.arcgis.com/termsofuse/viewsummary' rel='nofollow ugc noopener noreferrer'><strong>View Summary</strong></a> | <a target='_blank' href='https://goto.arcgis.com/termsofuse/viewtermsofuse' rel='nofollow ugc noopener noreferrer'><strong>View Terms of Use</strong></a></div><div>&nbsp;</div><div><strong>Export:</strong> This layer is not intended to be used to export tiles for offline.&nbsp;</div>",
			"distribution": [
				{
					"@type": "dcat:Distribution",
					"title": "ArcGIS Hub Dataset",
					"format": "Web Page",
					"mediaType": "text/html",
					"accessURL": "https://www.pacificgeoportal.com/datasets/esri::world-hillshade-dark"
				},
				{
					"@type": "dcat:Distribution",
					"title": "ArcGIS GeoService",
					"format": "ArcGIS GeoServices REST API",
					"mediaType": "application/json",
					"accessURL": "https://services.arcgisonline.com/arcgis/rest/services/Elevation/World_Hillshade_Dark/MapServer/0"
				}
			],
			"theme": [
				"geospatial"
			]
		},
		{
			"@type": "dcat:Dataset",
			"identifier": "https://www.arcgis.com/home/item.html?id=1b243539f4514b6ba35e7d995890db1d&sublayer=0",
			"landingPage": "https://www.pacificgeoportal.com/datasets/esri::world-hillshade-1",
			"title": "World Hillshade",
			"description": "<div><div style='display:inherit; max-width:100%; overflow:auto; word-wrap:break-word;'><p style='margin-bottom:1.55rem; margin-top:0px;'>This layer portrays elevation as an artistic hillshade. The map is designed to be used as a backdrop for topographical, soil, hydro, landcover or other outdoor recreational maps. It’s a default relief background in various basemaps such as&nbsp;<a target='_blank' href='https://www.arcgis.com/home/item.html?id=67372ff42cd145319639a99152b15bc3' rel='nofollow ugc noopener noreferrer'>Topographic</a>,&nbsp;<a target='_blank' href='https://www.arcgis.com/home/item.html?id=a52ab98763904006aa382d90e906fdd5' rel='nofollow ugc noopener noreferrer'>Terrain with Labels</a>.</p><p style='margin-bottom:1.55rem; margin-top:0px;'>The map is compiled from a variety of data sources from commercial, community maps and many authoritative organizations across the globe. The basemap has global coverage down to a scale of ~1:72k. In the United States, parts of Europe, Asia and Africa coverage goes down to ~1:9k.&nbsp;</p><p style='margin-bottom:1.55rem; margin-top:0px;'>To see the coverage and sources of various datasets comprising this map layer, view the&nbsp;<a target='_blank' href='https://www.arcgis.com/home/item.html?id=3af669838f594b378f90c10f98e46a7f' rel='nofollow ugc noopener noreferrer'>World Elevation Coverage Map</a>. Additionally, this layer uses data from&nbsp;<a target='_blank' href='https://www.arcgis.com/home/item.html?id=2daa50a1091b4395925e816a8bb05ae0' rel='nofollow ugc noopener noreferrer'>Vantor’s Precision 3D</a>&nbsp;Digital Terrain Models for parts of the globe.</p><p style='margin-bottom:1.55rem; margin-top:0px;'>The map is based on the&nbsp;<a target='_blank' href='https://blogs.esri.com/esri/arcgis/2014/07/14/introducing-esris-next-generation-hillshade/' rel='nofollow ugc noopener noreferrer'>Multi-directional hillshade</a>&nbsp;algorithm.</p></div></div>",
			"keyword": [
				"basemap",
				"elevation",
				"Esri Basemaps",
				"Hillshade",
				"esriHillshadeRaster",
				"raster",
				"world",
				"multi-directional hillshade",
				"multidirectional",
				"shaded relief",
				"relief shading",
				"terrain"
			],
			"issued": "2015-07-09T16:19:18.000Z",
			"modified": "2026-07-01T02:15:48.000Z",
			"publisher": {
				"name": "Esri"
			},
			"contactPoint": {
				"@type": "vcard:Contact",
				"fn": "esri",
				"hasEmail": "{{orgContactEmail}}"
			},
			"accessLevel": "public",
			"spatial": "-180.0000,-85.0147,180.0000,85.0491",
			"license": "<p><img src='https://downloads.esri.com/blogs/arcgisonline/esrilogo_new.png' /> &nbsp;This work is licensed under the Esri Master License Agreement.</p><div><a target='_blank' href='https://goto.arcgis.com/termsofuse/viewsummary' rel='nofollow ugc noopener noreferrer'><strong>View Summary</strong></a>&nbsp;|&nbsp;<a target='_blank' href='https://goto.arcgis.com/termsofuse/viewtermsofuse' rel='nofollow ugc noopener noreferrer'><strong>View Terms of Use</strong></a></div><div>&nbsp;</div><div><strong>Export:</strong> This layer is not intended to be used to export tiles for offline.&nbsp; If you would like to export imagery for offline use in ArcGIS applications, you may use the&nbsp;<a target='_blank' href='https://www.arcgis.com/home/item.html?id=babedc22ebd64a428b77f7119c2591c3' rel='nofollow ugc noopener noreferrer'>World Hillshade (for Export)</a>&nbsp;layer, which is intended for this purpose.</div>",
			"distribution": [
				{
					"@type": "dcat:Distribution",
					"title": "ArcGIS Hub Dataset",
					"format": "Web Page",
					"mediaType": "text/html",
					"accessURL": "https://www.pacificgeoportal.com/datasets/esri::world-hillshade-1"
				},
				{
					"@type": "dcat:Distribution",
					"title": "ArcGIS GeoService",
					"format": "ArcGIS GeoServices REST API",
					"mediaType": "application/json",
					"accessURL": "https://services.arcgisonline.com/arcgis/rest/services/Elevation/World_Hillshade/MapServer/0"
				}
			],
			"theme": [
				"geospatial"
			]
		},
		{
			"@type": "dcat:Dataset",
			"identifier": "https://www.arcgis.com/home/item.html?id=7029fb60158543ad845c7e1527af11e4",
			"landingPage": "https://www.pacificgeoportal.com/datasets/esri::terrain-3d",
			"title": "Terrain 3D",
			"description": "<p style='font-family:&quot;Avenir Next W01&quot;, &quot;Avenir Next W00&quot;, &quot;Avenir Next&quot;, Avenir, &quot;Helvetica Neue&quot;, sans-serif; font-size:16px; margin-bottom:0.75rem; margin-top:0px; max-width:100%;'><span style='display:inherit; max-width:100%;'>The Terrain 3D layer provides global elevation surface to use as a ground in ArcGIS 3D applications.&nbsp;</span></p><p style='font-family:&quot;Avenir Next W01&quot;, &quot;Avenir Next W00&quot;, &quot;Avenir Next&quot;, Avenir, &quot;Helvetica Neue&quot;, sans-serif; font-size:0.9375rem; line-height:1.46; margin-bottom:0.75rem; margin-top:0px;'><span style='font-family:&quot;Avenir Next&quot;, Avenir, &quot;Helvetica Neue&quot;, Helvetica, Arial, sans-serif; font-size:large;'><strong>What can you do with this layer?</strong></span><br />&nbsp;</p><p style='font-family:&quot;Avenir Next W01&quot;, &quot;Avenir Next W00&quot;, &quot;Avenir Next&quot;, Avenir, &quot;Helvetica Neue&quot;, sans-serif; font-size:0.9375rem; line-height:1.46; margin-bottom:0.75rem; margin-top:0px;'><span style='line-height:1.3846;'>Use this layer to visualize your maps and layers in 3D using applications like the Scene Viewer in ArcGIS Online and ArcGIS Pro.</span></p><p><img src='https://esri.maps.arcgis.com/sharing/rest/content/items/009afaaa10734e578c8e0e87c04aa366/data' alt='Terrain 3D Images' /></p><p><span style='font-size:large;'><span style='line-height:24px;'><strong>Show me how</strong></span></span></p><p><span style='line-height:1.3846;'>1) Working with Scenes in ArcGIS Pro or ArcGIS Online Scene Viewer</span></p><p><span style='line-height:1.3846;'>2) Select an appropriate basemap or use your own</span></p><p><span style='line-height:1.3846;'>3) Add your unique 2D and 3D data layers to the scene. Your data are simply added on the elevation. If your data have defined elevation (z coordinates) this information will be honored in the scene</span></p><p><span style='line-height:1.3846;'>4) Share your work as a Web Scene with others in your organization or the public</span></p><p><strong>Dataset Coverage</strong><br />To see the coverage and sources of various datasets comprising this elevation layer, view the <a target='_blank' href='https://www.arcgis.com/home/item.html?id=3af669838f594b378f90c10f98e46a7f' rel='nofollow ugc noopener noreferrer'>World Elevation Coverage Map</a>. Additionally, this layer contains data from <a style='color:rgb(0, 97, 155); font-family:inherit; text-decoration-line:none;' target='_blank' href='https://www.arcgis.com/home/item.html?id=2daa50a1091b4395925e816a8bb05ae0' rel='nofollow ugc noopener noreferrer'>Vantor’s Precision 3D</a> Digital Terrain Models for parts of the globe.</p><div style='margin:0px; padding:0px;'><div style='margin:0px; padding:0px;'>This layer is part of a larger collection of <a target='_blank' href='https://www.arcgis.com/home/group.html?id=bbc5f50839094e9d8dc5255b6a7783dd#overview' rel='nofollow ugc noopener noreferrer'>elevation layers</a>. <span style='line-height:1.3846;'>For more information, see the </span><a style='line-height:1.3846;' target='_blank' href='https://www.arcgis.com/home/group.html?id=bbc5f50839094e9d8dc5255b6a7783dd#overview' rel='nofollow ugc noopener noreferrer'>Elevation Layers</a><span style='line-height:1.3846;'> group on ArcGIS Online.</span></div></div>",
			"keyword": [
				"Terrain",
				"3D",
				"landscape",
				"elevation",
				"elevation3d",
				"basemap",
				"Esri Basemaps",
				"Terrain 3D",
				"esriTerrain3d",
				"world",
				"DEM"
			],
			"issued": "2014-12-08T19:43:25.000Z",
			"modified": "2026-07-01T02:13:42.000Z",
			"publisher": {
				"name": "Esri"
			},
			"contactPoint": {
				"@type": "vcard:Contact",
				"fn": "esri_elevation",
				"hasEmail": "{{orgContactEmail}}"
			},
			"accessLevel": "public",
			"spatial": "-180.0000,-85.0511,180.0000,85.0511",
			"license": "<p><img src='https://downloads.esri.com/blogs/arcgisonline/esrilogo_new.png' /> &nbsp;This work is licensed under the Esri Master License Agreement.</p><div><a target='_blank' href='https://goto.arcgis.com/termsofuse/viewsummary' rel='nofollow ugc noopener noreferrer'><strong>View Summary</strong></a>&nbsp;|&nbsp;<a target='_blank' href='https://goto.arcgis.com/termsofuse/viewtermsofuse' rel='nofollow ugc noopener noreferrer'><strong>View Terms of Use</strong></a></div><div>&nbsp;</div><div><strong>Export:</strong>&nbsp;This layer is not intended to be used to export tiles for offline.&nbsp; If you would like to export imagery for offline use in ArcGIS applications, you may use the&nbsp;<a target='_blank' href='https://www.arcgis.com/home/item.html?id=09ae40dd6766478bb7de3c557c1421cb' rel='nofollow ugc noopener noreferrer'>Terrain 3D (for Export)</a>&nbsp;layer, which is intended for this purpose.</div>",
			"distribution": [
				{
					"@type": "dcat:Distribution",
					"title": "ArcGIS Hub Dataset",
					"format": "Web Page",
					"mediaType": "text/html",
					"accessURL": "https://www.pacificgeoportal.com/datasets/esri::terrain-3d"
				},
				{
					"@type": "dcat:Distribution",
					"title": "ArcGIS GeoService",
					"format": "ArcGIS GeoServices REST API",
					"mediaType": "application/json",
					"accessURL": "https://elevation3d.arcgis.com/arcgis/rest/services/WorldElevation3D/Terrain3D/ImageServer"
				}
			],
			"theme": [
				"geospatial"
			]
		},
		{
			"@type": "dcat:Dataset",
			"identifier": "https://www.arcgis.com/home/item.html?id=99b62cad21e74285b41bf4c1ca9b6922",
			"landingPage": "https://www.pacificgeoportal.com/maps/esri::monthly-evapotranspiration",
			"title": "Monthly Evapotranspiration",
			"description": "<div><div>Most of us understand the hydrologic cycle in terms of the visible paths that water can take such as rainstorms, rivers, waterfalls and lakes. However, an even larger volume of water flows through the air all around us in two invisible paths:&nbsp;evaporation&nbsp;and&nbsp;transpiration. These two paths&nbsp;together are referred to as evapotranpsiration (ET),&nbsp;and&nbsp;claim 61% of all terrestrial precipitation. Solar radiation, air temperature, wind speed, soil moisture, and land cover all affect the rate of evapotranspiration, which is a major driver of the global water cycle, and&nbsp;key component of most catchments' water budget. This map contains a historical record showing the volume of water lost to evapotranspiration during each month from March 2000 to the present (NASA sometimes has a lag of several months in generating the data).&nbsp;</div><div>&nbsp;</div><div><span style='font-size:large;'>Dataset Summary</span></div><div>The GLDAS Evapotranspiration layer is a time-enabled image service that shows total actual evapotranspiration monthly from 2000 to the present, measured in&nbsp;millimeters&nbsp;of water loss. It is calculated by NASA using the&nbsp;Noah&nbsp;land surface model, run at 0.25 degree spatial resolution using&nbsp;satellite&nbsp;and ground-based observational data&nbsp;from the&nbsp;Global Land Data Assimilation System&nbsp;(GLDAS-1). The model is run with 3-hourly time steps and aggregated into monthly averages.&nbsp;</div><div>&nbsp;</div><div><p><span style='font-size:large;'>What can you do with this layer?</span><br />This layer is suitable for both visualization and analysis. It can be used in ArcGIS Online in web maps and applications and can be used in ArcGIS for Desktop. It is&nbsp;useful for scientific modeling, but only at global scales.&nbsp;</p><p><span style='color:#8b0000;'><strong>Time</strong></span>:&nbsp;This is a time-enabled layer. It shows the total evaporative loss during the map's time extent, or if time animation is disabled, a time range can be set using the layer's multidimensional settings. The map shows the sum of all months in the time extent. Minimum temporal resolution is one month; maximum is one year.<br />&nbsp;</p><p><span style='color:#8b0000;'><font style='background-color:rgb(255, 255, 255);'><strong>Important</strong></font></span>:&nbsp;You must switch from the cartographic renderer to the analytic renderer in the&nbsp;processing template tab in the layer properties window&nbsp;before using this layer as an input to geoprocessing tools.<br />&nbsp;</p><div style='margin:0px; padding:0px;'>&nbsp;</div><div style='margin:0px; padding:0px;'><div style='margin:0px; padding:0px;'><div style='margin:0px; padding:0px;'><div>&nbsp;</div></div></div></div></div></div>",
			"keyword": [
				"GLDAS",
				"NOAH",
				"NASA",
				"ET",
				"earth observations"
			],
			"issued": "2014-06-27T03:25:31.000Z",
			"modified": "2026-06-30T14:29:26.000Z",
			"publisher": {
				"name": "Esri"
			},
			"contactPoint": {
				"@type": "vcard:Contact",
				"fn": "esri_observations",
				"hasEmail": "{{orgContactEmail}}"
			},
			"accessLevel": "public",
			"spatial": "-180.0000,-11.3513,21.7453,64.9977",
			"license": "<img alt='' src='https://downloads.esri.com/blogs/arcgisonline/esrilogo_new.png' />This work is licensed under the Esri Master License Agreement. <br /><div><a href='https://goto.arcgis.com/termsofuse/viewsummary' target='_blank'><b>View Summary</b></a> | <a href='https://goto.arcgis.com/termsofuse/viewtermsofuse' target='_blank'><b>View Terms of Use</b></a> </div><div><span style='line-height: 16.05px;'><br /></span></div><div><font color='#b22222'>Important Note:</font> This item requires an ArcGIS Online organizational subscription or an ArcGIS Developer account and does not consume credits. To access this item, you'll need to do one of the following: </div><div><ul><li>Sign in with an account that is a member of an organizational subscription </li><li>Sign in with a developer account </li><li><a href='https://goto.arcgis.com/termsofuse/registeranapplication' target='_blank'>Register an application</a> and use your application's credentials.</li></ul>If you don't have an account, you can sign up for a <a href='https://goto.arcgis.com/features/trial' target='_blank'>free trial of ArcGIS</a> or a <a href='https://goto.arcgis.com/developers/signup' target='_blank'>free ArcGIS Developer account</a>.</div>",
			"distribution": [
				{
					"@type": "dcat:Distribution",
					"title": "ArcGIS Hub Dataset",
					"format": "Web Page",
					"mediaType": "text/html",
					"accessURL": "https://www.pacificgeoportal.com/maps/esri::monthly-evapotranspiration"
				}
			],
			"theme": [
				"geospatial"
			]
		},
		{
			"@type": "dcat:Dataset",
			"identifier": "https://www.arcgis.com/home/item.html?id=37d1241660b34879a7f4b4a19f66356e",
			"landingPage": "https://www.pacificgeoportal.com/maps/esri::monthly-soil-moisture",
			"title": "Monthly Soil Moisture",
			"description": "<p><span>Soils and soil moisture greatly influence the water cycle and have impacts on runoff, flooding and agriculture.&nbsp;Soil type and soil particle composition (sand, clay, silt) affect soil moisture and the ability of the soil to retain water.&nbsp;Soil moisture is also affected by levels of evaporation and plant transpiration, potentially leading to near dryness and eventual drought.</span></p><div><div><div>&nbsp;</div><div>Measuring and monitoring soil moisture can ensure the fitness of your crops and help predict or prepare for flash floods and drought.&nbsp;<span>The GLDAS soil moisture data is useful for modeling these scenarios and others, but only at global scales.&nbsp;</span></div><div>&nbsp;</div><div><div><span style='font-size:large;'><span>Dataset Summary</span></span></div><div><span>The GLDAS Soil Moisture layer is a time-enabled image service that shows average monthly soil moisture from 2000 to the present at four different depth levels.&nbsp;It is calculated by NASA using the&nbsp;</span>Noah&nbsp;land surface model<span>, run at 0.25 degree spatial resolution using&nbsp;satellite&nbsp;and ground-based observational data&nbsp;from the&nbsp;</span>Global Land Data Assimilation System<span>&nbsp;(GLDAS-1). The model is run with 3-hourly time steps and aggregated into monthly averages.&nbsp;</span></div></div></div><div><br />&nbsp;</div><div><p><span style='font-size:large;'>What can you do with this layer?</span><br />This layer is suitable for both visualization and analysis. It can be used in ArcGIS Online in web maps and applications and can be used in ArcGIS Desktop.&nbsp;<span>The GLDAS soil moisture data is useful for modeling, but only at global scales.&nbsp;</span></p><p><span style='color:#8b0000;'><strong>Time:</strong></span><strong>&nbsp;</strong><span>This is a time-enabled layer. It shows the total evaporative loss during the map's time extent, or if time animation is disabled, a time range can be set using the layer's multidimensional settings. The map shows the sum of all months in the time extent. Minimum temporal resolution is one month; maximum is one year.</span><br />&nbsp;</p><p><span style='color:#8b0000;'><strong>Depth:</strong></span><strong>&nbsp;</strong><span style='color:rgb(77,77,77);'>This layer has four depth levels. By default they are summed, but you can view each using the multidimensional filter. You must disable time animation on the layer before using its multidimensional filter. It is also possible to toggle between depth layers using raster functions, accessed through the Image Display tab.</span><br />&nbsp;</p><p><span style='color:#8b0000;'><strong>Important:</strong></span><span>&nbsp;You must switch from the cartographic renderer to the analytic renderer in the&nbsp;</span>processing template tab in the layer properties window<span>&nbsp;before using this layer as an input to geoprocessing tools.</span></p><p>&nbsp;</p></div></div>",
			"keyword": [
				"GLDAS",
				"NASA",
				"Water Content",
				"earth observations",
				"NOAH"
			],
			"issued": "2014-06-26T08:27:38.000Z",
			"modified": "2026-06-30T14:27:51.000Z",
			"publisher": {
				"name": "Esri"
			},
			"contactPoint": {
				"@type": "vcard:Contact",
				"fn": "esri_observations",
				"hasEmail": "{{orgContactEmail}}"
			},
			"accessLevel": "public",
			"spatial": "-87.7505,-36.9824,142.8745,58.2881",
			"license": "<img alt='' src='https://downloads.esri.com/blogs/arcgisonline/esrilogo_new.png' />This work is licensed under the Esri Master License Agreement. <br /><div><a href='https://goto.arcgis.com/termsofuse/viewsummary' target='_blank'><b>View Summary</b></a> | <a href='https://goto.arcgis.com/termsofuse/viewtermsofuse' target='_blank'><b>View Terms of Use</b></a> </div><div><span style='line-height: 16.05px;'><br /></span></div><div><font color='#b22222'>Important Note:</font> This item requires an ArcGIS Online organizational subscription or an ArcGIS Developer account and does not consume credits. To access this item, you'll need to do one of the following: </div><div><ul><li>Sign in with an account that is a member of an organizational subscription </li><li>Sign in with a developer account </li><li><a href='https://goto.arcgis.com/termsofuse/registeranapplication' target='_blank'>Register an application</a> and use your application's credentials.</li></ul>If you don't have an account, you can sign up for a <a href='https://goto.arcgis.com/features/trial' target='_blank'>free trial of ArcGIS</a> or a <a href='https://goto.arcgis.com/developers/signup' target='_blank'>free ArcGIS Developer account</a>.</div>",
			"distribution": [
				{
					"@type": "dcat:Distribution",
					"title": "ArcGIS Hub Dataset",
					"format": "Web Page",
					"mediaType": "text/html",
					"accessURL": "https://www.pacificgeoportal.com/maps/esri::monthly-soil-moisture"
				}
			],
			"theme": [
				"geospatial"
			]
		},
		{
			"@type": "dcat:Dataset",
			"identifier": "https://www.arcgis.com/home/item.html?id=01fa55f171eb48a7ac9c460c0339e6c1",
			"landingPage": "https://www.pacificgeoportal.com/maps/esri::monthly-precipitation",
			"title": "Monthly Precipitation",
			"description": "<div>Precipitation is water released from clouds in the form of rain, sleet, snow, or hail. It is the primary source of recharge to the planet's fresh water supplies. This map contains a historical record showing the volume of precipitation that fell during each month from March 2000 to the present. Snow and hail are reported in terms of snow water equivalent - the amount of water that will be produced when they melt.</div><div><span style='font-size:small;'>&nbsp;</span></div><div><span style='font-size:large;'><span>Dataset Summary</span></span></div><div><span>The GLDAS Precipitation layer is a time-enabled image service that shows average monthly precipitation from 2000 to the present, measured in&nbsp;</span>millimeters<span>. It is calculated by NASA using the&nbsp;</span>Noah&nbsp;land surface model<span>, run at 0.25 degree spatial resolution using&nbsp;satellite&nbsp;and ground-based observational data&nbsp;from the&nbsp;</span>Global Land Data Assimilation System<span>&nbsp;(GLDAS-1). The model is run with 3-hourly time steps and aggregated into monthly averages.&nbsp;</span></div><div><br />&nbsp;</div><div><p><span style='font-size:large;'>What can you do with this layer?</span><br />This layer is suitable for both visualization and analysis. It can be used in ArcGIS Online in web maps and applications and can be used in ArcGIS for Desktop. It is&nbsp;useful for scientific modeling, but only at global scales.</p><p><span style='color:#8b0000;'><strong>Time:&nbsp;</strong></span>This is a time-enabled layer. It shows the total evaporative loss during the map's time extent, or if time animation is disabled, a time range can be set using the layer's multidimensional settings. The map shows the sum of all months in the time extent. Minimum temporal resolution is one month; maximum is one year.</p><p><span style='color:#8b0000;'><strong>Variables:&nbsp;</strong></span>This layer has two variables: rainfall and snowfall. By default the two are summed, but you can view either by itself using the multidimensional filter. You must disable time animation on the layer before using its multidimensional filter.</p><p><span style='color:#8b0000;'><strong>Important:&nbsp;</strong></span>You must switch from the cartographic renderer to the analytic renderer in the&nbsp;processing template tab in the layer properties window&nbsp;before using this layer as an input to geoprocessing tools.</p><div style='margin:0px; padding:0px;'>&nbsp;</div></div>",
			"keyword": [
				"NOAH",
				"NASA",
				"GLDAS",
				"Precip",
				"Rain",
				"Ranfall",
				"snow",
				"Snowfall",
				"earth observations"
			],
			"issued": "2015-06-24T00:55:17.000Z",
			"modified": "2026-06-30T14:27:02.000Z",
			"publisher": {
				"name": "Esri"
			},
			"contactPoint": {
				"@type": "vcard:Contact",
				"fn": "esri_observations",
				"hasEmail": "{{orgContactEmail}}"
			},
			"accessLevel": "public",
			"spatial": "-180.0000,-82.5861,180.0000,88.0753",
			"license": "<img alt='' src='https://downloads.esri.com/blogs/arcgisonline/esrilogo_new.png' />This work is licensed under the Esri Master License Agreement. <br /><div><a href='https://goto.arcgis.com/termsofuse/viewsummary' target='_blank'><b>View Summary</b></a> | <a href='https://goto.arcgis.com/termsofuse/viewtermsofuse' target='_blank'><b>View Terms of Use</b></a> </div><div><span style='line-height: 16.05px;'><br /></span></div><div><font color='#b22222'>Important Note:</font> This item requires an ArcGIS Online organizational subscription or an ArcGIS Developer account and does not consume credits. To access this item, you'll need to do one of the following: </div><div><ul><li>Sign in with an account that is a member of an organizational subscription </li><li>Sign in with a developer account </li><li><a href='https://goto.arcgis.com/termsofuse/registeranapplication' target='_blank'>Register an application</a> and use your application's credentials.</li></ul>If you don't have an account, you can sign up for a <a href='https://goto.arcgis.com/features/trial' target='_blank'>free trial of ArcGIS</a> or a <a href='https://goto.arcgis.com/developers/signup' target='_blank'>free ArcGIS Developer account</a>.</div>",
			"distribution": [
				{
					"@type": "dcat:Distribution",
					"title": "ArcGIS Hub Dataset",
					"format": "Web Page",
					"mediaType": "text/html",
					"accessURL": "https://www.pacificgeoportal.com/maps/esri::monthly-precipitation"
				}
			],
			"theme": [
				"geospatial"
			]
		},
		{
			"@type": "dcat:Dataset",
			"identifier": "https://www.arcgis.com/home/item.html?id=e80b4637b2c84c98a1030cebcdd61941",
			"landingPage": "https://www.pacificgeoportal.com/apps/arcgis-content::recent-global-earthquakes-web-app",
			"title": "Recent Global Earthquakes - Web App",
			"description": "<div><div style='font-family:&quot;Avenir Next W01&quot;, &quot;Avenir Next W00&quot;, &quot;Avenir Next&quot;, Avenir, &quot;Helvetica Neue&quot;, sans-serif; font-size:16px;'><span style='font-family:inherit; font-size:medium;'><font style='font-family:inherit;'><span style='font-variant-east-asian:normal; font-variant-numeric:normal;'>This displays recent earthquake information from the&nbsp;</span></font></span><a style='color:rgb(0, 121, 193); font-family:inherit; text-decoration-line:none;' target='_blank' href='https://earthquake.usgs.gov/data/pager/' rel='nofollow ugc noopener noreferrer'><span style='font-family:inherit; font-size:medium;'><font style='font-family:inherit;'><span style='font-variant-east-asian:normal; font-variant-numeric:normal;'>United States Geological Survey (USGS) Prompt Assessment of Global Earthquakes for Response (PAGER)</span></font></span></a><span style='font-family:inherit; font-size:medium;'><font style='font-family:inherit;'><span style='font-variant-east-asian:normal; font-variant-numeric:normal;'>&nbsp;program.</span></font></span></div><div style='font-family:&quot;Avenir Next W01&quot;, &quot;Avenir Next W00&quot;, &quot;Avenir Next&quot;, Avenir, &quot;Helvetica Neue&quot;, sans-serif; font-size:16px;'><br />&nbsp;</div><div style='font-family:&quot;Avenir Next W01&quot;, &quot;Avenir Next W00&quot;, &quot;Avenir Next&quot;, Avenir, &quot;Helvetica Neue&quot;, sans-serif; font-size:16px;'>In addition to displaying earthquakes by magnitude, this web map also provides earthquake impact details. Impact is measured by population as well as models for economic and fatality loss. For more details, see:&nbsp;<a style='color:rgb(0, 121, 193); text-decoration-line:none;' target='_blank' href='https://earthquake.usgs.gov/earthquakes/pager' rel='nofollow ugc noopener noreferrer'>PAGER Alerts</a>.</div><div style='font-family:&quot;Avenir Next W01&quot;, &quot;Avenir Next W00&quot;, &quot;Avenir Next&quot;, Avenir, &quot;Helvetica Neue&quot;, sans-serif; font-size:16px;'><br />&nbsp;</div><div style='font-family:&quot;Avenir Next W01&quot;, &quot;Avenir Next W00&quot;, &quot;Avenir Next&quot;, Avenir, &quot;Helvetica Neue&quot;, sans-serif; font-size:16px;'><p><span style='font-size:medium;'><font style='font-family:inherit;'>Events are updated as frequently as every 5 minutes and are available up to 30 days with the following exceptions:</font></span><br />&nbsp;</p><ul><li><span style='font-size:medium;'><font style='font-family:inherit;'>Events with a Magnitude LESS than 3.0 are retained for 3 days</font></span></li><li><span style='font-size:medium;'><font style='font-family:inherit;'>Events with a Magnitude LESS than 4.5 are retained for 7 days</font></span></li></ul><p><span style='font-size:medium;'><font style='font-family:inherit;'>In addition to event points, ShakeMaps are also provided. These have been dissolved by Shake Intensity to reduce the Layer Complexity.</font></span><br /><br /><span style='font-size:medium;'><font style='font-family:inherit;'>The specific layers provided in this service have been Time Enabled and include:</font></span></p><ul><li><span style='font-size:medium;'><font style='font-family:inherit;'><strong>Events by Magnitude:</strong>&nbsp;The event’s seismic magnitude value.</font></span><ul><li><span style='font-size:medium;'><font style='font-family:inherit;'><strong>Contains PAGER Alert Level:</strong>&nbsp;USGS PAGER (Prompt Assessment of Global Earthquakes for Response) system provides an automated impact level assignment that estimates fatality and economic loss.</font></span></li><li><span style='font-size:medium;'><font style='font-family:inherit;'><strong>Contains Significance Level:</strong>&nbsp;An event’s significance is determined by factors like magnitude, max MMI, ‘felt’ reports, and estimated impact.</font></span></li></ul></li><li><span style='font-size:medium;'><font style='font-family:inherit;'><strong>Shake Intensity:</strong>&nbsp;The Instrumental Intensity or Modified Mercalli Intensity (MMI) for available events.</font></span></li></ul><div><span style='font-size:medium;'><font style='font-family:inherit;'>For field terms and technical details, see:&nbsp;</font></span><a style='color:rgb(0, 121, 193); font-family:inherit; text-decoration-line:none;' target='_blank' href='https://earthquake.usgs.gov/data/comcat/data-eventterms.php' rel='nofollow ugc noopener noreferrer'><span style='font-size:medium;'><font style='font-family:inherit;'>ComCat Documentation</font></span></a></div><div><br />&nbsp;</div><div><span style='color:#000000; font-family:inherit; font-size:medium;'><font style='font-family:inherit;'>This map is provided for informational purposes and is not monitored 24/7 for accuracy and currency. Always refer to&nbsp;</font></span><a style='color:rgb(0, 121, 193); font-family:inherit; text-decoration-line:none;' target='_blank' href='https://www.usgs.gov/natural-hazards/earthquake-hazards/earthquakes' rel='nofollow ugc noopener noreferrer'><span style='font-family:inherit; font-size:medium;'><font style='font-family:inherit;'>USGS</font></span></a><span style='color:#000000; font-family:inherit; font-size:medium;'><font style='font-family:inherit;'>&nbsp;source for official guidance.</font></span></div></div></div><div><br />&nbsp;</div><div><span style='font-size:x-large;'>How to Use this Web App</span></div><div>&nbsp;</div><div><span style='font-size:17.3333px;'>This web app can be used for public information, awareness, and visualization of global earthquakes as a standalone map or embedded in ArcGIS Online apps and dashboards. Map pop-ups contain detailed event information which individually link to each event’s USGS page.</span></div><div>&nbsp;</div><div><span style='font-size:17.3333px;'>The web map for this app is&nbsp;</span><a target='_blank' href='https://www.arcgis.com/home/item.html?id=4ffc6bbde7bd4c27a7286331a90b48e3' rel='nofollow ugc noopener noreferrer'>here</a><span style='font-size:17.3333px;'>.</span></div><div>&nbsp;</div><div><span style='font-size:17.3333px;'>There are two articles that walk through this app in greater detail:</span></div><div>&nbsp;</div><div><a target='_blank' href='https://www.esri.com/arcgis-blog/products/arcgis-living-atlas/mapping/one-symbol-from-multiple-fields-in-arcade/' rel='nofollow ugc noopener noreferrer'>Earthquake Mapping Part I: One Symbol from Multiple Fields in Arcade</a></div><div><a target='_blank' href='https://www.esri.com/arcgis-blog/products/arcgis-living-atlas/mapping/the-cartography-of-time-magnitude-and-alert-levels/' rel='nofollow ugc noopener noreferrer'>Earthquake Mapping Part II: The Cartography of Time, Magnitude, and Alert Levels</a></div><div>&nbsp;</div><div><span style='font-size:17.3333px;'>All events are derived from the same point data and are classified by an event’s Time (Past 24 hours, Past Week, and Past 3 Months), Magnitude (&gt; 4.0 Richter Magnitude), and PAGER Alert Level.</span></div><div>&nbsp;</div><div><span style='font-size:17.3333px;'>This specific layers provided in this web map include:</span></div><div><div><p style='font-family:&quot;Avenir Next&quot;, Avenir, &quot;Helvetica Neue&quot;, Helvetica, Arial, sans-serif; font-size:15px; margin-bottom:0pt; margin-top:0pt;'><br />&nbsp;</p><div><span style='font-variant-east-asian:normal; font-variant-numeric:normal;'><img src='https://www.esri.com/arcgis-blog/wp-content/uploads/2019/02/eem_18_earthquakes192.jpg' /></span></div><p style='font-family:&quot;Avenir Next&quot;, Avenir, &quot;Helvetica Neue&quot;, Helvetica, Arial, sans-serif; font-size:15px; margin-bottom:0pt; margin-top:0pt;'><br />&nbsp;</p><p style='font-family:&quot;Avenir Next&quot;, Avenir, &quot;Helvetica Neue&quot;, Helvetica, Arial, sans-serif; font-size:15px; margin-bottom:0pt; margin-top:0pt;'><span style='font-family:Arial; font-size:13pt;'><span style='font-variant-east-asian:normal; font-variant-numeric:normal;'>Light Basemap</span></span></p><p style='font-family:&quot;Avenir Next&quot;, Avenir, &quot;Helvetica Neue&quot;, Helvetica, Arial, sans-serif; font-size:15px; margin-bottom:0pt; margin-top:0pt;'><br />&nbsp;</p><p style='font-family:&quot;Avenir Next&quot;, Avenir, &quot;Helvetica Neue&quot;, Helvetica, Arial, sans-serif; font-size:15px; margin-bottom:0pt; margin-top:0pt;'><span style='font-family:Arial; font-size:13pt;'><span style='font-variant-east-asian:normal; font-variant-numeric:normal;'><img src='https://www.esri.com/arcgis-blog/wp-content/uploads/2019/02/eem_18_earthquakes_215.jpg' /></span></span><br />&nbsp;</p><p style='font-family:&quot;Avenir Next&quot;, Avenir, &quot;Helvetica Neue&quot;, Helvetica, Arial, sans-serif; font-size:15px; margin-bottom:0pt; margin-top:0pt;'>&nbsp;</p><p><span style='font-variant-east-asian:normal; font-variant-numeric:normal;'>Dark Basemap</span><br />&nbsp;</p><p style='font-family:&quot;Avenir Next&quot;, Avenir, &quot;Helvetica Neue&quot;, Helvetica, Arial, sans-serif; font-size:15px; margin-bottom:0pt; margin-top:0pt;'>&nbsp;</p><p style='font-family:&quot;Avenir Next&quot;, Avenir, &quot;Helvetica Neue&quot;, Helvetica, Arial, sans-serif; font-size:15px; margin-bottom:0pt; margin-top:0pt;'><span style='font-variant-east-asian:normal; font-variant-numeric:normal;'><img src='https://www.esri.com/arcgis-blog/wp-content/uploads/2019/02/eem_18_earthquakes_216.jpg' /></span></p><p style='font-family:&quot;Avenir Next&quot;, Avenir, &quot;Helvetica Neue&quot;, Helvetica, Arial, sans-serif; font-size:15px; margin-bottom:0pt; margin-top:0pt;'>&nbsp;</p><p style='margin-bottom:0pt; margin-top:0pt;'><span style='font-variant-east-asian:normal; font-variant-numeric:normal;'>The shakemaps have been dissolved by a unique value and ordered so that the most intense shaking appears on top. This is achieved by using&nbsp;</span><a target='_blank' href='https://resources.arcgis.com/en/help/main/10.2/index.html#//00s500000039000000' rel='nofollow ugc noopener noreferrer'><span style='font-variant-east-asian:normal; font-variant-numeric:normal;'>symbol level drawing</span></a><span style='font-variant-east-asian:normal; font-variant-numeric:normal;'>.</span></p><p style='margin-bottom:0pt; margin-top:0pt;'>&nbsp;</p><p style='margin-bottom:0pt; margin-top:0pt;'><span style='font-variant-east-asian:normal; font-variant-numeric:normal;'>Shake Map</span></p><div style='font-family:&quot;Avenir Next&quot;, Avenir, &quot;Helvetica Neue&quot;, Helvetica, Arial, sans-serif; font-size:15px;'><p style='margin-bottom:0pt; margin-top:0pt;'><br />&nbsp;</p><p style='margin-bottom:0pt; margin-top:0pt;'><span style='background-color:#ffffff; color:#4c4c4c; font-family:Arial; font-size:13pt;'><span style='font-style:normal; font-variant-east-asian:normal; font-variant-numeric:normal; font-variant:normal; font-weight:400; text-decoration:none;'><img src='https://www.esri.com/arcgis-blog/wp-content/uploads/2019/02/eem_18_earthquakes213.jpg' /></span></span><br />&nbsp;</p></div></div></div>",
			"keyword": [
				"Earthquake",
				"earth observations",
				"USGS",
				"Living Atlas",
				"Live Feed",
				"Esri",
				"Authoritative"
			],
			"issued": "2019-01-29T19:53:57.000Z",
			"modified": "2026-06-24T19:30:06.000Z",
			"publisher": {
				"name": "ArcGIS Living Atlas Team"
			},
			"contactPoint": {
				"@type": "vcard:Contact",
				"fn": "EMeriam",
				"hasEmail": "{{orgContactEmail}}"
			},
			"accessLevel": "public",
			"spatial": "-180.0000,-83.6769,180.0000,84.5360",
			"license": "<p><img src='https://downloads.esri.com/blogs/arcgisonline/esrilogo_new.png' width='113' height='39' /> &nbsp;This work is licensed under the Esri Master License Agreement</p><p><a target='_blank' href='https://goto.arcgis.com/termsofuse/viewsummary' rel='nofollow ugc noopener noreferrer'><strong>View Summary</strong></a> | <a target='_blank' href='https://goto.arcgis.com/termsofuse/viewtermsofuse' rel='nofollow ugc noopener noreferrer'><strong>View Terms of Use</strong></a></p>",
			"distribution": [
				{
					"@type": "dcat:Distribution",
					"title": "ArcGIS Hub Dataset",
					"format": "Web Page",
					"mediaType": "text/html",
					"accessURL": "https://www.pacificgeoportal.com/apps/arcgis-content::recent-global-earthquakes-web-app"
				},
				{
					"@type": "dcat:Distribution",
					"title": "ArcGIS GeoService",
					"format": "ArcGIS GeoServices REST API",
					"mediaType": "application/json",
					"accessURL": "https://www.arcgis.com/apps/webappviewer/index.html?id=e80b4637b2c84c98a1030cebcdd61941"
				}
			],
			"theme": [
				"geospatial"
			]
		},
		{
			"@type": "dcat:Dataset",
			"identifier": "https://www.arcgis.com/home/item.html?id=8d47b1f2ccf141bbab8b73f5f8acc979",
			"landingPage": "https://www.pacificgeoportal.com/apps/esri::world-imagery-wayback-app",
			"title": "World Imagery Wayback App",
			"description": "<div><div>Wayback imagery is a digital archive of the World Imagery basemap, enabling users to access more than 100 different versions of World Imagery archived over the past 10 years. Each record in the archive represents a version of World Imagery as it existed on the date it was published.<br /></div><div><br /></div>This app offers a dynamic Wayback browsing and discovery experience where previous versions of the World Imagery basemap are presented within the map, along a timeline, and as a list. Versions that resulted in local changes are dynamically presented to the user based on location and scale. Preview changes by hovering over and/or selecting individual layers.  When ready, one or more Wayback layers can be added to an export queue and pushed to a new ArcGIS Online web map. Browse, preview, select, and create, it’s all there!<div><br /></div><div>For more information on Wayback check out <a href='https://www.esri.com/arcgis-blog/?s=#Wayback' target='_blank' rel='nofollow ugc noopener noreferrer'>these articles</a>.</div><div><br /></div><div>You can also find every Wayback tile layer in the <a href='https://esri.maps.arcgis.com/home/group.html?id=0f3189e1d1414edfad860b697b7d8311#overview' target='_blank' rel='nofollow ugc noopener noreferrer'>Wayback imagery group</a>.<br /><div><br /></div></div></div>",
			"keyword": [
				"world",
				"wayback",
				"imagery",
				"community",
				"satellite",
				"aerial",
				"basemap"
			],
			"issued": "2018-06-29T23:38:25.000Z",
			"modified": "2026-06-23T16:13:08.000Z",
			"publisher": {
				"name": "Esri"
			},
			"contactPoint": {
				"@type": "vcard:Contact",
				"fn": "esri_imagery",
				"hasEmail": "{{orgContactEmail}}"
			},
			"accessLevel": "public",
			"spatial": "-180.0000,-85.0511,180.0000,85.0511",
			"license": "<img alt='' src='https://downloads.esri.com/blogs/arcgisonline/esrilogo_new.png' /> This work is licensed under the Esri Master License Agreement.<br /><div><a href='https://goto.arcgis.com/termsofuse/viewsummary' target='_blank'><b>View Summary</b></a> | <b><a href='https://goto.arcgis.com/termsofuse/viewtermsofuse' target='_blank'>View Terms of Use</a></b></div><div><br /></div><div><b>Data Collection and Editing:</b> The layers may be used in various ArcGIS apps to support data collection and editing, with the results used internally or shared with others, as described for these <a href='https://www.arcgis.com/home/item.html?id=8e90a00a0a6845a49262e0b756f57a10' target='_blank'>use cases</a>.<br /></div>",
			"distribution": [
				{
					"@type": "dcat:Distribution",
					"title": "ArcGIS Hub Dataset",
					"format": "Web Page",
					"mediaType": "text/html",
					"accessURL": "https://www.pacificgeoportal.com/apps/esri::world-imagery-wayback-app"
				},
				{
					"@type": "dcat:Distribution",
					"title": "ArcGIS GeoService",
					"format": "ArcGIS GeoServices REST API",
					"mediaType": "application/json",
					"accessURL": "https://livingatlas.arcgis.com/wayback/"
				}
			],
			"theme": [
				"geospatial"
			]
		},
		{
			"@type": "dcat:Dataset",
			"identifier": "https://www.arcgis.com/home/item.html?id=4e681ff69e0e4b90866bb6a2e03db24a",
			"landingPage": "https://www.pacificgeoportal.com/maps/4e681ff69e0e4b90866bb6a2e03db24a",
			"title": "{{name}}",
			"description": "{{description}}",
			"keyword": [
				"NOAA",
				"satellite",
				"weather",
				"disaster",
				"earth observations",
				"GOES",
				"Himawari",
				"infrared",
				"imagery"
			],
			"issued": "2019-06-26T18:23:39.000Z",
			"modified": "{{modified:toISO}}",
			"publisher": {
				"name": "{{source}}"
			},
			"contactPoint": {
				"@type": "vcard:Contact",
				"fn": "VizLab_noaa",
				"hasEmail": "{{orgContactEmail}}"
			},
			"accessLevel": "public",
			"spatial": "",
			"license": "Public domain <p>These data were produced by NOAA and are not subject to copyright protection in the United States. NOAA waives any potential copyright and related rights in these data worldwide through the Creative Commons Zero 1.0 Universal Public Domain Dedication (CC0 1.0)</p><a style='display:inline-block;' target='_blank' href='https://creativecommons.org/publicdomain/zero/1.0?ref=chooser-v1' rel='nofollow ugc noopener noreferrer'>CC0 1.0 Universal<img style='height:22px!important; margin-left:3px;' src='https://mirrors.creativecommons.org/presskit/icons/cc.svg?ref=chooser-v1' /><img style='height:22px!important; margin-left:3px;' src='https://mirrors.creativecommons.org/presskit/icons/zero.svg?ref=chooser-v1' /></a>",
			"distribution": [
				{
					"@type": "dcat:Distribution",
					"title": "ArcGIS Hub Dataset",
					"format": "Web Page",
					"mediaType": "text/html",
					"accessURL": "https://www.pacificgeoportal.com/maps/4e681ff69e0e4b90866bb6a2e03db24a"
				}
			],
			"theme": ""
		},
		{
			"@type": "dcat:Dataset",
			"identifier": "https://www.arcgis.com/home/item.html?id=8e93e0f942ae4d54a8d089e3cd5d2774",
			"landingPage": "https://www.pacificgeoportal.com/maps/8e93e0f942ae4d54a8d089e3cd5d2774",
			"title": "{{name}}",
			"description": "{{description}}",
			"keyword": [
				"NOAA",
				"satellite",
				"weather",
				"disaster",
				"earth observations",
				"GOES",
				"Himawari",
				"infrared",
				"imagery"
			],
			"issued": "2019-06-26T18:24:55.000Z",
			"modified": "{{modified:toISO}}",
			"publisher": {
				"name": "{{source}}"
			},
			"contactPoint": {
				"@type": "vcard:Contact",
				"fn": "VizLab_noaa",
				"hasEmail": "{{orgContactEmail}}"
			},
			"accessLevel": "public",
			"spatial": "",
			"license": "Public domain <p>These data were produced by NOAA and are not subject to copyright protection in the United States. NOAA waives any potential copyright and related rights in these data worldwide through the Creative Commons Zero 1.0 Universal Public Domain Dedication (CC0 1.0)</p><a style='display:inline-block;' target='_blank' href='https://creativecommons.org/publicdomain/zero/1.0?ref=chooser-v1' rel='nofollow ugc noopener noreferrer'>CC0 1.0 Universal<img style='height:22px!important; margin-left:3px;' src='https://mirrors.creativecommons.org/presskit/icons/cc.svg?ref=chooser-v1' /><img style='height:22px!important; margin-left:3px;' src='https://mirrors.creativecommons.org/presskit/icons/zero.svg?ref=chooser-v1' /></a>",
			"distribution": [
				{
					"@type": "dcat:Distribution",
					"title": "ArcGIS Hub Dataset",
					"format": "Web Page",
					"mediaType": "text/html",
					"accessURL": "https://www.pacificgeoportal.com/maps/8e93e0f942ae4d54a8d089e3cd5d2774"
				}
			],
			"theme": ""
		},
		{
			"@type": "dcat:Dataset",
			"identifier": "https://www.arcgis.com/home/item.html?id=b7f3c99dc1df4f0bb40d2e230da205f4&sublayer=0",
			"landingPage": "https://www.pacificgeoportal.com/datasets/esri::latest-shipboard-observations",
			"title": "Latest Shipboard Observations",
			"description": "<p><span style='color:#b22222;'><strong>Retirement Notice:&nbsp;</strong></span><strong>This item is in&nbsp;</strong><a target='_blank' href='https://goto.arcgis.com/lifecycle/content' rel='nofollow ugc noopener noreferrer'><strong>mature support</strong></a><strong>&nbsp;as of June 2026 and will be retired in December 2028.&nbsp;A&nbsp;</strong><a target='_blank' href='https://www.arcgis.com/home/item.html?id=6839c244969241808ce0102a033463cb' rel='nofollow ugc noopener noreferrer'><strong>new version of this item</strong></a><strong>&nbsp;is available for your use.</strong> Esri recommends updating your maps and apps to use the new version.</p><div>Shipboard sensors provide meteorological and oceanographic measurements for the marine environment.&nbsp; This information is made available through the National Data Buoy Center (NDBC) and this layer pulls updates direct from the NDBC hourly (at the top of the hour).&nbsp; The most recent observation data is made available for each of the reporting ships.&nbsp; This layer is time enabled, allowing access to recent historical observation data.</div><div>&nbsp;</div><div>More info:&nbsp;<a target='_blank' href='https://www.ndbc.noaa.gov/' rel='nofollow ugc noopener noreferrer'>https://www.ndbc.noaa.gov/</a></div>",
			"keyword": [
				"esri_oceans",
				"retiring-2028-12"
			],
			"issued": "2021-08-26T17:42:55.000Z",
			"modified": "2026-02-18T21:16:50.589Z",
			"publisher": {
				"name": "Esri"
			},
			"contactPoint": {
				"@type": "vcard:Contact",
				"fn": "esri_oceans",
				"hasEmail": "{{orgContactEmail}}"
			},
			"accessLevel": "public",
			"spatial": "-160.0000,-80.0000,160.0000,80.0000",
			"license": "<p><img src='https://downloads.esri.com/blogs/arcgisonline/esrilogo_new.png' /> &nbsp;This work is licensed under the Esri Master License Agreement.</p><div><a target='_blank' href='https://goto.arcgis.com/termsofuse/viewsummary' rel='nofollow ugc noopener noreferrer'><strong>View Summary</strong></a> | <a target='_blank' href='https://goto.arcgis.com/termsofuse/viewtermsofuse' rel='nofollow ugc noopener noreferrer'><strong>View Terms of Use</strong></a></div>",
			"distribution": [
				{
					"@type": "dcat:Distribution",
					"title": "ArcGIS Hub Dataset",
					"format": "Web Page",
					"mediaType": "text/html",
					"accessURL": "https://www.pacificgeoportal.com/datasets/esri::latest-shipboard-observations"
				},
				{
					"@type": "dcat:Distribution",
					"title": "ArcGIS GeoService",
					"format": "ArcGIS GeoServices REST API",
					"mediaType": "application/json",
					"accessURL": "https://services.arcgis.com/P3ePLMYs2RVChkJx/arcgis/rest/services/Latest_Shipboard_Observations/FeatureServer/0"
				},
				{
					"@type": "dcat:Distribution",
					"title": "CSV",
					"format": "CSV",
					"mediaType": "text/csv",
					"accessURL": "https://www.pacificgeoportal.com/api/download/v1/items/b7f3c99dc1df4f0bb40d2e230da205f4/csv?layers=0"
				},
				{
					"@type": "dcat:Distribution",
					"title": "Shapefile",
					"format": "ZIP",
					"mediaType": "application/zip",
					"accessURL": "https://www.pacificgeoportal.com/api/download/v1/items/b7f3c99dc1df4f0bb40d2e230da205f4/shapefile?layers=0"
				},
				{
					"@type": "dcat:Distribution",
					"title": "GeoJSON",
					"format": "GeoJSON",
					"mediaType": "application/vnd.geo+json",
					"accessURL": "https://www.pacificgeoportal.com/api/download/v1/items/b7f3c99dc1df4f0bb40d2e230da205f4/geojson?layers=0"
				},
				{
					"@type": "dcat:Distribution",
					"title": "KML",
					"format": "KML",
					"mediaType": "application/vnd.google-earth.kml+xml",
					"accessURL": "https://www.pacificgeoportal.com/api/download/v1/items/b7f3c99dc1df4f0bb40d2e230da205f4/kml?layers=0"
				}
			],
			"theme": [
				"geospatial"
			]
		},
		{
			"@type": "dcat:Dataset",
			"identifier": "https://www.arcgis.com/home/item.html?id=cfe52bdf2a76491d86c4f433957f2460&sublayer=0",
			"landingPage": "https://www.pacificgeoportal.com/datasets/LINZ::linz-nz-suburbs-and-localities",
			"title": "LINZ NZ Suburbs and Localities",
			"description": "<p style='box-sizing:border-box; color:rgb(50, 50, 50); font-family:KxMetric, -apple-system, BlinkMacSystemFont, &quot;avenir next&quot;, avenir, helvetica, &quot;helvetica neue&quot;, ubuntu, roboto, noto, &quot;segoe ui&quot;, arial, sans-serif; font-size:16px; letter-spacing:0.1px;'><span style='color:rgb(76, 76, 76); font-family:&quot;Avenir Next W01&quot;, &quot;Avenir Next W00&quot;, &quot;Avenir Next&quot;, Avenir, &quot;Helvetica Neue&quot;, sans-serif; font-weight:700; letter-spacing:normal;'>LINZ Data Service (LDS) Item Page - </span><a href='https://data.linz.govt.nz/layer/113764-nz-suburbs-and-localities/' style='font-family:&quot;Avenir Next&quot;, Avenir, &quot;Helvetica Neue&quot;, Helvetica, Arial, sans-serif; font-size:15px;' rel='nofollow ugc'>NZ Suburbs and Localities | LINZ Data Service</a><br /></p><p style='box-sizing:border-box; color:rgb(50, 50, 50); font-family:KxMetric, -apple-system, BlinkMacSystemFont, &quot;avenir next&quot;, avenir, helvetica, &quot;helvetica neue&quot;, ubuntu, roboto, noto, &quot;segoe ui&quot;, arial, sans-serif; font-size:16px; letter-spacing:0.1px;'>NZ Suburbs and Localities describes the spatial extent and name of communities in urban areas (suburbs) and rural areas (localities) for navigation and location purposes.</p><p style='box-sizing:border-box; color:rgb(50, 50, 50); font-family:KxMetric, -apple-system, BlinkMacSystemFont, &quot;avenir next&quot;, avenir, helvetica, &quot;helvetica neue&quot;, ubuntu, roboto, noto, &quot;segoe ui&quot;, arial, sans-serif; font-size:16px; letter-spacing:0.1px;'>The suburb and locality boundaries cover New Zealand including North Island, South Island, Stewart Island/Rakiura, Chatham Islands, and nearby offshore islands.</p><p style='box-sizing:border-box; color:rgb(50, 50, 50); font-family:KxMetric, -apple-system, BlinkMacSystemFont, &quot;avenir next&quot;, avenir, helvetica, &quot;helvetica neue&quot;, ubuntu, roboto, noto, &quot;segoe ui&quot;, arial, sans-serif; font-size:16px; letter-spacing:0.1px;'>Each suburb and locality is assigned a name, major name, Territorial Authority and, if appropriate, additional in use names. A population estimate is provided for each suburb and locality by Stats NZ.</p><p style='box-sizing:border-box; color:rgb(50, 50, 50); font-family:KxMetric, -apple-system, BlinkMacSystemFont, &quot;avenir next&quot;, avenir, helvetica, &quot;helvetica neue&quot;, ubuntu, roboto, noto, &quot;segoe ui&quot;, arial, sans-serif; font-size:16px; letter-spacing:0.1px;'>For more information please refer to the NZ Suburbs and Localities Guidance documents:</p><p style='box-sizing:border-box; color:rgb(50, 50, 50); font-family:KxMetric, -apple-system, BlinkMacSystemFont, &quot;avenir next&quot;, avenir, helvetica, &quot;helvetica neue&quot;, ubuntu, roboto, noto, &quot;segoe ui&quot;, arial, sans-serif; font-size:16px; letter-spacing:0.1px;'><a href='https://data.linz.govt.nz/document/24593/' style='box-sizing:border-box; background-color:transparent;' rel='nofollow ugc'>Data Dictionary</a><br /><a href='https://www.linz.govt.nz/products-services/data/types-linz-data/suburbs-and-localities-data' style='box-sizing:border-box; background-color:transparent;' rel='nofollow ugc'>Change Request Process</a><br /><a href='https://www.linz.govt.nz/products-services/data/types-linz-data/suburbs-and-localities-data' style='box-sizing:border-box; background-color:transparent;' rel='nofollow ugc'>Change Request Principles, Requirements and Rules</a><br />Changes to NZ Suburbs and Localities can be requested by emailing <a href='mailto:addresses@linz.govt.nz?subject=NZ%20Suburbs%20and%20Localities%20Change%20Request' style='box-sizing:border-box; background-color:transparent;' rel='nofollow ugc'>addresses@linz.govt.nz</a></p>",
			"keyword": [
				"linz",
				"localities",
				"suburbs",
				"pilot",
				"nz",
				"new zealand",
				"base",
				"data",
				"resilence"
			],
			"issued": "2023-06-19T00:04:52.000Z",
			"modified": "2026-11-02T09:00:17.878Z",
			"publisher": {
				"name": "Land Information New Zealand"
			},
			"contactPoint": {
				"@type": "vcard:Contact",
				"fn": "administrator_LINZ",
				"hasEmail": "mailto:maps@linz.govt.nz"
			},
			"accessLevel": "public",
			"spatial": "-180.0000,-48.0229,180.0000,-33.6710",
			"license": "https://creativecommons.org/licenses/by/4.0",
			"distribution": [
				{
					"@type": "dcat:Distribution",
					"title": "ArcGIS Hub Dataset",
					"format": "Web Page",
					"mediaType": "text/html",
					"accessURL": "https://www.pacificgeoportal.com/datasets/LINZ::linz-nz-suburbs-and-localities"
				},
				{
					"@type": "dcat:Distribution",
					"title": "ArcGIS GeoService",
					"format": "ArcGIS GeoServices REST API",
					"mediaType": "application/json",
					"accessURL": "https://services.arcgis.com/xdsHIIxuCWByZiCB/arcgis/rest/services/LINZ_NZ_Suburbs_and_Localities/FeatureServer/0"
				},
				{
					"@type": "dcat:Distribution",
					"title": "CSV",
					"format": "CSV",
					"mediaType": "text/csv",
					"accessURL": "https://www.pacificgeoportal.com/api/download/v1/items/cfe52bdf2a76491d86c4f433957f2460/csv?layers=0"
				},
				{
					"@type": "dcat:Distribution",
					"title": "Shapefile",
					"format": "ZIP",
					"mediaType": "application/zip",
					"accessURL": "https://www.pacificgeoportal.com/api/download/v1/items/cfe52bdf2a76491d86c4f433957f2460/shapefile?layers=0"
				},
				{
					"@type": "dcat:Distribution",
					"title": "GeoJSON",
					"format": "GeoJSON",
					"mediaType": "application/vnd.geo+json",
					"accessURL": "https://www.pacificgeoportal.com/api/download/v1/items/cfe52bdf2a76491d86c4f433957f2460/geojson?layers=0"
				},
				{
					"@type": "dcat:Distribution",
					"title": "KML",
					"format": "KML",
					"mediaType": "application/vnd.google-earth.kml+xml",
					"accessURL": "https://www.pacificgeoportal.com/api/download/v1/items/cfe52bdf2a76491d86c4f433957f2460/kml?layers=0"
				},
				{
					"@type": "dcat:Distribution",
					"title": "File Geodatabase",
					"format": "ZIP",
					"mediaType": "application/zip",
					"accessURL": "https://www.pacificgeoportal.com/api/download/v1/items/cfe52bdf2a76491d86c4f433957f2460/filegdb?layers=0"
				},
				{
					"@type": "dcat:Distribution",
					"title": "Feature Collection",
					"format": "TXT",
					"mediaType": "text/plain",
					"accessURL": "https://www.pacificgeoportal.com/api/download/v1/items/cfe52bdf2a76491d86c4f433957f2460/featureCollection?layers=0"
				},
				{
					"@type": "dcat:Distribution",
					"title": "Excel",
					"format": "XLSX",
					"mediaType": "application/vnd.ms-excel",
					"accessURL": "https://www.pacificgeoportal.com/api/download/v1/items/cfe52bdf2a76491d86c4f433957f2460/excel?layers=0"
				},
				{
					"@type": "dcat:Distribution",
					"title": "GeoPackage",
					"format": "GPKG",
					"mediaType": "application/geopackage+sqlite3",
					"accessURL": "https://www.pacificgeoportal.com/api/download/v1/items/cfe52bdf2a76491d86c4f433957f2460/geoPackage?layers=0"
				},
				{
					"@type": "dcat:Distribution",
					"title": "SQLite Geodatabase",
					"format": "GDB",
					"mediaType": "application/geopackage+sqlite3",
					"accessURL": "https://www.pacificgeoportal.com/api/download/v1/items/cfe52bdf2a76491d86c4f433957f2460/sqlite?layers=0"
				}
			],
			"theme": [
				"geospatial"
			]
		},
		{
			"@type": "dcat:Dataset",
			"identifier": "https://www.arcgis.com/home/item.html?id=ac80670eb213440ea5899bbf92a04998&sublayer=0",
			"landingPage": "https://www.pacificgeoportal.com/datasets/esri::world-countries",
			"title": "World Countries",
			"description": "<div style='text-align:Left;'><div><div><span>World Countries provides a detailed basemap layer for the countries of the world.&nbsp;</span></div><div>&nbsp;</div><div><span>This layer has been designed to be used as a basemap and includes fields for official names and country codes, along with fields for continent and display. Particularly useful are the fields LAND_TYPE and LAND_RANK that separate polygons based on their size. These fields are helpful for rendering at different scales by providing the ability to turn off small islands that may clutter small-scale (zoomed out) views.</span></div><div>&nbsp;</div><div>The sources of this dataset are Esri, <a target='_blank' href='https://www.garmin.com' rel='nofollow ugc noopener noreferrer'>Garmin International, Inc.</a>, <a target='_blank' href='https://www.cia.gov/the-world-factbook/' rel='nofollow ugc noopener noreferrer'>U.S. Central Intelligence Agency (The World Factbook)</a>, and <a target='_blank' href='https://www.iso.org/publication/PUB500001.html' rel='nofollow ugc noopener noreferrer'>International Organization for Standardization (ISO)</a>.<span>&nbsp;</span></div><div>&nbsp;</div><div><span>This layer was published in October 2024. It is updated every 12-18 months or as significant changes occur.</span><br />&nbsp;</div></div></div>",
			"keyword": [
				"layer",
				"polygon",
				"countries",
				"ISO codes",
				"names",
				"international boundaries",
				"borders",
				"coastlines",
				"boundaries",
				"society",
				"World",
				"2019",
				"2021",
				"2022",
				"2023",
				"2024"
			],
			"issued": "2013-06-29T22:19:42.000Z",
			"modified": "2026-06-08T07:10:31.208Z",
			"publisher": {
				"name": "Esri"
			},
			"contactPoint": {
				"@type": "vcard:Contact",
				"fn": "esri_dm",
				"hasEmail": "{{orgContactEmail}}"
			},
			"accessLevel": "public",
			"spatial": "-180.0000,-89.0000,180.0000,83.6655",
			"license": "<div style='text-align:Left;'><div><div><p><img src='https://downloads.esri.com/blogs/arcgisonline/esrilogo_new.png' width='113' height='39' /> This work is licensed under the Esri Master License Agreement.<br />&nbsp;<a target='_blank' href='https://goto.arcgis.com/termsofuse/viewsummary' rel='nofollow ugc noopener noreferrer'><strong>View Summary</strong></a>&nbsp;|&nbsp;<a target='_blank' href='https://goto.arcgis.com/termsofuse/viewtermsofuse' rel='nofollow ugc noopener noreferrer'><strong>View Terms of Use</strong></a></p></div></div></div>",
			"distribution": [
				{
					"@type": "dcat:Distribution",
					"title": "ArcGIS Hub Dataset",
					"format": "Web Page",
					"mediaType": "text/html",
					"accessURL": "https://www.pacificgeoportal.com/datasets/esri::world-countries"
				},
				{
					"@type": "dcat:Distribution",
					"title": "ArcGIS GeoService",
					"format": "ArcGIS GeoServices REST API",
					"mediaType": "application/json",
					"accessURL": "https://services.arcgis.com/P3ePLMYs2RVChkJx/arcgis/rest/services/World_Countries/FeatureServer/0"
				},
				{
					"@type": "dcat:Distribution",
					"title": "CSV",
					"format": "CSV",
					"mediaType": "text/csv",
					"accessURL": "https://www.pacificgeoportal.com/api/download/v1/items/ac80670eb213440ea5899bbf92a04998/csv?layers=0"
				},
				{
					"@type": "dcat:Distribution",
					"title": "Shapefile",
					"format": "ZIP",
					"mediaType": "application/zip",
					"accessURL": "https://www.pacificgeoportal.com/api/download/v1/items/ac80670eb213440ea5899bbf92a04998/shapefile?layers=0"
				},
				{
					"@type": "dcat:Distribution",
					"title": "GeoJSON",
					"format": "GeoJSON",
					"mediaType": "application/vnd.geo+json",
					"accessURL": "https://www.pacificgeoportal.com/api/download/v1/items/ac80670eb213440ea5899bbf92a04998/geojson?layers=0"
				},
				{
					"@type": "dcat:Distribution",
					"title": "KML",
					"format": "KML",
					"mediaType": "application/vnd.google-earth.kml+xml",
					"accessURL": "https://www.pacificgeoportal.com/api/download/v1/items/ac80670eb213440ea5899bbf92a04998/kml?layers=0"
				},
				{
					"@type": "dcat:Distribution",
					"title": "File Geodatabase",
					"format": "ZIP",
					"mediaType": "application/zip",
					"accessURL": "https://www.pacificgeoportal.com/api/download/v1/items/ac80670eb213440ea5899bbf92a04998/filegdb?layers=0"
				},
				{
					"@type": "dcat:Distribution",
					"title": "Feature Collection",
					"format": "TXT",
					"mediaType": "text/plain",
					"accessURL": "https://www.pacificgeoportal.com/api/download/v1/items/ac80670eb213440ea5899bbf92a04998/featureCollection?layers=0"
				},
				{
					"@type": "dcat:Distribution",
					"title": "Excel",
					"format": "XLSX",
					"mediaType": "application/vnd.ms-excel",
					"accessURL": "https://www.pacificgeoportal.com/api/download/v1/items/ac80670eb213440ea5899bbf92a04998/excel?layers=0"
				},
				{
					"@type": "dcat:Distribution",
					"title": "GeoPackage",
					"format": "GPKG",
					"mediaType": "application/geopackage+sqlite3",
					"accessURL": "https://www.pacificgeoportal.com/api/download/v1/items/ac80670eb213440ea5899bbf92a04998/geoPackage?layers=0"
				},
				{
					"@type": "dcat:Distribution",
					"title": "SQLite Geodatabase",
					"format": "GDB",
					"mediaType": "application/geopackage+sqlite3",
					"accessURL": "https://www.pacificgeoportal.com/api/download/v1/items/ac80670eb213440ea5899bbf92a04998/sqlite?layers=0"
				}
			],
			"theme": [
				"geospatial"
			]
		},
		{
			"@type": "dcat:Dataset",
			"identifier": "https://www.arcgis.com/home/item.html?id=2b93b06dc0dc4e809d3c8db5cb96ba69&sublayer=0",
			"landingPage": "https://www.pacificgeoportal.com/datasets/esri::world-countries-generalized",
			"title": "World Countries Generalized",
			"description": "<div style='text-align:Left;'><div><div><p><span>World Countries Generalized provides a generalized basemap layer for the countries of the world. It has fields for official names and country codes. The generalized boundaries improve draw performance and effectiveness at global and continental levels.</span></p><p><span>This layer is best viewed out beyond a maximum scale (zoomed in) of 1:5,000,000.</span></p><p>The sources of this dataset are Esri, <a target='_blank' href='https://www.garmin.com' rel='nofollow ugc noopener noreferrer'>Garmin</a>, and <a target='_blank' href='https://www.cia.gov/the-world-factbook/' rel='nofollow ugc noopener noreferrer'>U.S. Central Intelligence Agency (The World Factbook)</a><span>. It is updated every 12-18 months as country names or significant borders change.</span><br />&nbsp;</p></div></div></div>",
			"keyword": [
				"layer",
				"polygon",
				"countries",
				"ISO codes",
				"names",
				"international boundaries",
				"coastlines",
				"generalized",
				"borders",
				"boundaries",
				"society",
				"World",
				"1993-2008",
				"1994",
				"2010",
				"2007-2013",
				"2013-2014",
				"2015",
				"2019",
				"2022"
			],
			"issued": "2013-09-06T21:21:37.000Z",
			"modified": "2026-06-08T06:45:01.975Z",
			"publisher": {
				"name": "Esri"
			},
			"contactPoint": {
				"@type": "vcard:Contact",
				"fn": "esri_dm",
				"hasEmail": "{{orgContactEmail}}"
			},
			"accessLevel": "public",
			"spatial": "-180.0000,-89.0000,180.0000,83.6236",
			"license": "<div><div><img src='https://downloads.esri.com/blogs/arcgisonline/esrilogo_new.png' /> This work is licensed under the Esri Master License Agreement.<br /><div><a href='https://goto.arcgis.com/termsofuse/viewsummary' target='_blank' rel='nofollow ugc noopener noreferrer'><b>View Summary</b></a> | <b><a href='https://goto.arcgis.com/termsofuse/viewtermsofuse' target='_blank' rel='nofollow ugc noopener noreferrer'>View Terms of Use</a></b></div></div></div>",
			"distribution": [
				{
					"@type": "dcat:Distribution",
					"title": "ArcGIS Hub Dataset",
					"format": "Web Page",
					"mediaType": "text/html",
					"accessURL": "https://www.pacificgeoportal.com/datasets/esri::world-countries-generalized"
				},
				{
					"@type": "dcat:Distribution",
					"title": "ArcGIS GeoService",
					"format": "ArcGIS GeoServices REST API",
					"mediaType": "application/json",
					"accessURL": "https://services.arcgis.com/P3ePLMYs2RVChkJx/arcgis/rest/services/World_Countries_(Generalized)/FeatureServer/0"
				},
				{
					"@type": "dcat:Distribution",
					"title": "CSV",
					"format": "CSV",
					"mediaType": "text/csv",
					"accessURL": "https://www.pacificgeoportal.com/api/download/v1/items/2b93b06dc0dc4e809d3c8db5cb96ba69/csv?layers=0"
				},
				{
					"@type": "dcat:Distribution",
					"title": "Shapefile",
					"format": "ZIP",
					"mediaType": "application/zip",
					"accessURL": "https://www.pacificgeoportal.com/api/download/v1/items/2b93b06dc0dc4e809d3c8db5cb96ba69/shapefile?layers=0"
				},
				{
					"@type": "dcat:Distribution",
					"title": "GeoJSON",
					"format": "GeoJSON",
					"mediaType": "application/vnd.geo+json",
					"accessURL": "https://www.pacificgeoportal.com/api/download/v1/items/2b93b06dc0dc4e809d3c8db5cb96ba69/geojson?layers=0"
				},
				{
					"@type": "dcat:Distribution",
					"title": "KML",
					"format": "KML",
					"mediaType": "application/vnd.google-earth.kml+xml",
					"accessURL": "https://www.pacificgeoportal.com/api/download/v1/items/2b93b06dc0dc4e809d3c8db5cb96ba69/kml?layers=0"
				},
				{
					"@type": "dcat:Distribution",
					"title": "File Geodatabase",
					"format": "ZIP",
					"mediaType": "application/zip",
					"accessURL": "https://www.pacificgeoportal.com/api/download/v1/items/2b93b06dc0dc4e809d3c8db5cb96ba69/filegdb?layers=0"
				},
				{
					"@type": "dcat:Distribution",
					"title": "Feature Collection",
					"format": "TXT",
					"mediaType": "text/plain",
					"accessURL": "https://www.pacificgeoportal.com/api/download/v1/items/2b93b06dc0dc4e809d3c8db5cb96ba69/featureCollection?layers=0"
				},
				{
					"@type": "dcat:Distribution",
					"title": "Excel",
					"format": "XLSX",
					"mediaType": "application/vnd.ms-excel",
					"accessURL": "https://www.pacificgeoportal.com/api/download/v1/items/2b93b06dc0dc4e809d3c8db5cb96ba69/excel?layers=0"
				},
				{
					"@type": "dcat:Distribution",
					"title": "GeoPackage",
					"format": "GPKG",
					"mediaType": "application/geopackage+sqlite3",
					"accessURL": "https://www.pacificgeoportal.com/api/download/v1/items/2b93b06dc0dc4e809d3c8db5cb96ba69/geoPackage?layers=0"
				},
				{
					"@type": "dcat:Distribution",
					"title": "SQLite Geodatabase",
					"format": "GDB",
					"mediaType": "application/geopackage+sqlite3",
					"accessURL": "https://www.pacificgeoportal.com/api/download/v1/items/2b93b06dc0dc4e809d3c8db5cb96ba69/sqlite?layers=0"
				}
			],
			"theme": [
				"geospatial"
			]
		},
		{
			"@type": "dcat:Dataset",
			"identifier": "https://www.arcgis.com/home/item.html?id=861938b2dd3747789c144350048a838c",
			"landingPage": "https://www.pacificgeoportal.com/maps/esri2::global-yearly-temperature-anomaly-1850-present",
			"title": "Global Yearly Temperature Anomaly (1850 - present)",
			"description": "<div><span style='background-color:rgb(255,255,255); color:rgb(178,34,34); font-family:&quot;Avenir Next&quot;, Avenir, &quot;Helvetica Neue&quot;, sans-serif; font-size:15px;'><font style='border:0px solid currentcolor; box-sizing:border-box; font-family:&quot;Avenir Next W01&quot;, &quot;Avenir Next W00&quot;, &quot;Avenir Next&quot;, Avenir, &quot;Helvetica Neue&quot;, sans-serif; font-size:16px; line-height:1.5;'><span style='border:0px solid currentcolor; box-sizing:border-box; font-style:normal; font-variant-caps:normal; font-variant-ligatures:normal; font-weight:400; letter-spacing:normal; line-height:1.5; text-align:left; text-decoration-color:initial; text-decoration-style:initial; text-indent:0px; text-transform:none; word-spacing:0px;'><strong>Mature Support Notice:&nbsp;</strong></span></font></span><span style='background-color:rgb(255,255,255); color:rgb(74,74,74); font-family:&quot;Avenir Next&quot;, Avenir, &quot;Helvetica Neue&quot;, sans-serif; font-size:15px;'><span style='border:0px solid currentcolor; box-sizing:border-box; font-style:normal; font-variant-caps:normal; font-variant-ligatures:normal; font-weight:400; letter-spacing:normal; line-height:1.5; text-align:left; text-decoration-color:initial; text-decoration-style:initial; text-indent:0px; text-transform:none; word-spacing:0px;'><strong>This item is in&nbsp;</strong></span></span><a style='background-color:rgb(255, 255, 255); border:0px solid currentcolor; box-sizing:border-box; color:rgb(0, 97, 155); font-family:&quot;Avenir Next W01&quot;, &quot;Avenir Next W00&quot;, &quot;Avenir Next&quot;, Avenir, &quot;Helvetica Neue&quot;, sans-serif; font-size:16px; font-style:normal; font-variant-caps:normal; font-variant-ligatures:normal; font-weight:400; letter-spacing:normal; line-height:1.5; text-align:left; text-decoration:none; text-indent:0px; text-transform:none; word-spacing:0px;' target='_blank' href='https://goto.arcgis.com/lifecycle/content' rel='nofollow ugc noopener noreferrer'><span style='font-family:inherit; font-size:15px;'><span style='border:0px solid currentcolor; box-sizing:border-box; line-height:1.5;'><strong>mature support</strong></span></span></a><span style='background-color:rgb(255,255,255); color:rgb(74,74,74); font-family:&quot;Avenir Next&quot;, Avenir, &quot;Helvetica Neue&quot;, sans-serif; font-size:15px;'><span style='border:0px solid currentcolor; box-sizing:border-box; font-style:normal; font-variant-caps:normal; font-variant-ligatures:normal; font-weight:400; letter-spacing:normal; line-height:1.5; text-align:left; text-decoration-color:initial; text-decoration-style:initial; text-indent:0px; text-transform:none; word-spacing:0px;'><strong>&nbsp;as of April 2026. </strong>A replacement item has not been identified at this time. Esri recommends updating your maps and apps to phase out use of this item.</span></span></div><div>&nbsp;</div><div>Measurements of surface air and ocean temperature are compiled from around the world each month by NOAA’s National Centers for Environmental Information and are analyzed and compared to the 1971-2000 average temperature for each location. The resulting temperature anomaly (or difference from the average) is shown in this feature service, which includes an archive going back to 1880. The mean of the 12 months each year is displayed here.&nbsp;The 2025 values are the last that will be included and no future updates are planned.&nbsp;</div><div>&nbsp;</div><div>The&nbsp;<a target='_blank' href='https://www.ncei.noaa.gov/products/land-based-station/noaa-global-temp' rel='nofollow ugc noopener noreferrer'>NOAAGlobalTemp dataset</a>&nbsp;is the official U.S. long-term record of global temperature data and is often used to show trends in temperature change around the world. It combines thousands of land-based station measurements from the&nbsp;<a target='_blank' href='https://www.ncei.noaa.gov/products/land-based-station/global-historical-climatology-network-monthly' rel='nofollow ugc noopener noreferrer'>Global Historical Climatology Network</a>&nbsp;(GHCN) along with surface ocean temperature from the&nbsp;<a target='_blank' href='https://www.ncei.noaa.gov/products/extended-reconstructed-sst' rel='nofollow ugc noopener noreferrer'>Extended Reconstructed Sea Surface Temperature</a>&nbsp;(ERSST) analysis. These two datasets are merged into a 5-degree resolution product. A report summary report by NOAA NCEI is available&nbsp;<a target='_blank' href='https://www.ncdc.noaa.gov/sotc/global/' rel='nofollow ugc noopener noreferrer'>here</a>.&nbsp;</div><div>&nbsp;</div><div>GHCN monthly mean station averages for temperature and precipitation for the 1981-2010 period are also available in Living Atlas&nbsp;<a target='_blank' href='https://www.arcgis.com/home/item.html?id=ed59d3b4a8c44100914458dd722f054f' rel='nofollow ugc noopener noreferrer'>here</a>.</div><div>&nbsp;</div><div>&nbsp;</div><div><div><u>What can you do with this layer?&nbsp;</u></div><div>&nbsp;</div><div>Visualization: This layer can be used to plot areas where temperature was higher or lower than the historical average for each year since 1880. Be sure to&nbsp;<a target='_blank' href='https://doc.arcgis.com/en/arcgis-online/create-maps/configure-time.htm' rel='nofollow ugc noopener noreferrer'>configure the time settings</a>&nbsp;in your web map to view the timeseries correctly.&nbsp;&nbsp;&nbsp;</div><div>&nbsp;</div><div>Analysis: This layer can be used as an input to a variety of geoprocessing tools, such as&nbsp;<a target='_blank' href='https://doc.esri.com/en/arcgis-pro/latest/tool-reference/space-time-pattern-mining/create-space-time-cube.html' rel='nofollow ugc noopener noreferrer'>Space Time Cubes</a>&nbsp;and other trend analyses.&nbsp;For a more detailed temporal analysis, a monthly mean is available&nbsp;<a target='_blank' href='https://www.arcgis.com/home/item.html?id=1cfb0f94bcb042178b262d5ec1714d3c' rel='nofollow ugc noopener noreferrer'>here</a>.&nbsp;&nbsp;</div></div>",
			"keyword": [
				"livefeeds2",
				"NOAA",
				"NCEI",
				"climate",
				"temperature",
				"climate change",
				"live feeds",
				"environment",
				"esri_environment"
			],
			"issued": "2020-12-14T17:01:59.000Z",
			"modified": "2026-06-05T21:08:49.000Z",
			"publisher": {
				"name": "Esri"
			},
			"contactPoint": {
				"@type": "vcard:Contact",
				"fn": "esri_livefeeds2",
				"hasEmail": "{{orgContactEmail}}"
			},
			"accessLevel": "public",
			"spatial": "-177.5000,-87.5000,177.5000,87.5000",
			"license": "<img src='https://downloads.esri.com/blogs/arcgisonline/esrilogo_new.png' /> This work is licensed under the Esri Master License Agreement.<br /><div><a href='https://goto.arcgis.com/termsofuse/viewsummary' target='_blank' rel='nofollow ugc noopener noreferrer'><b>View Summary</b></a> | <a href='https://goto.arcgis.com/termsofuse/viewtermsofuse' target='_blank' rel='nofollow ugc noopener noreferrer'><b>View Terms of Use</b></a></div>",
			"distribution": [
				{
					"@type": "dcat:Distribution",
					"title": "ArcGIS Hub Dataset",
					"format": "Web Page",
					"mediaType": "text/html",
					"accessURL": "https://www.pacificgeoportal.com/maps/esri2::global-yearly-temperature-anomaly-1850-present"
				},
				{
					"@type": "dcat:Distribution",
					"title": "ArcGIS GeoService",
					"format": "ArcGIS GeoServices REST API",
					"mediaType": "application/json",
					"accessURL": "https://services9.arcgis.com/RHVPKKiFTONKtxq3/arcgis/rest/services/NOAA_temp_yearly_historic/FeatureServer"
				}
			],
			"theme": [
				"geospatial"
			]
		},
		{
			"@type": "dcat:Dataset",
			"identifier": "https://www.arcgis.com/home/item.html?id=861938b2dd3747789c144350048a838c&sublayer=0",
			"landingPage": "https://www.pacificgeoportal.com/datasets/esri2::yearly-temperature-anomaly",
			"title": "Yearly Temperature Anomaly",
			"description": "<div><span style='background-color:rgb(255,255,255); color:rgb(178,34,34); font-family:&quot;Avenir Next&quot;, Avenir, &quot;Helvetica Neue&quot;, sans-serif; font-size:15px;'><font style='border:0px solid currentcolor; box-sizing:border-box; font-family:&quot;Avenir Next W01&quot;, &quot;Avenir Next W00&quot;, &quot;Avenir Next&quot;, Avenir, &quot;Helvetica Neue&quot;, sans-serif; font-size:16px; line-height:1.5;'><span style='border:0px solid currentcolor; box-sizing:border-box; font-style:normal; font-variant-caps:normal; font-variant-ligatures:normal; font-weight:400; letter-spacing:normal; line-height:1.5; text-align:left; text-decoration-color:initial; text-decoration-style:initial; text-indent:0px; text-transform:none; word-spacing:0px;'><strong>Mature Support Notice:&nbsp;</strong></span></font></span><span style='background-color:rgb(255,255,255); color:rgb(74,74,74); font-family:&quot;Avenir Next&quot;, Avenir, &quot;Helvetica Neue&quot;, sans-serif; font-size:15px;'><span style='border:0px solid currentcolor; box-sizing:border-box; font-style:normal; font-variant-caps:normal; font-variant-ligatures:normal; font-weight:400; letter-spacing:normal; line-height:1.5; text-align:left; text-decoration-color:initial; text-decoration-style:initial; text-indent:0px; text-transform:none; word-spacing:0px;'><strong>This item is in&nbsp;</strong></span></span><a style='background-color:rgb(255, 255, 255); border:0px solid currentcolor; box-sizing:border-box; color:rgb(0, 97, 155); font-family:&quot;Avenir Next W01&quot;, &quot;Avenir Next W00&quot;, &quot;Avenir Next&quot;, Avenir, &quot;Helvetica Neue&quot;, sans-serif; font-size:16px; font-style:normal; font-variant-caps:normal; font-variant-ligatures:normal; font-weight:400; letter-spacing:normal; line-height:1.5; text-align:left; text-decoration:none; text-indent:0px; text-transform:none; word-spacing:0px;' target='_blank' href='https://goto.arcgis.com/lifecycle/content' rel='nofollow ugc noopener noreferrer'><span style='font-family:inherit; font-size:15px;'><span style='border:0px solid currentcolor; box-sizing:border-box; line-height:1.5;'><strong>mature support</strong></span></span></a><span style='background-color:rgb(255,255,255); color:rgb(74,74,74); font-family:&quot;Avenir Next&quot;, Avenir, &quot;Helvetica Neue&quot;, sans-serif; font-size:15px;'><span style='border:0px solid currentcolor; box-sizing:border-box; font-style:normal; font-variant-caps:normal; font-variant-ligatures:normal; font-weight:400; letter-spacing:normal; line-height:1.5; text-align:left; text-decoration-color:initial; text-decoration-style:initial; text-indent:0px; text-transform:none; word-spacing:0px;'><strong>&nbsp;as of April 2026. </strong>A replacement item has not been identified at this time. Esri recommends updating your maps and apps to phase out use of this item.</span></span></div><div>&nbsp;</div><div>Measurements of surface air and ocean temperature are compiled from around the world each month by NOAA’s National Centers for Environmental Information and are analyzed and compared to the 1971-2000 average temperature for each location. The resulting temperature anomaly (or difference from the average) is shown in this feature service, which includes an archive going back to 1880. The mean of the 12 months each year is displayed here.&nbsp;The 2025 values are the last that will be included and no future updates are planned.&nbsp;</div><div>&nbsp;</div><div>The&nbsp;<a target='_blank' href='https://www.ncei.noaa.gov/products/land-based-station/noaa-global-temp' rel='nofollow ugc noopener noreferrer'>NOAAGlobalTemp dataset</a>&nbsp;is the official U.S. long-term record of global temperature data and is often used to show trends in temperature change around the world. It combines thousands of land-based station measurements from the&nbsp;<a target='_blank' href='https://www.ncei.noaa.gov/products/land-based-station/global-historical-climatology-network-monthly' rel='nofollow ugc noopener noreferrer'>Global Historical Climatology Network</a>&nbsp;(GHCN) along with surface ocean temperature from the&nbsp;<a target='_blank' href='https://www.ncei.noaa.gov/products/extended-reconstructed-sst' rel='nofollow ugc noopener noreferrer'>Extended Reconstructed Sea Surface Temperature</a>&nbsp;(ERSST) analysis. These two datasets are merged into a 5-degree resolution product. A report summary report by NOAA NCEI is available&nbsp;<a target='_blank' href='https://www.ncdc.noaa.gov/sotc/global/' rel='nofollow ugc noopener noreferrer'>here</a>.&nbsp;</div><div>&nbsp;</div><div>GHCN monthly mean station averages for temperature and precipitation for the 1981-2010 period are also available in Living Atlas&nbsp;<a target='_blank' href='https://www.arcgis.com/home/item.html?id=ed59d3b4a8c44100914458dd722f054f' rel='nofollow ugc noopener noreferrer'>here</a>.</div><div>&nbsp;</div><div>&nbsp;</div><div><div><u>What can you do with this layer?&nbsp;</u></div><div>&nbsp;</div><div>Visualization: This layer can be used to plot areas where temperature was higher or lower than the historical average for each year since 1880. Be sure to&nbsp;<a target='_blank' href='https://doc.arcgis.com/en/arcgis-online/create-maps/configure-time.htm' rel='nofollow ugc noopener noreferrer'>configure the time settings</a>&nbsp;in your web map to view the timeseries correctly.&nbsp;&nbsp;&nbsp;</div><div>&nbsp;</div><div>Analysis: This layer can be used as an input to a variety of geoprocessing tools, such as&nbsp;<a target='_blank' href='https://doc.esri.com/en/arcgis-pro/latest/tool-reference/space-time-pattern-mining/create-space-time-cube.html' rel='nofollow ugc noopener noreferrer'>Space Time Cubes</a>&nbsp;and other trend analyses.&nbsp;For a more detailed temporal analysis, a monthly mean is available&nbsp;<a target='_blank' href='https://www.arcgis.com/home/item.html?id=1cfb0f94bcb042178b262d5ec1714d3c' rel='nofollow ugc noopener noreferrer'>here</a>.&nbsp;&nbsp;</div></div>",
			"keyword": [
				"livefeeds2",
				"NOAA",
				"NCEI",
				"climate",
				"temperature",
				"climate change",
				"live feeds",
				"environment",
				"esri_environment"
			],
			"issued": "2020-12-14T17:01:59.000Z",
			"modified": "2026-03-18T14:20:48.951Z",
			"publisher": {
				"name": "Esri"
			},
			"contactPoint": {
				"@type": "vcard:Contact",
				"fn": "esri_livefeeds2",
				"hasEmail": "{{orgContactEmail}}"
			},
			"accessLevel": "public",
			"spatial": "-177.5000,-87.5000,177.5000,87.5000",
			"license": "<img src='https://downloads.esri.com/blogs/arcgisonline/esrilogo_new.png' /> This work is licensed under the Esri Master License Agreement.<br /><div><a href='https://goto.arcgis.com/termsofuse/viewsummary' target='_blank' rel='nofollow ugc noopener noreferrer'><b>View Summary</b></a> | <a href='https://goto.arcgis.com/termsofuse/viewtermsofuse' target='_blank' rel='nofollow ugc noopener noreferrer'><b>View Terms of Use</b></a></div>",
			"distribution": [
				{
					"@type": "dcat:Distribution",
					"title": "ArcGIS Hub Dataset",
					"format": "Web Page",
					"mediaType": "text/html",
					"accessURL": "https://www.pacificgeoportal.com/datasets/esri2::yearly-temperature-anomaly"
				},
				{
					"@type": "dcat:Distribution",
					"title": "ArcGIS GeoService",
					"format": "ArcGIS GeoServices REST API",
					"mediaType": "application/json",
					"accessURL": "https://services9.arcgis.com/RHVPKKiFTONKtxq3/arcgis/rest/services/NOAA_temp_yearly_historic/FeatureServer/0"
				},
				{
					"@type": "dcat:Distribution",
					"title": "CSV",
					"format": "CSV",
					"mediaType": "text/csv",
					"accessURL": "https://www.pacificgeoportal.com/api/download/v1/items/861938b2dd3747789c144350048a838c/csv?layers=0"
				},
				{
					"@type": "dcat:Distribution",
					"title": "Shapefile",
					"format": "ZIP",
					"mediaType": "application/zip",
					"accessURL": "https://www.pacificgeoportal.com/api/download/v1/items/861938b2dd3747789c144350048a838c/shapefile?layers=0"
				},
				{
					"@type": "dcat:Distribution",
					"title": "GeoJSON",
					"format": "GeoJSON",
					"mediaType": "application/vnd.geo+json",
					"accessURL": "https://www.pacificgeoportal.com/api/download/v1/items/861938b2dd3747789c144350048a838c/geojson?layers=0"
				},
				{
					"@type": "dcat:Distribution",
					"title": "KML",
					"format": "KML",
					"mediaType": "application/vnd.google-earth.kml+xml",
					"accessURL": "https://www.pacificgeoportal.com/api/download/v1/items/861938b2dd3747789c144350048a838c/kml?layers=0"
				}
			],
			"theme": [
				"geospatial"
			]
		},
		{
			"@type": "dcat:Dataset",
			"identifier": "https://www.arcgis.com/home/item.html?id=861938b2dd3747789c144350048a838c&sublayer=1",
			"landingPage": "https://www.pacificgeoportal.com/datasets/esri2::yearly-temperature-anomaly-by-time",
			"title": "Yearly Temperature Anomaly by Time",
			"description": "<div><span style='background-color:rgb(255,255,255); color:rgb(178,34,34); font-family:&quot;Avenir Next&quot;, Avenir, &quot;Helvetica Neue&quot;, sans-serif; font-size:15px;'><font style='border:0px solid currentcolor; box-sizing:border-box; font-family:&quot;Avenir Next W01&quot;, &quot;Avenir Next W00&quot;, &quot;Avenir Next&quot;, Avenir, &quot;Helvetica Neue&quot;, sans-serif; font-size:16px; line-height:1.5;'><span style='border:0px solid currentcolor; box-sizing:border-box; font-style:normal; font-variant-caps:normal; font-variant-ligatures:normal; font-weight:400; letter-spacing:normal; line-height:1.5; text-align:left; text-decoration-color:initial; text-decoration-style:initial; text-indent:0px; text-transform:none; word-spacing:0px;'><strong>Mature Support Notice:&nbsp;</strong></span></font></span><span style='background-color:rgb(255,255,255); color:rgb(74,74,74); font-family:&quot;Avenir Next&quot;, Avenir, &quot;Helvetica Neue&quot;, sans-serif; font-size:15px;'><span style='border:0px solid currentcolor; box-sizing:border-box; font-style:normal; font-variant-caps:normal; font-variant-ligatures:normal; font-weight:400; letter-spacing:normal; line-height:1.5; text-align:left; text-decoration-color:initial; text-decoration-style:initial; text-indent:0px; text-transform:none; word-spacing:0px;'><strong>This item is in&nbsp;</strong></span></span><a style='background-color:rgb(255, 255, 255); border:0px solid currentcolor; box-sizing:border-box; color:rgb(0, 97, 155); font-family:&quot;Avenir Next W01&quot;, &quot;Avenir Next W00&quot;, &quot;Avenir Next&quot;, Avenir, &quot;Helvetica Neue&quot;, sans-serif; font-size:16px; font-style:normal; font-variant-caps:normal; font-variant-ligatures:normal; font-weight:400; letter-spacing:normal; line-height:1.5; text-align:left; text-decoration:none; text-indent:0px; text-transform:none; word-spacing:0px;' target='_blank' href='https://goto.arcgis.com/lifecycle/content' rel='nofollow ugc noopener noreferrer'><span style='font-family:inherit; font-size:15px;'><span style='border:0px solid currentcolor; box-sizing:border-box; line-height:1.5;'><strong>mature support</strong></span></span></a><span style='background-color:rgb(255,255,255); color:rgb(74,74,74); font-family:&quot;Avenir Next&quot;, Avenir, &quot;Helvetica Neue&quot;, sans-serif; font-size:15px;'><span style='border:0px solid currentcolor; box-sizing:border-box; font-style:normal; font-variant-caps:normal; font-variant-ligatures:normal; font-weight:400; letter-spacing:normal; line-height:1.5; text-align:left; text-decoration-color:initial; text-decoration-style:initial; text-indent:0px; text-transform:none; word-spacing:0px;'><strong>&nbsp;as of April 2026. </strong>A replacement item has not been identified at this time. Esri recommends updating your maps and apps to phase out use of this item.</span></span></div><div>&nbsp;</div><div>Measurements of surface air and ocean temperature are compiled from around the world each month by NOAA’s National Centers for Environmental Information and are analyzed and compared to the 1971-2000 average temperature for each location. The resulting temperature anomaly (or difference from the average) is shown in this feature service, which includes an archive going back to 1880. The mean of the 12 months each year is displayed here.&nbsp;The 2025 values are the last that will be included and no future updates are planned.&nbsp;</div><div>&nbsp;</div><div>The&nbsp;<a target='_blank' href='https://www.ncei.noaa.gov/products/land-based-station/noaa-global-temp' rel='nofollow ugc noopener noreferrer'>NOAAGlobalTemp dataset</a>&nbsp;is the official U.S. long-term record of global temperature data and is often used to show trends in temperature change around the world. It combines thousands of land-based station measurements from the&nbsp;<a target='_blank' href='https://www.ncei.noaa.gov/products/land-based-station/global-historical-climatology-network-monthly' rel='nofollow ugc noopener noreferrer'>Global Historical Climatology Network</a>&nbsp;(GHCN) along with surface ocean temperature from the&nbsp;<a target='_blank' href='https://www.ncei.noaa.gov/products/extended-reconstructed-sst' rel='nofollow ugc noopener noreferrer'>Extended Reconstructed Sea Surface Temperature</a>&nbsp;(ERSST) analysis. These two datasets are merged into a 5-degree resolution product. A report summary report by NOAA NCEI is available&nbsp;<a target='_blank' href='https://www.ncdc.noaa.gov/sotc/global/' rel='nofollow ugc noopener noreferrer'>here</a>.&nbsp;</div><div>&nbsp;</div><div>GHCN monthly mean station averages for temperature and precipitation for the 1981-2010 period are also available in Living Atlas&nbsp;<a target='_blank' href='https://www.arcgis.com/home/item.html?id=ed59d3b4a8c44100914458dd722f054f' rel='nofollow ugc noopener noreferrer'>here</a>.</div><div>&nbsp;</div><div>&nbsp;</div><div><div><u>What can you do with this layer?&nbsp;</u></div><div>&nbsp;</div><div>Visualization: This layer can be used to plot areas where temperature was higher or lower than the historical average for each year since 1880. Be sure to&nbsp;<a target='_blank' href='https://doc.arcgis.com/en/arcgis-online/create-maps/configure-time.htm' rel='nofollow ugc noopener noreferrer'>configure the time settings</a>&nbsp;in your web map to view the timeseries correctly.&nbsp;&nbsp;&nbsp;</div><div>&nbsp;</div><div>Analysis: This layer can be used as an input to a variety of geoprocessing tools, such as&nbsp;<a target='_blank' href='https://doc.esri.com/en/arcgis-pro/latest/tool-reference/space-time-pattern-mining/create-space-time-cube.html' rel='nofollow ugc noopener noreferrer'>Space Time Cubes</a>&nbsp;and other trend analyses.&nbsp;For a more detailed temporal analysis, a monthly mean is available&nbsp;<a target='_blank' href='https://www.arcgis.com/home/item.html?id=1cfb0f94bcb042178b262d5ec1714d3c' rel='nofollow ugc noopener noreferrer'>here</a>.&nbsp;&nbsp;</div></div>",
			"keyword": [
				"livefeeds2",
				"NOAA",
				"NCEI",
				"climate",
				"temperature",
				"climate change",
				"live feeds",
				"environment",
				"esri_environment"
			],
			"issued": "2020-12-14T17:01:59.000Z",
			"modified": "2026-03-18T14:20:48.951Z",
			"publisher": {
				"name": "Esri"
			},
			"contactPoint": {
				"@type": "vcard:Contact",
				"fn": "esri_livefeeds2",
				"hasEmail": "{{orgContactEmail}}"
			},
			"accessLevel": "public",
			"spatial": "-177.5000,-87.5000,177.5000,87.5000",
			"license": "<img src='https://downloads.esri.com/blogs/arcgisonline/esrilogo_new.png' /> This work is licensed under the Esri Master License Agreement.<br /><div><a href='https://goto.arcgis.com/termsofuse/viewsummary' target='_blank' rel='nofollow ugc noopener noreferrer'><b>View Summary</b></a> | <a href='https://goto.arcgis.com/termsofuse/viewtermsofuse' target='_blank' rel='nofollow ugc noopener noreferrer'><b>View Terms of Use</b></a></div>",
			"distribution": [
				{
					"@type": "dcat:Distribution",
					"title": "ArcGIS Hub Dataset",
					"format": "Web Page",
					"mediaType": "text/html",
					"accessURL": "https://www.pacificgeoportal.com/datasets/esri2::yearly-temperature-anomaly-by-time"
				},
				{
					"@type": "dcat:Distribution",
					"title": "ArcGIS GeoService",
					"format": "ArcGIS GeoServices REST API",
					"mediaType": "application/json",
					"accessURL": "https://services9.arcgis.com/RHVPKKiFTONKtxq3/arcgis/rest/services/NOAA_temp_yearly_historic/FeatureServer/1"
				},
				{
					"@type": "dcat:Distribution",
					"title": "CSV",
					"format": "CSV",
					"mediaType": "text/csv",
					"accessURL": "https://www.pacificgeoportal.com/api/download/v1/items/861938b2dd3747789c144350048a838c/csv?layers=1"
				},
				{
					"@type": "dcat:Distribution",
					"title": "Shapefile",
					"format": "ZIP",
					"mediaType": "application/zip",
					"accessURL": "https://www.pacificgeoportal.com/api/download/v1/items/861938b2dd3747789c144350048a838c/shapefile?layers=1"
				},
				{
					"@type": "dcat:Distribution",
					"title": "GeoJSON",
					"format": "GeoJSON",
					"mediaType": "application/vnd.geo+json",
					"accessURL": "https://www.pacificgeoportal.com/api/download/v1/items/861938b2dd3747789c144350048a838c/geojson?layers=1"
				},
				{
					"@type": "dcat:Distribution",
					"title": "KML",
					"format": "KML",
					"mediaType": "application/vnd.google-earth.kml+xml",
					"accessURL": "https://www.pacificgeoportal.com/api/download/v1/items/861938b2dd3747789c144350048a838c/kml?layers=1"
				}
			],
			"theme": [
				"geospatial"
			]
		},
		{
			"@type": "dcat:Dataset",
			"identifier": "https://www.arcgis.com/home/item.html?id=8eaddf4279684fc09abb2b61f1338be4",
			"landingPage": "https://www.pacificgeoportal.com/maps/esri::openstreetmap-streets-with-relief-wgs84",
			"title": "OpenStreetMap Streets with Relief (WGS84)",
			"description": "<p><span style='color:#b22222;'><font style='font-family:&quot;Avenir Next W01&quot;, &quot;Avenir Next W00&quot;, &quot;Avenir Next&quot;, Avenir, &quot;Helvetica Neue&quot;, sans-serif; font-size:16px;'><strong>Mature Support Notice:&nbsp;</strong></font></span><strong>This item is in&nbsp;</strong><a style='color:rgb(0, 97, 155); font-family:&quot;Avenir Next W01&quot;, &quot;Avenir Next W00&quot;, &quot;Avenir Next&quot;, Avenir, &quot;Helvetica Neue&quot;, sans-serif; font-size:16px; text-decoration-line:none;' target='_blank' href='https://goto.arcgis.com/lifecycle/content' rel='nofollow ugc noopener noreferrer'><strong>mature support</strong></a><strong>&nbsp;as of December 2024. A&nbsp;</strong><a style='background-color:rgb(255, 255, 255); border:0px solid currentcolor; box-sizing:border-box; color:rgb(0, 97, 155); font-family:&quot;Avenir Next&quot;, Avenir, &quot;Helvetica Neue&quot;, sans-serif; font-size:16px; font-style:normal; font-variant-caps:normal; font-variant-ligatures:normal; font-weight:400; letter-spacing:normal; line-height:1.5; text-align:start; text-decoration:none; text-indent:0px; text-transform:none; word-spacing:0px;' target='_blank' href='https://www.arcgis.com/home/item.html?id=5bea2c3e825e4d1e8333093a155b6011' rel='nofollow ugc noopener noreferrer'><strong>new version of this item</strong></a><strong>&nbsp;is available for your use. </strong>Esri recommends updating your maps and apps to use the new version. <span style='font-family:&quot;Avenir Next W01&quot;, &quot;Avenir Next W00&quot;, &quot;Avenir Next&quot;, Avenir, &quot;Helvetica Neue&quot;, sans-serif; font-size:16px;'>See&nbsp;</span><a style='color:rgb(0, 97, 155); font-family:&quot;Avenir Next W01&quot;, &quot;Avenir Next W00&quot;, &quot;Avenir Next&quot;, Avenir, &quot;Helvetica Neue&quot;, sans-serif; font-size:16px; text-decoration-line:none;' target='_blank' href='https://goto.arcgis.com/blogs/osmmaturesupport' rel='nofollow ugc noopener noreferrer'>blog</a><span style='font-family:inherit; font-size:14px;'><font style='font-family:&quot;Avenir Next W01&quot;, &quot;Avenir Next W00&quot;, &quot;Avenir Next&quot;, Avenir, &quot;Helvetica Neue&quot;, sans-serif; font-size:16px;'>&nbsp;</font></span><span style='font-family:&quot;Avenir Next W01&quot;, &quot;Avenir Next W00&quot;, &quot;Avenir Next&quot;, Avenir, &quot;Helvetica Neue&quot;, sans-serif; font-size:16px;'>for more information.</span></p><div><p style='margin-bottom:1.5rem; margin-top:0px;'>This web map presents a vector basemap of OpenStreetMap (OSM) data hosted by Esri. This version of the map is rendered in a style similar to the Esri Street Map (with Relief).&nbsp;It includes the World Hillshade layer.&nbsp;<span style='font-family:&quot;Avenir Next W01&quot;, &quot;Avenir Next W00&quot;, &quot;Avenir Next&quot;, Avenir, &quot;Helvetica Neue&quot;, sans-serif; font-size:16px;'>Created from the&nbsp;</span><a style='color:rgb(0, 97, 155); font-family:inherit; font-size:16px; text-decoration-line:none;' target='_blank' href='https://daylightmap.org/2024/05/03/sunsetting-daylight.html' rel='nofollow ugc noopener noreferrer'>sunsetted Daylight map distribution</a><span style='font-family:&quot;Avenir Next W01&quot;, &quot;Avenir Next W00&quot;, &quot;Avenir Next&quot;, Avenir, &quot;Helvetica Neue&quot;, sans-serif; font-size:16px;'>, data updates supporting this layer are no longer available.</span></p><div style='font-family:inherit; font-size:16px;'><div style='font-family:inherit;'><div style='font-family:&quot;Avenir Next W01&quot;, &quot;Avenir Next W00&quot;, &quot;Avenir Next&quot;, Avenir, &quot;Helvetica Neue&quot;, sans-serif;'><div style='margin-bottom:3rem;'><div style='display:inherit; max-width:100%; overflow:auto; padding-bottom:0.375rem;'><div style='font-family:inherit;'><div style='font-family:inherit;'>OpenStreetMap is an open collaborative project to create a free editable map of the world. Volunteers gather location data using GPS, local knowledge, and other free sources of information and upload it. The resulting free map can be viewed and downloaded from the OpenStreetMap site: www.OpenStreetMap.org. Esri is a supporter of the OSM project.&nbsp;</div><div style='font-family:inherit;'>&nbsp;</div><div style='font-family:inherit;'><strong>Precise Tile Registration:&nbsp;</strong><span style='font-family:&quot;Avenir Next&quot;, Avenir, &quot;Helvetica Neue&quot;, Helvetica, Arial, sans-serif; font-size:15px;'>The tile layer uses the improved tiling scheme “WGS84 Geographic, Version 2” to ensure proper tile positioning at higher resolutions (neighborhood level and beyond). The new tiling scheme is much more precise than tiling schemes of the legacy basemaps Esri released years ago. We recommend that you start using this new basemap for any new web maps in WGS84 that you plan to author. &nbsp; Due to the number of differences between the old and new tiling schemes, some web clients will not be able to overlay tile layers in the old and new tiling schemes in one web map.&nbsp;</span></div></div></div></div></div></div></div></div>",
			"keyword": [
				"basemap",
				"OpenStreetMap",
				"OSM",
				"Streets with Relief",
				"osmStreetsrelief",
				"gcs",
				"vector",
				"WGS84"
			],
			"issued": "2019-09-05T20:53:48.000Z",
			"modified": "2026-05-29T21:31:50.000Z",
			"publisher": {
				"name": "Esri"
			},
			"contactPoint": {
				"@type": "vcard:Contact",
				"fn": "esri_vector",
				"hasEmail": "{{orgContactEmail}}"
			},
			"accessLevel": "public",
			"spatial": "-140.0000,-60.0000,140.0000,60.0000",
			"license": "<p><img style='font-family:&quot;Avenir Next W01&quot;, &quot;Avenir Next W00&quot;, &quot;Avenir Next&quot;, Avenir, &quot;Helvetica Neue&quot;, sans-serif; font-size:16px; height:auto; max-width:100%;' src='https://downloads.esri.com/blogs/arcgisonline/esrilogo_new.png' width='113' height='43' /><span style='font-family:&quot;Avenir Next W01&quot;, &quot;Avenir Next W00&quot;, &quot;Avenir Next&quot;, Avenir, &quot;Helvetica Neue&quot;, sans-serif; font-size:16px;'> This work is licensed under the Esri Master License Agreement.</span></p><div style='font-family:&quot;Avenir Next W01&quot;, &quot;Avenir Next W00&quot;, &quot;Avenir Next&quot;, Avenir, &quot;Helvetica Neue&quot;, sans-serif; font-size:16px;'><a style='color:rgb(0, 121, 193); text-decoration-line:none;' target='_blank' href='https://goto.arcgis.com/termsofuse/viewsummary' rel='nofollow ugc noopener noreferrer'><strong>View Summary</strong></a><strong>&nbsp;|&nbsp;</strong><a style='color:rgb(0, 121, 193); text-decoration-line:none;' target='_blank' href='https://goto.arcgis.com/termsofuse/viewtermsofuse' rel='nofollow ugc noopener noreferrer'><strong>View Terms of Use</strong></a></div>",
			"distribution": [
				{
					"@type": "dcat:Distribution",
					"title": "ArcGIS Hub Dataset",
					"format": "Web Page",
					"mediaType": "text/html",
					"accessURL": "https://www.pacificgeoportal.com/maps/esri::openstreetmap-streets-with-relief-wgs84"
				},
				{
					"@type": "dcat:Distribution",
					"title": "ArcGIS GeoService",
					"format": "ArcGIS GeoServices REST API",
					"mediaType": "application/json",
					"accessURL": "https://basemaps.arcgis.com/arcgis/rest/services/OpenStreetMap_GCS_v2/VectorTileServer"
				}
			],
			"theme": [
				"geospatial"
			]
		},
		{
			"@type": "dcat:Dataset",
			"identifier": "https://www.arcgis.com/home/item.html?id=1e126e7520f9466c9ca28b8f28b5e500&sublayer=0",
			"landingPage": "https://www.pacificgeoportal.com/datasets/esri::world-ocean-base",
			"title": "World Ocean Base",
			"description": "<p><span>The map is designed to be used as a basemap by marine GIS professionals and as a reference map by anyone&nbsp;interested in ocean data. The basemap focuses on bathymetry. It also includes inland waters and roads, overlaid on land cover and shaded relief imagery.</span></p><div>&nbsp;</div><div><div>The Ocean Base map currently provides coverage for the world down to a scale of ~1:577k; coverage down to ~1:72k in United States coastal areas and various other areas; and coverage down to ~1:9k in limited regional areas.</div><div>&nbsp;</div><div>The&nbsp;<a target='_blank' href='https://www.arcgis.com/home/item.html?id=0fd0c5b7a647404d8934516aa997e6d9' rel='nofollow ugc noopener noreferrer'>World Ocean Reference</a>&nbsp;is designed to be drawn on top of this map and provides selected city labels throughout the world.&nbsp;<a target='_blank' href='https://www.arcgis.com/home/item.html?id=5ae9e138a17842688b0b79283a4353f6' rel='nofollow ugc noopener noreferrer'>This web map</a>&nbsp;lets you view the World Ocean Base with the&nbsp;Reference&nbsp;service drawn on top. Article in the Fall 2011 ArcUser about this basemap: \"<a target='_blank' href='https://www.esri.com/news/arcuser/0911/a-foundation-for-ocean-gis.html' rel='nofollow ugc noopener noreferrer'>A Foundation for Ocean GIS</a>\".</div><div>&nbsp;</div><div>The map was compiled from a variety of best available sources from several data providers, including General Bathymetric Chart of the Oceans GEBCO_08 Grid version 20100927 and IHO-IOC GEBCO Gazetteer of Undersea Feature Names August 2010 version (<a target='_blank' href='https://www.gebco.net' rel='nofollow ugc noopener noreferrer'>https://www.gebco.net</a>),&nbsp;<a target='_blank' href='https://www.ngdc.noaa.gov/mgg/bathymetry/relief.html' rel='nofollow ugc noopener noreferrer'>National Oceanic and Atmospheric Administration (NOAA)</a>&nbsp;and National Geographic for the oceans; and Garmin, and Esri for topographic content. You can contribute your bathymetric data to this service and have it served by Esri for the benefit of the Ocean GIS community. For details on&nbsp;the users who contributed bathymetric data for this map via the&nbsp;<a target='_blank' href='https://www.esri.com/software/arcgis/community-maps-program' rel='nofollow ugc noopener noreferrer'>Community Maps Program</a>, view the list of&nbsp;<a target='_blank' href='https://esriurl.com/WorldOceanContributors' rel='nofollow ugc noopener noreferrer'>Contributors for the Ocean Basemap</a>. The basemap was designed and developed by Esri.&nbsp;</div><div>&nbsp;</div><div>The GEBCO_08 Grid is largely based on a database of ship-track soundings with interpolation between soundings guided by satellite-derived gravity data. In some areas, data from existing grids are included. The GEBCO_08 Grid does not contain detailed information in shallower water areas, information concerning the generation of the grid can be found on GEBCO's website:&nbsp;<a target='_blank' href='https://www.gebco.net/data_and_products/gridded_bathymetry_data/' rel='nofollow ugc noopener noreferrer'>https://www.gebco.net/data_and_products/gridded_bathymetry_data/</a>. The GEBCO_08 Grid is accompanied by a Source&nbsp;Identifier (SID) Grid which indicates which cells in the GEBCO_08 Grid are based on soundings or existing grids and which have been interpolated. The latest version of both grids and accompanying documentation is available to download, on behalf of GEBCO, from the British Oceanographic Data Centre (BODC)&nbsp;<a target='_blank' href='https://www.bodc.ac.uk/data/hosted_data_systems/gebco_gridded_bathymetry_data/' rel='nofollow ugc noopener noreferrer'>https://www.bodc.ac.uk/data/hosted_data_systems/gebco_gridded_bathymetry_data/</a>.</div><div>&nbsp;</div><div>The names of the IHO (International Hydrographic Organization), IOC (intergovernmental Oceanographic Commission), GEBCO (General Bathymetric Chart of the Oceans), NERC (Natural Environment Research Council) or BODC (British Oceanographic Data Centre) may not be used in any way to imply, directly or otherwise, endorsement or support of either the Licensee or their mapping system.</div><div>&nbsp;</div><div>Tip: Here are some famous oceanic locations as they appear this map.&nbsp; Each URL launches this map at a particular location via parameters specified in the URL:&nbsp;<span style='color:#4d4d4d; font-size:14px;'>&nbsp;</span><a target='_blank' href='https://www.arcgis.com/home/webmap/viewer.html?webmap=5ae9e138a17842688b0b79283a4353f6&amp;center=142.591596,11.383091&amp;level=8' rel='nofollow ugc noopener noreferrer'>Challenger Deep</a>,&nbsp;<a target='_blank' href='https://www.arcgis.com/home/webmap/viewer.html?webmap=5ae9e138a17842688b0b79283a4353f6&amp;extent=-92.614702,-2.460153,-87.308306,1.647750' rel='nofollow ugc noopener noreferrer'>Galapagos Islands</a>,&nbsp;<a target='_blank' href='https://www.arcgis.com/home/webmap/viewer.html?webmap=5ae9e138a17842688b0b79283a4353f6&amp;extent=-162.517962,16.907083,-152.015032,24.514666' rel='nofollow ugc noopener noreferrer'>Hawaiian Islands</a>,&nbsp;<a target='_blank' href='https://www.arcgis.com/home/webmap/viewer.html?webmap=5ae9e138a17842688b0b79283a4353f6&amp;extent=68.484612,0.695479,78.756828,8.714678' rel='nofollow ugc noopener noreferrer'>Maldive Islands</a>,&nbsp;<a target='_blank' href='https://www.arcgis.com/home/webmap/viewer.html?webmap=5ae9e138a17842688b0b79283a4353f6&amp;extent=136.186567,5.583166,157.038618,21.606348' rel='nofollow ugc noopener noreferrer'>Mariana Trench</a>,&nbsp;<a target='_blank' href='https://www.arcgis.com/home/webmap/viewer.html?webmap=5ae9e138a17842688b0b79283a4353f6&amp;extent=-150.763100,-18.436944,-148.104408,-16.466703' rel='nofollow ugc noopener noreferrer'>Tahiti</a>,&nbsp;<a target='_blank' href='https://www.arcgis.com/home/webmap/viewer.html?webmap=5ae9e138a17842688b0b79283a4353f6&amp;center=-130.716,50.59&amp;level=8' rel='nofollow ugc noopener noreferrer'>Queen Charlotte Sound</a>,&nbsp;<a target='_blank' href='https://www.arcgis.com/home/webmap/viewer.html?webmap=5ae9e138a17842688b0b79283a4353f6&amp;center=-55.174,49.859&amp;level=9' rel='nofollow ugc noopener noreferrer'>Notre Dame Bay</a>,&nbsp;<a target='_blank' href='https://www.arcgis.com/home/webmap/viewer.html?webmap=5ae9e138a17842688b0b79283a4353f6&amp;center=-60.417,56.466&amp;level=9' rel='nofollow ugc noopener noreferrer'>Labrador Trough</a>,&nbsp;<a target='_blank' href='https://www.arcgis.com/home/webmap/viewer.html?webmap=5ae9e138a17842688b0b79283a4353f6&amp;center=-74.05,40.649&amp;level=14' rel='nofollow ugc noopener noreferrer'>New York Bight</a>,&nbsp;<a target='_blank' href='https://www.arcgis.com/home/webmap/viewer.html?webmap=5ae9e138a17842688b0b79283a4353f6&amp;center=-70.615,42.283&amp;level=14' rel='nofollow ugc noopener noreferrer'>Massachusetts Bay</a>,&nbsp;<a target='_blank' href='https://www.arcgis.com/home/webmap/viewer.html?webmap=5ae9e138a17842688b0b79283a4353f6&amp;center=-88.482,30.207&amp;level=14' rel='nofollow ugc noopener noreferrer'>Mississippi Sound</a></div></div>",
			"keyword": [
				"World",
				"Global",
				"Bathymetry",
				"Ocean",
				"Seafloor",
				"marine",
				"bathymetry",
				"basemap",
				"seas",
				"sea floor",
				"AFA250_base",
				"current",
				"esri_basemap",
				"Oceans"
			],
			"issued": "2014-02-24T20:43:29.000Z",
			"modified": "2026-05-26T22:22:11.000Z",
			"publisher": {
				"name": "Esri"
			},
			"contactPoint": {
				"@type": "vcard:Contact",
				"fn": "esri",
				"hasEmail": "{{orgContactEmail}}"
			},
			"accessLevel": "public",
			"spatial": "-180.0000,-85.0147,180.0000,85.0491",
			"license": "<img alt='' src='https://downloads.esri.com/blogs/arcgisonline/esrilogo_new.png' /> This work is licensed under the Esri Master License Agreement.<br /><div><a href='https://goto.arcgis.com/termsofuse/viewsummary' rel='nofollow ugc' target='_blank'><b>View Summary</b></a> | <b><a href='https://goto.arcgis.com/termsofuse/viewtermsofuse' rel='nofollow ugc' target='_blank'>View Terms of Use</a></b></div><div><br /></div><div><div>Not to be used for navigation/safety at sea.</div></div><div><br /></div><div><div><b>Export:</b> This layer is not intended to be used to export tiles for offline.  If you would like to export imagery for offline use in ArcGIS applications, you may use the <a href='https://www.arcgis.com/home/item.html?id=5d85d897aee241f884158aa514954443' rel='nofollow ugc' target='_blank'>World Ocean Base (for Export)</a> layer, which is intended for this purpose.</div></div><div><br /></div>",
			"distribution": [
				{
					"@type": "dcat:Distribution",
					"title": "ArcGIS Hub Dataset",
					"format": "Web Page",
					"mediaType": "text/html",
					"accessURL": "https://www.pacificgeoportal.com/datasets/esri::world-ocean-base"
				},
				{
					"@type": "dcat:Distribution",
					"title": "ArcGIS GeoService",
					"format": "ArcGIS GeoServices REST API",
					"mediaType": "application/json",
					"accessURL": "https://services.arcgisonline.com/ArcGIS/rest/services/Ocean/World_Ocean_Base/MapServer/0"
				}
			],
			"theme": [
				"geospatial"
			]
		},
		{
			"@type": "dcat:Dataset",
			"identifier": "https://www.arcgis.com/home/item.html?id=5eb673fcdc244ec1ae0b3d84dbd534d1&sublayer=0",
			"landingPage": "https://www.pacificgeoportal.com/datasets/kiwirail::kiwirail-bridges",
			"title": "KiwiRail Bridges",
			"description": "<p>KiwiRail bridges on the rail network, represented as a single polyline for each bridge, which aligns with the track centreline (Main Left/Up Main only) from the start point to end point of the bridge asset. Includes all bridges supporting a track asset, which may be over rivers, streams, roads or other infrastructure.  Bridges are identified with a combination of bridge number and line name.  </p><p>Attribute information includes Latitude and Longitude coordinates (decimal degrees) for the midpoint of each polyline.</p><p>Data does not include road bridges over rail track, culverts, footbridges, subways or stock underpasses/overpasses. Existence of a bridge in this data does not necessarily indicate a KiwiRail owned asset.</p><p>Spatial accuracy is +/- 0.5m</p>",
			"keyword": [
				"KiwiRail",
				"rail bridge",
				"bridges",
				"bridge",
				"NZ",
				"New Zealand"
			],
			"issued": "2018-08-13T03:48:51.000Z",
			"modified": "2026-11-11T07:01:06.855Z",
			"publisher": {
				"name": "KiwiRail"
			},
			"contactPoint": {
				"@type": "vcard:Contact",
				"fn": "gis.support@kiwirail.co.nz",
				"hasEmail": "mailto:gis.support@kiwirail.co.nz"
			},
			"accessLevel": "public",
			"spatial": "167.9770,-46.5968,178.0292,-35.4043",
			"license": "https://creativecommons.org/licenses/by/4.0",
			"distribution": [
				{
					"@type": "dcat:Distribution",
					"title": "ArcGIS Hub Dataset",
					"format": "Web Page",
					"mediaType": "text/html",
					"accessURL": "https://www.pacificgeoportal.com/datasets/kiwirail::kiwirail-bridges"
				},
				{
					"@type": "dcat:Distribution",
					"title": "ArcGIS GeoService",
					"format": "ArcGIS GeoServices REST API",
					"mediaType": "application/json",
					"accessURL": "https://services6.arcgis.com/eqX2HMCD3H8MUs6Q/arcgis/rest/services/KiwiRailBridges/FeatureServer/0"
				},
				{
					"@type": "dcat:Distribution",
					"title": "CSV",
					"format": "CSV",
					"mediaType": "text/csv",
					"accessURL": "https://www.pacificgeoportal.com/api/download/v1/items/5eb673fcdc244ec1ae0b3d84dbd534d1/csv?layers=0"
				},
				{
					"@type": "dcat:Distribution",
					"title": "Shapefile",
					"format": "ZIP",
					"mediaType": "application/zip",
					"accessURL": "https://www.pacificgeoportal.com/api/download/v1/items/5eb673fcdc244ec1ae0b3d84dbd534d1/shapefile?layers=0"
				},
				{
					"@type": "dcat:Distribution",
					"title": "GeoJSON",
					"format": "GeoJSON",
					"mediaType": "application/vnd.geo+json",
					"accessURL": "https://www.pacificgeoportal.com/api/download/v1/items/5eb673fcdc244ec1ae0b3d84dbd534d1/geojson?layers=0"
				},
				{
					"@type": "dcat:Distribution",
					"title": "SQLite Geodatabase",
					"format": "GDB",
					"mediaType": "application/geopackage+sqlite3",
					"accessURL": "https://www.pacificgeoportal.com/api/download/v1/items/5eb673fcdc244ec1ae0b3d84dbd534d1/sqlite?layers=0"
				},
				{
					"@type": "dcat:Distribution",
					"title": "File Geodatabase",
					"format": "ZIP",
					"mediaType": "application/zip",
					"accessURL": "https://www.pacificgeoportal.com/api/download/v1/items/5eb673fcdc244ec1ae0b3d84dbd534d1/filegdb?layers=0"
				},
				{
					"@type": "dcat:Distribution",
					"title": "Excel",
					"format": "XLSX",
					"mediaType": "application/vnd.ms-excel",
					"accessURL": "https://www.pacificgeoportal.com/api/download/v1/items/5eb673fcdc244ec1ae0b3d84dbd534d1/excel?layers=0"
				},
				{
					"@type": "dcat:Distribution",
					"title": "Feature Collection",
					"format": "TXT",
					"mediaType": "text/plain",
					"accessURL": "https://www.pacificgeoportal.com/api/download/v1/items/5eb673fcdc244ec1ae0b3d84dbd534d1/featureCollection?layers=0"
				},
				{
					"@type": "dcat:Distribution",
					"title": "GeoPackage",
					"format": "GPKG",
					"mediaType": "application/geopackage+sqlite3",
					"accessURL": "https://www.pacificgeoportal.com/api/download/v1/items/5eb673fcdc244ec1ae0b3d84dbd534d1/geoPackage?layers=0"
				},
				{
					"@type": "dcat:Distribution",
					"title": "KML",
					"format": "KML",
					"mediaType": "application/vnd.google-earth.kml+xml",
					"accessURL": "https://www.pacificgeoportal.com/api/download/v1/items/5eb673fcdc244ec1ae0b3d84dbd534d1/kml?layers=0"
				}
			],
			"theme": [
				"geospatial"
			]
		},
		{
			"@type": "dcat:Dataset",
			"identifier": "https://www.arcgis.com/home/item.html?id=5dc1526435a043e5be1c841727f465f7&sublayer=0",
			"landingPage": "https://www.pacificgeoportal.com/datasets/kiwirail::kiwirail-level-crossings",
			"title": "KiwiRail Level Crossings",
			"description": "<p>Recognised level crossing points including Public and Private level crossings, New Zealand.</p><p>Private crossing data are not fully identified, confirmed, or documented crossing points.</p><p>The location of the point does not represent the physical location of any feature, structure or boundary, and has been positioned in the general vicinity of the level crossing.</p>",
			"keyword": [
				"KiwiRail",
				"Level crossing",
				"ALCAM",
				"NZ",
				"New Zealand",
				"Rail",
				"Crossing",
				"Level"
			],
			"issued": "2018-08-14T01:48:51.000Z",
			"modified": "2022-06-30T21:00:13.898Z",
			"publisher": {
				"name": "KiwiRail"
			},
			"contactPoint": {
				"@type": "vcard:Contact",
				"fn": "gis.support@kiwirail.co.nz",
				"hasEmail": "mailto:gis.support@kiwirail.co.nz"
			},
			"accessLevel": "public",
			"spatial": "167.9383,-46.5987,178.0276,-35.3619",
			"license": "https://creativecommons.org/licenses/by/4.0",
			"distribution": [
				{
					"@type": "dcat:Distribution",
					"title": "ArcGIS Hub Dataset",
					"format": "Web Page",
					"mediaType": "text/html",
					"accessURL": "https://www.pacificgeoportal.com/datasets/kiwirail::kiwirail-level-crossings"
				},
				{
					"@type": "dcat:Distribution",
					"title": "ArcGIS GeoService",
					"format": "ArcGIS GeoServices REST API",
					"mediaType": "application/json",
					"accessURL": "https://services6.arcgis.com/eqX2HMCD3H8MUs6Q/arcgis/rest/services/LevelCrossings/FeatureServer/0"
				},
				{
					"@type": "dcat:Distribution",
					"title": "CSV",
					"format": "CSV",
					"mediaType": "text/csv",
					"accessURL": "https://www.pacificgeoportal.com/api/download/v1/items/5dc1526435a043e5be1c841727f465f7/csv?layers=0"
				},
				{
					"@type": "dcat:Distribution",
					"title": "Shapefile",
					"format": "ZIP",
					"mediaType": "application/zip",
					"accessURL": "https://www.pacificgeoportal.com/api/download/v1/items/5dc1526435a043e5be1c841727f465f7/shapefile?layers=0"
				},
				{
					"@type": "dcat:Distribution",
					"title": "GeoJSON",
					"format": "GeoJSON",
					"mediaType": "application/vnd.geo+json",
					"accessURL": "https://www.pacificgeoportal.com/api/download/v1/items/5dc1526435a043e5be1c841727f465f7/geojson?layers=0"
				},
				{
					"@type": "dcat:Distribution",
					"title": "KML",
					"format": "KML",
					"mediaType": "application/vnd.google-earth.kml+xml",
					"accessURL": "https://www.pacificgeoportal.com/api/download/v1/items/5dc1526435a043e5be1c841727f465f7/kml?layers=0"
				}
			],
			"theme": [
				"geospatial"
			]
		},
		{
			"@type": "dcat:Dataset",
			"identifier": "https://www.arcgis.com/home/item.html?id=9e13b74fd4d743dd94e2f1e35a82adc5&sublayer=0",
			"landingPage": "https://www.pacificgeoportal.com/datasets/kiwirail::kiwirail-land-holdings",
			"title": "KiwiRail Land Holdings",
			"description": "<p><font color='#000000' size='4' style='background-color:rgb(255, 255, 255);'>KiwiRail, New Zealand land boundaries, named by nearest rail location.</font></p><p><font color='#000000' size='4' style='background-color:rgb(255, 255, 255);'>Parcels are categorised as:</font></p><ul><li><font color='#000000' size='4' style='background-color:rgb(255, 255, 255);'>Survey accurate</font></li><li><font color='#000000' size='4' style='background-color:rgb(255, 255, 255);'>Verified against KiwiRail records only</font></li><li><font color='#000000' size='4' style='background-color:rgb(255, 255, 255);'>Unverified, use with caution</font></li></ul><div><span style='font-family:&quot;Droid Sans&quot;, Arial, sans-serif; background-color:rgb(255, 255, 255);'><font color='#000000' size='4'>This dataset contains information about land boundaries owned by New Zealand Railways Corporation (NZRC) and currently managed by KiwiRail Limited (KiwiRail). This dataset does not include any NZRC properties that are managed by Land Information New Zealand (LINZ).</font></span></div>",
			"keyword": [
				"KiwiRail land",
				"New Zealand",
				"NZ",
				"land holding",
				"Parcels",
				"KiwiRail"
			],
			"issued": "2018-05-15T02:21:26.000Z",
			"modified": "2026-11-11T07:02:33.354Z",
			"publisher": {
				"name": "KiwiRail"
			},
			"contactPoint": {
				"@type": "vcard:Contact",
				"fn": "gis.support@kiwirail.co.nz",
				"hasEmail": "mailto:gis.support@kiwirail.co.nz"
			},
			"accessLevel": "public",
			"spatial": "167.9484,-46.5990,178.0273,-35.3246",
			"license": "https://creativecommons.org/licenses/by-nc-nd/4.0",
			"distribution": [
				{
					"@type": "dcat:Distribution",
					"title": "ArcGIS Hub Dataset",
					"format": "Web Page",
					"mediaType": "text/html",
					"accessURL": "https://www.pacificgeoportal.com/datasets/kiwirail::kiwirail-land-holdings"
				},
				{
					"@type": "dcat:Distribution",
					"title": "ArcGIS GeoService",
					"format": "ArcGIS GeoServices REST API",
					"mediaType": "application/json",
					"accessURL": "https://services6.arcgis.com/eqX2HMCD3H8MUs6Q/arcgis/rest/services/LandHolding/FeatureServer/0"
				},
				{
					"@type": "dcat:Distribution",
					"title": "CSV",
					"format": "CSV",
					"mediaType": "text/csv",
					"accessURL": "https://www.pacificgeoportal.com/api/download/v1/items/9e13b74fd4d743dd94e2f1e35a82adc5/csv?layers=0"
				},
				{
					"@type": "dcat:Distribution",
					"title": "Shapefile",
					"format": "ZIP",
					"mediaType": "application/zip",
					"accessURL": "https://www.pacificgeoportal.com/api/download/v1/items/9e13b74fd4d743dd94e2f1e35a82adc5/shapefile?layers=0"
				},
				{
					"@type": "dcat:Distribution",
					"title": "GeoJSON",
					"format": "GeoJSON",
					"mediaType": "application/vnd.geo+json",
					"accessURL": "https://www.pacificgeoportal.com/api/download/v1/items/9e13b74fd4d743dd94e2f1e35a82adc5/geojson?layers=0"
				},
				{
					"@type": "dcat:Distribution",
					"title": "KML",
					"format": "KML",
					"mediaType": "application/vnd.google-earth.kml+xml",
					"accessURL": "https://www.pacificgeoportal.com/api/download/v1/items/9e13b74fd4d743dd94e2f1e35a82adc5/kml?layers=0"
				}
			],
			"theme": [
				"geospatial"
			]
		},
		{
			"@type": "dcat:Dataset",
			"identifier": "https://www.arcgis.com/home/item.html?id=ff8eab5a0724475ca2c1ff4855050d59&sublayer=0",
			"landingPage": "https://www.pacificgeoportal.com/datasets/kiwirail::kiwirail-tunnels",
			"title": "KiwiRail Tunnels",
			"description": "<p style='margin-bottom:1.5rem; margin-top:0px;'>KiwiRail's tunnels on the rail network, represented as a single polyline for each tunnel, which aligns with the track centreline (Main Left/Up Main only) from the start point to end point of the tunnel asset. Tunnels are identified with a combination of tunnel number and line name. Attribute information includes Lat and Lon coordinates (decimal degrees) for the midpoint of each polyline.</p><p style='margin-bottom:1.5rem; margin-top:0px;'>This data is suitable for mapping but not for survey accurate information or exporting to CAD for design (does not include true track geometry/design or elevation).</p><p style='margin-bottom:1.5rem; margin-top:0px;'>Supplied as ESRI Feature Service (polyline) in NZTM.</p>",
			"keyword": [
				"KiwiRail",
				"tunnel",
				"tunnels",
				"NZ",
				"New Zealand"
			],
			"issued": "2018-08-13T21:50:29.000Z",
			"modified": "2026-11-11T07:04:05.200Z",
			"publisher": {
				"name": "KiwiRail"
			},
			"contactPoint": {
				"@type": "vcard:Contact",
				"fn": "gis.support@kiwirail.co.nz",
				"hasEmail": "mailto:gis.support@kiwirail.co.nz"
			},
			"accessLevel": "public",
			"spatial": "170.3927,-45.8991,177.9045,-35.3341",
			"license": "https://creativecommons.org/licenses/by/4.0",
			"distribution": [
				{
					"@type": "dcat:Distribution",
					"title": "ArcGIS Hub Dataset",
					"format": "Web Page",
					"mediaType": "text/html",
					"accessURL": "https://www.pacificgeoportal.com/datasets/kiwirail::kiwirail-tunnels"
				},
				{
					"@type": "dcat:Distribution",
					"title": "ArcGIS GeoService",
					"format": "ArcGIS GeoServices REST API",
					"mediaType": "application/json",
					"accessURL": "https://services6.arcgis.com/eqX2HMCD3H8MUs6Q/arcgis/rest/services/KiwiRailTunnels/FeatureServer/0"
				},
				{
					"@type": "dcat:Distribution",
					"title": "CSV",
					"format": "CSV",
					"mediaType": "text/csv",
					"accessURL": "https://www.pacificgeoportal.com/api/download/v1/items/ff8eab5a0724475ca2c1ff4855050d59/csv?layers=0"
				},
				{
					"@type": "dcat:Distribution",
					"title": "Shapefile",
					"format": "ZIP",
					"mediaType": "application/zip",
					"accessURL": "https://www.pacificgeoportal.com/api/download/v1/items/ff8eab5a0724475ca2c1ff4855050d59/shapefile?layers=0"
				},
				{
					"@type": "dcat:Distribution",
					"title": "GeoJSON",
					"format": "GeoJSON",
					"mediaType": "application/vnd.geo+json",
					"accessURL": "https://www.pacificgeoportal.com/api/download/v1/items/ff8eab5a0724475ca2c1ff4855050d59/geojson?layers=0"
				},
				{
					"@type": "dcat:Distribution",
					"title": "KML",
					"format": "KML",
					"mediaType": "application/vnd.google-earth.kml+xml",
					"accessURL": "https://www.pacificgeoportal.com/api/download/v1/items/ff8eab5a0724475ca2c1ff4855050d59/kml?layers=0"
				},
				{
					"@type": "dcat:Distribution",
					"title": "File Geodatabase",
					"format": "ZIP",
					"mediaType": "application/zip",
					"accessURL": "https://www.pacificgeoportal.com/api/download/v1/items/ff8eab5a0724475ca2c1ff4855050d59/filegdb?layers=0"
				},
				{
					"@type": "dcat:Distribution",
					"title": "Feature Collection",
					"format": "TXT",
					"mediaType": "text/plain",
					"accessURL": "https://www.pacificgeoportal.com/api/download/v1/items/ff8eab5a0724475ca2c1ff4855050d59/featureCollection?layers=0"
				},
				{
					"@type": "dcat:Distribution",
					"title": "Excel",
					"format": "XLSX",
					"mediaType": "application/vnd.ms-excel",
					"accessURL": "https://www.pacificgeoportal.com/api/download/v1/items/ff8eab5a0724475ca2c1ff4855050d59/excel?layers=0"
				},
				{
					"@type": "dcat:Distribution",
					"title": "GeoPackage",
					"format": "GPKG",
					"mediaType": "application/geopackage+sqlite3",
					"accessURL": "https://www.pacificgeoportal.com/api/download/v1/items/ff8eab5a0724475ca2c1ff4855050d59/geoPackage?layers=0"
				},
				{
					"@type": "dcat:Distribution",
					"title": "SQLite Geodatabase",
					"format": "GDB",
					"mediaType": "application/geopackage+sqlite3",
					"accessURL": "https://www.pacificgeoportal.com/api/download/v1/items/ff8eab5a0724475ca2c1ff4855050d59/sqlite?layers=0"
				}
			],
			"theme": [
				"geospatial"
			]
		},
		{
			"@type": "dcat:Dataset",
			"identifier": "https://www.arcgis.com/home/item.html?id=0b38bbe20d3f4ebdab4e15e90ba3edbc&sublayer=0",
			"landingPage": "https://www.pacificgeoportal.com/datasets/kiwirail::nz-railway-network",
			"title": "NZ Railway Network",
			"description": "<p>NZ railway network, each polyline object representing a separate line entity (eg, North Auckland Line, Main South Line), with attribute information identifying full line name. Includes the current operational rail network and also track not managed by KiwiRail. Information does not include the track status. Data includes all existences of railway track, but does not include proposed, historical or uplifted tracks.</p><p>This data is suitable for mapping but not for survey accurate information or exporting to CAD for design (does not include true track geometry/design or elevation).</p><p>NOTE: for a more accurate and detailed version of KiwiRail track data (categorising each track asset by type), please use the <a href='https://kiwirail.maps.arcgis.com/home/item.html?id=13d266cb6dd141879daa76d993e2b0cc' target='_blank' rel='nofollow ugc noopener noreferrer'>KiwiRail Track Centreline</a> dataset.</p>",
			"keyword": [
				"railway",
				"KiwiRail",
				"rail network",
				"track centreline",
				"NZ",
				"New Zealand"
			],
			"issued": "2018-09-25T04:01:57.000Z",
			"modified": "2026-11-11T07:04:34.485Z",
			"publisher": {
				"name": "KiwiRail"
			},
			"contactPoint": {
				"@type": "vcard:Contact",
				"fn": "gis.support@kiwirail.co.nz",
				"hasEmail": "mailto:gis.support@kiwirail.co.nz"
			},
			"accessLevel": "public",
			"spatial": "167.9348,-46.6010,178.0309,-35.3180",
			"license": "https://creativecommons.org/licenses/by/4.0",
			"distribution": [
				{
					"@type": "dcat:Distribution",
					"title": "ArcGIS Hub Dataset",
					"format": "Web Page",
					"mediaType": "text/html",
					"accessURL": "https://www.pacificgeoportal.com/datasets/kiwirail::nz-railway-network"
				},
				{
					"@type": "dcat:Distribution",
					"title": "ArcGIS GeoService",
					"format": "ArcGIS GeoServices REST API",
					"mediaType": "application/json",
					"accessURL": "https://services6.arcgis.com/eqX2HMCD3H8MUs6Q/arcgis/rest/services/NZ_Rail_Network/FeatureServer/0"
				},
				{
					"@type": "dcat:Distribution",
					"title": "CSV",
					"format": "CSV",
					"mediaType": "text/csv",
					"accessURL": "https://www.pacificgeoportal.com/api/download/v1/items/0b38bbe20d3f4ebdab4e15e90ba3edbc/csv?layers=0"
				},
				{
					"@type": "dcat:Distribution",
					"title": "Shapefile",
					"format": "ZIP",
					"mediaType": "application/zip",
					"accessURL": "https://www.pacificgeoportal.com/api/download/v1/items/0b38bbe20d3f4ebdab4e15e90ba3edbc/shapefile?layers=0"
				},
				{
					"@type": "dcat:Distribution",
					"title": "GeoJSON",
					"format": "GeoJSON",
					"mediaType": "application/vnd.geo+json",
					"accessURL": "https://www.pacificgeoportal.com/api/download/v1/items/0b38bbe20d3f4ebdab4e15e90ba3edbc/geojson?layers=0"
				},
				{
					"@type": "dcat:Distribution",
					"title": "KML",
					"format": "KML",
					"mediaType": "application/vnd.google-earth.kml+xml",
					"accessURL": "https://www.pacificgeoportal.com/api/download/v1/items/0b38bbe20d3f4ebdab4e15e90ba3edbc/kml?layers=0"
				},
				{
					"@type": "dcat:Distribution",
					"title": "File Geodatabase",
					"format": "ZIP",
					"mediaType": "application/zip",
					"accessURL": "https://www.pacificgeoportal.com/api/download/v1/items/0b38bbe20d3f4ebdab4e15e90ba3edbc/filegdb?layers=0"
				},
				{
					"@type": "dcat:Distribution",
					"title": "Feature Collection",
					"format": "TXT",
					"mediaType": "text/plain",
					"accessURL": "https://www.pacificgeoportal.com/api/download/v1/items/0b38bbe20d3f4ebdab4e15e90ba3edbc/featureCollection?layers=0"
				},
				{
					"@type": "dcat:Distribution",
					"title": "Excel",
					"format": "XLSX",
					"mediaType": "application/vnd.ms-excel",
					"accessURL": "https://www.pacificgeoportal.com/api/download/v1/items/0b38bbe20d3f4ebdab4e15e90ba3edbc/excel?layers=0"
				},
				{
					"@type": "dcat:Distribution",
					"title": "GeoPackage",
					"format": "GPKG",
					"mediaType": "application/geopackage+sqlite3",
					"accessURL": "https://www.pacificgeoportal.com/api/download/v1/items/0b38bbe20d3f4ebdab4e15e90ba3edbc/geoPackage?layers=0"
				},
				{
					"@type": "dcat:Distribution",
					"title": "SQLite Geodatabase",
					"format": "GDB",
					"mediaType": "application/geopackage+sqlite3",
					"accessURL": "https://www.pacificgeoportal.com/api/download/v1/items/0b38bbe20d3f4ebdab4e15e90ba3edbc/sqlite?layers=0"
				}
			],
			"theme": [
				"geospatial"
			]
		},
		{
			"@type": "dcat:Dataset",
			"identifier": "https://www.arcgis.com/home/item.html?id=fb267ad05d1c46679b4158601e521f46&sublayer=0",
			"landingPage": "https://www.pacificgeoportal.com/datasets/kiwirail::kiwirail-locations",
			"title": "KiwiRail Locations",
			"description": "<p>Recognised location points on the KiwiRail network, including stations (passenger stops), yards, other operational and minor places. Some points exist for the ease of searching a known place-name on the network.</p><p>Attribute information includes:</p><p></p><ul><li>Name</li><li>Status (Station/passenger, Yard, Operational, Place)</li><li>Priority (high priority locations are passenger stopping points and yards, medium priority are other network operational areas, and low priority are place-names)</li></ul><p></p><p>Data does not identify or categorise points as freight stops. Historical network locations are not shown. The location of the point does not represent the physical location of any feature, structure or boundary, and has been positioned in the general vicinity of the place/yard/station.</p>",
			"keyword": [
				"KiwiRail",
				"stations",
				"location",
				"yard",
				"NZ",
				"New Zealand"
			],
			"issued": "2018-08-14T02:25:35.000Z",
			"modified": "2026-11-11T07:04:21.118Z",
			"publisher": {
				"name": "KiwiRail"
			},
			"contactPoint": {
				"@type": "vcard:Contact",
				"fn": "gis.support@kiwirail.co.nz",
				"hasEmail": "mailto:gis.support@kiwirail.co.nz"
			},
			"accessLevel": "public",
			"spatial": "167.9389,-46.5985,178.0208,-35.3261",
			"license": "https://creativecommons.org/licenses/by/4.0",
			"distribution": [
				{
					"@type": "dcat:Distribution",
					"title": "ArcGIS Hub Dataset",
					"format": "Web Page",
					"mediaType": "text/html",
					"accessURL": "https://www.pacificgeoportal.com/datasets/kiwirail::kiwirail-locations"
				},
				{
					"@type": "dcat:Distribution",
					"title": "ArcGIS GeoService",
					"format": "ArcGIS GeoServices REST API",
					"mediaType": "application/json",
					"accessURL": "https://services6.arcgis.com/eqX2HMCD3H8MUs6Q/arcgis/rest/services/RailwayLocations/FeatureServer/0"
				},
				{
					"@type": "dcat:Distribution",
					"title": "CSV",
					"format": "CSV",
					"mediaType": "text/csv",
					"accessURL": "https://www.pacificgeoportal.com/api/download/v1/items/fb267ad05d1c46679b4158601e521f46/csv?layers=0"
				},
				{
					"@type": "dcat:Distribution",
					"title": "Shapefile",
					"format": "ZIP",
					"mediaType": "application/zip",
					"accessURL": "https://www.pacificgeoportal.com/api/download/v1/items/fb267ad05d1c46679b4158601e521f46/shapefile?layers=0"
				},
				{
					"@type": "dcat:Distribution",
					"title": "GeoJSON",
					"format": "GeoJSON",
					"mediaType": "application/vnd.geo+json",
					"accessURL": "https://www.pacificgeoportal.com/api/download/v1/items/fb267ad05d1c46679b4158601e521f46/geojson?layers=0"
				},
				{
					"@type": "dcat:Distribution",
					"title": "KML",
					"format": "KML",
					"mediaType": "application/vnd.google-earth.kml+xml",
					"accessURL": "https://www.pacificgeoportal.com/api/download/v1/items/fb267ad05d1c46679b4158601e521f46/kml?layers=0"
				},
				{
					"@type": "dcat:Distribution",
					"title": "File Geodatabase",
					"format": "ZIP",
					"mediaType": "application/zip",
					"accessURL": "https://www.pacificgeoportal.com/api/download/v1/items/fb267ad05d1c46679b4158601e521f46/filegdb?layers=0"
				},
				{
					"@type": "dcat:Distribution",
					"title": "Feature Collection",
					"format": "TXT",
					"mediaType": "text/plain",
					"accessURL": "https://www.pacificgeoportal.com/api/download/v1/items/fb267ad05d1c46679b4158601e521f46/featureCollection?layers=0"
				},
				{
					"@type": "dcat:Distribution",
					"title": "Excel",
					"format": "XLSX",
					"mediaType": "application/vnd.ms-excel",
					"accessURL": "https://www.pacificgeoportal.com/api/download/v1/items/fb267ad05d1c46679b4158601e521f46/excel?layers=0"
				},
				{
					"@type": "dcat:Distribution",
					"title": "GeoPackage",
					"format": "GPKG",
					"mediaType": "application/geopackage+sqlite3",
					"accessURL": "https://www.pacificgeoportal.com/api/download/v1/items/fb267ad05d1c46679b4158601e521f46/geoPackage?layers=0"
				},
				{
					"@type": "dcat:Distribution",
					"title": "SQLite Geodatabase",
					"format": "GDB",
					"mediaType": "application/geopackage+sqlite3",
					"accessURL": "https://www.pacificgeoportal.com/api/download/v1/items/fb267ad05d1c46679b4158601e521f46/sqlite?layers=0"
				}
			],
			"theme": [
				"geospatial"
			]
		},
		{
			"@type": "dcat:Dataset",
			"identifier": "https://www.arcgis.com/home/item.html?id=13d266cb6dd141879daa76d993e2b0cc&sublayer=0",
			"landingPage": "https://www.pacificgeoportal.com/datasets/kiwirail::kiwirail-track-centreline",
			"title": "KiwiRail Track Centreline",
			"description": "<font size='4'>This dataset provides the centreline of railway track, each polyline segment representing a KiwiRail asset record.  Depiction of each main line, yard track, loop, and link, and identifies it's nearest location (using a KiwiRail location name) and asset ID number.  Does not include Private Sidings or privately owned track. \n\nThis data is suitable for mapping but not for survey accurate information or exporting to CAD for design (does not include true track geometry/design or elevation).\n\nSupplied as ESRI Feature Service (polyline) in NZTM, spatial accuracy +/- 0.5m\n\nNOTE: for a simplified version of the track data for more generic mapping, please use the <a href='https://kiwirail.maps.arcgis.com/home/item.html?id=9641d2543af14609a678522a1e9b252a' target='_blank' rel='nofollow ugc noopener noreferrer'>NZ Railway Network</a> dataset.</font>",
			"keyword": [
				"KiwiRail",
				"track",
				"track centreline",
				"mainL",
				"MainR",
				"yard track",
				"loop",
				"NZ",
				"New Zealand"
			],
			"issued": "2018-08-13T01:38:02.000Z",
			"modified": "2026-11-11T07:03:55.368Z",
			"publisher": {
				"name": "KiwiRail"
			},
			"contactPoint": {
				"@type": "vcard:Contact",
				"fn": "gis.support@kiwirail.co.nz",
				"hasEmail": "mailto:gis.support@kiwirail.co.nz"
			},
			"accessLevel": "public",
			"spatial": "167.9348,-46.5987,178.0307,-35.3965",
			"license": "https://creativecommons.org/licenses/by/4.0",
			"distribution": [
				{
					"@type": "dcat:Distribution",
					"title": "ArcGIS Hub Dataset",
					"format": "Web Page",
					"mediaType": "text/html",
					"accessURL": "https://www.pacificgeoportal.com/datasets/kiwirail::kiwirail-track-centreline"
				},
				{
					"@type": "dcat:Distribution",
					"title": "ArcGIS GeoService",
					"format": "ArcGIS GeoServices REST API",
					"mediaType": "application/json",
					"accessURL": "https://services6.arcgis.com/eqX2HMCD3H8MUs6Q/arcgis/rest/services/KiwiRailTrack/FeatureServer/0"
				},
				{
					"@type": "dcat:Distribution",
					"title": "CSV",
					"format": "CSV",
					"mediaType": "text/csv",
					"accessURL": "https://www.pacificgeoportal.com/api/download/v1/items/13d266cb6dd141879daa76d993e2b0cc/csv?layers=0"
				},
				{
					"@type": "dcat:Distribution",
					"title": "Shapefile",
					"format": "ZIP",
					"mediaType": "application/zip",
					"accessURL": "https://www.pacificgeoportal.com/api/download/v1/items/13d266cb6dd141879daa76d993e2b0cc/shapefile?layers=0"
				},
				{
					"@type": "dcat:Distribution",
					"title": "GeoJSON",
					"format": "GeoJSON",
					"mediaType": "application/vnd.geo+json",
					"accessURL": "https://www.pacificgeoportal.com/api/download/v1/items/13d266cb6dd141879daa76d993e2b0cc/geojson?layers=0"
				},
				{
					"@type": "dcat:Distribution",
					"title": "KML",
					"format": "KML",
					"mediaType": "application/vnd.google-earth.kml+xml",
					"accessURL": "https://www.pacificgeoportal.com/api/download/v1/items/13d266cb6dd141879daa76d993e2b0cc/kml?layers=0"
				},
				{
					"@type": "dcat:Distribution",
					"title": "File Geodatabase",
					"format": "ZIP",
					"mediaType": "application/zip",
					"accessURL": "https://www.pacificgeoportal.com/api/download/v1/items/13d266cb6dd141879daa76d993e2b0cc/filegdb?layers=0"
				},
				{
					"@type": "dcat:Distribution",
					"title": "Feature Collection",
					"format": "TXT",
					"mediaType": "text/plain",
					"accessURL": "https://www.pacificgeoportal.com/api/download/v1/items/13d266cb6dd141879daa76d993e2b0cc/featureCollection?layers=0"
				},
				{
					"@type": "dcat:Distribution",
					"title": "Excel",
					"format": "XLSX",
					"mediaType": "application/vnd.ms-excel",
					"accessURL": "https://www.pacificgeoportal.com/api/download/v1/items/13d266cb6dd141879daa76d993e2b0cc/excel?layers=0"
				},
				{
					"@type": "dcat:Distribution",
					"title": "GeoPackage",
					"format": "GPKG",
					"mediaType": "application/geopackage+sqlite3",
					"accessURL": "https://www.pacificgeoportal.com/api/download/v1/items/13d266cb6dd141879daa76d993e2b0cc/geoPackage?layers=0"
				},
				{
					"@type": "dcat:Distribution",
					"title": "SQLite Geodatabase",
					"format": "GDB",
					"mediaType": "application/geopackage+sqlite3",
					"accessURL": "https://www.pacificgeoportal.com/api/download/v1/items/13d266cb6dd141879daa76d993e2b0cc/sqlite?layers=0"
				}
			],
			"theme": [
				"geospatial"
			]
		},
		{
			"@type": "dcat:Dataset",
			"identifier": "https://www.arcgis.com/home/item.html?id=35672bbb733c4e2db292be3d60312819&sublayer=0",
			"landingPage": "https://www.pacificgeoportal.com/datasets/kiwirail::kiwirail-km-posts",
			"title": "KiwiRail KM Posts",
			"description": "<div>KiwiRail kilometre posts or pegs depicting every full (and sometimes half) km point. For use in identifying linear locations on the railway network. Every point object has a number (km reference) and line name, to identify its position on the network.</div><div>&nbsp;</div><div>Pegs are shown located on the track centreline, parallel to actual peg location (which is not necessarily exactly 1000m or 500m from previous peg location).</div><div>&nbsp;</div><div>Data capture was a desktop exercise and peg location is to the best of our knowledge, but has not been verified in the field for all locations. Data does not include all pegs which are located on the rail network.</div>",
			"keyword": [
				"NZ",
				"New Zealand",
				"KM",
				"Posts",
				"Pegs",
				"Liner Referencing",
				"Rail",
				"Network"
			],
			"issued": "2020-06-04T21:39:57.000Z",
			"modified": "2026-11-11T07:01:55.532Z",
			"publisher": {
				"name": "KiwiRail"
			},
			"contactPoint": {
				"@type": "vcard:Contact",
				"fn": "gis.support@kiwirail.co.nz",
				"hasEmail": "mailto:gis.support@kiwirail.co.nz"
			},
			"accessLevel": "public",
			"spatial": "167.9465,-46.5958,178.0267,-35.3246",
			"license": "https://creativecommons.org/licenses/by/4.0",
			"distribution": [
				{
					"@type": "dcat:Distribution",
					"title": "ArcGIS Hub Dataset",
					"format": "Web Page",
					"mediaType": "text/html",
					"accessURL": "https://www.pacificgeoportal.com/datasets/kiwirail::kiwirail-km-posts"
				},
				{
					"@type": "dcat:Distribution",
					"title": "ArcGIS GeoService",
					"format": "ArcGIS GeoServices REST API",
					"mediaType": "application/json",
					"accessURL": "https://services6.arcgis.com/eqX2HMCD3H8MUs6Q/arcgis/rest/services/KiwiRail_KM_Posts/FeatureServer/0"
				},
				{
					"@type": "dcat:Distribution",
					"title": "CSV",
					"format": "CSV",
					"mediaType": "text/csv",
					"accessURL": "https://www.pacificgeoportal.com/api/download/v1/items/35672bbb733c4e2db292be3d60312819/csv?layers=0"
				},
				{
					"@type": "dcat:Distribution",
					"title": "Shapefile",
					"format": "ZIP",
					"mediaType": "application/zip",
					"accessURL": "https://www.pacificgeoportal.com/api/download/v1/items/35672bbb733c4e2db292be3d60312819/shapefile?layers=0"
				},
				{
					"@type": "dcat:Distribution",
					"title": "GeoJSON",
					"format": "GeoJSON",
					"mediaType": "application/vnd.geo+json",
					"accessURL": "https://www.pacificgeoportal.com/api/download/v1/items/35672bbb733c4e2db292be3d60312819/geojson?layers=0"
				},
				{
					"@type": "dcat:Distribution",
					"title": "KML",
					"format": "KML",
					"mediaType": "application/vnd.google-earth.kml+xml",
					"accessURL": "https://www.pacificgeoportal.com/api/download/v1/items/35672bbb733c4e2db292be3d60312819/kml?layers=0"
				},
				{
					"@type": "dcat:Distribution",
					"title": "File Geodatabase",
					"format": "ZIP",
					"mediaType": "application/zip",
					"accessURL": "https://www.pacificgeoportal.com/api/download/v1/items/35672bbb733c4e2db292be3d60312819/filegdb?layers=0"
				},
				{
					"@type": "dcat:Distribution",
					"title": "Feature Collection",
					"format": "TXT",
					"mediaType": "text/plain",
					"accessURL": "https://www.pacificgeoportal.com/api/download/v1/items/35672bbb733c4e2db292be3d60312819/featureCollection?layers=0"
				},
				{
					"@type": "dcat:Distribution",
					"title": "Excel",
					"format": "XLSX",
					"mediaType": "application/vnd.ms-excel",
					"accessURL": "https://www.pacificgeoportal.com/api/download/v1/items/35672bbb733c4e2db292be3d60312819/excel?layers=0"
				},
				{
					"@type": "dcat:Distribution",
					"title": "GeoPackage",
					"format": "GPKG",
					"mediaType": "application/geopackage+sqlite3",
					"accessURL": "https://www.pacificgeoportal.com/api/download/v1/items/35672bbb733c4e2db292be3d60312819/geoPackage?layers=0"
				},
				{
					"@type": "dcat:Distribution",
					"title": "SQLite Geodatabase",
					"format": "GDB",
					"mediaType": "application/geopackage+sqlite3",
					"accessURL": "https://www.pacificgeoportal.com/api/download/v1/items/35672bbb733c4e2db292be3d60312819/sqlite?layers=0"
				}
			],
			"theme": [
				"geospatial"
			]
		},
		{
			"@type": "dcat:Dataset",
			"identifier": "https://www.arcgis.com/home/item.html?id=0e71d0e63c494d75b2bc897b7515f89a",
			"landingPage": "https://www.pacificgeoportal.com/datasets/esri::world-soils-harmonized-world-soil-database-chemistry-mature-support",
			"title": "World Soils Harmonized World Soil Database - Chemistry (Mature Support)",
			"description": "<font color='#dc143c'>Important Note:</font> <b>This item is in </b><a href='https://goto.arcgis.com/lifecycle/content' target='_blank' rel='nofollow ugc noopener noreferrer'><b>mature support</b></a><b> as of April 2024 and will be retired in December 2026.</b> Please use the following layers as replacements: <a href='https://www.arcgis.com/home/item.html?id=0961138215b8460e9f4e436d38c3b3b4' target='_blank' rel='nofollow ugc noopener noreferrer'>World Soils 250m pH</a>, <a href='https://www.arcgis.com/home/item.html?id=3f41f5aeec484d608f5363c020c45dae' target='_blank' rel='nofollow ugc noopener noreferrer'>World Soils 250m Cation Exchange Capacity</a>, <a href='https://www.arcgis.com/home/item.html?id=9d097b7fa0ae40ca8aef757f163d5f75' target='_blank' rel='nofollow ugc noopener noreferrer'>World Soils 250m Nitrogen</a>, <a href='https://www.arcgis.com/home/item.html?id=efd491203720432d893f3dedf9eedf3d' target='_blank' rel='nofollow ugc noopener noreferrer'>World Soils 250m Organic Carbon Density</a>, <a href='https://www.arcgis.com/home/item.html?id=496c19426413472194b10b2b0952fccd' target='_blank' rel='nofollow ugc noopener noreferrer'>World Soils 250m Organic Carbon Stocks</a>, <a href='https://www.arcgis.com/home/item.html?id=55bc9bfbc2b341fc8b1be3936fe45f06' target='_blank' rel='nofollow ugc noopener noreferrer'>World Soils 250m Soil Organic Carbon</a>. Esri recommends updating your maps and apps to use the new version.<div>   <div>Soil is a key natural resource that provides the foundation of basic <a href='https://en.wikipedia.org/wiki/Ecosystem_services' rel='nofollow ugc'>ecosystem services</a>. Soil determines the types of farms and forests that can grow on a landscape. Soil filters water. Soil helps regulate the Earth's climate by storing large amounts of carbon. Activities that degrade soils reduce the value of the ecosystem services that soil provides. For example, since 1850 35% of human caused green house gas emissions are linked to land use change. The <a href='https://www.soils.org/' rel='nofollow ugc'>Soil Science Society of America</a> is a good source of of additional information.<br /></div><div><br /></div><div>The mineral composition of underlying rock, the amount and type of organic material from plants and climatic and other environmental factors affect the chemistry of the soil. Chemical composition and processes determine how and what type of soil forms at a given location and what type of agriculture the areas wil support.<br /></div><div><br /></div><font size='3'>Dataset Summary</font><div><br /></div><div>This layer provides access to a 30 arc-second (roughly 1 km) cell-sized raster with attributes related to the chemistry of soil derived from the Harmonized World Soil Database v 1.2. The values in this layer are for the dominant soil in each mapping unit (sequence field = 1).<br /></div><div><br /><div>Fields for topsoil (0-30 cm) and subsoil (30-100 cm) are available for each of these soil chemistry attributes:<div><ul><li>Organic Carbon - % weight<br /></li><li>Calcium Carbonate - % weight<br /></li><li>Gypsum - % weight<br /></li><li>Salinity - Electrical Conductivity - dS/m</li><li>pH</li></ul></div><div>Additionally, 4 class description fields were added by Esri based on the document <a href='https://webarchive.iiasa.ac.at/Research/LUC/External-World-soil-database/HWSD_Documentation.pdf' rel='nofollow ugc'>Harmonized World Soil Database Version 1.2</a> for use in web map pop-ups:<br /></div><div><ul><li>pH Class Description<br /></li><li>Calcium Carbonate Class Description<br /></li><li>Gypsum Class Description<br /></li><li>Salinity - Electrical Conductivity - Class Description<br /></li></ul><div>The layer is symbolized with the Topsoil pH field.<br /></div></div><div><br /></div><div>The document <a href='https://webarchive.iiasa.ac.at/Research/LUC/External-World-soil-database/HWSD_Documentation.pdf' rel='nofollow ugc'>Harmonized World Soil Database Version 1.2</a> provides more detail on the soil chemistry attributes contained in this layer.<br /></div><div><br /></div><div>Other attributes contained in this layer include:<br /></div><div><ul><li>Soil Mapping Unit Name - the name of the spatially dominant major soil group<br /></li><li>Soil Mapping Unit Symbol - a two letter code for labeling the spatially dominant major soil group in thematic maps</li><li>Data Source - the HWSD is an aggregation of datasets. The data sources are the <a href='https://eusoils.jrc.ec.europa.eu/esdb_archive/ESDB/Index.htm' rel='nofollow ugc'>European Soil Database</a> (ESDB), the 1:1 million soil map of China (CHINA), the Soil and Terrain Database Program (SOTWIS), and the Digital Soil Map of the World (DSMW).</li><li>Percentage of Mapping Unit covered by dominant component</li></ul><div><div>More information on the Harmonized World Soil Database is available <a href='https://webarchive.iiasa.ac.at/Research/LUC/External-World-soil-database/HTML/' rel='nofollow ugc'>here</a>.</div><div><br /></div><div>Other layers created from the Harmonized World Soil Database are available on ArcGIS Online:</div></div><div><br /></div><div><div><a href='https://www.arcgis.com/home/item.html?id=9b1cefacf7be47ab93c2dab2e2f24d68' rel='nofollow ugc'>World Soils Harmonized World Soil Database - Bulk Density</a><br /></div><div><div><a href='https://www.arcgis.com/home/item.html?id=85e74e0afd044ebba2d113ae1e95d6bb' rel='nofollow ugc'>World Soils Harmonized World Soil Database - Exchange Capacity</a><br /></div><div><a href='https://www.arcgis.com/home/item.html?id=af37c984900c48618b158352fb41da4d' rel='nofollow ugc'>World Soils Harmonized World Soil Database – General</a><br /></div><div><a href='https://www.arcgis.com/home/item.html?id=233818f3e40a4bc39e4f8a942c19e6fb' rel='nofollow ugc'>World Soils Harmonized World Soil Database – Hydric</a><br /></div><div><a href='https://www.arcgis.com/home/item.html?id=aa9a3a2dc6924f46adc5a999787f7961' rel='nofollow ugc'>World Soils Harmonized World Soil Database – Texture</a></div></div></div><div><div><br /></div></div><div><div>The authors of this data set request that projects using these data include the following citation:</div><div><br /></div><div>FAO/IIASA/ISRIC/ISSCAS/JRC, 2012. <i>Harmonized World Soil Database (version 1.2)</i>. FAO, Rome, Italy and IIASA, Laxenburg, Austria.<br /></div><div><font size='3'><br /></font></div><div><font size='3'>What can you do with this layer?</font></div><div><span><br /></span></div><div><span>This layer is suitable for both visualization and analysis. It can be used in ArcGIS Online in web maps and applications and can be used in ArcGIS Desktop.</span></div></div><div><span><br /></span></div><div>This layer has <a href='https://resources.arcgis.com/en/help/main/10.2/index.html#//00sp00000007000000' rel='nofollow ugc'>query</a>, <a href='https://resources.arcgis.com/en/help/main/10.2/index.html#//00s500000010000000' rel='nofollow ugc'>identify</a>, and <a href='https://resources.arcgis.com/en/help/main/10.2/index.html#/Downloading_data_from_an_image_service/00sp00000016000000/' rel='nofollow ugc'>export</a> image services available. This layer is restricted to a maximum area of 16,000 x 16,000 pixels - an area 4,000 kilometers on a side or an area approximately the size of Europe. </div><div><br /></div><div>The source data for this layer are available <a href='https://webarchive.iiasa.ac.at/Research/LUC/External-World-soil-database/HTML/' rel='nofollow ugc'>here</a>. </div><div><div><div><br /></div><div><div style='margin:0px; padding:0px;'>This layer is part of a larger collection of <a href='https://www.arcgis.com/home/group.html?id=38f9a41bdea24e9b9d913cedbfc9216b#overview' target='_blank' rel='nofollow ugc noopener noreferrer'>landscape layers</a> that you can use to perform a wide variety of mapping and analysis tasks.</div><div style='margin:0px; padding:0px;'><br /></div><div style='margin:0px; padding:0px;'>The <a href='https://livingatlas.arcgis.com' target='_blank' rel='nofollow ugc noopener noreferrer'>Living Atlas of the World</a> provides an easy way to explore the landscape layers and many other beautiful and authoritative maps on hundreds of topics.</div></div><div><br /></div><div><a href='https://geonet.esri.com' rel='nofollow ugc'>Geonet</a> is a good resource for learning more about landscape layers and the Living Atlas of the World. To get started follow these links:</div><div><ul><li><a href='https://geonet.esri.com/groups/livingatlas?sr=search&amp;searchId=ec0b33d6-14bb-4319-8ad5-38961b68610e&amp;searchIndex=0' rel='nofollow ugc'>Living Atlas Discussion Group</a></li><li><a href='https://geonet.esri.com/groups/soil-data' rel='nofollow ugc'>Soil Data Discussion Group</a></li></ul></div><div><div>The <a href='https://goto.arcgisonline.com/arcgis/Ecological_Land_Units/RolloutBlog' rel='nofollow ugc'>Esri Insider Blog</a> provides an introduction to the Ecophysiographic Mapping project.</div></div></div></div></div></div></div></div>",
			"keyword": [
				"landscape6",
				"retiring-2026-12"
			],
			"issued": "2014-11-18T21:43:32.000Z",
			"modified": "2024-04-26T03:44:44.000Z",
			"publisher": {
				"name": "Esri"
			},
			"contactPoint": {
				"@type": "vcard:Contact",
				"fn": "esri_landscape2",
				"hasEmail": "{{orgContactEmail}}"
			},
			"accessLevel": "public",
			"spatial": "-180.0000,-89.0001,180.0000,89.0000",
			"license": "<p><img src='https://downloads.esri.com/blogs/arcgisonline/esrilogo_new.png' width='113' height='43' />This work is licensed under the Esri Master License Agreement.&nbsp;</p><div><a target='_blank' href='https://goto.arcgis.com/termsofuse/viewsummary' rel='nofollow ugc noopener noreferrer'>View Summary</a> | <a target='_blank' href='https://goto.arcgis.com/termsofuse/viewtermsofuse' rel='nofollow ugc noopener noreferrer'>View Terms of Use</a></div><div>&nbsp;</div><div><span style='color:#dc143c;'>Important Note:</span> This item requires an ArcGIS Online organizational subscription or an ArcGIS Developer account and does not consume credits. To access this item, you'll need to do one of the following:</div><div><ul><li>Sign in with an account that is a member of an organizational subscription</li><li>Sign in with a developer account</li><li><a target='_blank' href='https://goto.arcgis.com/termsofuse/registeranapplication' rel='nofollow ugc noopener noreferrer'>Register an application</a> and use your application's credentials.<br />&nbsp;</li></ul><p>If you don't have an account, you can sign up for a <a target='_blank' href='https://goto.arcgis.com/features/trial' rel='nofollow ugc noopener noreferrer'>free trial of ArcGIS</a> or a <a target='_blank' href='https://goto.arcgis.com/developers/signup' rel='nofollow ugc noopener noreferrer'>free ArcGIS Developer account</a>.</p></div>",
			"distribution": [
				{
					"@type": "dcat:Distribution",
					"title": "ArcGIS Hub Dataset",
					"format": "Web Page",
					"mediaType": "text/html",
					"accessURL": "https://www.pacificgeoportal.com/datasets/esri::world-soils-harmonized-world-soil-database-chemistry-mature-support"
				},
				{
					"@type": "dcat:Distribution",
					"title": "ArcGIS GeoService",
					"format": "ArcGIS GeoServices REST API",
					"mediaType": "application/json",
					"accessURL": "https://landscape6.arcgis.com/arcgis/rest/services/World_Soils_HWSD_Chemistry/ImageServer"
				}
			],
			"theme": [
				"geospatial"
			]
		},
		{
			"@type": "dcat:Dataset",
			"identifier": "https://www.arcgis.com/home/item.html?id=aa9a3a2dc6924f46adc5a999787f7961",
			"landingPage": "https://www.pacificgeoportal.com/datasets/esri::world-soils-harmonized-world-soil-database-texture-mature-support",
			"title": "World Soils Harmonized World Soil Database - Texture (Mature Support)",
			"description": "<font color='#dc143c'>Important Note:</font> <b>This item is in </b><a href='https://goto.arcgis.com/lifecycle/content' target='_blank' rel='nofollow ugc noopener noreferrer'><b>mature support</b></a><b> as of April 2024 and will be retired in December 2026.</b> Please use the following layers at replacements: <a href='https://www.arcgis.com/home/item.html?id=84fb10f8fc914e6193a6f80b8f56fbbd' target='_blank' rel='nofollow ugc noopener noreferrer'>World Soils 250m Percent Sand</a>, <a href='https://www.arcgis.com/home/item.html?id=c1b1a3c540f34900b0e35b1ca611f14a' target='_blank' rel='nofollow ugc noopener noreferrer'>World Soils 250m Percent Silt</a>, <a href='https://www.arcgis.com/home/item.html?id=1bfc47d2a0d544bea70588f81aac8afb' target='_blank' rel='nofollow ugc noopener noreferrer'>World Soils 250m Percent Clay</a>. Esri recommends updating your maps and apps to use the new version.<div>   <div>Soil is a key natural resource that provides the foundation of basic <a href='https://en.wikipedia.org/wiki/Ecosystem_services' rel='nofollow ugc'>ecosystem services</a>. Soil determines the types of farms and forests that can grow on a landscape. Soil filters water. Soil helps regulate the Earth's climate by storing large amounts of carbon. Activities that degrade soils reduce the value of the ecosystem services that soil provides. For example, since 1850 35% of human caused green house gas emissions are linked to land use change. The <a href='https://www.soils.org/' rel='nofollow ugc'>Soil Science Society of America</a> is a good source of of additional information.<br /></div><div><br /></div><div>Soil texture is an important factor determining which kinds of plants can be grown in a particular location. Texture determines a soil's susceptibility to erosion or compaction and how well a soil holds nutrients and water. For example sandy soils tend to be well drained and dry quickly often holding few nutrients while clay soils may hold much more water and many more plant nutrients.</div><div><br /></div><font size='3'>Dataset Summary</font><div><br /></div><div>This layer provides access to a 30 arc-second (roughly 1 km) cell-sized raster with attributes related to soil texture derived from the Harmonized World Soil Database v 1.2. The values in this layer are for the dominant soil in each mapping unit (sequence field = 1).</div><div><br /></div><div>Fields for topsoil (0-30 cm) and subsoil (30-100 cm) are available for each of these attributes related to soil texture:</div><div><ul><li>USDA Texture Class<br /></li><li>Gravel - % volume<br /></li><li>Sand - % weight<br /></li><li>Silt - % weight<br /></li><li>Clay - % weight</li></ul></div><div><div>The layer is symbolized with the topsoil texture class.</div><div><br /></div><div><div>The document Harmonized World Soil Database Version 1.2 provides more detail on the soil texture attributes contained in this layer.<br /></div><div><br /></div><div>Other attributes contained in this layer include:<br /></div><div><ul><li>Soil Mapping Unit Name - the name of the spatially dominant major soil group<br /></li><li>Soil Mapping Unit Symbol - a two letter code for labeling the spatially dominant major soil group in thematic maps</li><li>Data Source - the HWSD is an aggregation of datasets. The data sources are the <a href='https://eusoils.jrc.ec.europa.eu/esdb_archive/ESDB/Index.htm' rel='nofollow ugc'>European Soil Database</a> (ESDB), the 1:1 million soil map of China (CHINA), <a href='https://www.isric.org/projects/soil-and-terrain-database-soter-programme' rel='nofollow ugc'>the Soil and Terrain Database Program</a> (SOTWIS), and the Digital Soil Map of the World (DSMW).</li><li>Percentage of Mapping Unit covered by dominant component</li></ul><div><div>More information on the Harmonized World Soil Database is available <a href='https://webarchive.iiasa.ac.at/Research/LUC/External-World-soil-database/HTML/' rel='nofollow ugc'>here</a>.</div><div><br /></div><div>Other layers created from the Harmonized World Soil Database are available on ArcGIS Online:</div></div><div><br /></div><div><div><a href='https://www.arcgis.com/home/item.html?id=9b1cefacf7be47ab93c2dab2e2f24d68' rel='nofollow ugc'>World Soils Harmonized World Soil Database - Bulk Density</a><br /></div><div><div><a href='https://www.arcgis.com/home/item.html?id=0e71d0e63c494d75b2bc897b7515f89a' rel='nofollow ugc'>World Soils Harmonized World Soil Database – Chemistry</a><br /></div><div><a href='https://www.arcgis.com/home/item.html?id=85e74e0afd044ebba2d113ae1e95d6bb' rel='nofollow ugc'>World Soils Harmonized World Soil Database - Exchange Capacity</a><br /></div><div><a href='https://www.arcgis.com/home/item.html?id=af37c984900c48618b158352fb41da4d' rel='nofollow ugc'>World Soils Harmonized World Soil Database – General</a><br /></div><div><a href='https://www.arcgis.com/home/item.html?id=233818f3e40a4bc39e4f8a942c19e6fb' rel='nofollow ugc'>World Soils Harmonized World Soil Database – Hydric</a></div></div></div><div><div><br /></div></div></div></div></div><div><div>The authors of this data set request that projects using these data include the following citation:</div><div><br /></div><div>FAO/IIASA/ISRIC/ISSCAS/JRC, 2012. <i>Harmonized World Soil Database (version 1.2)</i>. FAO, Rome, Italy and IIASA, Laxenburg, Austria.</div><div><span style='font-size:medium;'><br /></span></div><div><span style='font-size:medium;'>What can you do with this layer?</span></div><div><br /></div><div>This layer is suitable for both visualization and analysis. It can be used in ArcGIS Online in web maps and applications and can be used in ArcGIS Desktop.</div></div><div><div>This layer has <a href='https://resources.arcgis.com/en/help/main/10.2/index.html#//00sp00000007000000' rel='nofollow ugc'>query</a>, <a href='https://resources.arcgis.com/en/help/main/10.2/index.html#//00s500000010000000' rel='nofollow ugc'>identify</a>, and <a href='https://resources.arcgis.com/en/help/main/10.2/index.html#/Downloading_data_from_an_image_service/00sp00000016000000/' rel='nofollow ugc'>export</a> image services available. This layer is restricted to a maximum area of 16,000 x 16,000 pixels - an area 4,000 kilometers on a side or an area approximately the size of Europe. </div><div><br /></div><div><div>The source data for this layer are available <a href='https://webarchive.iiasa.ac.at/Research/LUC/External-World-soil-database/HTML/' rel='nofollow ugc'>here</a>.</div><div><br /></div><div><div><div><div style='margin:0px; padding:0px;'>This layer is part of a larger collection of <a href='https://www.arcgis.com/home/group.html?id=38f9a41bdea24e9b9d913cedbfc9216b#overview' target='_blank' rel='nofollow ugc noopener noreferrer'>landscape layers</a> that you can use to perform a wide variety of mapping and analysis tasks.</div><div style='margin:0px; padding:0px;'><br /></div><div style='margin:0px; padding:0px;'>The <a href='https://livingatlas.arcgis.com' target='_blank' rel='nofollow ugc noopener noreferrer'>Living Atlas of the World</a> provides an easy way to explore the landscape layers and many other beautiful and authoritative maps on hundreds of topics.</div></div></div></div></div></div></div>",
			"keyword": [
				"landscape6",
				"retiring-2026-12"
			],
			"issued": "2014-11-18T21:44:06.000Z",
			"modified": "2024-04-26T03:43:14.000Z",
			"publisher": {
				"name": "Esri"
			},
			"contactPoint": {
				"@type": "vcard:Contact",
				"fn": "esri_landscape2",
				"hasEmail": "{{orgContactEmail}}"
			},
			"accessLevel": "public",
			"spatial": "-180.0000,-89.0001,180.0000,89.0000",
			"license": "<p><img src='https://downloads.esri.com/blogs/arcgisonline/esrilogo_new.png' />This work is licensed under the Esri Master License Agreement.&nbsp;</p><div><a target='_blank' href='https://goto.arcgis.com/termsofuse/viewsummary' rel='nofollow ugc noopener noreferrer'>View Summary</a> | <a target='_blank' href='https://goto.arcgis.com/termsofuse/viewtermsofuse' rel='nofollow ugc noopener noreferrer'>View Terms of Use</a></div><div>&nbsp;</div><div><span style='color:#dc143c;'>Important Note:</span> This item requires an ArcGIS Online organizational subscription or an ArcGIS Developer account and does not consume credits. To access this item, you'll need to do one of the following:</div><div><ul><li>Sign in with an account that is a member of an organizational subscription</li><li>Sign in with a developer account</li><li><a target='_blank' href='https://goto.arcgis.com/termsofuse/registeranapplication' rel='nofollow ugc noopener noreferrer'>Register an application</a> and use your application's credentials.<br />&nbsp;</li></ul><p>If you don't have an account, you can sign up for a <a target='_blank' href='https://goto.arcgis.com/features/trial' rel='nofollow ugc noopener noreferrer'>free trial of ArcGIS</a> or a <a target='_blank' href='https://goto.arcgis.com/developers/signup' rel='nofollow ugc noopener noreferrer'>free ArcGIS Developer account</a>.</p></div>",
			"distribution": [
				{
					"@type": "dcat:Distribution",
					"title": "ArcGIS Hub Dataset",
					"format": "Web Page",
					"mediaType": "text/html",
					"accessURL": "https://www.pacificgeoportal.com/datasets/esri::world-soils-harmonized-world-soil-database-texture-mature-support"
				},
				{
					"@type": "dcat:Distribution",
					"title": "ArcGIS GeoService",
					"format": "ArcGIS GeoServices REST API",
					"mediaType": "application/json",
					"accessURL": "https://landscape6.arcgis.com/arcgis/rest/services/World_Soils_HWSD_Texture/ImageServer"
				}
			],
			"theme": [
				"geospatial"
			]
		},
		{
			"@type": "dcat:Dataset",
			"identifier": "https://www.arcgis.com/home/item.html?id=1453082255024699af55c960bc3dc1fe",
			"landingPage": "https://www.pacificgeoportal.com/datasets/esri::global-land-cover-1992-2020",
			"title": "Global Land Cover 1992-2020",
			"description": "<div>This layer is a time series of the annual ESA CCI (Climate Change Initiative) land cover maps of the world. ESA has produced land cover maps for the years 1992-2020. These are available at the <a href='https://climate.esa.int/en/' target='_blank' rel='nofollow ugc noopener noreferrer'>European Space Agency Climate Change Initiative website</a>.</div><div><br /></div><div><span style='font-weight:bold;'>Time Extent: </span>1992-2020<br /><span style='font-weight:bold;'>Cell Size: </span>300 meter <br /><span style='font-weight:bold;'>Source Type:</span> Thematic<br /><span style='font-weight:bold;'>Pixel Type:</span> 8 Bit Unsigned<br /><span style='font-weight:bold;'>Data Projection: </span>GCS WGS84<br /><span style='font-weight:bold;'>Mosaic Projection:</span> Web Mercator Auxiliary Sphere <br /><span style='font-weight:bold;'>Extent: </span>Global<br /><span style='font-weight:bold;'>Source:</span> ESA Climate Change Initiative<br /><span style='font-weight:bold;'>Update Cycle:</span> Annual until 2020, no updates thereafter<br /></div><div><br /></div><div><font size='4'><b>What can you do with this layer? </b></font><br /><br />This layer may be added to ArcGIS Online maps and applications and shown in a time series to watch a &quot;time lapse&quot; view of land cover change since 1992 for any part of the world. The same behavior exists when the layer is added to ArcGIS Pro. <br /><br />In addition to displaying all layers in a series, this layer may be queried so that only one year is displayed in a map.  <br /><br />This layer can be used in analysis. For example, the layer may be added to ArcGIS Pro with a query set to display just one year. Then, an area count of land cover types may be produced for a feature dataset using the zonal statistics tool. Statistics may be compared with the statistics from other years to show a trend. <br /><br />To sum up area by land cover using this service, or any other analysis, be sure to use an equal area projection, such as Albers or <a href='https://desktop.arcgis.com/en/arcmap/latest/map/projections/equal-earth.htm' target='_blank' rel='nofollow ugc noopener noreferrer'>Equal Earth</a>. <br /></div><div><br /></div><div><span style='font-weight:bold;'><font size='4'>Different Classifications Available to Map </font><br /></span></div><div><br /></div><div>Five processing templates are included in this layer. The processing templates may be used to display a smaller set of land cover classes.<br /><i><br />Cartographic Renderer (Default Template)</i><br />Displays all ESA CCI land cover classes.*<br /><br /><i>Forested lands Template</i><br />The forested lands template shows only forested lands (classes 50-90).<br /><br /><i>Urban Lands Template</i><br />The urban lands template shows only urban areas (class 190).<br /><br /><i>Converted Lands Template</i><br />The converted lands template shows only urban lands and lands converted to agriculture (classes 10-40 and 190).</div><div><br /></div><div><i>Simplified Renderer</i><br />Displays the map in ten simple classes which match the ten simplified classes used in 2050 Land Cover projections from Clark University.<br /></div><div><br /></div><div>Any of these variables can be displayed or analyzed by selecting their processing template. In ArcGIS Online, select the Image Display Options on the layer. Then pull down the list of variables from the Renderer options. Click Apply and Close. In ArcGIS Pro, go into the Layer Properties. Select Processing Templates from the left hand menu. From the Processing Template pull down menu, select the variable to display. <br /></div><div><br /></div><div><span style='font-weight:bold;'>Using Time </span><br />By default, the map will display as a time series animation, one year per frame. A time slider will appear when you add this layer to your map. To see the most current data, move the time slider until you see the most current year. <br /></div><div><br /></div><div>In addition to displaying the past quarter century of land cover maps as an animation, this time series can also display just one year of data by use of a definition query. For a step by step example using ArcGIS Pro on how to display just one year of this layer, as well as to compare one year to another, see the blog called <a href='https://www.esri.com/arcgis-blog/products/arcgis-pro/water/changing-hydrology-calculating-impervious-surface-change-with-arcgis-pro/' target='_blank' rel='nofollow ugc noopener noreferrer'>Calculating Impervious Surface Change</a>. <br /><br /><span style='font-weight:bold;'>Hierarchical Classification</span><br />Land cover types are defined using the land cover classification (LCCS) developed by the United Nations, FAO. It is designed to be as compatible as possible with other products, namely GLCC2000, GlobCover 2005 and 2009. <br /></div><div><br /></div><div>This is a heirarchical classification system. For example, class 60 means &quot;closed to open&quot; canopy broadleaved deciduous tree cover. But in some places a more specific type of broadleaved deciduous tree cover may be available. In that case, a more specific code 61 or 62 may be used which specifies &quot;open&quot; (61) or &quot;closed&quot; (62) cover. <br /></div><div><br /></div><div><span style='font-weight:bold;'>Land Cover Processing </span></div><div>To provide consistency over time, these maps are produced from baseline land cover maps, and are revised for changes each year depending on the best available satellite data from each period in time. These revisions were made from AVHRR 1km time series from 1992 to 1999, SPOT-VGT time series between 1999 and 2013, and PROBA-V data for years 2013, 2014 and 2015. When MERIS FR or PROBA-V time series are available, changes detected at 1 km are re-mapped at 300 m. The last step consists in back- and up-dating the 10-year baseline LC map to produce the 24 annual LC maps from 1992 to 2015. <br /><br /><span style='font-weight:bold;'>Source data </span><br />The datasets behind this layer were extracted from NetCDF files and TIFF files produced by ESA. Years 1992-2015 were acquired from ESA CCI LC version 2.0.7 in TIFF format, and years 2016-2018 were acquired from version 2.1.1 in NetCDF format. These are downloadable from ESA with an account, after agreeing to their terms of use. https://maps.elie.ucl.ac.be/CCI/viewer/download.php <br /></div><div><br /></div><div><b>Citation</b></div><div>ESA. Land Cover CCI Product User Guide Version 2. Tech. Rep. (2017). Available at: <a href='https://maps.elie.ucl.ac.be/CCI/viewer/download/ESACCI-LC-Ph2-PUGv2_2.0.pdf' target='_blank' rel='nofollow ugc noopener noreferrer'>maps.elie.ucl.ac.be/CCI/viewer/download/ESACCI-LC-Ph2-PUGv2_2.0.pdf</a><br /></div><div><div><br /></div><div><span style='font-weight:bold;'>More technical documentation on the source datasets is available here:</span></div><div><a href='https://cds.climate.copernicus.eu/cdsapp#!/dataset/satellite-land-cover?tab=doc' target='_blank' rel='nofollow ugc noopener noreferrer'>https://cds.climate.copernicus.eu/cdsapp#!/dataset/satellite-land-cover?tab=doc</a></div></div><div><br /></div><div><span style='font-weight:bold;'>*Index of all classes in this layer:</span><br /><br />10    Cropland, rainfed<br />11    Herbaceous cover<br />12    Tree or shrub cover<br />20    Cropland, irrigated or post-flooding<br />30    Mosaic cropland (&gt;50%) / natural vegetation (tree, shrub, herbaceous cover) (&lt;50%)<br />40    Mosaic natural vegetation (tree, shrub, herbaceous cover) (&gt;50%) / cropland (&lt;50%) <br />50    Tree cover, broadleaved, evergreen, closed to open (&gt;15%)<br />60    Tree cover, broadleaved, deciduous, closed to open (&gt;15%)<br />61    Tree cover, broadleaved, deciduous, closed (&gt;40%)<br />62    Tree cover, broadleaved, deciduous, open (15-40%)<br />70    Tree cover, needleleaved, evergreen, closed to open (&gt;15%)<br />71    Tree cover, needleleaved, evergreen, closed (&gt;40%)<br />72    Tree cover, needleleaved, evergreen, open (15-40%)<br />80    Tree cover, needleleaved, deciduous, closed to open (&gt;15%)<br />81    Tree cover, needleleaved, deciduous, closed (&gt;40%)<br />82    Tree cover, needleleaved, deciduous, open (15-40%)<br />90    Tree cover, mixed leaf type (broadleaved and needleleaved)<br />100    Mosaic tree and shrub (&gt;50%) / herbaceous cover (&lt;50%)<br />110    Mosaic herbaceous cover (&gt;50%) / tree and shrub (&lt;50%)<br />120    Shrubland<br />121    Shrubland evergreen<br />122    Shrubland deciduous<br />130    Grassland<br />140    Lichens and mosses<br />150    Sparse vegetation (tree, shrub, herbaceous cover) (&lt;15%)<br />151    Sparse tree (&lt;15%)<br />152    Sparse shrub (&lt;15%)<br />153    Sparse herbaceous cover (&lt;15%)<br />160    Tree cover, flooded, fresh or brakish water<br />170    Tree cover, flooded, saline water<br />180    Shrub or herbaceous cover, flooded, fresh/saline/brakish water<br />190    Urban areas<br />200    Bare areas<br />201    Consolidated bare areas<br />202    Unconsolidated bare areas<br />210    Water bodies<br /></div>",
			"keyword": [
				"esri_environment",
				"environment",
				"earthobs3",
				"esa",
				"cci",
				"time series",
				"time-series",
				"animation",
				"agriculture",
				"forest",
				"forests",
				"grassland",
				"grasslands",
				"urban",
				"land cover",
				"landcover",
				"climate change",
				"climate change initiative",
				"forested",
				"converted",
				"cropland",
				"herbaceous",
				"european space agency",
				"shrubland"
			],
			"issued": "2020-04-02T00:34:04.000Z",
			"modified": "2023-06-30T00:17:03.000Z",
			"publisher": {
				"name": "Esri"
			},
			"contactPoint": {
				"@type": "vcard:Contact",
				"fn": "esri",
				"hasEmail": "{{orgContactEmail}}"
			},
			"accessLevel": "public",
			"spatial": "-180.0000,-89.0000,180.0000,89.0000",
			"license": "<img src='https://downloads.esri.com/blogs/arcgisonline/esrilogo_new.png' />This work is licensed under the Esri Master License Agreement. <br /><div><a href='https://goto.arcgis.com/termsofuse/viewsummary' rel='nofollow ugc' target='_blank'><b>View Summary</b></a> | <a href='https://goto.arcgis.com/termsofuse/viewtermsofuse' rel='nofollow ugc' target='_blank'><b>View Terms of Use</b></a> </div><div><span><br /></span></div><div><font color='#b22222'>Important Note:</font> This item requires an ArcGIS Online organizational subscription or an ArcGIS Developer account and does not consume credits. To access this item, you'll need to do one of the following: </div><div><ul><li>Sign in with an account that is a member of an organizational subscription </li><li>Sign in with a developer account </li><li><a href='https://goto.arcgis.com/termsofuse/registeranapplication' rel='nofollow ugc' target='_blank'>Register an application</a> and use your application's credentials.</li></ul>If you don't have an account, you can sign up for a <a href='https://goto.arcgis.com/features/trial' rel='nofollow ugc' target='_blank'>free trial of ArcGIS</a> or a <a href='https://goto.arcgis.com/developers/signup' rel='nofollow ugc' target='_blank'>free ArcGIS Developer account</a>.</div>",
			"distribution": [
				{
					"@type": "dcat:Distribution",
					"title": "ArcGIS Hub Dataset",
					"format": "Web Page",
					"mediaType": "text/html",
					"accessURL": "https://www.pacificgeoportal.com/datasets/esri::global-land-cover-1992-2020"
				},
				{
					"@type": "dcat:Distribution",
					"title": "ArcGIS GeoService",
					"format": "ArcGIS GeoServices REST API",
					"mediaType": "application/json",
					"accessURL": "https://earthobs3.arcgis.com/arcgis/rest/services/ESA_CCI_Land_Cover_Time_Series/ImageServer"
				}
			],
			"theme": [
				"geospatial"
			]
		},
		{
			"@type": "dcat:Dataset",
			"identifier": "https://www.arcgis.com/home/item.html?id=57c1ade4fa7c4e2384e6a23f2b3bd254&sublayer=0",
			"landingPage": "https://www.pacificgeoportal.com/datasets/esri::world-continents",
			"title": "World Continents",
			"description": "<div style='text-align:Left;'><div><div><p><span>World Continents represents the boundaries for the continents of the world.</span></p><div><span>This layer is best viewed out beyond a maximum scale (zoomed in) of 1:3,000,000.</span></div><div>&nbsp;</div><div>The sources of this dataset are Esri, Global Mapping International (GMI), <a target='_blank' href='https://www.cia.gov/the-world-factbook/' rel='nofollow ugc noopener noreferrer'>U.S. Central Intelligence Agency (The World Factbook)</a>, and <a target='_blank' href='https://www.garmin.com' rel='nofollow ugc noopener noreferrer'>Garmin</a>. <span>It is</span><span style='background-color:rgb(255,255,255); color:rgb(74,74,74); font-family:&quot;Avenir Next&quot;, Avenir, &quot;Helvetica Neue&quot;, sans-serif; font-size:16px;'><span style='display:inline !important; float:none; font-style:normal; font-variant-caps:normal; font-variant-ligatures:normal; font-weight:400; letter-spacing:normal; text-align:start; text-decoration-color:initial; text-decoration-style:initial; text-indent:0px; text-transform:none; word-spacing:0px;'> updated as country boundaries coincident to </span></span><span>continent</span><span style='background-color:rgb(255,255,255); color:rgb(74,74,74); font-family:&quot;Avenir Next&quot;, Avenir, &quot;Helvetica Neue&quot;, sans-serif; font-size:16px;'><span style='display:inline !important; float:none; font-style:normal; font-variant-caps:normal; font-variant-ligatures:normal; font-weight:400; letter-spacing:normal; text-align:start; text-decoration-color:initial; text-decoration-style:initial; text-indent:0px; text-transform:none; word-spacing:0px;'>al boundaries change</span></span><span>.</span></div><div>&nbsp;</div><div><span>To download the data for this layer as a layer package for use in ArcGIS desktop applications, refer to </span><a target='_blank' href='https://www.arcgis.com/home/item.html?id=a3cb207855b348a297ab85261743351d' rel='nofollow ugc noopener noreferrer'><span>World Continents</span></a><span>.</span></div></div></div></div>",
			"keyword": [
				"layer",
				"polygon",
				"continents",
				"coastlines",
				"boundaries",
				"World",
				"Africa",
				"Antarctica",
				"Asia",
				"Australia",
				"Europe",
				"North America",
				"Oceania",
				"South America",
				"1996",
				"1998",
				"2000",
				"2007",
				"2022"
			],
			"issued": "2013-06-29T22:10:57.000Z",
			"modified": "2026-05-19T23:53:12.336Z",
			"publisher": {
				"name": "Esri"
			},
			"contactPoint": {
				"@type": "vcard:Contact",
				"fn": "esri_dm",
				"hasEmail": "{{orgContactEmail}}"
			},
			"accessLevel": "public",
			"spatial": "-180.0000,-89.0000,180.0000,83.6236",
			"license": "<div style='text-align:Left;'><div><div><div><div><div style='text-align:Left;'><div><div><p><img src='https://downloads.esri.com/blogs/arcgisonline/esrilogo_new.png' width='113' height='43' /><span> This work is licensed under the Esri Master License Agreement.</span><br /><span>&nbsp;</span><a target='_blank' href='https://goto.arcgis.com/termsofuse/viewsummary' rel='nofollow ugc noopener noreferrer'><span><strong>View Summary</strong></span></a><span> | </span><a target='_blank' href='https://goto.arcgis.com/termsofuse/viewtermsofuse' rel='nofollow ugc noopener noreferrer'><span><strong>View Terms of Use</strong></span></a></p></div></div></div></div></div></div></div></div>",
			"distribution": [
				{
					"@type": "dcat:Distribution",
					"title": "ArcGIS Hub Dataset",
					"format": "Web Page",
					"mediaType": "text/html",
					"accessURL": "https://www.pacificgeoportal.com/datasets/esri::world-continents"
				},
				{
					"@type": "dcat:Distribution",
					"title": "ArcGIS GeoService",
					"format": "ArcGIS GeoServices REST API",
					"mediaType": "application/json",
					"accessURL": "https://services.arcgis.com/P3ePLMYs2RVChkJx/arcgis/rest/services/World_Continents/FeatureServer/0"
				},
				{
					"@type": "dcat:Distribution",
					"title": "CSV",
					"format": "CSV",
					"mediaType": "text/csv",
					"accessURL": "https://www.pacificgeoportal.com/api/download/v1/items/57c1ade4fa7c4e2384e6a23f2b3bd254/csv?layers=0"
				},
				{
					"@type": "dcat:Distribution",
					"title": "Shapefile",
					"format": "ZIP",
					"mediaType": "application/zip",
					"accessURL": "https://www.pacificgeoportal.com/api/download/v1/items/57c1ade4fa7c4e2384e6a23f2b3bd254/shapefile?layers=0"
				},
				{
					"@type": "dcat:Distribution",
					"title": "GeoJSON",
					"format": "GeoJSON",
					"mediaType": "application/vnd.geo+json",
					"accessURL": "https://www.pacificgeoportal.com/api/download/v1/items/57c1ade4fa7c4e2384e6a23f2b3bd254/geojson?layers=0"
				},
				{
					"@type": "dcat:Distribution",
					"title": "KML",
					"format": "KML",
					"mediaType": "application/vnd.google-earth.kml+xml",
					"accessURL": "https://www.pacificgeoportal.com/api/download/v1/items/57c1ade4fa7c4e2384e6a23f2b3bd254/kml?layers=0"
				},
				{
					"@type": "dcat:Distribution",
					"title": "File Geodatabase",
					"format": "ZIP",
					"mediaType": "application/zip",
					"accessURL": "https://www.pacificgeoportal.com/api/download/v1/items/57c1ade4fa7c4e2384e6a23f2b3bd254/filegdb?layers=0"
				},
				{
					"@type": "dcat:Distribution",
					"title": "Feature Collection",
					"format": "TXT",
					"mediaType": "text/plain",
					"accessURL": "https://www.pacificgeoportal.com/api/download/v1/items/57c1ade4fa7c4e2384e6a23f2b3bd254/featureCollection?layers=0"
				},
				{
					"@type": "dcat:Distribution",
					"title": "Excel",
					"format": "XLSX",
					"mediaType": "application/vnd.ms-excel",
					"accessURL": "https://www.pacificgeoportal.com/api/download/v1/items/57c1ade4fa7c4e2384e6a23f2b3bd254/excel?layers=0"
				},
				{
					"@type": "dcat:Distribution",
					"title": "GeoPackage",
					"format": "GPKG",
					"mediaType": "application/geopackage+sqlite3",
					"accessURL": "https://www.pacificgeoportal.com/api/download/v1/items/57c1ade4fa7c4e2384e6a23f2b3bd254/geoPackage?layers=0"
				},
				{
					"@type": "dcat:Distribution",
					"title": "SQLite Geodatabase",
					"format": "GDB",
					"mediaType": "application/geopackage+sqlite3",
					"accessURL": "https://www.pacificgeoportal.com/api/download/v1/items/57c1ade4fa7c4e2384e6a23f2b3bd254/sqlite?layers=0"
				}
			],
			"theme": [
				"geospatial"
			]
		},
		{
			"@type": "dcat:Dataset",
			"identifier": "https://www.arcgis.com/home/item.html?id=85027f060e2b47249a508ada6f44403d&sublayer=0",
			"landingPage": "https://www.pacificgeoportal.com/datasets/eaglegis::nz-linz-topographic-2",
			"title": "NZ LINZ Topographic",
			"description": "<p><strong>Last updated</strong><br />May 2026<br /><br /><strong>Projection</strong><br />New Zealand Transverse Mercator 2000 (NZTM2000).<br /><br /><strong>Scale/zoom levels</strong><br />&nbsp;</p><div style='margin-left:40px;'><span style='font-size:medium;'><u>Available scale levels</u></span><br />&nbsp;</div><div style='margin-left:40px;'><span style='font-size:medium;'>Level 0 - 23 (1:591,657,527 - 1:70)</span></div><div style='margin-left:40px;'><br />&nbsp;</div><div style='margin-left:40px;'><span style='font-size:medium;'><u>Cached scale levels</u></span></div><div style='margin-left:40px;'><span style='font-size:medium;'>Level 0 to level 16 (1:591,657,527 - 1:9027)</span></div><div style='margin-left:40px;'><br />&nbsp;</div><div style='margin-left:40px;'><span style='font-size:medium;'><u>Resampled scale levels</u></span><br />&nbsp;</div><div style='margin-left:40px;'><span style='font-size:medium;'>Resampling is being used for the levels that aren't cached.</span></div><div><br />&nbsp;</div><div style='margin-left:40px;'><span style='font-size:medium;'><u>Tiling Scheme</u></span><br />&nbsp;</div><div style='margin-left:40px;'><span style='font-size:medium;'>The tiling scheme used for this service can be found </span><a target='_blank' href='https://www.arcgis.com/home/item.html?id=75d8c2aec505409ead3c07f6e89f56fb' rel='nofollow ugc noopener noreferrer'><span style='font-size:medium;'>here</span></a><span style='font-size:medium;'>.</span></div><div><br />&nbsp;</div><div><span style='font-size:medium;'><strong>About</strong></span><br />&nbsp;</div><p><span style='font-size:medium;'>NZ Topographic Basemap provides a contextual background to your geographic data. It features the georeferenced LINZ Topo250 &amp; Topo50 maps series for the New Zealand mainland, the Chatham Islands, and offshore islands.</span><br /><br /><span style='font-size:medium;'>This layer is offered by Eagle Technology (Official Esri Distributor). Eagle Technology offers services that can be used in the ArcGIS platform. The Content team at Eagle Technology updates the layers on a regular basis and re</span>gularly adds new content to the Living Atlas. By using this content and combining it with other data you can create new information products quickly and easily.<br /><br />If you have any questions or remarks about the content, please let us now at <a href='mailto:livingatlas@eagle.co.nz' target='_blank' rel='nofollow ugc noopener noreferrer'>livingatlas@eagle.co.nz</a></p>",
			"keyword": [
				"Topo50",
				"Topo250",
				"New Zealand",
				"Basemap",
				"NZ",
				"Map",
				"Background",
				"Layer",
				"topographic",
				"topography",
				"content",
				"living atlas",
				"basemaps",
				"esri_basemap",
				"esri_basemaps",
				"detailed",
				"digital map",
				"Linz",
				"current",
				"open data",
				"data sets",
				"eaglegis"
			],
			"issued": "2020-03-24T22:48:16.000Z",
			"modified": "2026-05-19T10:41:09.000Z",
			"publisher": {
				"name": "Eagle Technology Group Ltd"
			},
			"contactPoint": {
				"@type": "vcard:Contact",
				"fn": "eaglegis",
				"hasEmail": "mailto:ts@eaglegis.co.nz"
			},
			"accessLevel": "public",
			"spatial": "130.2002,-48.5073,-157.3658,-22.3965",
			"license": "https://creativecommons.org/licenses/by/4.0",
			"distribution": [
				{
					"@type": "dcat:Distribution",
					"title": "ArcGIS Hub Dataset",
					"format": "Web Page",
					"mediaType": "text/html",
					"accessURL": "https://www.pacificgeoportal.com/datasets/eaglegis::nz-linz-topographic-2"
				},
				{
					"@type": "dcat:Distribution",
					"title": "ArcGIS GeoService",
					"format": "ArcGIS GeoServices REST API",
					"mediaType": "application/json",
					"accessURL": "https://services1.arcgisonline.co.nz/arcgis/rest/services/LINZ/geotiffs/MapServer/0"
				}
			],
			"theme": [
				"geospatial"
			]
		},
		{
			"@type": "dcat:Dataset",
			"identifier": "https://www.arcgis.com/home/item.html?id=718429fe190648ad89729b45e37e0aa2",
			"landingPage": "https://www.pacificgeoportal.com/datasets/esri::potential-evapotranspiration",
			"title": "Potential Evapotranspiration",
			"description": "<div style='margin: 0px; padding: 0px;'>The combined processes of evaporation and transpiration, known as evapotranspiration (ET), plays a key role in the <a href='https://en.wikipedia.org/wiki/Water_cycle' rel='nofollow ugc' target='_blank'>water cycle</a>.  Precipitation that falls on land can either run off in streams and rivers, soak into the ground, or return to the atmosphere through evapotranspiration. Water that evaporates returns directly to the atmosphere while water that is transpired is taken up by plant roots and lost to the atmosphere through the leaves.<br /></div><div style='margin: 0px; padding: 0px;'><br /></div><div style='margin: 0px; padding: 0px;'>Evapotranspiration data can be used to calculate regional water and energy balance and soil water status and provides key information for water resource management. Potential evapotranspiration, the amount of ET that would occur if soil moisture were not limited, is a purely meteorological characteristic, based on air temperature, solar radiation, and wind speed. <a href='https://www.arcgis.com/home/item.html?id=31f7c3727abf42249a43fe8f25470af4' rel='nofollow ugc' target='_blank'>Actual evapotranspiration</a> also depends on water availability, so it might occur at very close to the potential rate in a rainforest, but be much lower in a desert despite the higher potential there.</div><div style='margin: 0px; padding: 0px;'><br /></div><div style='text-align: center; margin: 0px; padding: 0px;'><font size='4'><b>Dataset Summary</b></font></div><div style='margin: 0px; padding: 0px;'><div style='margin: 0px; padding: 0px;'><b>Phenomenon Mapped:</b> Evapotranspiration<br /></div><div style='margin: 0px; padding: 0px;'><div><b>Units:</b> Millimeters per year</div><div><b>Cell Size:</b> 927.6623821756539  meters</div><div><b>Source Type:</b> Continuous</div><div><b>Pixel Type:</b> 16-bit unsigned integer</div><div><b>Data Coordinate System:</b> Web Mercator Auxiliary Sphere</div><div><b>Extent:</b> Global </div><div><b>Source:</b> University of Montana <span style='box-sizing: border-box; background-image: initial; background-position: 0px 0px; background-size: initial; background-repeat: initial; background-attachment: initial; background-origin: initial; background-clip: initial; border-bottom-width: initial; border-bottom-color: initial; transition: all 0.4s ease-in-out; margin-top: auto; margin-right: 8px; margin-bottom: auto; text-shadow: rgb(255, 255, 255) 0px 1px 0px;'>Numerical Terradynamic Simulation Group</span></div><div><b>Publication Date:</b> March 10, 2015</div><div><b>ArcGIS Server URL:</b> https://landscape6.arcgis.com/arcgis/</div><div><br /></div><div><div style='margin: 0px; padding: 0px;'>This layer provides access to a 1km cell sized raster of average annual evaporative loss from the land surface, measured in mm/year. Data are from the <a href='https://www.ntsg.umt.edu/project/modis/mod16.php' rel='nofollow ugc' target='_blank'>MOD16 Global Evapotranspiration Product</a>, which is derived from MODIS imagery by a team of researchers at the University of Montana. This algorithm, which involves estimating land surface temperature and albedo and using them to solve the <a href='https://en.wikipedia.org/wiki/Penman%E2%80%93Monteith_equation' rel='nofollow ugc' target='_blank'>Penman-Monteith</a> equation, is not valid over urban or barren land so these are shown as NoData, as is any open water. For all other pixels, the algorithm was used to estimate evapotranspiration for every 8-day period from 2000 to 2014 and these estimates have been averaged together to come up with the annual normal. You can also get access to the monthly totals using the <a href='https://hydroteam.maps.arcgis.com/home/item.html?id=5fe74de4ec254bc09515e562abe994e1' rel='nofollow ugc' target='_blank'>MODIS Toolbox</a>.</div><div style='margin: 0px; padding: 0px;'><div style='margin: 0px; padding: 0px;'></div></div></div></div></div><div style='margin: 0px; padding: 0px;'><br /></div><div style='margin: 0px; padding: 0px;'><div style='margin: 0px; padding: 0px;'><div style='text-align: center; font-family: &quot;Avenir Next W01&quot;, &quot;Avenir Next W00&quot;, &quot;Avenir Next&quot;, Avenir, &quot;Helvetica Neue&quot;, Helvetica, Arial, sans-serif; font-size: 17px; background-color: rgb(255, 255, 255); margin: 0px; padding: 0px;'><b><font size='4'>What can you do with this Layer?</font> </b></div><div style='font-family: &quot;Avenir Next W01&quot;, &quot;Avenir Next W00&quot;, &quot;Avenir Next&quot;, Avenir, &quot;Helvetica Neue&quot;, Helvetica, Arial, sans-serif; font-size: 17px; background-color: rgb(255, 255, 255); margin: 0px; padding: 0px;'><div style='margin: 0px; padding: 0px;'>This layer is suitable for both visualization and analysis across the ArcGIS system. This layer can be combined with your data and other layers from the <a href='https://livingatlas.arcgis.com/' rel='nofollow ugc' style='color: rgb(0, 121, 193); text-decoration-line: none;' target='_blank'>ArcGIS Living Atlas of the World</a> in ArcGIS Online and ArcGIS Pro to create powerful web maps that can be used alone or in a story map or other application.</div><div style='margin: 0px; padding: 0px;'><br /></div><div style='margin: 0px; padding: 0px;'>Because this layer is part of the <a href='https://livingatlas.arcgis.com/' rel='nofollow ugc' style='color: rgb(0, 121, 193); text-decoration-line: none;' target='_blank'>ArcGIS Living Atlas of the World</a> it is easy to add to your map:</div><div style='margin: 0px; padding: 0px;'><ul><li>In ArcGIS Online, you can add this layer to a map by selecting <i>Add</i> then <i>Browse Living Atlas Layers</i>. A window will open. Type &quot;evapotranspiration&quot; in the search box and browse to the layer. Select the layer then click <i>Add to Map</i>.<br /></li><li>In ArcGIS Pro, open a map and select <i>Add Data</i> from the Map Tab. Select <i>Data</i> at the top of the drop down menu. The Add Data dialog box will open on the left side of the box, expand <i>Portal</i> if necessary, then select <i>Living Atlas</i>. Type &quot;evapotranspiration&quot; in the search box, browse to the layer then click OK.</li></ul></div><div style='margin: 0px; padding: 0px;'>In ArcGIS Pro you can use the built-in <a href='https://pro.arcgis.com/en/pro-app/help/data/imagery/raster-functions.htm' rel='nofollow ugc' style='color: rgb(0, 121, 193); text-decoration-line: none;' target='_blank'>raster functions</a> or create your own to create custom extracts of the data. Imagery layers provide fast, powerful inputs to geoprocessing tools, models, or Python scripts in Pro.</div><div style='margin: 0px; padding: 0px;'><br /></div><div style='margin: 0px; padding: 0px;'>The <a href='https://doc.arcgis.com/en/living-atlas/#s=0&amp;n=0&amp;d=1&amp;col=&amp;fs=0&amp;fn=30&amp;npp=120&amp;subCat=0' rel='nofollow ugc' style='color: rgb(0, 121, 193); text-decoration-line: none;' target='_blank'>ArcGIS Living Atlas of the World</a> provides an easy way to explore many other beautiful and authoritative maps on hundreds of topics like this one.</div></div></div></div>",
			"keyword": [
				"ET",
				"evap",
				"evapo",
				"evaporation",
				"transpiration",
				"hydro",
				"MODIS",
				"PET",
				"esri_landscape",
				"landscape",
				"landscape6",
				"climate",
				"weather",
				"water",
				"earth observations"
			],
			"issued": "2018-03-01T04:01:15.000Z",
			"modified": "2020-08-27T00:03:01.000Z",
			"publisher": {
				"name": "Esri"
			},
			"contactPoint": {
				"@type": "vcard:Contact",
				"fn": "esri_landscape2",
				"hasEmail": "{{orgContactEmail}}"
			},
			"accessLevel": "public",
			"spatial": "-180.0000,-59.9995,180.0000,80.0000",
			"license": "<img alt='' src='https://downloads.esri.com/blogs/arcgisonline/esrilogo_new.png' />This work is licensed under the Esri Master License Agreement. <br /><div><a href='https://goto.arcgis.com/termsofuse/viewsummary' rel='nofollow ugc' target='_blank'><b>View Summary</b></a> | <a href='https://goto.arcgis.com/termsofuse/viewtermsofuse' rel='nofollow ugc' target='_blank'><b>View Terms of Use</b></a> </div><div><span style='line-height: 16.05px;'><br /></span></div><div><font color='#b22222'>Important Note:</font> This item requires an ArcGIS Online organizational subscription or an ArcGIS Developer account and does not consume credits. To access this item, you'll need to do one of the following: </div><div><ul><li>Sign in with an account that is a member of an organizational subscription </li><li>Sign in with a developer account </li><li><a href='https://goto.arcgis.com/termsofuse/registeranapplication' rel='nofollow ugc' target='_blank'>Register an application</a> and use your application's credentials.</li></ul>If you don't have an account, you can sign up for a <a href='https://goto.arcgis.com/features/trial' rel='nofollow ugc' target='_blank'>free trial of ArcGIS</a> or a <a href='https://goto.arcgis.com/developers/signup' rel='nofollow ugc' target='_blank'>free ArcGIS Developer account</a>.</div>",
			"distribution": [
				{
					"@type": "dcat:Distribution",
					"title": "ArcGIS Hub Dataset",
					"format": "Web Page",
					"mediaType": "text/html",
					"accessURL": "https://www.pacificgeoportal.com/datasets/esri::potential-evapotranspiration"
				},
				{
					"@type": "dcat:Distribution",
					"title": "ArcGIS GeoService",
					"format": "ArcGIS GeoServices REST API",
					"mediaType": "application/json",
					"accessURL": "https://landscape6.arcgis.com/arcgis/rest/services/World_Evapotranspiration/ImageServer"
				}
			],
			"theme": [
				"geospatial"
			]
		},
		{
			"@type": "dcat:Dataset",
			"identifier": "https://www.arcgis.com/home/item.html?id=a4d7a13b12f84376b9c5b2ec25f50ad2&sublayer=0",
			"landingPage": "https://www.pacificgeoportal.com/datasets/eaglegis::nz-territorial-authorities-archive",
			"title": "NZ Territorial Authorities - Archive",
			"description": "<div><span style='font-size:medium;'><font style='font-family:&quot;Avenir Next W01&quot;, &quot;Avenir Next W00&quot;, &quot;Avenir Next&quot;, Avenir, &quot;Helvetica Neue&quot;, Helvetica, Arial, sans-serif !important;'>Topicality:&nbsp;01-01-2026</font></span></div><div><span style='font-size:17px;'><font style='font-family:&quot;Avenir Next W01&quot;, &quot;Avenir Next W00&quot;, &quot;Avenir Next&quot;, Avenir, &quot;Helvetica Neue&quot;, Helvetica, Arial, sans-serif !important; font-size:17px;'>Projection: New Zealand Transverse Mercator (NZTM)</font></span><br />&nbsp;</div><div><div><span style='font-size:medium;'>This layer contains the archive of territorial authority boundaries as defined by territorial authorities and/or Local Government Commission, and maintained by Stats NZ (the custodian).</span><br />&nbsp;</div><div><span style='font-size:medium;'>Territorial authorities are the second tier of local government in New Zealand, below regional councils. They are defined under schedule 2, part 1 of the Local Government Act 2002 as city councils or district councils. Territorial authorities were established in 1989 when 205 territorial local authorities were replaced by 75 territorial authorities. Territorial boundaries must coincide with meshblock boundaries under schedule 3, clause 17 of the Local Government Act 2002.</span><br />&nbsp;</div><p><span style='font-family:Avenir Next W01, Avenir Next W00, Avenir Next, Avenir, Helvetica Neue, Helvetica, Arial, sans-serif; font-size:medium;'>This layer get updated yearly with the latest boundary data.<font style='font-family:&quot;Avenir Next W01&quot;, &quot;Avenir Next W00&quot;, &quot;Avenir Next&quot;, Avenir, &quot;Helvetica Neue&quot;, Helvetica, Arial, sans-serif;'> You can use this layer when you need any year of boundary data in your map. By setting a filter on the dataset year you can filter on specific year of the dataset.</font></span></p><div><span style='font-family:Avenir Next W01, Avenir Next W00, Avenir Next, Avenir, Helvetica Neue, Helvetica, Arial, sans-serif; font-size:medium;'>For information about the fields in this dataset go to the Data tab.</span></div><div>&nbsp;</div><div><span style='font-family:Avenir Next W01, Avenir Next W00, Avenir Next, Avenir, Helvetica Neue, Helvetica, Arial, sans-serif; font-size:medium;'>The layer is further generalised by Eagle Technology for improved performance on the web,&nbsp;</span><span style='font-family:&quot;Avenir Next W01&quot;, &quot;Avenir Next W00&quot;, &quot;Avenir Next&quot;, Avenir, &quot;Helvetica Neue&quot;, sans-serif; font-size:medium;'>therefore it doesn't fully represent the official boundaries.</span><br />&nbsp;</div><div><span style='font-family:Avenir Next W01, Avenir Next W00, Avenir Next, Avenir, Helvetica Neue, Helvetica, Arial, sans-serif; font-size:medium;'><font style='font-family:&quot;Avenir Next W01&quot;, &quot;Avenir Next W00&quot;, &quot;Avenir Next&quot;, Avenir, &quot;Helvetica Neue&quot;, Helvetica, Arial, sans-serif;'>If you only need the latest boundary data in your map you can use the </font></span><a target='_blank' href='https://www.arcgis.com/home/item.html?id=288ba59f0f5b424e80082ce668de7a8d' rel='nofollow ugc noopener noreferrer'><span style='font-family:Avenir Next W01, Avenir Next W00, Avenir Next, Avenir, Helvetica Neue, Helvetica, Arial, sans-serif; font-size:medium;'>current version</span></a><span style='font-family:Avenir Next W01, Avenir Next W00, Avenir Next, Avenir, Helvetica Neue, Helvetica, Arial, sans-serif; font-size:medium;'><font style='font-family:&quot;Avenir Next W01&quot;, &quot;Avenir Next W00&quot;, &quot;Avenir Next&quot;, Avenir, &quot;Helvetica Neue&quot;, Helvetica, Arial, sans-serif;'> of this dataset. All the current versions of Stats NZ Boundary layers can be found </font></span><a target='_blank' href='https://www.arcgis.com/home/group.html?id=b22e4f0012a8426dac21cd3d02f25c67' rel='nofollow ugc noopener noreferrer'><span style='font-family:Avenir Next W01, Avenir Next W00, Avenir Next, Avenir, Helvetica Neue, Helvetica, Arial, sans-serif; font-size:medium;'><font style='font-family:&quot;Avenir Next W01&quot;, &quot;Avenir Next W00&quot;, &quot;Avenir Next&quot;, Avenir, &quot;Helvetica Neue&quot;, Helvetica, Arial, sans-serif;'>here</font></span></a><span style='font-family:Avenir Next W01, Avenir Next W00, Avenir Next, Avenir, Helvetica Neue, Helvetica, Arial, sans-serif; font-size:medium;'><font style='font-family:&quot;Avenir Next W01&quot;, &quot;Avenir Next W00&quot;, &quot;Avenir Next&quot;, Avenir, &quot;Helvetica Neue&quot;, Helvetica, Arial, sans-serif;'>.</font></span><br />&nbsp;</div><div><span style='font-family:Avenir Next W01, Avenir Next W00, Avenir Next, Avenir, Helvetica Neue, Helvetica, Arial, sans-serif; font-size:medium;'><font style='font-family:&quot;Avenir Next W01&quot;, &quot;Avenir Next W00&quot;, &quot;Avenir Next&quot;, Avenir, &quot;Helvetica Neue&quot;, Helvetica, Arial, sans-serif;'>The official dataset can be found on&nbsp;</font></span><a target='_blank' href='https://datafinder.stats.govt.nz/data/category/annual-boundaries/2022/' rel='nofollow ugc noopener noreferrer'><span style='font-family:Avenir Next W01, Avenir Next W00, Avenir Next, Avenir, Helvetica Neue, Helvetica, Arial, sans-serif; font-size:medium;'>https://datafinder.stats.govt.nz.</span></a><br />&nbsp;</div><div><div style='font-family:&quot;Avenir Next W01&quot;, &quot;Avenir Next W00&quot;, &quot;Avenir Next&quot;, Avenir, &quot;Helvetica Neue&quot;, Helvetica, Arial, sans-serif !important;'><span style='color:#2f4f4f; font-size:medium;'>This layer is offered by Eagle Technology (Official Esri Distributor). Eagle Technology offers services that can be used in the ArcGIS platform. The Content team at Eagle Technology updates the layers on a regular basis and regularly adds new content to the Living Atlas. By using this content and combining it with other data you can create new information products quickly and easily.</span></div><div style='font-family:&quot;Avenir Next W01&quot;, &quot;Avenir Next W00&quot;, &quot;Avenir Next&quot;, Avenir, &quot;Helvetica Neue&quot;, Helvetica, Arial, sans-serif !important;'><br />&nbsp;</div><div style='font-family:&quot;Avenir Next W01&quot;, &quot;Avenir Next W00&quot;, &quot;Avenir Next&quot;, Avenir, &quot;Helvetica Neue&quot;, Helvetica, Arial, sans-serif !important;'><span style='color:#2f4f4f; font-size:medium;'>If you have any questions or comments about the content, please let us now&nbsp; at&nbsp;</span><a style='color:rgb(0, 121, 193); text-decoration-line:none;' href='mailto:livingatlas@eagle.co.nz' target='_blank' rel='nofollow ugc noopener noreferrer'><span style='font-size:medium;'>livingatlas@eagle.co.nz</span></a></div></div></div>",
			"keyword": [
				"Boundary",
				"Boundaries",
				"New zealand",
				"Statistics New Zealand",
				"StatsNZ",
				"Eagle technology",
				"Nz",
				"Content",
				"Kiwi",
				"eaglegis"
			],
			"issued": "2023-04-11T00:37:32.000Z",
			"modified": "2026-11-11T09:19:00.481Z",
			"publisher": {
				"name": "Eagle Technology Group Ltd"
			},
			"contactPoint": {
				"@type": "vcard:Contact",
				"fn": "eaglegis",
				"hasEmail": "mailto:ts@eaglegis.co.nz"
			},
			"accessLevel": "public",
			"spatial": "166.2620,-47.2230,-177.6189,-33.7734",
			"license": "https://creativecommons.org/licenses/by/4.0",
			"distribution": [
				{
					"@type": "dcat:Distribution",
					"title": "ArcGIS Hub Dataset",
					"format": "Web Page",
					"mediaType": "text/html",
					"accessURL": "https://www.pacificgeoportal.com/datasets/eaglegis::nz-territorial-authorities-archive"
				},
				{
					"@type": "dcat:Distribution",
					"title": "ArcGIS GeoService",
					"format": "ArcGIS GeoServices REST API",
					"mediaType": "application/json",
					"accessURL": "https://services.arcgis.com/XTtANUDT8Va4DLwI/arcgis/rest/services/nz_territorial_authorities_archive/FeatureServer/0"
				},
				{
					"@type": "dcat:Distribution",
					"title": "CSV",
					"format": "CSV",
					"mediaType": "text/csv",
					"accessURL": "https://www.pacificgeoportal.com/api/download/v1/items/a4d7a13b12f84376b9c5b2ec25f50ad2/csv?layers=0"
				},
				{
					"@type": "dcat:Distribution",
					"title": "Shapefile",
					"format": "ZIP",
					"mediaType": "application/zip",
					"accessURL": "https://www.pacificgeoportal.com/api/download/v1/items/a4d7a13b12f84376b9c5b2ec25f50ad2/shapefile?layers=0"
				},
				{
					"@type": "dcat:Distribution",
					"title": "GeoJSON",
					"format": "GeoJSON",
					"mediaType": "application/vnd.geo+json",
					"accessURL": "https://www.pacificgeoportal.com/api/download/v1/items/a4d7a13b12f84376b9c5b2ec25f50ad2/geojson?layers=0"
				},
				{
					"@type": "dcat:Distribution",
					"title": "KML",
					"format": "KML",
					"mediaType": "application/vnd.google-earth.kml+xml",
					"accessURL": "https://www.pacificgeoportal.com/api/download/v1/items/a4d7a13b12f84376b9c5b2ec25f50ad2/kml?layers=0"
				},
				{
					"@type": "dcat:Distribution",
					"title": "File Geodatabase",
					"format": "ZIP",
					"mediaType": "application/zip",
					"accessURL": "https://www.pacificgeoportal.com/api/download/v1/items/a4d7a13b12f84376b9c5b2ec25f50ad2/filegdb?layers=0"
				},
				{
					"@type": "dcat:Distribution",
					"title": "Feature Collection",
					"format": "TXT",
					"mediaType": "text/plain",
					"accessURL": "https://www.pacificgeoportal.com/api/download/v1/items/a4d7a13b12f84376b9c5b2ec25f50ad2/featureCollection?layers=0"
				},
				{
					"@type": "dcat:Distribution",
					"title": "Excel",
					"format": "XLSX",
					"mediaType": "application/vnd.ms-excel",
					"accessURL": "https://www.pacificgeoportal.com/api/download/v1/items/a4d7a13b12f84376b9c5b2ec25f50ad2/excel?layers=0"
				},
				{
					"@type": "dcat:Distribution",
					"title": "GeoPackage",
					"format": "GPKG",
					"mediaType": "application/geopackage+sqlite3",
					"accessURL": "https://www.pacificgeoportal.com/api/download/v1/items/a4d7a13b12f84376b9c5b2ec25f50ad2/geoPackage?layers=0"
				},
				{
					"@type": "dcat:Distribution",
					"title": "SQLite Geodatabase",
					"format": "GDB",
					"mediaType": "application/geopackage+sqlite3",
					"accessURL": "https://www.pacificgeoportal.com/api/download/v1/items/a4d7a13b12f84376b9c5b2ec25f50ad2/sqlite?layers=0"
				}
			],
			"theme": [
				"geospatial"
			]
		},
		{
			"@type": "dcat:Dataset",
			"identifier": "https://www.arcgis.com/home/item.html?id=288ba59f0f5b424e80082ce668de7a8d&sublayer=0",
			"landingPage": "https://www.pacificgeoportal.com/datasets/eaglegis::nz-territorial-authorities-current",
			"title": "NZ Territorial Authorities - Current",
			"description": "<div><span style='font-size:medium;'><font style='font-family:&quot;Avenir Next W01&quot;, &quot;Avenir Next W00&quot;, &quot;Avenir Next&quot;, Avenir, &quot;Helvetica Neue&quot;, Helvetica, Arial, sans-serif !important;'>Topicality:&nbsp;01-01-2026</font></span></div><div><span style='font-size:17px;'><font style='font-family:&quot;Avenir Next W01&quot;, &quot;Avenir Next W00&quot;, &quot;Avenir Next&quot;, Avenir, &quot;Helvetica Neue&quot;, Helvetica, Arial, sans-serif !important; font-size:17px;'>Projection: New Zealand Transverse Mercator (NZTM)</font></span></div><div>&nbsp;</div><div><div><span style='font-size:medium;'>This layer contains the latest set of territorial authority boundaries as defined by territorial authorities and/or Local Government Commission, and maintained by Stats NZ (the custodian).</span></div><div>&nbsp;</div><div><span style='font-size:medium;'>Territorial authorities are the second tier of local government in New Zealand, below regional councils. They are defined under schedule 2, part 1 of the Local Government Act 2002 as city councils or district councils. Territorial authorities were established in 1989 when 205 territorial local authorities were replaced by 75 territorial authorities. Territorial boundaries must coincide with meshblock boundaries under schedule 3, clause 17 of the Local Government Act 2002.</span></div><div><ul><li><span style='font-family:Avenir Next W01, Avenir Next W00, Avenir Next, Avenir, Helvetica Neue, Helvetica, Arial, sans-serif; font-size:medium;'>This layer gets updated yearly with the latest boundary data.</span></li><li><span style='font-family:Avenir Next W01, Avenir Next W00, Avenir Next, Avenir, Helvetica Neue, Helvetica, Arial, sans-serif; font-size:medium;'><font style='font-family:&quot;Avenir Next W01&quot;, &quot;Avenir Next W00&quot;, &quot;Avenir Next&quot;, Avenir, &quot;Helvetica Neue&quot;, Helvetica, Arial, sans-serif;'>A layer with the full archive of the data for all the available years is available&nbsp;</font></span><a target='_blank' href='https://www.arcgis.com/home/item.html?id=6fe6e470e462496e890c85adab0859b5' rel='nofollow ugc noopener noreferrer'><span style='font-family:Avenir Next W01, Avenir Next W00, Avenir Next, Avenir, Helvetica Neue, Helvetica, Arial, sans-serif; font-size:medium;'>here</span></a><span style='font-family:Avenir Next W01, Avenir Next W00, Avenir Next, Avenir, Helvetica Neue, Helvetica, Arial, sans-serif; font-size:medium;'>.</span></li><li><span style='font-family:Avenir Next W01, Avenir Next W00, Avenir Next, Avenir, Helvetica Neue, Helvetica, Arial, sans-serif; font-size:medium;'>For information about the fields in this dataset go to the Data tab.</span></li></ul></div><div><span style='font-family:Avenir Next W01, Avenir Next W00, Avenir Next, Avenir, Helvetica Neue, Helvetica, Arial, sans-serif; font-size:medium;'><font style='font-family:&quot;Avenir Next W01&quot;, &quot;Avenir Next W00&quot;, &quot;Avenir Next&quot;, Avenir, &quot;Helvetica Neue&quot;, Helvetica, Arial, sans-serif;'>The official dataset can be found on </font></span><a target='_blank' href='https://datafinder.stats.govt.nz/data/category/annual-boundaries/' rel='nofollow ugc noopener noreferrer'><span style='font-family:Avenir Next W01, Avenir Next W00, Avenir Next, Avenir, Helvetica Neue, Helvetica, Arial, sans-serif; font-size:medium;'>https://datafinder.stats.govt.nz.</span></a></div><div style='font-family:&quot;Avenir Next W01&quot;, &quot;Avenir Next W00&quot;, &quot;Avenir Next&quot;, Avenir, &quot;Helvetica Neue&quot;, Helvetica, Arial, sans-serif !important;'>&nbsp;</div><div><div style='font-family:&quot;Avenir Next W01&quot;, &quot;Avenir Next W00&quot;, &quot;Avenir Next&quot;, Avenir, &quot;Helvetica Neue&quot;, Helvetica, Arial, sans-serif !important;'><span style='color:#2f4f4f; font-size:medium;'>This layer is offered by Eagle Technology (Official Esri Distributor). Eagle Technology offers services that can be used in the ArcGIS platform. The Content team at Eagle Technology updates the layers on a regular basis and regularly adds new content to the Living Atlas. By using this content and combining it with other data you can create new information products quickly and easily.</span></div><div style='font-family:&quot;Avenir Next W01&quot;, &quot;Avenir Next W00&quot;, &quot;Avenir Next&quot;, Avenir, &quot;Helvetica Neue&quot;, Helvetica, Arial, sans-serif !important;'>&nbsp;</div><div style='font-family:&quot;Avenir Next W01&quot;, &quot;Avenir Next W00&quot;, &quot;Avenir Next&quot;, Avenir, &quot;Helvetica Neue&quot;, Helvetica, Arial, sans-serif !important;'><span style='color:#2f4f4f; font-size:medium;'>If you have any questions or comments about the content, please let us now&nbsp; at&nbsp;</span><a style='color:rgb(0, 121, 193); text-decoration-line:none;' href='mailto:livingatlas@eagle.co.nz' target='_blank' rel='nofollow ugc noopener noreferrer'><span style='font-size:medium;'>livingatlas@eagle.co.nz</span></a></div></div></div>",
			"keyword": [
				"Boundary",
				"Boundaries",
				"New zealand",
				"Statistics New Zealand",
				"StatsNZ",
				"Eagle technology",
				"Nz",
				"Content",
				"Kiwi",
				"eaglegis"
			],
			"issued": "2021-02-04T00:58:43.000Z",
			"modified": "2026-11-11T09:19:00.481Z",
			"publisher": {
				"name": "Eagle Technology Group Ltd"
			},
			"contactPoint": {
				"@type": "vcard:Contact",
				"fn": "eaglegis",
				"hasEmail": "mailto:ts@eaglegis.co.nz"
			},
			"accessLevel": "public",
			"spatial": "166.2620,-47.2230,-177.6189,-33.7734",
			"license": "https://creativecommons.org/licenses/by/4.0",
			"distribution": [
				{
					"@type": "dcat:Distribution",
					"title": "ArcGIS Hub Dataset",
					"format": "Web Page",
					"mediaType": "text/html",
					"accessURL": "https://www.pacificgeoportal.com/datasets/eaglegis::nz-territorial-authorities-current"
				},
				{
					"@type": "dcat:Distribution",
					"title": "ArcGIS GeoService",
					"format": "ArcGIS GeoServices REST API",
					"mediaType": "application/json",
					"accessURL": "https://services.arcgis.com/XTtANUDT8Va4DLwI/arcgis/rest/services/nz_territorial_authorities/FeatureServer/0"
				},
				{
					"@type": "dcat:Distribution",
					"title": "CSV",
					"format": "CSV",
					"mediaType": "text/csv",
					"accessURL": "https://www.pacificgeoportal.com/api/download/v1/items/288ba59f0f5b424e80082ce668de7a8d/csv?layers=0"
				},
				{
					"@type": "dcat:Distribution",
					"title": "Shapefile",
					"format": "ZIP",
					"mediaType": "application/zip",
					"accessURL": "https://www.pacificgeoportal.com/api/download/v1/items/288ba59f0f5b424e80082ce668de7a8d/shapefile?layers=0"
				},
				{
					"@type": "dcat:Distribution",
					"title": "GeoJSON",
					"format": "GeoJSON",
					"mediaType": "application/vnd.geo+json",
					"accessURL": "https://www.pacificgeoportal.com/api/download/v1/items/288ba59f0f5b424e80082ce668de7a8d/geojson?layers=0"
				},
				{
					"@type": "dcat:Distribution",
					"title": "KML",
					"format": "KML",
					"mediaType": "application/vnd.google-earth.kml+xml",
					"accessURL": "https://www.pacificgeoportal.com/api/download/v1/items/288ba59f0f5b424e80082ce668de7a8d/kml?layers=0"
				},
				{
					"@type": "dcat:Distribution",
					"title": "File Geodatabase",
					"format": "ZIP",
					"mediaType": "application/zip",
					"accessURL": "https://www.pacificgeoportal.com/api/download/v1/items/288ba59f0f5b424e80082ce668de7a8d/filegdb?layers=0"
				},
				{
					"@type": "dcat:Distribution",
					"title": "Feature Collection",
					"format": "TXT",
					"mediaType": "text/plain",
					"accessURL": "https://www.pacificgeoportal.com/api/download/v1/items/288ba59f0f5b424e80082ce668de7a8d/featureCollection?layers=0"
				},
				{
					"@type": "dcat:Distribution",
					"title": "Excel",
					"format": "XLSX",
					"mediaType": "application/vnd.ms-excel",
					"accessURL": "https://www.pacificgeoportal.com/api/download/v1/items/288ba59f0f5b424e80082ce668de7a8d/excel?layers=0"
				},
				{
					"@type": "dcat:Distribution",
					"title": "GeoPackage",
					"format": "GPKG",
					"mediaType": "application/geopackage+sqlite3",
					"accessURL": "https://www.pacificgeoportal.com/api/download/v1/items/288ba59f0f5b424e80082ce668de7a8d/geoPackage?layers=0"
				},
				{
					"@type": "dcat:Distribution",
					"title": "SQLite Geodatabase",
					"format": "GDB",
					"mediaType": "application/geopackage+sqlite3",
					"accessURL": "https://www.pacificgeoportal.com/api/download/v1/items/288ba59f0f5b424e80082ce668de7a8d/sqlite?layers=0"
				}
			],
			"theme": [
				"geospatial"
			]
		},
		{
			"@type": "dcat:Dataset",
			"identifier": "https://www.arcgis.com/home/item.html?id=bab0ff4386eb4522b87d9cda6883f178&sublayer=0",
			"landingPage": "https://www.pacificgeoportal.com/datasets/eaglegis::nz-district-health-board-boundaries-generalised",
			"title": "NZ District Health Board boundaries - generalised",
			"description": "<div style='font-family:&quot;Avenir Next W01&quot;, &quot;Avenir Next W00&quot;, &quot;Avenir Next&quot;, Avenir, &quot;Helvetica Neue&quot;, Helvetica, Arial, sans-serif !important; font-size:17px;'><span style='font-size:medium;'>Topicality: august 2017</span></div><div style='font-family:&quot;Avenir Next W01&quot;, &quot;Avenir Next W00&quot;, &quot;Avenir Next&quot;, Avenir, &quot;Helvetica Neue&quot;, Helvetica, Arial, sans-serif !important; font-size:17px;'><div><span style='font-size:medium;'>Projection: New Zealand Transverse Mercator (NZTM)</span></div><div><span style='font-size:medium;'>Updates April 2020: Clipped to coastline, added Ministry of Health codes (See data tab)</span></div><div>&nbsp;</div></div><div style='font-family:&quot;Avenir Next W01&quot;, &quot;Avenir Next W00&quot;, &quot;Avenir Next&quot;, Avenir, &quot;Helvetica Neue&quot;, Helvetica, Arial, sans-serif !important; font-size:17px;'><br />&nbsp;</div><div><span style='background-color:rgb(255,255,255); color:rgb(20,20,20); font-family:&quot;Avenir Next&quot;, Avenir, &quot;Helvetica Neue&quot;, sans-serif; font-size:16px;'><span style='display:inline !important; float:none; font-style:normal; font-variant-caps:normal; font-variant-ligatures:normal; font-weight:400; letter-spacing:normal; text-align:start; text-decoration-color:initial; text-decoration-style:initial; text-indent:0px; text-transform:none; word-spacing:0px;'>This layer contains the New Zealand District Health Board boundaries that were used until 1 July 2022 as published by Stats NZ. District Health Boards were responsible for providing or buying Government funded health care services for the population of a specific geographical area. They have now been replaced by Te Whatu Ora Health New Zealand and Te Aka Whai Ora Māori Health Authority.</span></span></div><div>&nbsp;</div><div><span style='font-size:medium;'><font>District Health Boards have existed since 1 January 2001 until they were dissolved on 1 July 2022. The amalgamation of Otago and Southland into the Southern District Health Board in 2010 reduced the number of District Health Boards from 21 to 20 (excluding 'Area outside District Health Board')</font></span><br />&nbsp;</div><div style='font-family:&quot;Avenir Next W01&quot;, &quot;Avenir Next W00&quot;, &quot;Avenir Next&quot;, Avenir, &quot;Helvetica Neue&quot;, Helvetica, Arial, sans-serif !important; font-size:17px;'><span style='font-size:medium;'><font>The official dataset can be found on&nbsp;</font></span><a target='_blank' href='https://datafinder.stats.govt.nz/layer/87883-district-health-board-2015/' rel='nofollow ugc noopener noreferrer'>https://datafinder.stats.govt.nz</a><span style='font-size:medium;'>.</span></div><div style='font-family:&quot;Avenir Next W01&quot;, &quot;Avenir Next W00&quot;, &quot;Avenir Next&quot;, Avenir, &quot;Helvetica Neue&quot;, Helvetica, Arial, sans-serif !important; font-size:17px;'><br />&nbsp;<span style='font-size:medium;'>This layer contains the following attributes (see data tab):</span></div><div style='font-family:&quot;Avenir Next W01&quot;, &quot;Avenir Next W00&quot;, &quot;Avenir Next&quot;, Avenir, &quot;Helvetica Neue&quot;, Helvetica, Arial, sans-serif; font-size:17px;'><ul><li><span style='font-size:medium;'>District Health Board code</span></li><li><span style='font-size:medium;'>District Health Board&nbsp;name</span></li><li><span style='font-size:medium;'>Three digit code</span></li><li><span style='font-size:medium;'>Four digit code</span></li><li><span style='font-size:medium;'>Char code</span></li><li><span style='font-size:medium;'>HPI code (Health Provider Index)</span>&nbsp;</li></ul></div><div style='font-family:&quot;Avenir Next W01&quot;, &quot;Avenir Next W00&quot;, &quot;Avenir Next&quot;, Avenir, &quot;Helvetica Neue&quot;, Helvetica, Arial, sans-serif !important; font-size:17px;'><span style='font-size:medium;'>The layer is further generalised and clipped to the coastline by Eagle Technology for improved performance on the web,&nbsp;therefore it doesn't fully represent the official boundaries.</span></div><div style='font-family:&quot;Avenir Next W01&quot;, &quot;Avenir Next W00&quot;, &quot;Avenir Next&quot;, Avenir, &quot;Helvetica Neue&quot;, Helvetica, Arial, sans-serif !important; font-size:17px;'><ul><li><span style='font-size:medium;'>The data is generalized using the tool Simplify Polygon using the Retain critical points (Dougla-Peucker) algorithm with a simplification tolerance of 10m.</span></li><li><span style='font-size:medium;'>The data is clipped using the </span><a target='_blank' href='https://www.arcgis.com/home/item.html?id=3b4ed8eadb8241989056bdb909d1a9c6' rel='nofollow ugc noopener noreferrer'><span style='font-size:medium;'>LINZ NZ Coastlines and Islands Polygons - Topo 1:50k</span></a><span style='font-size:medium;'> layer</span><br />&nbsp;</li></ul></div><div style='font-family:&quot;Avenir Next W01&quot;, &quot;Avenir Next W00&quot;, &quot;Avenir Next&quot;, Avenir, &quot;Helvetica Neue&quot;, Helvetica, Arial, sans-serif !important; font-size:17px;'><div><span style='color:#2f4f4f; font-size:medium;'>If you have any questions or comments about the content, please let us now&nbsp; at </span><a href='mailto:livingatlas@eagle.co.nz' target='_blank' rel='nofollow ugc noopener noreferrer'><span style='font-size:medium;'>livingatlas@eagle.co.nz</span></a><span style='font-size:medium;'>.</span></div></div>",
			"keyword": [
				"Boundary",
				"New Zealand",
				"Territorial Authorities",
				"Councils",
				"Statistics New Zealand",
				"StatsNZ",
				"Boundaries",
				"Council",
				"Region",
				"data",
				"dataset",
				"Eagle Technology",
				"open",
				"2018",
				"layer",
				"web",
				"web layer",
				"service",
				"map",
				"map layer",
				"NZ",
				"Content",
				"Kiwi",
				"municipalities",
				"Territorial Authority",
				"Authority",
				"Authorities",
				"border",
				"boundary",
				"StatNZ",
				"Community",
				"Board",
				"Communit Board",
				"local",
				"local board",
				"city",
				"council",
				"Health",
				"District",
				"Health Board",
				"District Health Board",
				"eaglegis",
				"DHB",
				"DHBs",
				"DHB's"
			],
			"issued": "2018-09-07T03:35:27.000Z",
			"modified": "2026-05-18T05:55:32.339Z",
			"publisher": {
				"name": "Eagle Technology Group Ltd"
			},
			"contactPoint": {
				"@type": "vcard:Contact",
				"fn": "eaglegis",
				"hasEmail": "mailto:ts@eaglegis.co.nz"
			},
			"accessLevel": "public",
			"spatial": "166.2621,-47.2230,-177.5878,-34.0306",
			"license": "https://creativecommons.org/licenses/by/4.0",
			"distribution": [
				{
					"@type": "dcat:Distribution",
					"title": "ArcGIS Hub Dataset",
					"format": "Web Page",
					"mediaType": "text/html",
					"accessURL": "https://www.pacificgeoportal.com/datasets/eaglegis::nz-district-health-board-boundaries-generalised"
				},
				{
					"@type": "dcat:Distribution",
					"title": "ArcGIS GeoService",
					"format": "ArcGIS GeoServices REST API",
					"mediaType": "application/json",
					"accessURL": "https://services.arcgis.com/XTtANUDT8Va4DLwI/arcgis/rest/services/NZ_District_Health_Board_boundaries/FeatureServer/0"
				},
				{
					"@type": "dcat:Distribution",
					"title": "CSV",
					"format": "CSV",
					"mediaType": "text/csv",
					"accessURL": "https://www.pacificgeoportal.com/api/download/v1/items/bab0ff4386eb4522b87d9cda6883f178/csv?layers=0"
				},
				{
					"@type": "dcat:Distribution",
					"title": "Shapefile",
					"format": "ZIP",
					"mediaType": "application/zip",
					"accessURL": "https://www.pacificgeoportal.com/api/download/v1/items/bab0ff4386eb4522b87d9cda6883f178/shapefile?layers=0"
				},
				{
					"@type": "dcat:Distribution",
					"title": "GeoJSON",
					"format": "GeoJSON",
					"mediaType": "application/vnd.geo+json",
					"accessURL": "https://www.pacificgeoportal.com/api/download/v1/items/bab0ff4386eb4522b87d9cda6883f178/geojson?layers=0"
				},
				{
					"@type": "dcat:Distribution",
					"title": "KML",
					"format": "KML",
					"mediaType": "application/vnd.google-earth.kml+xml",
					"accessURL": "https://www.pacificgeoportal.com/api/download/v1/items/bab0ff4386eb4522b87d9cda6883f178/kml?layers=0"
				},
				{
					"@type": "dcat:Distribution",
					"title": "File Geodatabase",
					"format": "ZIP",
					"mediaType": "application/zip",
					"accessURL": "https://www.pacificgeoportal.com/api/download/v1/items/bab0ff4386eb4522b87d9cda6883f178/filegdb?layers=0"
				},
				{
					"@type": "dcat:Distribution",
					"title": "Feature Collection",
					"format": "TXT",
					"mediaType": "text/plain",
					"accessURL": "https://www.pacificgeoportal.com/api/download/v1/items/bab0ff4386eb4522b87d9cda6883f178/featureCollection?layers=0"
				},
				{
					"@type": "dcat:Distribution",
					"title": "Excel",
					"format": "XLSX",
					"mediaType": "application/vnd.ms-excel",
					"accessURL": "https://www.pacificgeoportal.com/api/download/v1/items/bab0ff4386eb4522b87d9cda6883f178/excel?layers=0"
				},
				{
					"@type": "dcat:Distribution",
					"title": "GeoPackage",
					"format": "GPKG",
					"mediaType": "application/geopackage+sqlite3",
					"accessURL": "https://www.pacificgeoportal.com/api/download/v1/items/bab0ff4386eb4522b87d9cda6883f178/geoPackage?layers=0"
				},
				{
					"@type": "dcat:Distribution",
					"title": "SQLite Geodatabase",
					"format": "GDB",
					"mediaType": "application/geopackage+sqlite3",
					"accessURL": "https://www.pacificgeoportal.com/api/download/v1/items/bab0ff4386eb4522b87d9cda6883f178/sqlite?layers=0"
				}
			],
			"theme": [
				"geospatial"
			]
		},
		{
			"@type": "dcat:Dataset",
			"identifier": "https://www.arcgis.com/home/item.html?id=1db3f4f7fd3d4ca3ba61c38d7f58fbf7&sublayer=0",
			"landingPage": "https://www.pacificgeoportal.com/datasets/eaglegis::nz-elevation-metadata",
			"title": "NZ Elevation - Metadata",
			"description": "See the <span style='font-weight:bold;'><a href='https://www.arcgis.com/home/item.html?id=2ce4fe7d77024e719f8a04d2155b3fd2' target='_blank' rel='nofollow ugc noopener noreferrer'>NZ Elevation</a></span> Layer for more information on the NZ Elevation layer<br /><div><br />The\n<span style='font-weight:bold;'> NZ Elevation - Metadata</span> layer provides information about the data used for the NZ Elevation layer. You can identify what areas use 1m or 2m DEM's derived from LiDAR and what areas use the <a href='https://data.linz.govt.nz/layer/51768' target='_blank' rel='nofollow ugc noopener noreferrer'>8m DEM</a> provided by LINZ. You can also find information, whenever available, about capture dates, point cloud density and links to the layer's in the LINZ Data Service.<br /></div><div><br /></div><div>The NZ Elevation layer is an elevation surface for use in 3D \napplications in the NZTM projection. By adding this layer to a Scene in \nArcGIS Pro or in the Scene Viewer it will be define the base height in \nyour application.<br /></div><div><br /></div><div>NZTM Basemaps can be \nused on top of this service, providing it shares the same tiling \nscheme. When combining it with the NZ Basemaps provided by Eagle Technolgy, make sure to use the raster basemaps with the updated tiling scheme or one of the vector basemaps. All the compatible basemaps can be found in this <a href='https://www.arcgis.com/home/group.html?id=c8d07daebe3942e69fbda649fee68a9f#overview' target='_blank' rel='nofollow ugc noopener noreferrer'>group</a>. <br /></div><div><br /></div><div>When creating your own basemap or tiled layer make sure to use the tiling scheme provided <a href='https://eaglegis.maps.arcgis.com/home/item.html?id=75d8c2aec505409ead3c07f6e89f56fb' target='_blank' rel='nofollow ugc noopener noreferrer'>here</a>.<br /></div><div><br /></div><div>The elevation service is made \nup of the available publicly-owned 1m and 2m dems. For areas where 1m/2m \nelevation data is not available the<a href='https://data.linz.govt.nz/layer/51768-nz-8m-digital-elevation-model-2012/' target='_blank' rel='nofollow ugc noopener noreferrer'> 8m dem</a> provided by LINZ is being used. Outside of the coverage of the 8m dem, a 0m dem is used for visual purposes.<br /></div><div><b><br /></b></div><div>This\n service is offered by Eagle Technology (Official Esri Distributor). \nEagle Technology offers layers and maps that can be used in the ArcGIS \nplatform. The Content team at Eagle Technology updates the layers on a \nregular basis and regularly adds new content to the Living Atlas. By \nusing this content and combining it with other data you can create new \ninformation products quickly and easily.<br /><br />If you have any questions or remarks about the content, please let us now at <a href='mailto:livingatlas@eagle.co.nz' target='_blank' rel='nofollow ugc noopener noreferrer'>livingatlas@eagle.co.nz</a><br /></div>",
			"keyword": [
				"Aotearoa",
				"NZ",
				"Elevation",
				"Surface",
				"NZTM",
				"New Zealand",
				"3D",
				"Scene",
				"Ground",
				"terrain",
				"eaglegis",
				"basemap",
				"metadata"
			],
			"issued": "2021-12-18T09:05:06.000Z",
			"modified": "2026-09-28T04:39:07.854Z",
			"publisher": {
				"name": "Eagle Technology Group Ltd"
			},
			"contactPoint": {
				"@type": "vcard:Contact",
				"fn": "eaglegis",
				"hasEmail": "mailto:ts@eaglegis.co.nz"
			},
			"accessLevel": "public",
			"spatial": "-180.0000,-57.0395,180.0000,-22.3065",
			"license": "By using this layer you conform to the Eagle Technology web services terms of use.<br /><ul><li>Fair Use</li><li>Use in combination with ArcGIS software</li><li>The data is sourced from third parties. </li><li>Eagle Technology gives no warranties in relation to the web services.</li></ul><div>Please get in touch on <a href='mailto:livingatlas@eagle.co.nz' target='_blank' rel='nofollow ugc noopener noreferrer'>livingatlas@eagle.co.nz</a> if you have any questions.<br /></div><div><span style='font-weight:bold;'></span></div>",
			"distribution": [
				{
					"@type": "dcat:Distribution",
					"title": "ArcGIS Hub Dataset",
					"format": "Web Page",
					"mediaType": "text/html",
					"accessURL": "https://www.pacificgeoportal.com/datasets/eaglegis::nz-elevation-metadata"
				},
				{
					"@type": "dcat:Distribution",
					"title": "ArcGIS GeoService",
					"format": "ArcGIS GeoServices REST API",
					"mediaType": "application/json",
					"accessURL": "https://services.arcgis.com/XTtANUDT8Va4DLwI/arcgis/rest/services/new_zealand_elevation_metadata/FeatureServer/0"
				},
				{
					"@type": "dcat:Distribution",
					"title": "CSV",
					"format": "CSV",
					"mediaType": "text/csv",
					"accessURL": "https://www.pacificgeoportal.com/api/download/v1/items/1db3f4f7fd3d4ca3ba61c38d7f58fbf7/csv?layers=0"
				},
				{
					"@type": "dcat:Distribution",
					"title": "Shapefile",
					"format": "ZIP",
					"mediaType": "application/zip",
					"accessURL": "https://www.pacificgeoportal.com/api/download/v1/items/1db3f4f7fd3d4ca3ba61c38d7f58fbf7/shapefile?layers=0"
				},
				{
					"@type": "dcat:Distribution",
					"title": "GeoJSON",
					"format": "GeoJSON",
					"mediaType": "application/vnd.geo+json",
					"accessURL": "https://www.pacificgeoportal.com/api/download/v1/items/1db3f4f7fd3d4ca3ba61c38d7f58fbf7/geojson?layers=0"
				},
				{
					"@type": "dcat:Distribution",
					"title": "KML",
					"format": "KML",
					"mediaType": "application/vnd.google-earth.kml+xml",
					"accessURL": "https://www.pacificgeoportal.com/api/download/v1/items/1db3f4f7fd3d4ca3ba61c38d7f58fbf7/kml?layers=0"
				},
				{
					"@type": "dcat:Distribution",
					"title": "File Geodatabase",
					"format": "ZIP",
					"mediaType": "application/zip",
					"accessURL": "https://www.pacificgeoportal.com/api/download/v1/items/1db3f4f7fd3d4ca3ba61c38d7f58fbf7/filegdb?layers=0"
				},
				{
					"@type": "dcat:Distribution",
					"title": "Feature Collection",
					"format": "TXT",
					"mediaType": "text/plain",
					"accessURL": "https://www.pacificgeoportal.com/api/download/v1/items/1db3f4f7fd3d4ca3ba61c38d7f58fbf7/featureCollection?layers=0"
				},
				{
					"@type": "dcat:Distribution",
					"title": "Excel",
					"format": "XLSX",
					"mediaType": "application/vnd.ms-excel",
					"accessURL": "https://www.pacificgeoportal.com/api/download/v1/items/1db3f4f7fd3d4ca3ba61c38d7f58fbf7/excel?layers=0"
				},
				{
					"@type": "dcat:Distribution",
					"title": "GeoPackage",
					"format": "GPKG",
					"mediaType": "application/geopackage+sqlite3",
					"accessURL": "https://www.pacificgeoportal.com/api/download/v1/items/1db3f4f7fd3d4ca3ba61c38d7f58fbf7/geoPackage?layers=0"
				},
				{
					"@type": "dcat:Distribution",
					"title": "SQLite Geodatabase",
					"format": "GDB",
					"mediaType": "application/geopackage+sqlite3",
					"accessURL": "https://www.pacificgeoportal.com/api/download/v1/items/1db3f4f7fd3d4ca3ba61c38d7f58fbf7/sqlite?layers=0"
				}
			],
			"theme": [
				"geospatial"
			]
		},
		{
			"@type": "dcat:Dataset",
			"identifier": "https://www.arcgis.com/home/item.html?id=ec067623611d40d086193b21a3a4fce1",
			"landingPage": "https://www.pacificgeoportal.com/content/esri::bioclimate-projections-19-precipitation-of-coldest-quarter",
			"title": "Bioclimate Projections: (19) Precipitation of Coldest Quarter",
			"description": "<p><span style='color:#dc143c;'><strong>Retirement Notice:</strong></span><strong>&nbsp; This </strong><a target='_blank' href='https://goto.arcgis.com/termsofuse/beta' rel='nofollow ugc noopener noreferrer'><strong>beta</strong></a><strong> item will be retired in December 2026. A&nbsp;</strong><a target='_blank' href='https://www.arcgis.com/home/item.html?id=6fa3e53ca730478aaba35287f85a5ac2' rel='nofollow ugc noopener noreferrer'><strong>new version of this item</strong></a><strong>&nbsp;is available for your use. </strong>Esri recommends updating your maps and apps to use the new version.&nbsp;</p><div><p><span style='background-attachment:initial; background-clip:initial; background-image:initial; background-origin:initial; background-position:initial; background-repeat:initial; background-size:initial;'>This layer represents CMIP6 future projections of total precipitation during the three coldest months of the year. This layer can be used to compare with recent climate histories to better understand the potential impacts of future climate change.</span></p><p><a target='_blank' href='https://worldclim.org/' rel='nofollow ugc noopener noreferrer'><span style='background-attachment:initial; background-clip:initial; background-image:initial; background-origin:initial; background-position:initial; background-repeat:initial; background-size:initial;'>WorldClim</span></a><span style='background-attachment:initial; background-clip:initial; background-image:initial; background-origin:initial; background-position:initial; background-repeat:initial; background-size:initial;'> produced this projection as part of a series of </span><a target='_blank' href='https://pubs.usgs.gov/ds/691/ds691.pdf' rel='nofollow ugc noopener noreferrer'><span style='background-attachment:initial; background-clip:initial; background-image:initial; background-origin:initial; background-position:initial; background-repeat:initial; background-size:initial;'>19 bioclimate variables identified by the USGS</span></a><span style='background-attachment:initial; background-clip:initial; background-image:initial; background-origin:initial; background-position:initial; background-repeat:initial; background-size:initial;'> and provides this description:</span><br /><br /><i>\"Bioclimatic variables are derived from the monthly temperature and rainfall values in order to generate more biologically meaningful variables. These are often used in species distribution modeling and related ecological modeling techniques. The bioclimatic variables represent annual trends (e.g., mean annual temperature, annual precipitation) seasonality (e.g., annual range in temperature and precipitation) and extreme or limiting environmental factors (e.g., temperature of the coldest and warmest month, and precipitation of the wet and dry quarters). A quarter is a period of three months (1/4 of the year).\"</i></p><p style='background-color:white; margin-bottom:0in;'><span style='color:#4C4C4C;'><strong>Time Extent:</strong> averages from 2021-2040, 2041-2060, 2061-2080, 2081-2100</span><br /><strong>Units:</strong>&nbsp;mm<br /><strong>Cell Size:</strong> 2.5 minutes (~5 km)<br /><strong>Source Type:</strong> Stretched<br /><strong>Pixel Type:</strong> 32 Bit Float<br /><strong>Data Projection:</strong> GCS WGS84<br /><strong>Mosaic Projection:</strong> GCS WGS84<br /><strong>Extent: </strong>Global<br /><strong>Source:</strong> <a target='_blank' href='https://worldclim.org/data/cmip6/cmip6_clim2.5m.html' rel='nofollow ugc noopener noreferrer'>WorldClim CMIP6 Bioclimate</a><br />&nbsp;</p><p><strong>Climate Scenarios</strong></p><p>The CMIP6 climate experiments use&nbsp;<a target='_blank' href='https://www.carbonbrief.org/explainer-how-shared-socioeconomic-pathways-explore-future-climate-change/' rel='nofollow ugc noopener noreferrer'>Shared Socioeconomic Pathways (SSPs)</a>&nbsp;to model future climate scenarios. Each SSP pairs a human/community behavior component with the traditional RCP greenhouse gas forcing from the previous CMIP5. Three SSPs were chosen by Esri to be included in the service based on user requests: SSP2 4.5, SSP3 7.0 and SSP5 8.5.</p><figure><table style='background-color:#F8F9FA; border-collapse:collapse;' width='850' cellpadding='0' cellspacing='0' border='1'><tbody><tr><td style='background-color:#EAECF0; border:1.0pt solid #A2A9B1; padding:2.4pt 4.8pt;'><p style='margin:12.0pt 0in; text-align:center;'><span style='color:#202122; font-family:&quot;Arial&quot;,sans-serif; font-size:10.5pt;'><strong>SSP</strong></span></p></td><td style='background-color:#EAECF0; border-bottom-style:solid; border-color:#A2A9B1; border-left-style:none; border-right-style:solid; border-top-style:solid; border-width:1.0pt; padding:2.4pt 4.8pt;'><p style='margin:12.0pt 0in; text-align:center;'><span style='color:#202122; font-family:&quot;Arial&quot;,sans-serif; font-size:10.5pt;'><strong>Scenario</strong></span></p></td><td style='background-color:#EAECF0; border-bottom-style:solid; border-color:#A2A9B1; border-left-style:none; border-right-style:solid; border-top-style:solid; border-width:1.0pt; padding:2.4pt 4.8pt;'><p style='margin:12.0pt 0in; text-align:center;'><span style='color:#202122; font-family:&quot;Arial&quot;,sans-serif; font-size:10.5pt;'><strong>Estimated warming</strong></span><br /><span style='color:#202122; font-family:&quot;Arial&quot;,sans-serif; font-size:10.5pt;'><strong>(2041–2060)</strong></span></p></td><td style='background-color:#EAECF0; border-bottom-style:solid; border-color:#A2A9B1; border-left-style:none; border-right-style:solid; border-top-style:solid; border-width:1.0pt; padding:2.4pt 4.8pt;'><p style='margin:12.0pt 0in; text-align:center;'><span style='color:#202122; font-family:&quot;Arial&quot;,sans-serif; font-size:10.5pt;'><strong>Estimated warming</strong></span><br /><span style='color:#202122; font-family:&quot;Arial&quot;,sans-serif; font-size:10.5pt;'><strong>(2081–2100)</strong></span></p></td><td style='background-color:#EAECF0; border-bottom-style:solid; border-color:#A2A9B1; border-left-style:none; border-right-style:solid; border-top-style:solid; border-width:1.0pt; padding:2.4pt 4.8pt;'><p style='margin:12.0pt 0in; text-align:center;'><span style='color:#202122; font-family:&quot;Arial&quot;,sans-serif; font-size:10.5pt;'><strong>Very likely range in °C</strong></span><br /><span style='color:#202122; font-family:&quot;Arial&quot;,sans-serif; font-size:10.5pt;'><strong>(2081–2100)</strong></span></p></td></tr><tr><td style='border-bottom-style:solid; border-color:#A2A9B1; border-left-style:solid; border-right-style:solid; border-top-style:none; border-width:1.0pt; padding:2.4pt 4.8pt;'><p style='margin:12.0pt 0in; text-align:center;'><span style='color:#202122; font-family:&quot;Arial&quot;,sans-serif; font-size:10.5pt;'>SSP2-4.5</span></p></td><td style='border-bottom:1.0pt solid #A2A9B1; border-left-style:none; border-right:1.0pt solid #A2A9B1; border-top-style:none; padding:2.4pt 4.8pt;'><p style='margin:12.0pt 0in; text-align:center;'><span style='color:#202122; font-family:&quot;Arial&quot;,sans-serif; font-size:10.5pt;'>intermediate GHG emissions:</span><br /><span style='color:#202122; font-family:&quot;Arial&quot;,sans-serif; font-size:10.5pt;'>CO</span><span style='color:#202122; font-family:&quot;Arial&quot;,sans-serif; font-size:8.5pt;'><sub>2</sub></span><span style='color:#202122; font-family:&quot;Arial&quot;,sans-serif; font-size:10.5pt;'>&nbsp;emissions around current levels until 2050, then falling but not reaching net zero by 2100</span></p></td><td style='border-bottom:1.0pt solid #A2A9B1; border-left-style:none; border-right:1.0pt solid #A2A9B1; border-top-style:none; padding:2.4pt 4.8pt;'><p style='margin:12.0pt 0in; text-align:center;'><span style='color:#202122; font-family:&quot;Arial&quot;,sans-serif; font-size:10.5pt;'>2.0 °C</span></p></td><td style='border-bottom:1.0pt solid #A2A9B1; border-left-style:none; border-right:1.0pt solid #A2A9B1; border-top-style:none; padding:2.4pt 4.8pt;'><p style='margin:12.0pt 0in; text-align:center;'><span style='color:#202122; font-family:&quot;Arial&quot;,sans-serif; font-size:10.5pt;'>2.7 °C</span></p></td><td style='border-bottom:1.0pt solid #A2A9B1; border-left-style:none; border-right:1.0pt solid #A2A9B1; border-top-style:none; padding:2.4pt 4.8pt;'><p style='margin:12.0pt 0in; text-align:center;'><span style='color:#202122; font-family:&quot;Arial&quot;,sans-serif; font-size:10.5pt;'>2.1 – 3.5</span></p></td></tr><tr><td style='border-bottom-style:solid; border-color:#A2A9B1; border-left-style:solid; border-right-style:solid; border-top-style:none; border-width:1.0pt; padding:2.4pt 4.8pt;'><p style='margin:12.0pt 0in; text-align:center;'><span style='color:#202122; font-family:&quot;Arial&quot;,sans-serif; font-size:10.5pt;'>SSP3-7.0</span></p></td><td style='border-bottom:1.0pt solid #A2A9B1; border-left-style:none; border-right:1.0pt solid #A2A9B1; border-top-style:none; padding:2.4pt 4.8pt;'><p style='margin:12.0pt 0in; text-align:center;'><span style='color:#202122; font-family:&quot;Arial&quot;,sans-serif; font-size:10.5pt;'>high GHG emissions:</span><br /><span style='color:#202122; font-family:&quot;Arial&quot;,sans-serif; font-size:10.5pt;'>CO</span><span style='color:#202122; font-family:&quot;Arial&quot;,sans-serif; font-size:8.5pt;'><sub>2</sub></span><span style='color:#202122; font-family:&quot;Arial&quot;,sans-serif; font-size:10.5pt;'>&nbsp;emissions double by 2100</span></p></td><td style='border-bottom:1.0pt solid #A2A9B1; border-left-style:none; border-right:1.0pt solid #A2A9B1; border-top-style:none; padding:2.4pt 4.8pt;'><p style='margin:12.0pt 0in; text-align:center;'><span style='color:#202122; font-family:&quot;Arial&quot;,sans-serif; font-size:10.5pt;'>2.1 °C</span></p></td><td style='border-bottom:1.0pt solid #A2A9B1; border-left-style:none; border-right:1.0pt solid #A2A9B1; border-top-style:none; padding:2.4pt 4.8pt;'><p style='margin:12.0pt 0in; text-align:center;'><span style='color:#202122; font-family:&quot;Arial&quot;,sans-serif; font-size:10.5pt;'>3.6 °C</span></p></td><td style='border-bottom:1.0pt solid #A2A9B1; border-left-style:none; border-right:1.0pt solid #A2A9B1; border-top-style:none; padding:2.4pt 4.8pt;'><p style='margin:12.0pt 0in; text-align:center;'><span style='color:#202122; font-family:&quot;Arial&quot;,sans-serif; font-size:10.5pt;'>2.8 – 4.6</span></p></td></tr><tr><td style='border-bottom-style:solid; border-color:#A2A9B1; border-left-style:solid; border-right-style:solid; border-top-style:none; border-width:1.0pt; padding:2.4pt 4.8pt;'><p style='margin:12.0pt 0in; text-align:center;'><span style='color:#202122; font-family:&quot;Arial&quot;,sans-serif; font-size:10.5pt;'>SSP5-8.5</span></p></td><td style='border-bottom:1.0pt solid #A2A9B1; border-left-style:none; border-right:1.0pt solid #A2A9B1; border-top-style:none; padding:2.4pt 4.8pt;'><p style='margin:12.0pt 0in; text-align:center;'><span style='color:#202122; font-family:&quot;Arial&quot;,sans-serif; font-size:10.5pt;'>very high GHG emissions:</span><br /><span style='color:#202122; font-family:&quot;Arial&quot;,sans-serif; font-size:10.5pt;'>CO</span><span style='color:#202122; font-family:&quot;Arial&quot;,sans-serif; font-size:8.5pt;'><sub>2</sub></span><span style='color:#202122; font-family:&quot;Arial&quot;,sans-serif; font-size:10.5pt;'>&nbsp;emissions triple by 2075</span></p></td><td style='border-bottom:1.0pt solid #A2A9B1; border-left-style:none; border-right:1.0pt solid #A2A9B1; border-top-style:none; padding:2.4pt 4.8pt;'><p style='margin:12.0pt 0in; text-align:center;'><span style='color:#202122; font-family:&quot;Arial&quot;,sans-serif; font-size:10.5pt;'>2.4 °C</span></p></td><td style='border-bottom:1.0pt solid #A2A9B1; border-left-style:none; border-right:1.0pt solid #A2A9B1; border-top-style:none; padding:2.4pt 4.8pt;'><p style='margin:12.0pt 0in; text-align:center;'><span style='color:#202122; font-family:&quot;Arial&quot;,sans-serif; font-size:10.5pt;'>4.4 °C</span></p></td><td style='border-bottom:1.0pt solid #A2A9B1; border-left-style:none; border-right:1.0pt solid #A2A9B1; border-top-style:none; padding:2.4pt 4.8pt;'><p style='margin:12.0pt 0in; text-align:center;'><span style='color:#202122; font-family:&quot;Arial&quot;,sans-serif; font-size:10.5pt;'>3.3 – 5.7</span></p></td></tr></tbody></table></figure><p>While the 8.5 scenario is no longer generally considered likely, SSP3 7.0 has been included and is considered the high end of possibilities. SSP5 8.5 has been retained since many organizations report to this threshold. The warming associated with SSP2 4.5 is equivalent to the global targets set at the 2021 United Nations COP26 meetings in Glasgow.&nbsp;</p><p><strong>Processing the Climate Data</strong></p><p>WorldClim provides 20-year averaged outputs for the various SSPs from 24 global climate models. A selection of 13 models were averaged for each variable and time based on <a target='_blank' href='https://rmets.onlinelibrary.wiley.com/doi/full/10.1002/joc.7566' rel='nofollow ugc noopener noreferrer'>Mahony et al 2022</a>. These models included ACCESS-ESM1-5, BCC-CSM2-MR, CanESM5, CNRM-ESM2-1, EC-Earth3-Veg, GFDL-ESM4, GISS-E2-1-G, INM-CM5-0,<span>&nbsp; </span>IPSL-CM6A-LR, MIROC6, MPI-ESM1-2-HR, MRI-ESM2-0, UKESM1-0-LL. GFDL-ESM4 was not available for SSP2 4.5 or SSP5 8.5.&nbsp;</p><p><strong>Accessing the Multidimensional Information</strong></p><p>The time and SSP scenario are built into the layer using a multidimensional raster. Enable the time slider to move across the 20-year average periods. In ArcGIS Online and Pro, use the Multidimensional Filter to select the SSP (SSP2 4.5 is the default).&nbsp;<br /><br /><strong>What can you do with this layer?</strong></p><p>These multidimensional imagery tiles support analysis using ArcGIS Online or Pro. Use the&nbsp;<a target='_blank' href='https://arcgis.com/home/item.html?id=e56c9cb70aa949adb791c4311003d9ae' rel='nofollow ugc noopener noreferrer'>Bioclimate Baseline layer</a>&nbsp;to see the difference in pixels and calculate change from the historic period into the future. Use the&nbsp;<a target='_blank' href='https://pro.arcgis.com/en/pro-app/latest/help/data/imagery/an-overview-of-multidimensional-raster-data.htm' rel='nofollow ugc noopener noreferrer'>Multidimensional&nbsp;</a>tab in ArcGIS Pro to access a variety of useful tools. Each layer or variable can be styled using the Image Display options.&nbsp;</p><p><strong>Known Quality Issues</strong></p><p>Each model is downscaled from ~100km resolution to ~5km resolution by WorldClim. Some artifacts are inevitable, especially at a global scale. Some variables have distinct transitions, especially in Greenland. Also, SSP2 4.5 has missing data for several variables in Antarctica.</p><p><strong>Related Layers</strong></p><p><a target='_blank' href='https://arcgis.com/home/item.html?id=fdaa1b7912e440efb9e29cf5d6156bb0' rel='nofollow ugc noopener noreferrer'>Bioclimate 1&nbsp;<span> </span>Annual Mean Temperature</a><br /><a target='_blank' href='https://arcgis.com/home/item.html?id=8012b34e8c854d6fbcfe4eab437ea397' rel='nofollow ugc noopener noreferrer'>Bioclimate 2&nbsp;<span> </span>Mean Diurnal Range</a>&nbsp;<br /><a target='_blank' href='https://arcgis.com/home/item.html?id=ef9f5d6a16ca41ada0c0075a8da46d48' rel='nofollow ugc noopener noreferrer'>Bioclimate 3&nbsp;<span> </span>Isothermality</a>&nbsp;<br /><a target='_blank' href='https://arcgis.com/home/item.html?id=64799fea8774463aad909020b6590dc8' rel='nofollow ugc noopener noreferrer'>Bioclimate 4&nbsp;<span> </span>Temperature Seasonality</a>&nbsp;<br /><a target='_blank' href='https://arcgis.com/home/item.html?id=8433250e0a4148f5a3889c66e78abdf1' rel='nofollow ugc noopener noreferrer'>Bioclimate 5&nbsp;<span> </span>Max Temperature of Warmest Month</a><br /><a target='_blank' href='https://arcgis.com/home/item.html?id=c531d32ab5d746b88a884b6e54f3216e' rel='nofollow ugc noopener noreferrer'>Bioclimate 6<span>&nbsp; </span>Min Temperature Of Coldest Month</a><br /><a target='_blank' href='https://arcgis.com/home/item.html?id=808cfb3ab1614f8ab7e364de737e9e98' rel='nofollow ugc noopener noreferrer'>Bioclimate 7<span>&nbsp; </span>Temperature Annual Range</a>&nbsp;<br /><a target='_blank' href='https://arcgis.com/home/item.html?id=b5990aa16fd94bb691a09449716ed7e5' rel='nofollow ugc noopener noreferrer'>Bioclimate 8<span>&nbsp; </span>Mean Temperature Of Wettest Quarter</a><br /><a target='_blank' href='https://arcgis.com/home/item.html?id=231770161a46467e8de9fdd9fd92dad7' rel='nofollow ugc noopener noreferrer'>Bioclimate 9<span>&nbsp; </span>Mean Temperature Of Driest Quarter</a><br /><a target='_blank' href='https://arcgis.com/home/item.html?id=3b98ddf1c78d4f0c88bd297f85847c68' rel='nofollow ugc noopener noreferrer'>Bioclimate 10<span>&nbsp; </span>Mean Temperature Of Warmest Quarter</a><br /><a target='_blank' href='https://arcgis.com/home/item.html?id=1a96d928c93c4e8fbc6a2391afd1da2f' rel='nofollow ugc noopener noreferrer'>Bioclimate 11<span>&nbsp; </span>Mean Temperature Of Coldest Quarter</a><br /><a target='_blank' href='https://arcgis.com/home/item.html?id=7bc0b8c75b0244b7a8128ae1f398bfc0' rel='nofollow ugc noopener noreferrer'>Bioclimate 12<span>&nbsp; </span>Annual Precipitation</a><br /><a target='_blank' href='https://arcgis.com/home/item.html?id=36fde801c8124f93b46b727b9873c993' rel='nofollow ugc noopener noreferrer'>Bioclimate 13<span>&nbsp; </span>Precipitation Of Wettest Month</a><br /><a target='_blank' href='https://arcgis.com/home/item.html?id=e26b01e4fa0a4aec9c5db991467b31a7' rel='nofollow ugc noopener noreferrer'>Bioclimate 14<span>&nbsp; </span>Precipitation Of Driest Month</a><br /><a target='_blank' href='https://arcgis.com/home/item.html?id=33558b5fef8642338f33918d498f41cf' rel='nofollow ugc noopener noreferrer'>Bioclimate 15<span>&nbsp; </span>Precipitation Seasonality</a>&nbsp;<br /><a target='_blank' href='https://arcgis.com/home/item.html?id=1324c4e0c86a40e9b7529e91c6bdf220' rel='nofollow ugc noopener noreferrer'>Bioclimate 16<span>&nbsp; </span>Precipitation Of Wettest Quarter</a><br /><a target='_blank' href='https://arcgis.com/home/item.html?id=86fe2a87fe9144f9a5c330a3b5890df0' rel='nofollow ugc noopener noreferrer'>Bioclimate 17<span>&nbsp; </span>Precipitation Of Driest Quarter</a><br /><a target='_blank' href='https://arcgis.com/home/item.html?id=eb8227050ac24b3bb4a47abb924fbc56' rel='nofollow ugc noopener noreferrer'>Bioclimate 18<span>&nbsp; </span>Precipitation Of Warmest Quarter</a><br /><a target='_blank' href='https://arcgis.com/home/item.html?id=ec067623611d40d086193b21a3a4fce1' rel='nofollow ugc noopener noreferrer'>Bioclimate 19<span>&nbsp; </span>Precipitation Of Coldest Quarter</a><br /><a target='_blank' href='https://arcgis.com/home/item.html?id=e56c9cb70aa949adb791c4311003d9ae' rel='nofollow ugc noopener noreferrer'>Bioclimate Baseline 1970-2000</a></p></div>",
			"keyword": [
				"esri_environment",
				"retiring-2026-12"
			],
			"issued": "2022-05-12T14:21:33.000Z",
			"modified": "2026-05-13T19:42:48.000Z",
			"publisher": {
				"name": "Esri"
			},
			"contactPoint": {
				"@type": "vcard:Contact",
				"fn": "esri_environment",
				"hasEmail": "{{orgContactEmail}}"
			},
			"accessLevel": "public",
			"spatial": "-180.0000,-90.0000,180.0000,90.0000",
			"license": "<p><img src='https://downloads.esri.com/blogs/arcgisonline/esrilogo_new.png' /> This work is licensed under the Esri Master License Agreement.&nbsp;</p><p><a target='_blank' href='https://goto.arcgis.com/termsofuse/viewsummary' rel='nofollow ugc noopener noreferrer'>View Summary</a> | <a target='_blank' href='https://goto.arcgis.com/termsofuse/viewtermsofuse' rel='nofollow ugc noopener noreferrer'>View Terms of Use</a></p><div>&nbsp;</div>",
			"distribution": [
				{
					"@type": "dcat:Distribution",
					"title": "ArcGIS Hub Dataset",
					"format": "Web Page",
					"mediaType": "text/html",
					"accessURL": "https://www.pacificgeoportal.com/content/esri::bioclimate-projections-19-precipitation-of-coldest-quarter"
				},
				{
					"@type": "dcat:Distribution",
					"title": "ArcGIS GeoService",
					"format": "ArcGIS GeoServices REST API",
					"mediaType": "application/json",
					"accessURL": "https://tiledimageservices.arcgis.com/P3ePLMYs2RVChkJx/arcgis/rest/services/Bioclimate_Projections__Precipitation_of_Coldest_Quarter/ImageServer"
				}
			],
			"theme": [
				"geospatial"
			]
		},
		{
			"@type": "dcat:Dataset",
			"identifier": "https://www.arcgis.com/home/item.html?id=eb8227050ac24b3bb4a47abb924fbc56",
			"landingPage": "https://www.pacificgeoportal.com/content/esri::bioclimate-projections-18-precipitation-of-warmest-quarter",
			"title": "Bioclimate Projections: (18) Precipitation of Warmest Quarter",
			"description": "<p><span style='color:#dc143c;'><strong>Retirement Notice: </strong></span><strong>This </strong><a target='_blank' href='https://goto.arcgis.com/termsofuse/beta' rel='nofollow ugc noopener noreferrer'><strong>beta</strong></a><strong> item will be retired in December 2026. A</strong><a target='_blank' href='https://www.arcgis.com/home/item.html?id=721506c1e0cd43d4acc8efa6fca00987' rel='nofollow ugc noopener noreferrer'><strong> new version of this item</strong></a><strong>&nbsp;is available for your use. </strong>Esri recommends updating your maps and apps to use the new version.</p><p><span style='background-attachment:initial; background-clip:initial; background-image:initial; background-origin:initial; background-position:initial; background-repeat:initial; background-size:initial;'>This layer represents CMIP6 future projections of total precipitation during the three warmest months of the year. This layer can be used to compare with recent climate histories to better understand the potential impacts of future climate change.</span></p><p><a target='_blank' href='https://worldclim.org/' rel='nofollow ugc noopener noreferrer'><span style='background-attachment:initial; background-clip:initial; background-image:initial; background-origin:initial; background-position:initial; background-repeat:initial; background-size:initial;'>WorldClim</span></a><span style='background-attachment:initial; background-clip:initial; background-image:initial; background-origin:initial; background-position:initial; background-repeat:initial; background-size:initial;'>&nbsp;produced this projection as part of a series of&nbsp;</span><a target='_blank' href='https://pubs.usgs.gov/ds/691/ds691.pdf' rel='nofollow ugc noopener noreferrer'><span style='background-attachment:initial; background-clip:initial; background-image:initial; background-origin:initial; background-position:initial; background-repeat:initial; background-size:initial;'>19 bioclimate variables identified by the USGS</span></a><span style='background-attachment:initial; background-clip:initial; background-image:initial; background-origin:initial; background-position:initial; background-repeat:initial; background-size:initial;'>&nbsp;and provides this description:</span><br /><br /><i>\"Bioclimatic variables are derived from the monthly temperature and rainfall values in order to generate more biologically meaningful variables. These are often used in species distribution modeling and related ecological modeling techniques. The bioclimatic variables represent annual trends (e.g., mean annual temperature, annual precipitation) seasonality (e.g., annual range in temperature and precipitation) and extreme or limiting environmental factors (e.g., temperature of the coldest and warmest month, and precipitation of the wet and dry quarters). A quarter is a period of three months (1/4 of the year).\"</i></p><p style='background-attachment:initial; background-clip:initial; background-image:initial; background-origin:initial; background-position:initial; background-repeat:initial; background-size:initial; margin-bottom:0in;'><strong>Time Extent:</strong>&nbsp;averages from 2021-2040, 2041-2060, 2061-2080, 2081-2100<br /><strong>Units:</strong>&nbsp;mm<br /><strong>Cell Size:</strong> 2.5 minutes (~5 km)<br /><strong>Source Type:</strong> Stretched<br /><strong>Pixel Type:</strong> 32 Bit Float<br /><strong>Data Projection:</strong>  GCS WGS84<br /><strong>Mosaic Projection: </strong> GCS WGS84<br /><strong>Extent: </strong> Global<br /><strong>Source: </strong> <a target='_blank' href='https://worldclim.org/data/cmip6/cmip6_clim2.5m.html' rel='nofollow ugc noopener noreferrer'>WorldClim CMIP6 Bioclimate</a><br />&nbsp;</p><p><strong>Climate Scenarios</strong></p><p>The CMIP6 climate experiments use&nbsp;<a target='_blank' href='https://www.carbonbrief.org/explainer-how-shared-socioeconomic-pathways-explore-future-climate-change/' rel='nofollow ugc noopener noreferrer'>Shared Socioeconomic Pathways (SSPs)</a>&nbsp;to model future climate scenarios. Each SSP pairs a human/community behavior component with the traditional RCP greenhouse gas forcing from the previous CMIP5. Three SSPs were chosen by Esri to be included in the service based on user requests: SSP2 4.5, SSP3 7.0 and SSP5 8.5.</p><figure><table style='background-color:rgb(248, 249, 250); border-collapse:collapse;' width='850' cellpadding='0' cellspacing='0' border='1'><tbody><tr><td style='background-color:rgb(234, 236, 240); border:1pt solid rgb(162, 169, 177); padding:2.4pt 4.8pt;'><p style='margin:12pt 0in; text-align:center;'><span style='color:rgb(32,33,34); font-family:Arial, sans-serif; font-size:10.5pt;'><strong>SSP</strong></span></p></td><td style='background-color:rgb(234, 236, 240); border-bottom:1pt solid rgb(162, 169, 177); border-image:initial; border-left-style:none; border-right:1pt solid rgb(162, 169, 177); border-top:1pt solid rgb(162, 169, 177); padding:2.4pt 4.8pt;'><p style='margin:12pt 0in; text-align:center;'><span style='color:rgb(32,33,34); font-family:Arial, sans-serif; font-size:10.5pt;'><strong>Scenario</strong></span></p></td><td style='background-color:rgb(234, 236, 240); border-bottom:1pt solid rgb(162, 169, 177); border-image:initial; border-left-style:none; border-right:1pt solid rgb(162, 169, 177); border-top:1pt solid rgb(162, 169, 177); padding:2.4pt 4.8pt;'><p style='margin:12pt 0in; text-align:center;'><span style='color:rgb(32,33,34); font-family:Arial, sans-serif; font-size:10.5pt;'><strong>Estimated warming</strong></span><br /><span style='color:rgb(32,33,34); font-family:Arial, sans-serif; font-size:10.5pt;'><strong>(2041–2060)</strong></span></p></td><td style='background-color:rgb(234, 236, 240); border-bottom:1pt solid rgb(162, 169, 177); border-image:initial; border-left-style:none; border-right:1pt solid rgb(162, 169, 177); border-top:1pt solid rgb(162, 169, 177); padding:2.4pt 4.8pt;'><p style='margin:12pt 0in; text-align:center;'><span style='color:rgb(32,33,34); font-family:Arial, sans-serif; font-size:10.5pt;'><strong>Estimated warming</strong></span><br /><span style='color:rgb(32,33,34); font-family:Arial, sans-serif; font-size:10.5pt;'><strong>(2081–2100)</strong></span></p></td><td style='background-color:rgb(234, 236, 240); border-bottom:1pt solid rgb(162, 169, 177); border-image:initial; border-left-style:none; border-right:1pt solid rgb(162, 169, 177); border-top:1pt solid rgb(162, 169, 177); padding:2.4pt 4.8pt;'><p style='margin:12pt 0in; text-align:center;'><span style='color:rgb(32,33,34); font-family:Arial, sans-serif; font-size:10.5pt;'><strong>Very likely range in °C</strong></span><br /><span style='color:rgb(32,33,34); font-family:Arial, sans-serif; font-size:10.5pt;'><strong>(2081–2100)</strong></span></p></td></tr><tr><td style='border-bottom:1pt solid rgb(162, 169, 177); border-image:initial; border-left:1pt solid rgb(162, 169, 177); border-right:1pt solid rgb(162, 169, 177); border-top-style:none; padding:2.4pt 4.8pt;'><p style='margin:12pt 0in; text-align:center;'><span style='color:rgb(32,33,34); font-family:Arial, sans-serif; font-size:10.5pt;'>SSP2-4.5</span></p></td><td style='border-bottom:1pt solid rgb(162, 169, 177); border-left-style:none; border-right:1pt solid rgb(162, 169, 177); border-top-style:none; padding:2.4pt 4.8pt;'><p style='margin:12pt 0in; text-align:center;'><span style='color:rgb(32,33,34); font-family:Arial, sans-serif; font-size:10.5pt;'>intermediate GHG emissions:</span><br /><span style='color:rgb(32,33,34); font-family:Arial, sans-serif; font-size:10.5pt;'>CO</span><span style='color:rgb(32,33,34); font-family:Arial, sans-serif; font-size:8.5pt;'><sub>2</sub></span><span style='color:rgb(32,33,34); font-family:Arial, sans-serif; font-size:10.5pt;'>&nbsp;emissions around current levels until 2050, then falling but not reaching net zero by 2100</span></p></td><td style='border-bottom:1pt solid rgb(162, 169, 177); border-left-style:none; border-right:1pt solid rgb(162, 169, 177); border-top-style:none; padding:2.4pt 4.8pt;'><p style='margin:12pt 0in; text-align:center;'><span style='color:rgb(32,33,34); font-family:Arial, sans-serif; font-size:10.5pt;'>2.0 °C</span></p></td><td style='border-bottom:1pt solid rgb(162, 169, 177); border-left-style:none; border-right:1pt solid rgb(162, 169, 177); border-top-style:none; padding:2.4pt 4.8pt;'><p style='margin:12pt 0in; text-align:center;'><span style='color:rgb(32,33,34); font-family:Arial, sans-serif; font-size:10.5pt;'>2.7 °C</span></p></td><td style='border-bottom:1pt solid rgb(162, 169, 177); border-left-style:none; border-right:1pt solid rgb(162, 169, 177); border-top-style:none; padding:2.4pt 4.8pt;'><p style='margin:12pt 0in; text-align:center;'><span style='color:rgb(32,33,34); font-family:Arial, sans-serif; font-size:10.5pt;'>2.1 – 3.5</span></p></td></tr><tr><td style='border-bottom:1pt solid rgb(162, 169, 177); border-image:initial; border-left:1pt solid rgb(162, 169, 177); border-right:1pt solid rgb(162, 169, 177); border-top-style:none; padding:2.4pt 4.8pt;'><p style='margin:12pt 0in; text-align:center;'><span style='color:rgb(32,33,34); font-family:Arial, sans-serif; font-size:10.5pt;'>SSP3-7.0</span></p></td><td style='border-bottom:1pt solid rgb(162, 169, 177); border-left-style:none; border-right:1pt solid rgb(162, 169, 177); border-top-style:none; padding:2.4pt 4.8pt;'><p style='margin:12pt 0in; text-align:center;'><span style='color:rgb(32,33,34); font-family:Arial, sans-serif; font-size:10.5pt;'>high GHG emissions:</span><br /><span style='color:rgb(32,33,34); font-family:Arial, sans-serif; font-size:10.5pt;'>CO</span><span style='color:rgb(32,33,34); font-family:Arial, sans-serif; font-size:8.5pt;'><sub>2</sub></span><span style='color:rgb(32,33,34); font-family:Arial, sans-serif; font-size:10.5pt;'>&nbsp;emissions double by 2100</span></p></td><td style='border-bottom:1pt solid rgb(162, 169, 177); border-left-style:none; border-right:1pt solid rgb(162, 169, 177); border-top-style:none; padding:2.4pt 4.8pt;'><p style='margin:12pt 0in; text-align:center;'><span style='color:rgb(32,33,34); font-family:Arial, sans-serif; font-size:10.5pt;'>2.1 °C</span></p></td><td style='border-bottom:1pt solid rgb(162, 169, 177); border-left-style:none; border-right:1pt solid rgb(162, 169, 177); border-top-style:none; padding:2.4pt 4.8pt;'><p style='margin:12pt 0in; text-align:center;'><span style='color:rgb(32,33,34); font-family:Arial, sans-serif; font-size:10.5pt;'>3.6 °C</span></p></td><td style='border-bottom:1pt solid rgb(162, 169, 177); border-left-style:none; border-right:1pt solid rgb(162, 169, 177); border-top-style:none; padding:2.4pt 4.8pt;'><p style='margin:12pt 0in; text-align:center;'><span style='color:rgb(32,33,34); font-family:Arial, sans-serif; font-size:10.5pt;'>2.8 – 4.6</span></p></td></tr><tr><td style='border-bottom:1pt solid rgb(162, 169, 177); border-image:initial; border-left:1pt solid rgb(162, 169, 177); border-right:1pt solid rgb(162, 169, 177); border-top-style:none; padding:2.4pt 4.8pt;'><p style='margin:12pt 0in; text-align:center;'><span style='color:rgb(32,33,34); font-family:Arial, sans-serif; font-size:10.5pt;'>SSP5-8.5</span></p></td><td style='border-bottom:1pt solid rgb(162, 169, 177); border-left-style:none; border-right:1pt solid rgb(162, 169, 177); border-top-style:none; padding:2.4pt 4.8pt;'><p style='margin:12pt 0in; text-align:center;'><span style='color:rgb(32,33,34); font-family:Arial, sans-serif; font-size:10.5pt;'>very high GHG emissions:</span><br /><span style='color:rgb(32,33,34); font-family:Arial, sans-serif; font-size:10.5pt;'>CO</span><span style='color:rgb(32,33,34); font-family:Arial, sans-serif; font-size:8.5pt;'><sub>2</sub></span><span style='color:rgb(32,33,34); font-family:Arial, sans-serif; font-size:10.5pt;'>&nbsp;emissions triple by 2075</span></p></td><td style='border-bottom:1pt solid rgb(162, 169, 177); border-left-style:none; border-right:1pt solid rgb(162, 169, 177); border-top-style:none; padding:2.4pt 4.8pt;'><p style='margin:12pt 0in; text-align:center;'><span style='color:rgb(32,33,34); font-family:Arial, sans-serif; font-size:10.5pt;'>2.4 °C</span></p></td><td style='border-bottom:1pt solid rgb(162, 169, 177); border-left-style:none; border-right:1pt solid rgb(162, 169, 177); border-top-style:none; padding:2.4pt 4.8pt;'><p style='margin:12pt 0in; text-align:center;'><span style='color:rgb(32,33,34); font-family:Arial, sans-serif; font-size:10.5pt;'>4.4 °C</span></p></td><td style='border-bottom:1pt solid rgb(162, 169, 177); border-left-style:none; border-right:1pt solid rgb(162, 169, 177); border-top-style:none; padding:2.4pt 4.8pt;'><p style='margin:12pt 0in; text-align:center;'><span style='color:rgb(32,33,34); font-family:Arial, sans-serif; font-size:10.5pt;'>3.3 – 5.7</span></p></td></tr></tbody></table></figure><p>While the 8.5 scenario is no longer generally considered likely, SSP3 7.0 has been included and is considered the high end of possibilities. SSP5 8.5 has been retained since many organizations report to this threshold. The warming associated with SSP2 4.5 is equivalent to the global targets set at the 2021 United Nations COP26 meetings in Glasgow.&nbsp;</p><p><strong>Processing the Climate Data</strong></p><p>WorldClim provides 20-year averaged outputs for the various SSPs from 24 global climate models. A selection of 13 models were averaged for each variable and time based on&nbsp;<a target='_blank' href='https://rmets.onlinelibrary.wiley.com/doi/full/10.1002/joc.7566' rel='nofollow ugc noopener noreferrer'>Mahony et al 2022</a>. These models included ACCESS-ESM1-5, BCC-CSM2-MR, CanESM5, CNRM-ESM2-1, EC-Earth3-Veg, GFDL-ESM4, GISS-E2-1-G, INM-CM5-0,&nbsp;&nbsp;IPSL-CM6A-LR, MIROC6, MPI-ESM1-2-HR, MRI-ESM2-0, UKESM1-0-LL. GFDL-ESM4 was not available for SSP2 4.5 or SSP5 8.5.&nbsp;</p><p><strong>Accessing the Multidimensional Information</strong></p><p>The time and SSP scenario are built into the layer using a multidimensional raster. Enable the time slider to move across the 20-year average periods. In ArcGIS Online and Pro, use the Multidimensional Filter to select the SSP (SSP2 4.5 is the default).&nbsp;<br /><br /><strong>What can you do with this layer?</strong></p><p>These multidimensional imagery tiles support analysis using ArcGIS Online or Pro. Use the&nbsp;<a target='_blank' href='https://arcgis.com/home/item.html?id=e56c9cb70aa949adb791c4311003d9ae' rel='nofollow ugc noopener noreferrer'>Bioclimate Baseline layer</a>&nbsp;to see the difference in pixels and calculate change from the historic period into the future. Use the&nbsp;<a target='_blank' href='https://pro.arcgis.com/en/pro-app/latest/help/data/imagery/an-overview-of-multidimensional-raster-data.htm' rel='nofollow ugc noopener noreferrer'>Multidimensional&nbsp;</a>tab in ArcGIS Pro to access a variety of useful tools. Each layer or variable can be styled using the Image Display options.&nbsp;</p><p><strong>Known Quality Issues</strong></p><p>Each model is downscaled from ~100km resolution to ~5km resolution by WorldClim. Some artifacts are inevitable, especially at a global scale. Some variables have distinct transitions, especially in Greenland. Also, SSP2 4.5 has missing data for several variables in Antarctica.</p><p><strong>Related Layers</strong></p><p><a target='_blank' href='https://arcgis.com/home/item.html?id=fdaa1b7912e440efb9e29cf5d6156bb0' rel='nofollow ugc noopener noreferrer'>Bioclimate 1&nbsp;&nbsp;Annual Mean Temperature</a><br /><a target='_blank' href='https://arcgis.com/home/item.html?id=8012b34e8c854d6fbcfe4eab437ea397' rel='nofollow ugc noopener noreferrer'>Bioclimate 2&nbsp;&nbsp;Mean Diurnal Range</a><br /><a target='_blank' href='https://arcgis.com/home/item.html?id=ef9f5d6a16ca41ada0c0075a8da46d48' rel='nofollow ugc noopener noreferrer'>Bioclimate 3&nbsp;&nbsp;Isothermality</a><br /><a target='_blank' href='https://arcgis.com/home/item.html?id=64799fea8774463aad909020b6590dc8' rel='nofollow ugc noopener noreferrer'>Bioclimate 4&nbsp;&nbsp;Temperature Seasonality</a><br /><a target='_blank' href='https://arcgis.com/home/item.html?id=8433250e0a4148f5a3889c66e78abdf1' rel='nofollow ugc noopener noreferrer'>Bioclimate 5&nbsp;&nbsp;Max Temperature of Warmest Month</a><br /><a target='_blank' href='https://arcgis.com/home/item.html?id=c531d32ab5d746b88a884b6e54f3216e' rel='nofollow ugc noopener noreferrer'>Bioclimate 6&nbsp;&nbsp;Min Temperature Of Coldest Month</a><br /><a target='_blank' href='https://arcgis.com/home/item.html?id=808cfb3ab1614f8ab7e364de737e9e98' rel='nofollow ugc noopener noreferrer'>Bioclimate 7&nbsp;&nbsp;Temperature Annual Range</a><br /><a target='_blank' href='https://arcgis.com/home/item.html?id=b5990aa16fd94bb691a09449716ed7e5' rel='nofollow ugc noopener noreferrer'>Bioclimate 8&nbsp;&nbsp;Mean Temperature Of Wettest Quarter</a><br /><a target='_blank' href='https://arcgis.com/home/item.html?id=231770161a46467e8de9fdd9fd92dad7' rel='nofollow ugc noopener noreferrer'>Bioclimate 9&nbsp;&nbsp;Mean Temperature Of Driest Quarter</a><br /><a target='_blank' href='https://arcgis.com/home/item.html?id=3b98ddf1c78d4f0c88bd297f85847c68' rel='nofollow ugc noopener noreferrer'>Bioclimate 10&nbsp;&nbsp;Mean Temperature Of Warmest Quarter</a><br /><a target='_blank' href='https://arcgis.com/home/item.html?id=1a96d928c93c4e8fbc6a2391afd1da2f' rel='nofollow ugc noopener noreferrer'>Bioclimate 11&nbsp;&nbsp;Mean Temperature Of Coldest Quarter</a><br /><a target='_blank' href='https://arcgis.com/home/item.html?id=7bc0b8c75b0244b7a8128ae1f398bfc0' rel='nofollow ugc noopener noreferrer'>Bioclimate 12&nbsp;&nbsp;Annual Precipitation</a><br /><a target='_blank' href='https://arcgis.com/home/item.html?id=36fde801c8124f93b46b727b9873c993' rel='nofollow ugc noopener noreferrer'>Bioclimate 13&nbsp;&nbsp;Precipitation Of Wettest Month</a><br /><a target='_blank' href='https://arcgis.com/home/item.html?id=e26b01e4fa0a4aec9c5db991467b31a7' rel='nofollow ugc noopener noreferrer'>Bioclimate 14&nbsp;&nbsp;Precipitation Of Driest Month</a><br /><a target='_blank' href='https://arcgis.com/home/item.html?id=33558b5fef8642338f33918d498f41cf' rel='nofollow ugc noopener noreferrer'>Bioclimate 15&nbsp;&nbsp;Precipitation Seasonality</a><br /><a target='_blank' href='https://arcgis.com/home/item.html?id=1324c4e0c86a40e9b7529e91c6bdf220' rel='nofollow ugc noopener noreferrer'>Bioclimate 16&nbsp;&nbsp;Precipitation Of Wettest Quarter</a><br /><a target='_blank' href='https://arcgis.com/home/item.html?id=86fe2a87fe9144f9a5c330a3b5890df0' rel='nofollow ugc noopener noreferrer'>Bioclimate 17&nbsp;&nbsp;Precipitation Of Driest Quarter</a><br /><a target='_blank' href='https://arcgis.com/home/item.html?id=eb8227050ac24b3bb4a47abb924fbc56' rel='nofollow ugc noopener noreferrer'>Bioclimate 18&nbsp;&nbsp;Precipitation Of Warmest Quarter</a><br /><a target='_blank' href='https://arcgis.com/home/item.html?id=ec067623611d40d086193b21a3a4fce1' rel='nofollow ugc noopener noreferrer'>Bioclimate 19&nbsp;&nbsp;Precipitation Of Coldest Quarter</a><br /><a target='_blank' href='https://arcgis.com/home/item.html?id=e56c9cb70aa949adb791c4311003d9ae' rel='nofollow ugc noopener noreferrer'>Bioclimate Baseline 1970-2000</a></p>",
			"keyword": [
				"esri_environment",
				"retiring-2026-12"
			],
			"issued": "2022-05-12T14:26:37.000Z",
			"modified": "2026-05-13T19:42:36.000Z",
			"publisher": {
				"name": "Esri"
			},
			"contactPoint": {
				"@type": "vcard:Contact",
				"fn": "esri_environment",
				"hasEmail": "{{orgContactEmail}}"
			},
			"accessLevel": "public",
			"spatial": "-180.0000,-90.0000,180.0000,90.0000",
			"license": "<p><img src='https://downloads.esri.com/blogs/arcgisonline/esrilogo_new.png' width='113' height='43' /> This work is licensed under the Esri Master License Agreement.&nbsp;</p><p><a target='_blank' href='https://goto.arcgis.com/termsofuse/viewsummary' rel='nofollow ugc noopener noreferrer'>View Summary</a> | <a target='_blank' href='https://goto.arcgis.com/termsofuse/viewtermsofuse' rel='nofollow ugc noopener noreferrer'>View Terms of Use</a></p>",
			"distribution": [
				{
					"@type": "dcat:Distribution",
					"title": "ArcGIS Hub Dataset",
					"format": "Web Page",
					"mediaType": "text/html",
					"accessURL": "https://www.pacificgeoportal.com/content/esri::bioclimate-projections-18-precipitation-of-warmest-quarter"
				},
				{
					"@type": "dcat:Distribution",
					"title": "ArcGIS GeoService",
					"format": "ArcGIS GeoServices REST API",
					"mediaType": "application/json",
					"accessURL": "https://tiledimageservices.arcgis.com/P3ePLMYs2RVChkJx/arcgis/rest/services/Bioclimate_Projections__Precipitation_of_Warmest_Quarter/ImageServer"
				}
			],
			"theme": [
				"geospatial"
			]
		},
		{
			"@type": "dcat:Dataset",
			"identifier": "https://www.arcgis.com/home/item.html?id=e26b01e4fa0a4aec9c5db991467b31a7",
			"landingPage": "https://www.pacificgeoportal.com/content/esri::bioclimate-projections-14-precipitation-of-driest-month",
			"title": "Bioclimate Projections: (14) Precipitation of Driest Month",
			"description": "<p><span style='color:#dc143c;'><strong>Retirement Notice:</strong></span><strong> This </strong><a target='_blank' href='https://goto.arcgis.com/termsofuse/beta' rel='nofollow ugc noopener noreferrer'><strong>beta</strong></a><strong> item will be retired in December 2026. A</strong><a target='_blank' href='https://www.arcgis.com/home/item.html?id=2565d7724b0a4c7c82bda8b09c1cc0ac' rel='nofollow ugc noopener noreferrer'><strong> new version of this item</strong></a><strong>&nbsp;is available for your use. </strong>Esri recommends updating your maps and apps to use the new version.&nbsp;</p><div><p><span style='background-attachment:initial; background-clip:initial; background-image:initial; background-origin:initial; background-position:initial; background-repeat:initial; background-size:initial;'>This layer represents CMIP6 future projections of total precipitation during the driest month of the year. This layer can be used to compare with recent climate histories to better understand the potential impacts of future climate change.</span></p><p><a target='_blank' href='https://worldclim.org/' rel='nofollow ugc noopener noreferrer'><span style='background-attachment:initial; background-clip:initial; background-image:initial; background-origin:initial; background-position:initial; background-repeat:initial; background-size:initial;'>WorldClim</span></a><span style='background-attachment:initial; background-clip:initial; background-image:initial; background-origin:initial; background-position:initial; background-repeat:initial; background-size:initial;'>&nbsp;produced this projection as part of a series of&nbsp;</span><a target='_blank' href='https://pubs.usgs.gov/ds/691/ds691.pdf' rel='nofollow ugc noopener noreferrer'><span style='background-attachment:initial; background-clip:initial; background-image:initial; background-origin:initial; background-position:initial; background-repeat:initial; background-size:initial;'>19 bioclimate variables identified by the USGS</span></a><span style='background-attachment:initial; background-clip:initial; background-image:initial; background-origin:initial; background-position:initial; background-repeat:initial; background-size:initial;'>&nbsp;and provides this description:</span><br /><br /><i>\"Bioclimatic variables are derived from the monthly temperature and rainfall values in order to generate more biologically meaningful variables. These are often used in species distribution modeling and related ecological modeling techniques. The bioclimatic variables represent annual trends (e.g., mean annual temperature, annual precipitation) seasonality (e.g., annual range in temperature and precipitation) and extreme or limiting environmental factors (e.g., temperature of the coldest and warmest month, and precipitation of the wet and dry quarters). A quarter is a period of three months (1/4 of the year).\"</i></p><p style='background-attachment:initial; background-clip:initial; background-image:initial; background-origin:initial; background-position:initial; background-repeat:initial; background-size:initial; margin-bottom:0in;'><strong>Time Extent:</strong>&nbsp;averages from 2021-2040, 2041-2060, 2061-2080, 2081-2100<br /><strong>Units:</strong>&nbsp;mm<br /><strong>Cell Size:</strong> 2.5 minutes (~5 km)<br /><strong>Source Type:</strong> Stretched<br /><strong>Pixel Type:</strong> 32 Bit Float<br /><strong>Data Projection:</strong> GCS WGS84<br /><strong>Mosaic Projection:</strong> GCS WGS84<br /><strong>Extent:</strong> Global<br /><strong>Source:</strong> <a target='_blank' href='https://worldclim.org/data/cmip6/cmip6_clim2.5m.html' rel='nofollow ugc noopener noreferrer'>WorldClim CMIP6 Bioclimate</a></p><p>&nbsp;</p><p><strong>Climate Scenarios</strong></p><p>The CMIP6 climate experiments use&nbsp;<a target='_blank' href='https://www.carbonbrief.org/explainer-how-shared-socioeconomic-pathways-explore-future-climate-change/' rel='nofollow ugc noopener noreferrer'>Shared Socioeconomic Pathways (SSPs)</a>&nbsp;to model future climate scenarios. Each SSP pairs a human/community behavior component with the traditional RCP greenhouse gas forcing from the previous CMIP5. Three SSPs were chosen by Esri to be included in the service based on user requests: SSP2 4.5, SSP3 7.0 and SSP5 8.5.</p><figure><table style='background-color:rgb(248, 249, 250); border-collapse:collapse;' width='850' cellpadding='0' cellspacing='0' border='1'><tbody><tr><td style='background-color:rgb(234, 236, 240); border:1pt solid rgb(162, 169, 177); padding:2.4pt 4.8pt;'><p style='margin:12pt 0in; text-align:center;'><span style='color:rgb(32,33,34); font-family:Arial, sans-serif; font-size:10.5pt;'><strong>SSP</strong></span></p></td><td style='background-color:rgb(234, 236, 240); border-bottom:1pt solid rgb(162, 169, 177); border-image:initial; border-left-style:none; border-right:1pt solid rgb(162, 169, 177); border-top:1pt solid rgb(162, 169, 177); padding:2.4pt 4.8pt;'><p style='margin:12pt 0in; text-align:center;'><span style='color:rgb(32,33,34); font-family:Arial, sans-serif; font-size:10.5pt;'><strong>Scenario</strong></span></p></td><td style='background-color:rgb(234, 236, 240); border-bottom:1pt solid rgb(162, 169, 177); border-image:initial; border-left-style:none; border-right:1pt solid rgb(162, 169, 177); border-top:1pt solid rgb(162, 169, 177); padding:2.4pt 4.8pt;'><p style='margin:12pt 0in; text-align:center;'><span style='color:rgb(32,33,34); font-family:Arial, sans-serif; font-size:10.5pt;'><strong>Estimated warming</strong></span><br /><span style='color:rgb(32,33,34); font-family:Arial, sans-serif; font-size:10.5pt;'><strong>(2041–2060)</strong></span></p></td><td style='background-color:rgb(234, 236, 240); border-bottom:1pt solid rgb(162, 169, 177); border-image:initial; border-left-style:none; border-right:1pt solid rgb(162, 169, 177); border-top:1pt solid rgb(162, 169, 177); padding:2.4pt 4.8pt;'><p style='margin:12pt 0in; text-align:center;'><span style='color:rgb(32,33,34); font-family:Arial, sans-serif; font-size:10.5pt;'><strong>Estimated warming</strong></span><br /><span style='color:rgb(32,33,34); font-family:Arial, sans-serif; font-size:10.5pt;'><strong>(2081–2100)</strong></span></p></td><td style='background-color:rgb(234, 236, 240); border-bottom:1pt solid rgb(162, 169, 177); border-image:initial; border-left-style:none; border-right:1pt solid rgb(162, 169, 177); border-top:1pt solid rgb(162, 169, 177); padding:2.4pt 4.8pt;'><p style='margin:12pt 0in; text-align:center;'><span style='color:rgb(32,33,34); font-family:Arial, sans-serif; font-size:10.5pt;'><strong>Very likely range in °C</strong></span><br /><span style='color:rgb(32,33,34); font-family:Arial, sans-serif; font-size:10.5pt;'><strong>(2081–2100)</strong></span></p></td></tr><tr><td style='border-bottom:1pt solid rgb(162, 169, 177); border-image:initial; border-left:1pt solid rgb(162, 169, 177); border-right:1pt solid rgb(162, 169, 177); border-top-style:none; padding:2.4pt 4.8pt;'><p style='margin:12pt 0in; text-align:center;'><span style='color:rgb(32,33,34); font-family:Arial, sans-serif; font-size:10.5pt;'>SSP2-4.5</span></p></td><td style='border-bottom:1pt solid rgb(162, 169, 177); border-left-style:none; border-right:1pt solid rgb(162, 169, 177); border-top-style:none; padding:2.4pt 4.8pt;'><p style='margin:12pt 0in; text-align:center;'><span style='color:rgb(32,33,34); font-family:Arial, sans-serif; font-size:10.5pt;'>intermediate GHG emissions:</span><br /><span style='color:rgb(32,33,34); font-family:Arial, sans-serif; font-size:10.5pt;'>CO</span><span style='color:rgb(32,33,34); font-family:Arial, sans-serif; font-size:8.5pt;'><sub>2</sub></span><span style='color:rgb(32,33,34); font-family:Arial, sans-serif; font-size:10.5pt;'>&nbsp;emissions around current levels until 2050, then falling but not reaching net zero by 2100</span></p></td><td style='border-bottom:1pt solid rgb(162, 169, 177); border-left-style:none; border-right:1pt solid rgb(162, 169, 177); border-top-style:none; padding:2.4pt 4.8pt;'><p style='margin:12pt 0in; text-align:center;'><span style='color:rgb(32,33,34); font-family:Arial, sans-serif; font-size:10.5pt;'>2.0 °C</span></p></td><td style='border-bottom:1pt solid rgb(162, 169, 177); border-left-style:none; border-right:1pt solid rgb(162, 169, 177); border-top-style:none; padding:2.4pt 4.8pt;'><p style='margin:12pt 0in; text-align:center;'><span style='color:rgb(32,33,34); font-family:Arial, sans-serif; font-size:10.5pt;'>2.7 °C</span></p></td><td style='border-bottom:1pt solid rgb(162, 169, 177); border-left-style:none; border-right:1pt solid rgb(162, 169, 177); border-top-style:none; padding:2.4pt 4.8pt;'><p style='margin:12pt 0in; text-align:center;'><span style='color:rgb(32,33,34); font-family:Arial, sans-serif; font-size:10.5pt;'>2.1 – 3.5</span></p></td></tr><tr><td style='border-bottom:1pt solid rgb(162, 169, 177); border-image:initial; border-left:1pt solid rgb(162, 169, 177); border-right:1pt solid rgb(162, 169, 177); border-top-style:none; padding:2.4pt 4.8pt;'><p style='margin:12pt 0in; text-align:center;'><span style='color:rgb(32,33,34); font-family:Arial, sans-serif; font-size:10.5pt;'>SSP3-7.0</span></p></td><td style='border-bottom:1pt solid rgb(162, 169, 177); border-left-style:none; border-right:1pt solid rgb(162, 169, 177); border-top-style:none; padding:2.4pt 4.8pt;'><p style='margin:12pt 0in; text-align:center;'><span style='color:rgb(32,33,34); font-family:Arial, sans-serif; font-size:10.5pt;'>high GHG emissions:</span><br /><span style='color:rgb(32,33,34); font-family:Arial, sans-serif; font-size:10.5pt;'>CO</span><span style='color:rgb(32,33,34); font-family:Arial, sans-serif; font-size:8.5pt;'><sub>2</sub></span><span style='color:rgb(32,33,34); font-family:Arial, sans-serif; font-size:10.5pt;'>&nbsp;emissions double by 2100</span></p></td><td style='border-bottom:1pt solid rgb(162, 169, 177); border-left-style:none; border-right:1pt solid rgb(162, 169, 177); border-top-style:none; padding:2.4pt 4.8pt;'><p style='margin:12pt 0in; text-align:center;'><span style='color:rgb(32,33,34); font-family:Arial, sans-serif; font-size:10.5pt;'>2.1 °C</span></p></td><td style='border-bottom:1pt solid rgb(162, 169, 177); border-left-style:none; border-right:1pt solid rgb(162, 169, 177); border-top-style:none; padding:2.4pt 4.8pt;'><p style='margin:12pt 0in; text-align:center;'><span style='color:rgb(32,33,34); font-family:Arial, sans-serif; font-size:10.5pt;'>3.6 °C</span></p></td><td style='border-bottom:1pt solid rgb(162, 169, 177); border-left-style:none; border-right:1pt solid rgb(162, 169, 177); border-top-style:none; padding:2.4pt 4.8pt;'><p style='margin:12pt 0in; text-align:center;'><span style='color:rgb(32,33,34); font-family:Arial, sans-serif; font-size:10.5pt;'>2.8 – 4.6</span></p></td></tr><tr><td style='border-bottom:1pt solid rgb(162, 169, 177); border-image:initial; border-left:1pt solid rgb(162, 169, 177); border-right:1pt solid rgb(162, 169, 177); border-top-style:none; padding:2.4pt 4.8pt;'><p style='margin:12pt 0in; text-align:center;'><span style='color:rgb(32,33,34); font-family:Arial, sans-serif; font-size:10.5pt;'>SSP5-8.5</span></p></td><td style='border-bottom:1pt solid rgb(162, 169, 177); border-left-style:none; border-right:1pt solid rgb(162, 169, 177); border-top-style:none; padding:2.4pt 4.8pt;'><p style='margin:12pt 0in; text-align:center;'><span style='color:rgb(32,33,34); font-family:Arial, sans-serif; font-size:10.5pt;'>very high GHG emissions:</span><br /><span style='color:rgb(32,33,34); font-family:Arial, sans-serif; font-size:10.5pt;'>CO</span><span style='color:rgb(32,33,34); font-family:Arial, sans-serif; font-size:8.5pt;'><sub>2</sub></span><span style='color:rgb(32,33,34); font-family:Arial, sans-serif; font-size:10.5pt;'>&nbsp;emissions triple by 2075</span></p></td><td style='border-bottom:1pt solid rgb(162, 169, 177); border-left-style:none; border-right:1pt solid rgb(162, 169, 177); border-top-style:none; padding:2.4pt 4.8pt;'><p style='margin:12pt 0in; text-align:center;'><span style='color:rgb(32,33,34); font-family:Arial, sans-serif; font-size:10.5pt;'>2.4 °C</span></p></td><td style='border-bottom:1pt solid rgb(162, 169, 177); border-left-style:none; border-right:1pt solid rgb(162, 169, 177); border-top-style:none; padding:2.4pt 4.8pt;'><p style='margin:12pt 0in; text-align:center;'><span style='color:rgb(32,33,34); font-family:Arial, sans-serif; font-size:10.5pt;'>4.4 °C</span></p></td><td style='border-bottom:1pt solid rgb(162, 169, 177); border-left-style:none; border-right:1pt solid rgb(162, 169, 177); border-top-style:none; padding:2.4pt 4.8pt;'><p style='margin:12pt 0in; text-align:center;'><span style='color:rgb(32,33,34); font-family:Arial, sans-serif; font-size:10.5pt;'>3.3 – 5.7</span></p></td></tr></tbody></table></figure><p>While the 8.5 scenario is no longer generally considered likely, SSP3 7.0 has been included and is considered the high end of possibilities. SSP5 8.5 has been retained since many organizations report to this threshold. The warming associated with SSP2 4.5 is equivalent to the global targets set at the 2021 United Nations COP26 meetings in Glasgow.&nbsp;</p><p><strong>Processing the Climate Data</strong></p><p>WorldClim provides 20-year averaged outputs for the various SSPs from 24 global climate models. A selection of 13 models were averaged for each variable and time based on&nbsp;<a target='_blank' href='https://rmets.onlinelibrary.wiley.com/doi/full/10.1002/joc.7566' rel='nofollow ugc noopener noreferrer'>Mahony et al 2022</a>. These models included ACCESS-ESM1-5, BCC-CSM2-MR, CanESM5, CNRM-ESM2-1, EC-Earth3-Veg, GFDL-ESM4, GISS-E2-1-G, INM-CM5-0,&nbsp;&nbsp;IPSL-CM6A-LR, MIROC6, MPI-ESM1-2-HR, MRI-ESM2-0, UKESM1-0-LL. GFDL-ESM4 was not available for SSP2 4.5 or SSP5 8.5.&nbsp;</p><p><strong>Accessing the Multidimensional Information</strong></p><p>The time and SSP scenario are built into the layer using a multidimensional raster. Enable the time slider to move across the 20-year average periods. In ArcGIS Online and Pro, use the Multidimensional Filter to select the SSP (SSP2 4.5 is the default).&nbsp;<br /><br /><strong>What can you do with this layer?</strong></p><p>These multidimensional imagery tiles support analysis using ArcGIS Online or Pro. Use the&nbsp;<a target='_blank' href='https://arcgis.com/home/item.html?id=e56c9cb70aa949adb791c4311003d9ae' rel='nofollow ugc noopener noreferrer'>Bioclimate Baseline layer</a>&nbsp;to see the difference in pixels and calculate change from the historic period into the future. Use the&nbsp;<a target='_blank' href='https://pro.arcgis.com/en/pro-app/latest/help/data/imagery/an-overview-of-multidimensional-raster-data.htm' rel='nofollow ugc noopener noreferrer'>Multidimensional&nbsp;</a>tab in ArcGIS Pro to access a variety of useful tools. Each layer or variable can be styled using the Image Display options.&nbsp;</p><p><strong>Known Quality Issues</strong></p><p>Each model is downscaled from ~100km resolution to ~5km resolution by WorldClim. Some artifacts are inevitable, especially at a global scale. Some variables have distinct transitions, especially in Greenland. Also, SSP2 4.5 has missing data for several variables in Antarctica.<br />&nbsp;</p><p><strong>Related Layers</strong></p><p><a target='_blank' href='https://arcgis.com/home/item.html?id=fdaa1b7912e440efb9e29cf5d6156bb0' rel='nofollow ugc noopener noreferrer'>Bioclimate 1&nbsp;&nbsp;Annual Mean Temperature</a><br /><a target='_blank' href='https://arcgis.com/home/item.html?id=8012b34e8c854d6fbcfe4eab437ea397' rel='nofollow ugc noopener noreferrer'>Bioclimate 2&nbsp;&nbsp;Mean Diurnal Range</a><br /><a target='_blank' href='https://arcgis.com/home/item.html?id=ef9f5d6a16ca41ada0c0075a8da46d48' rel='nofollow ugc noopener noreferrer'>Bioclimate 3&nbsp;&nbsp;Isothermality</a><br /><a target='_blank' href='https://arcgis.com/home/item.html?id=64799fea8774463aad909020b6590dc8' rel='nofollow ugc noopener noreferrer'>Bioclimate 4&nbsp;&nbsp;Temperature Seasonality</a><br /><a target='_blank' href='https://arcgis.com/home/item.html?id=8433250e0a4148f5a3889c66e78abdf1' rel='nofollow ugc noopener noreferrer'>Bioclimate 5&nbsp;&nbsp;Max Temperature of Warmest Month</a><br /><a target='_blank' href='https://arcgis.com/home/item.html?id=c531d32ab5d746b88a884b6e54f3216e' rel='nofollow ugc noopener noreferrer'>Bioclimate 6&nbsp;&nbsp;Min Temperature Of Coldest Month</a><br /><a target='_blank' href='https://arcgis.com/home/item.html?id=808cfb3ab1614f8ab7e364de737e9e98' rel='nofollow ugc noopener noreferrer'>Bioclimate 7&nbsp;&nbsp;Temperature Annual Range</a><br /><a target='_blank' href='https://arcgis.com/home/item.html?id=b5990aa16fd94bb691a09449716ed7e5' rel='nofollow ugc noopener noreferrer'>Bioclimate 8&nbsp;&nbsp;Mean Temperature Of Wettest Quarter</a><br /><a target='_blank' href='https://arcgis.com/home/item.html?id=231770161a46467e8de9fdd9fd92dad7' rel='nofollow ugc noopener noreferrer'>Bioclimate 9&nbsp;&nbsp;Mean Temperature Of Driest Quarter</a><br /><a target='_blank' href='https://arcgis.com/home/item.html?id=3b98ddf1c78d4f0c88bd297f85847c68' rel='nofollow ugc noopener noreferrer'>Bioclimate 10&nbsp;&nbsp;Mean Temperature Of Warmest Quarter</a><br /><a target='_blank' href='https://arcgis.com/home/item.html?id=1a96d928c93c4e8fbc6a2391afd1da2f' rel='nofollow ugc noopener noreferrer'>Bioclimate 11&nbsp;&nbsp;Mean Temperature Of Coldest Quarter</a><br /><a target='_blank' href='https://arcgis.com/home/item.html?id=7bc0b8c75b0244b7a8128ae1f398bfc0' rel='nofollow ugc noopener noreferrer'>Bioclimate 12&nbsp;&nbsp;Annual Precipitation</a><br /><a target='_blank' href='https://arcgis.com/home/item.html?id=36fde801c8124f93b46b727b9873c993' rel='nofollow ugc noopener noreferrer'>Bioclimate 13&nbsp;&nbsp;Precipitation Of Wettest Month</a><br /><a target='_blank' href='https://arcgis.com/home/item.html?id=e26b01e4fa0a4aec9c5db991467b31a7' rel='nofollow ugc noopener noreferrer'>Bioclimate 14&nbsp;&nbsp;Precipitation Of Driest Month</a><br /><a target='_blank' href='https://arcgis.com/home/item.html?id=33558b5fef8642338f33918d498f41cf' rel='nofollow ugc noopener noreferrer'>Bioclimate 15&nbsp;&nbsp;Precipitation Seasonality</a><br /><a target='_blank' href='https://arcgis.com/home/item.html?id=1324c4e0c86a40e9b7529e91c6bdf220' rel='nofollow ugc noopener noreferrer'>Bioclimate 16&nbsp;&nbsp;Precipitation Of Wettest Quarter</a><br /><a target='_blank' href='https://arcgis.com/home/item.html?id=86fe2a87fe9144f9a5c330a3b5890df0' rel='nofollow ugc noopener noreferrer'>Bioclimate 17&nbsp;&nbsp;Precipitation Of Driest Quarter</a><br /><a target='_blank' href='https://arcgis.com/home/item.html?id=eb8227050ac24b3bb4a47abb924fbc56' rel='nofollow ugc noopener noreferrer'>Bioclimate 18&nbsp;&nbsp;Precipitation Of Warmest Quarter</a><br /><a target='_blank' href='https://arcgis.com/home/item.html?id=ec067623611d40d086193b21a3a4fce1' rel='nofollow ugc noopener noreferrer'>Bioclimate 19&nbsp;&nbsp;Precipitation Of Coldest Quarter</a><br /><a target='_blank' href='https://arcgis.com/home/item.html?id=e56c9cb70aa949adb791c4311003d9ae' rel='nofollow ugc noopener noreferrer'>Bioclimate Baseline 1970-2000</a></p></div>",
			"keyword": [
				"esri_environment",
				"retiring-2026-12"
			],
			"issued": "2022-05-12T15:17:03.000Z",
			"modified": "2026-05-13T19:42:04.000Z",
			"publisher": {
				"name": "Esri"
			},
			"contactPoint": {
				"@type": "vcard:Contact",
				"fn": "esri_environment",
				"hasEmail": "{{orgContactEmail}}"
			},
			"accessLevel": "public",
			"spatial": "-180.0000,-90.0000,180.0000,90.0000",
			"license": "<p><img src='https://downloads.esri.com/blogs/arcgisonline/esrilogo_new.png' width='113' height='43' /> This work is licensed under the Esri Master License Agreement.&nbsp;</p><p><a target='_blank' href='https://goto.arcgis.com/termsofuse/viewsummary' rel='nofollow ugc noopener noreferrer'>View Summary</a> | <a target='_blank' href='https://goto.arcgis.com/termsofuse/viewtermsofuse' rel='nofollow ugc noopener noreferrer'>View Terms of Use</a></p>",
			"distribution": [
				{
					"@type": "dcat:Distribution",
					"title": "ArcGIS Hub Dataset",
					"format": "Web Page",
					"mediaType": "text/html",
					"accessURL": "https://www.pacificgeoportal.com/content/esri::bioclimate-projections-14-precipitation-of-driest-month"
				},
				{
					"@type": "dcat:Distribution",
					"title": "ArcGIS GeoService",
					"format": "ArcGIS GeoServices REST API",
					"mediaType": "application/json",
					"accessURL": "https://tiledimageservices.arcgis.com/P3ePLMYs2RVChkJx/arcgis/rest/services/Bioclimate_Projections__Precipitation_of_Driest_Month/ImageServer"
				}
			],
			"theme": [
				"geospatial"
			]
		}
	]
}
